overview of cvd epidemiology helen johansen (plus a cast of thousands) i. what is surveillance?...
TRANSCRIPT

Overview of CVD EpidemiologyHelen Johansen (plus a cast of thousands)
I. What is surveillance?
Where to get Info
Data sources
Type of information
II. What is CVD?
AMI
Heart Failure
Stroke
III.Overview of stats
Mortality
Hospitalization
A bit on CHF
A bit on AMI
IV. Risk factors
Combo
Physical activity
Body weight
Diabetes
High blood pressure
V. Costs of CVD
VI. Future directions

What is surveillance?What is surveillance?
Surveillance is the ongoing collection, analysis, and use of health data for the
planning, implementation, and assessment of disease treatment and control.
Surveillance is the foundation for planning
and supporting prevention strategies

Identify extent of the problemIdentifying differences by gender, age and regionMap emerging patterns and trendsContribute to policy makingMeasure progress in prevention and treatmentMeasuring health care utilization levels
Uses of surveillance dataUses of surveillance data
Improve the health of Canadians
Improve the health of the health care system

Mortality
Rates
PYLL
Prevalence
Incidence
Health care utilization
hospital (days, procedures)
physician claims
drugs
Risk Factors
Costs
Information by person, place and time

Information by person, place and timeMortality
Rates
PYLL
Prevalence
Incidence
Health care utilization
hospital (days, procedures)
physician claims
drugs
Risk Factors
Costs
Analytical: Outcome studies, Clinical trials, Micro-stimulation modelling……

Information by person, place and time
Mortality
Rates
PYLL
Prevalence
Incidence
Health care utilization
hospital (days, procedures)
physician claims
drugs
Risk Factors
Costs
Vital Statistics
Surveys, record linkage
Registries, record linkage
Administrative databases
hospital
physician claims
drugs
Surveys
Aggregate consumption data + Admin data
Lif
e C
ycle
Birth
Risk Factors
Disease - Onset
Disease - Progression
Disease interactions
Disability
Death
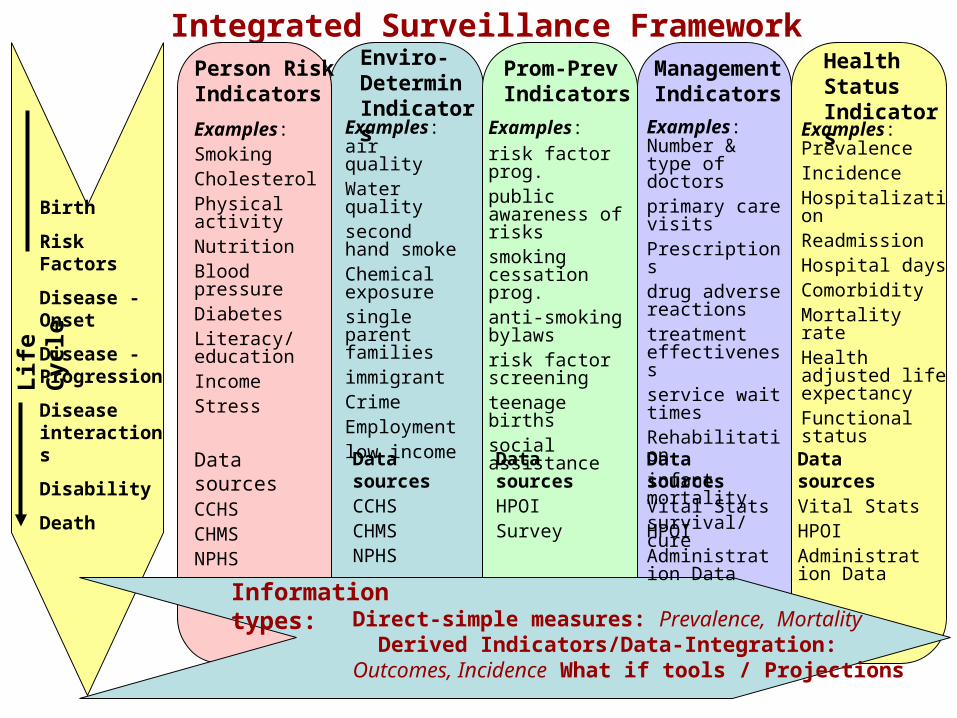
Integrated Surveillance FrameworkPerson Risk Indicators
Enviro-Determin Indicators
Prom-Prev Indicators
Management Indicators
Examples:SmokingCholesterolPhysical activityNutritionBlood pressureDiabetesLiteracy/ educationIncomeStress
Examples: air qualityWater qualitysecond hand smokeChemical exposuresingle parent familiesimmigrant CrimeEmploymentlow income
Examples: risk factor prog.public awareness of riskssmoking cessation prog.anti-smoking bylawsrisk factor screening teenage birthssocial assistance
Examples: Number & type of doctorsprimary care visitsPrescriptionsdrug adverse reactionstreatment effectivenessservice wait timesRehabilitationinfant mortalitysurvival/cure
Health Status Indicators
Examples: PrevalenceIncidenceHospitalizationReadmission Hospital daysComorbidityMortality rateHealth adjusted life expectancyFunctional status
Direct-simple measures: Prevalence, Mortality Derived Indicators/Data-Integration: Outcomes, Incidence What if tools / Projections
Data sourcesCCHSCHMSNPHS
Data sourcesCCHSCHMSNPHS
Data sourcesHPOISurvey
Data sourcesVital StatsHPOIAdministration Data
Data sourcesVital StatsHPOIAdministration Data
Information types:

What info can one get from Hospital data ?
• Prevalence estimates• Incidence estimates• In-hospital surgeries• Case fatality• Length of stay• Time to readmission• Co morbidities
• Link to mortality to get death out of hospital
• Link to surveys• Link to drug plan….
Age, sex, Health regions, Hospital, Census variables…
Hospital alone Hospital linked

Current Canadian sources of CVD dataCVD_in_Canada Series:• Joint publication of the CHSFC, PHAC, STC, CIHI, CCS and CCORT• published every two years. Last issue was “The Increasing Burden of
Heart Disease and Stroke in Canada”.
Health indicators • Series of set indicators by Health region out every two years free on the
web by STC and CIHI.-Mortality Rates for AMI, Stroke -30-day AMI In-hospital Mortality -30-day Stroke In-hospital Mortality -365-day Relative Survival Rate for AMI-180-day Relative Survival Rate for Stroke
-
-Wait Times for Cardiac Surgery-Re-admissions for AMI, Heart Failure-Smoking -Physical Activity -Obesity CCORT www.ccort.ca (Maps and Atlas can be downloaded for free)
• A group of CVD researchers, funded by grants, that uses surveys and linkable administrative data to describe the state of CVD risk factors, interventions and outcomes across health regions.
• Its output is a series of research papers in the CJC and an Atlas.

Useful sites from PHAC1. Centre for Chronic Disease Prevention and Control in the Public Health
Agency of Canada: http://www.phac-aspc.gc.ca/ccdpc-cpcmc/index_e.html
2. Here is a link to PHAC 'surveillance' web page:http://www.phac-aspc.gc.ca/ccdpc-cpcmc/surveil_e.html
3. This is a link to the CVD sub site:http://www.phac-aspc.gc.ca/ccdpc-cpcmc/cvd-mcv/index_e.html
At the above link, you can be directed to the following: - CVD Online (outdated) (see below for infobase) - Publications - Inventory of CVD databases (currently being updated)
4. Here is the link to the latest publication (Growing Burden):http://www.cvdinfobase.ca/cvdbook /
5. Finally, here is a link to INFObase: http://www.cvdinfobase.ca/

Useful sites from Stat Can• Health Portal• http://cansim2.statcan.ca/cgi-win/cnsmcgi.pgm?Lang=E&SP_Action=Theme&SP_ID=2966
• Health Indicator publication:• http://dissemination.statcan.ca/bsolc/english/bsolc?catno=82-221-XWE
• Community Profiles• http://www12.statcan.ca/english/census06/data/profiles/community/Index.cfm?Lang=E
• Health Reports• http://www.statcan.ca/bsolc/english/bsolc?catno=82-003-X
• Health Webpage• http://cansim2.statcan.ca/cgi-win/cnsmcgi.pgm?Lang=E&ResultTemplate=Srch2&CORCmd=GetTList&CORId=2966
• Health Profiles• http://www.statcan.ca/bsolc/english/bsolc?catno=82-576-X&CHROPG=1
• Health by Subject• http://www.statcan.ca/cgi-bin/downpub/freepub.cgi?subject=2966#2966
• CANSIM Tables Vital Stats• http://cansim2.statcan.ca/cgi-win/cnsmcgi.exe?&Lang=E&RootDir=CII/&ResultTemplate=CII/
CII_FLst&Array_Pick=1&ArrayId=102*
• CANSIM Tables CCHS• http://cansim2.statcan.ca/cgi-win/cnsmcgi.exe?&Lang=E&RootDir=CII/&ResultTemplate=CII/
CII_FLst&Array_Pick=1&ArrayId=105*
• CANSIM Tables Census• http://cansim2.statcan.ca/cgi-win/cnsmcgi.exe?&Lang=E&RootDir=CII/&ResultTemplate=CII/
CII_FLst&Array_Pick=1&ArrayId=109*

CVD

CHF 428
CARDIOVASCULAR DISEASE 430-438
CEREBROVASCULAR 430-438 IHD 410-414
Heart attack
AMI 410
Intracerebral Hemorhage 431
Subarachnoid Hemorhage 430
Acute but Ill Defined 436
Ischemic Stroke 434
Acute stroke 430, 431, 434, 436
Common Cardiovascular diseases

A myocardial infarction occurs when an atherosclerotic plaque slowly builds up in the inner lining of a coronary artery and then suddenly ruptures, totally occluding the artery and preventing blood flow downstream.
Acute myocardial infarction (AMI or MI), more commonly known as a heart attack, is a disease state that occurs when the blood supply to a part of the heart is interrupted. The resulting ischemia or oxygen shortage causes damage and potential death of heart tissue.

Stroke (or cerebrovascular accident or CVA) is the clinical designation for a rapidly developing loss of brain function due to an interruption in the blood supply to all or part of the brain. This phenomenon can be caused by thrombosis, embolism, or hemorrhage (= haemorrhage)
Strokes can be classified into two major categories: ischemic and hemorrhagic.
In an ischemic stroke, which is the cause of approximately 80% of strokes, a blood vessel becomes occluded and the blood supply to part of the brain is totally or partially blocked.
A hemorrhagic stroke, or cerebral hemorrhage, is a form of stroke that occurs when a blood vessel in the brain ruptures or bleeds. There are two types of hemorrhagic stroke: intracerebral hemorrhage (bleeding into the brain) , and subarachnoid hemorrhage (bleeding around the brain). Hemorrhagic strokes are more dangerous than their more common counterpart, ischemic strokes.

Congestive heart failure (CHF), also called congestive cardiac failure (CCF) or just heart failure, is a condition that can result from any structural or functional cardiac disorder that impairs the ability of the heart to fill with or pump a sufficient amount of blood through the body.
Heart failure is a progressive disorder in which damage to the heart causes weakening of the cardiovascular system. It manifests by fluid congestion or inadequate blood flow to tissues.
The term "heart failure" simply means that your heart isn't pumping blood as well as it should. Heart failure doesn't mean your heart has stopped working or that you are having a heart attack (but, people with heart failure often have had a heart attack in the past). Heart failure is also called congestive heart failure, or CHF. "Congestive" means fluid is building up in the body because the heart isn't pumping properly.

The Epidemic of CVD MortalityNorth America, 20th c.
1950 1970
Ischemicheart disease
Cerebrovasculardisease
1900
mor
talit
y

0
5
10
15
20
25
30
FemalesMales
Females 0.5 0.5 0.6 1.2 1.9 6 11.7 21.8 4.1
Males 0.5 0.5 0.7 1.4 3.9 10.4 19.3 27 5.5
15-19 20-24 25-34 35-44 45-54 55-64 65-74 75+ 12+
Percentage of individuals aged 12+ who report having heart disease by age group and gender, Canada, 2005
Source: Centre for Chronic Disease Prevention and Control, Public Health Agency of Canada, 2006 using Statistics Canada, Canadian Community Health Survey Data.

0102030405060708090
100
Need help Have activityrestrictions
>1 disabilityday in the past
14 days
Depressed
heart disease stroke without HD or stroke
Percentage of individuals aged 12+ years with heart disease or stroke who report limitations in their lives compared to those without heart
disease or stroke, Canada, 2005
Source: Centre for Chronic Disease Prevention and Control, Public Health Agency of Canada, 2006 using Statistics Canada, Canadian Community Health Survey Data.

0
5
10
15
20
25
30
35
Male Female Male Female Male Female Male Female Male Female
Age 20-49 Age 50-64 Age 65-79 Age 80+
Proportion of adults in the general population aged 20+ years, who reported heart conditions by age and sex, Canada, 2003(CCHS)
Heart disease Stroke Heart Attack Angina CHF

Top 10 diagnoses for seniors (65+) by office-based physicians (thousands of visits) 1999
15,000
10,000
5,000
0
Diseases of circulatory systemEndocrine/nutrition/metabolic/immunityMusculoskeletal diseaseDisease of respiratory systemCentral nervous systemSymptomatic and ill-defined conditionsMental disordersDiseases of digestive systemNeoplasmsDiseases of genitourinary system
Source: IMS Health Canada

Figure 2-34 Number of prescriptions for treatment of cardiovascular diseases, Canada, 1996-2001 (millions)
30.032.5
43.5
0
10
20
30
40
50
1996 1998 2001
Num
ber
(mill
ions
)
Source: Health Canada, using data from IMS Health, Canada

Other (94.1)29%
CVD (43.5)14%
Analgesic (19.7)6%
Anti-arthritic
(15.0)5%
Bronchial Therapy
(14.3)5%
Anti-spasmodic/
Anti-secretory
(14.9)5%
Cholesterol Agents (12.4)4%
Diruetic (11.7)4%
Anti-infective
(24.6)8%
Psychotherapeutic (35.3)11%Hormone
(27.1)9%
Source: Health Canada, using data from IMS Health, Canada
Figure 2-35 Estimated number and percent of prescriptions dispensed, top 10 therapeutic classes, Canada, 2001 (millions)

Mortality

Leading Causes of Death, Number and Percentage of Deaths,Canada, 2003
Other IHD (22,129) AMI (18,662)
Cerebrovascular (15,283) Other CVD (18,181)
Accid./Poison/Viol. (14,099) Cancer (67,423)
Infectious Diseases (3,607) Diabetes (7,970)
Other (40,339) Respiratory (18,472)
All CardiovascularDisease (74,255) 33%
Source: Centre for Chronic Disease Prevention and Control, Public Health Agency of Canada, 2006 using Statistics Canada, Vital Statistics data.

0
100
200
300
400
500
600
IHD CEREBROVASCULAR AMI Heart Failure
Mortality Rates for Males and Females by CVD types, Canada, 1950-2004
MALE FEMALE
Cerebrovascular disease excludes transient ischemic attacks. Age-standardized to 1991 Canadian Population. Note that the coding schemes for this condition changed in 1968, 1978 and 2000 and this may influence trends.Source: Centre for Chronic Disease Prevention and Control, Public Health Agency of Canada, 2006 using Statistics Canada, Vital Statistics data.

0
50
100
150
200
250
300
350
400females males
Countries with Reported Age-Standardized Mortality Rates Rate of IHD per 100.000
Source: Centre for Chronic Disease Prevention and Control, Public Health Agency of Canada, 2006 using Organisation for Economic Co-operation and Development (OECD) data.

0
25
50
75
100
125
150
175
200
females males
Countries with Reported Age-Standardized Mortality Rates Rate of Cerebrovascular disease per 100.000
Source: Centre for Chronic Disease Prevention and Control, Public Health Agency of Canada, 2006 using Organisation for Economic Co-operation and Development (OECD) data.

0
10
20
30
40
50
< 25 25-34 35-44 45-54 55-64 65-74 75+ AllAges
Men Women
Percentage of Total Deaths Due to Cardiovascular Diseases by Age Group and Gender, Canada, 2003
Source: Centre for Chronic Disease Prevention and Control, Public Health Agency of Canada, 2006 using Statistics Canada, Vital Statistics data.

05
101520253035404550
Men Women
Percent of Total Deaths Due to CVD by Gender and year, Canada, 1990-2003
ICD10 codes: I00-I78. Age-standardized to 1991 Canadian population..Source: Centre for Chronic Disease Prevention and Control, Public Health Agency of Canada, 2006 using Statistics Canada, Vital Statistics data.

0
100
200
300
400
500
600Males Females
Chart 7. Age standardized mortality rates per 100,000 for all CVD by province, Aged 20+,
2001
Data Source: Canadian Mortality Data BaseAge/sex standardized by 5 year age groups against 2001 population* Significantly difference from all Canada rate
All Canada mortality rate
Men 409
* *
* *
All Canada mortality rate Women 258
* * **

0 50000 100000 150000 200000 250000
Injuries
Cancer
CVD
Respiratory
Digestive
Congenital Females Males
Number of Potential Years of Life Lost (PYLL) Prior to Age 75, by Disease Category, Canada, 2003
Source: Centre for Chronic Disease Prevention and Control, Public Health Agency of Canada, 2006 using Statistics Canada, Vital Statistics data.

Hospitalization

Hospitalization for Men and Women by Diagnosis (Using most responsible diagnosis only), Canada, 2004 (excluding
pregnancy and childbirth, including newborns)
Mental Cardiovascular
Respiratory Digestive
Genitourinary Musculoskeletal
Injuries & Poisonings Other
All CardiovascularDisease (229,814) 17%
Source: Centre for Chronic Disease Prevention and Control, Public Health Agency of Canada, 2006 using Canadian Institute for Health Information data.

Percentage of patients aged 20 or older hospitalized for diseases of the circulatory system, Canada, 2001/02
Other CVD5.8%
CHF3.1%
Stroke3.7%
Other IHD5.1%
Heart Attack3.8%
All other causes of
hospitalization78.5%
Total diseases of the circulatory system (21.5%)

0
200
400
600
800
1000
1200
IHD CEREBROVASCULAR AMI Heart Failure
Hospitalization Rates for Males and Females by CVD types, Canada, 1979-2004
MALE FEMALE
Standardized rate uses 1991 Canadian Population. Cerebrovascular disease excludes transient ischemic attacks. Using most responsible diagnosis only. Note that the coding schemes for this condition changed in 1968, 1978 and 2000 and this may influence trends.Source: Public Health Agency of Canada, 2007 using data from Hospital Morbidity Database, Statistics Canada and CIHI.

0
200
400
600
800
1000
1200
1400
1600
1800
2000
25-34 35-44 45-54
55-64 65-74 75-85+
AMI Hospitalization Rates per 100,000 for Males and Females by Age Group, Canada, 1971-2004
MALE FEMALE
Source: Public Health Agency of Canada, 2007 using data from Hospital Morbidity Database, Statistics Canada and CIHI.

Number of Hospitalizations for Cardiovascular Disease by Age Group and Gender, Canada, 2003/04
0
20000
40000
60000
80000
100000
120000
140000
Responsible condition Associated Condition
F/M F/M F/M F/M F/M F/M F/M 25-34 35-44 45-54 55-64 65-74 75-84 85+
Source: Public Health Agency of Canada, 2007 using data from Hospital Morbidity Database, Statistics Canada and CIHI.

Age standardized rate per 100,000 for Selected CVD hospital visits and patients by sex, Aged 20+,
Canada, 1994/95 to 2000/01
AMI0
50
100
150
200
250
300
350
400
450
94/95 95/96 96/97 97/98 98/99 99/00 00/01 01/02
age
stan
dard
ized
rat
e/10
0,00
0
IHD0
200
400
600
800
1000
1200
1400
94/95 95/96 96/97 97/98 98/99 99/00 00/01 01/02
age
stan
dar
diz
ed r
ate/
100,
000
0
50
100
150
200
250
300
350
400
450
94/95 95/96 96/97 97/98 98/99 99/00 00/01 01/02
age
stan
dard
ized
rat
e/10
0,00
0
Stroke CHF0
50
100
150
200
250
300
350
400
450
94/95 95/96 96/97 97/98 98/99 99/00 00/01 01/02
age
stan
dard
ized
rat
e/10
0,00
0
Patients per 100,000 femalesVisits per 100,000 femalesVisits per 100,000 males
Patients per 100,000 males
Data Source: Health Person Oriented Information Database, HPOIAge-standardized to 2001, 5 year age groups

Age adjusted Rate for male and female hospitalized AMI visits and patients by fiscal year, Canada, 1994/95 to 2004/05.
0
50
100
150
200
250
300
350
400
1994 1995 1996 1997 1998 1999 2000 2001 2002 2003 2004
Fiscal year
Ag
e ad
just
ed r
ate/
100,
000
Male visitsFemale visitsMale patientsFemale patients
Data source: HPOI Statistics Canada.Condition was defined as the most responsible diagnosis ICD 9 codes 410; ICD10 CA codes I21,I22. Standardized to 1991 by 5 year age groups from age 20; Population data from Statistics Canada 2001 census.

Is AMI decreasing?

0
5000
10000
15000
20000
25000
30000
35000
40000
45000
50000
55000
60000
1994 1995 1996 1997 1998 1999 2000 2001 2002 2003
year
Nu
mb
er
0
25
50
75
100
125
150
175
200
225
250
275
300
325
350
Ag
e st
d r
ate
per
100
,000
Number Crude rate Standardized rate
AMI Hospitalized Patients (Most Responsible Diagnosis), Canada, 1994-2004

0
5000
10000
15000
20000
25000
30000
35000
40000
45000
50000
55000
60000
1994 1995 1996 1997 1998 1999 2000 2001 2002 2003
year
Nu
mb
er
chf ami stroke
Number of Hospitalized Patients by disease type (Most Responsible Diagnosis), Canada, 1994-2004

The “Greying of Canada”
Between 1991 and 2001, the population aged 80 years and over rose 41% to 932,000.
It is expected to increase an additional 43% between 2001 and 2011. By then, it will have surpassed an estimated 1.3 million.
The population from 45 to 64 years of age increased 36% between 1991 and 2001, witnessing the entry of the baby boomers into this group.

Total Number of Hospital Days
0
500,000
1,000,000
1,500,000
2,000,000
2,500,000
3,000,000
3,500,000
4,000,000
4,500,000
CVD AMI IHD Stroke CHF
Nu
mb
er o
f D
ays
Age/sex standardized† average number of days in hospital/patient by
year
0
2
4
6
8
10
12
14
16
18
CVD AMI IHD Stroke CHF
Av
era
ge
nu
mb
er
of
da
ys
94-95 95-96 96-97 97-98 98-99 99-00 00-01 01-02
Age/sex standardized† percentage of hospital patients who die in hospital by
year
0
2
4
6
8
10
12
14
16
18
CVD AMI IHD Stroke CHF
pe
rce
nta
ge
of
pa
tie
nts
Cardiovascular Disease Trends from all Hospital Records in Canada, aged 20+, 1994/95 to 2001/02
Data Source: Health Person Oriented Information Database, HPOI†Age-sex standardized to all CVD Patients in 1994/95 using 5 year age groups from age 20+.

4%
10%19%
11%
6%
9% 9%
16%
16%
3%
4%
9%
9%10%
11%18%
20%
16%
Neoplasms Mental CVD RespiratoryDigestive Genitourinary Musculoskeletal Injuries & PoisoningsOther
Number of days stayed by disease chapter and sex, 2004
MALE FEMALE

Some quick examples of CHF research:
Readmissions
Time trends
Projections

0
10
20
30
40
50
60
0 4 8 12 16 20 24 28 32 36 40 44 48 52
Weeks
Cum
ulat
ive
Perc
enta
ge
20-4445-6465-7980+
Denominator is Index CHF patients = 83,213
Cumulative rate of first re-hospitalization in Index CHF patients by age, Canada, 1996/97.
Time from discharge of index series of visits.

Number of CHF deaths and hospital episodes of those ages 20+ by month, April, 1994 to December 2004, Canada
0
1000
2000
3000
4000
5000
6000
7000
Apr-94 Apr-95 Apr-96 Apr-97 Apr-98 Apr-99 Apr-00 Apr-01 Apr-02 Apr-03 Apr-04
0
200
400
600
Hospital Episodes
Deaths

0
500
1000
1500
2000
2500
3000
3500
Apr-94 Apr-95 Apr-96 Apr-97 Apr-98 Apr-99 Apr-00 Apr-01 Apr-02 Apr-03 Apr-04
0
100
200
300
400
Number of CHF deaths and hospital episodes of those ages 20+ by month and sex, April, 1994 to December 2004, Canada
Hospital Episodes
Deaths
MenWomen
MenWomen

Number of CHF deaths of those ages 20+ by month and sex, Canada, 2004
0
500
1000
1500
2000
2500
20-49 50-59 60-69 70-79 80+
male female

Ten year average number of CHF deaths per month by age and sex Canada,1995-2004
0
50
100
150
200
250
Jun
Jul
Aug
Sep O
ct N
ov D
ec J
an F
eb M
ar A
pr M
ay
Male 20-59
Male 60-69
Male 70-79
Male 80+
Female 20-59
Female60-69
Female70-79
Female80+

010,00020,00030,00040,00050,00060,00070,00080,00090,000
100,000
1996 2000 2005 2010 2015 2020 2025Year
Num
ber
Projected number of “incident hospitalizations” for CHF patients, first diagnose, using high, medium and low population growth projections Canada, 1996 to 2050.
Given the aging population and average annual changein hospital rates over the previous 10 years, the number of CHF incident hospital cases per year is projected to more than double by the year 2025.

0
500
1000
1500
2000
2500
3000
3500
25-34 35-44 45-54
55-64 65-74 75-85+
HEART FAILURE Hospitalization Rates per 100,000 for Males and Females by Age Group, Canada, 1979-2004
MALE FEMALE
Source: Public Health Agency of Canada, 2007 using data from Hospital Morbidity Database, Statistics Canada and CIHI.

010,00020,00030,00040,00050,00060,00070,00080,00090,000
100,000
1996 2000 2005 2010 2015 2020 2025Year
Num
ber
Projected number of “incident hospitalizations” for CHF patients, first diagnose, using high, medium and low population growth projections Canada, 1996 to 2050.
Given the aging population and average annual changein hospital rates over the previous 10 years, the number of CHF incident hospital cases per year is projected to more than double by the year 2025. To keep the current number of incident cases the same as in 1996/97, the incidence of would have to decrease by 2.6% per year.

Revascularization and survival trends of Canadian acute myocardial infarction (AMI)
patients, 1995/96 to 2003/04• METHODS – DEFINITIONS - LIMITATIONS
• REVASCULARIZATION• How did revascularization rates within thirty days of a
heart attack change between 1995/96 and 2003/04?
• 30 DAY SURVIVAL
• How did death rates in hospital within thirty-days of a heart attack change between 1995/96 and 2003/04?
• RELATION OF REVASCULARIZATION TO SURVIVAL?• Are the heart attack patients revascularized within thirty
days between 1995/96 and 2003/04 more likely to survive 30 days?

# Age adjusted percentage of AMI patients who were revascularized within thirty days by year and sex, Nine
provinces, Canada
0
10
20
30
40
50
1995 1996 1997 1998 1999 2000 2001 2002 2003
male female
Revascularization rates within thirty-days of their attack increased in all provinces between 1995/96 and 2003/04. Male rates increased from 14% to 44%; female ones from 12% to 36%.

* Average Time to revascularization for AMI patients by age and sex, Canada, 1995/96 and 2003/04
0
10
20
30
40
50
60
70
80
1995
2003
On average, time-to-revascularization within one year of an heart attack decreased for all age and sex groups.
Male 20-44
Male 45-64
Male 65-79
Male 80+
Female 20-44
Female 45-64
Female 65-79
Female 80+

#Age adjusted percentage of AMI patients who died within thirty days by year and sex, Nine provinces, Canada
0
2
4
6
8
10
12
14
1995 1996 1997 1998 1999 2000 2001 2002 2003
Male Female
The percentage who died thirty-days after their attack decreased over time. Females have decreased more than males. In the most recent years, rates have levelled out.

5
7
9
11
13
15
0 10 20 30 40 50 60 70
% revascularized within 30 days
% d
yin
g w
ith
in 3
0 d
ays
NF NS NB QBON MA SA ALBC Linear (NF) Linear (AL) Linear (QB)Linear (MA) Linear (SA) Linear (BC) Linear (ON)Linear (NS) Linear (NB)
Provinces
Charts show the % of heart attack patients (AMI) dying within 30 days (in hospital) by % revascularized within 30 days. Rates are adjusted by age, sex and Charlson co-morbidities, 1995/96 to 2003/04 Almost all provinces showed a decreasing death rate with an increasing rate of revascularization.

Risk Factors
“How you live is how you die”

Core Data
BMI as a measure of obesity;
Physical inactivity;
Blood pressure;
Diabetes;
Smoking;
Cholesterol; and
Nutrition (consumption of fruits & vegetables)

“The risk factors of today are the
diseases of tomorrow …”
The focus is on Non CommunicableThe focus is on Non CommunicableDisease Risk Factor SurveillanceDisease Risk Factor Surveillance

Proportion of deaths attributable to leading risk factors
Proportion of deaths attributable to leading risk factors
World Health Organization Global Burden of Disease StudyWorld Health Organization Global Burden of Disease Study
Murray et al, 1996.
Poor water
supply
Physical inactivity
Malnutrition
12%
10%
8%
6%
4%
2%
0%
11.7%
Tobacco use
Hypertension
% o
f gl
obal
dis
abili
ty
6.0% 5.8%5.3%
3.9%

Modifiable Risk Factors (self-reported) among Adults Aged 20-59, Canada, 2005 Risk Factor Proportion of
the Population
Aged 20-59 Years (%)
Tobacco Smoking (Daily) 20.18
Physical Inactivity 49.14
Overweight (BMI ≥ 25.0) 49.36
> 5 servings per day of fruits & vegetables
59.55
High Blood Pressure* 10.25
Diabetes** 3.11
*High blood pressure was calculated using the two-question method. "Respondent has high blood pressure" and "Respondent taking meds. for high blood pressure".
**For the purposes of this report diabetes is listed as a major risk factor.
Source: Centre for Chronic Disease Prevention and Control, Public Health Agency of Canada, 2006 using Statistics Canada, Canadian Community Health Survey Data.
Combined Risk Factors for Cardiovascular Disease (self-reported) among Adults Aged 20-59, Canada, 2005
Number of Risk Factors Risk Factors
(% of population)
No Risk Factors 21.92
At least 1 Risk Factor: 78.08
1 Risk Factor 39.08
2 Risk Factors 28.18
3 or More Risk Factors 10.82

Source: Centre for Chronic Disease Prevention and Control, Public Health Agency of Canada, 2006 using Statistics Canada, Canadian Community Health Survey Data.
Risk Factors for Heart Disease and Stroke among Adults Aged 18+ Years of Various Ethnic Backgrounds, Canada, 2005
Risk Factor Percent of Population with Risk Factor
White ChineseSouth Asian Black
Southeast Asian
Aboriginal
Tobacco Smoking (Daily) 19.0 5.8 6.7 10.0 20.57** 37.4
Physical Inactivity 55.2 66.3 59.4 61.9 61.3 54.0
Overweight (BMI ≥ 25.0) 52.5 19.5 38.2 53.3 34.5 60.0
≥ 5 servings per day of Fruits & Vegs 58.2 68.4 61.9 59.4 69.1 64.3
High Blood Pressure* 22.3 13.2 16.8 24.5 17.6 18.7
Diabetes 5.3 6.1 4.56** 6.4
**Sample size ≤ 30
*High blood pressure was calculated using the two-question method. "Respondent has high blood pressure" and "Respondent taking meds. for high blood pressure".

The Canadian Way of Life
heavy into sports… eh!


Physical inactivity, 12+, by age group and gender, Canada, 2005
0
20
40
60
80
Age Group
Per
cen
t (%
)
Females Males
Females 30 38 43 49 51 53 51 55 72 50
Males 20 25 35 46 51 52 51 46 57 45
12-14 15-19 20-24 25-34 35-44 45-54 55-64 65-74 75+ 12+
Source: Centre for Chronic Disease Prevention and Control, Public Health Agency of Canada, 2006 using Statistics Canada, Canadian Community Health Survey Data, excludes not stated.

0
10
20
30
40
50
60
70
Male 58 51.6 53.2 46.9 48.4
Female 61.8 58.6 59.3 50.5 52.3
1996 1998 2000 2002 2005
Percentage of individuals aged 20+ years who were physically inactive1, Canada, 1996 - 2005
1Energy level at or below the leisure time activity (1.5 kilcalories/kilogram/day)Source: Centre for Chronic Disease Prevention and Control, Public Health Agency of Canada, 2006 using Statistics Canada, Canadian Community Health Survey Data.


Trends in Obesity Rates, Self-reported, 18+, Canada excluding territories, 1985-2005
0
5
10
15
20
Year
Per
cen
t (%
)
Obese 6.2 9.7 13.1 12.5 14.5 14.8 15.2 15.5 15.9
1985 1989 1990 1994 1996 1998 2000 2003 2004 2005
Obese: Self-reported BMI ≥ 30.0 Source: Centre for Chronic Disease Prevention and Control, Public Health Agency of Canada, 2006 using Statistics Canada, Canadian Community Health Survey Data.
14.8
23.1
X Obese: Measured BMI ≥ 30.0

Trends in Obesity Rates, 18+, Canada excluding territories, 1978-2005
0
5
10
15
20
25
Year
Per
cen
t (%
)
Measured Self-reported
Source: Centre for Chronic Disease Prevention and Control, Public Health Agency of Canada, 2006 using Statistics Canada, Canadian Community Health Survey Data.

Overweight, 18+ Self-Reported Adult Body Mass Index 25.0 or Higher by Province/Territory, Canada,
2005
0
10
20
30
40
50
60
70
Province/Territory
Per
cen
t (%
)
Source: Centre for Chronic Disease Prevention and Control, Public Health Agency of Canada, 2006 using Statistics Canada, Canadian Community Health Survey Data.
Canada

HIGH BLOOD PRESSURE

High Blood Pressure*, 20+, by Age Group and Gender, Canada, 2005
0.0
10.0
20.0
30.0
40.0
50.0
60.0
70.0
Age Group
Perc
en
tag
e (
%) Females Males
Females 3.2 6.6 11 21 36 53 62
Males 2.6 5.8 11 21 37 47 50
20-24 25-34 35-44 45-54 55-64 65-74 75+
Source: Centre for Chronic Disease Prevention and Control, Public Health Agency of Canada, 2006 using Statistics Canada, Canadian Community Health Survey Data.*Two part question used: Ever diagnosed with HBP / Respondent has HBP

0
5
10
15
20
1994 1996 1998 2000 2002 2004 2005
Female Male
Percentage of the general population aged 20+ years who reported having high blood pressure, Canada, 1994-2005
Source: Centre for Chronic Disease Prevention and Control, Public Health Agency of Canada, 2006 using Statistics Canada, Canadian Community Health Survey Data.

High Blood Pressure*, 20+, by Province/Territory, Canada, 2005
0
5
10
15
20
25
30
35
Perc
en
t (%
)
Source: Centre for Chronic Disease Prevention and Control, Public Health Agency of Canada, 2006 using Statistics Canada, Canadian Community Health Survey Data.*Two part question used: Ever diagnosed with HBP / Respondent has HBP

Awareness, treatment, and control
of hypertension in Canada
Awareness, treatment, and control
of hypertension in Canada
Unaware of their hypertension
Not treated and not controlled
Treated and not controlled
Treated and controlled
16%
23%19%
42%
Of those 22% of Canadians with hypertension
The Canadian Heart Health Surveys, Joffres et al, 1997.

9%9%
20%20%
17.5%17.5%
20.5%20.5%
22.5%22.5%
>65 yr only>65 yr only
16%16%27%27%
6%6%
19%19%
2.5%2.5%
Control of hypertension worldwidepercent of patients with BP controlled
3. Joffres et al, Am J Hypertens 1997;10:1097
4. Marques-Vidal et al, J Hum Hypertens1997;11:213
1. JNC VI, Arch Intern Med 1997;157:2413
2. Colhoun et al, J Hypertens1998;16:747
Adapted from Mancia 1999
England2 India4
Spain4
Scotland4
Finland4
Germany4
Canada3USA1 Australia4
Zaire4

DIABETES

Percentage of the general population aged 12+ years. who reported having diabetes,Canada, 1994-
2005
0.0
1.0
2.0
3.0
4.0
5.0
6.0
1994 1995 1996 1997 1998 1999 2000 2001 2002 2003 2004 2005Year
Per
cen
t (%
)
Females Males Both
Source: Centre for Chronic Disease Prevention and Control, Public Health Agency of Canada, 2006 using Statistics Canada, National Population Health Survey and Canadian Community Health Survey Data.

Diabetes, 12+, by Age Group and Gender, Canada, 2005
0.0
2.0
4.0
6.0
8.0
10.0
12.0
14.0
16.0
18.0
20.0
Age Group
Per
cen
t (%
)
Females Males
Females 0.7 1.2 1.9 4.0 8.5 12 13
Males 0.9 0.9 2.1 5.0 12 17 17
20-24 25-34 35-44 45-54 55-64 65-74 75+
Source: Centre for Chronic Disease Prevention and Control, Public Health Agency of Canada, 2006 using Statistics Canada, Canadian Community Health Survey Data.

Diabetes, 12+, by Province/Territory, Canada, 2005
0.0
1.0
2.0
3.0
4.0
5.0
6.0
7.0
8.0
Province/Territory
Per
cen
t (%
)
Source: Centre for Chronic Disease Prevention and Control, Public Health Agency of Canada, 2006 using Statistics Canada, Canadian Community Health Survey Data.

at high risk of cardiovascular disease due to diabetes, obesity and high
blood pressure
Native Peoples

Do provinces with higher rates of overweight have higher rates of
HBP or diabetes?
0
5
10
15
20
25
30
35
40 50 60 70
Percent hbp
% diabetes
Linear (Percent hbp )
Linear (% diabetes)

SMOKING

Percentage of the General Population Aged 15+ Years Who Were Daily Smokers, Canada, 1999-2005
0
5
10
15
20
25
Year
Per
cen
t (%
)
Females Males Both
Females 19 18 16 16 14 13 12
Males 23 21 20 19 19 17 18
Both 21 20 18 18 17 15 15
1999 2000 2001 2002 2003 2004 2005
Source: Centre for Chronic Disease Prevention and Control, Public Health Agency of Canada, 2006 using Health Canada, Canadian Tobacco Use Monitoring Survey Data.


Tobacco: deaths by World Bank regionsestimates for 1990 and 2020
Source: Murray CJL, Lopez AD 1996
Established Market Economies
Middle Eastern Crescent
Latin America & CaribbeanSub-Saharan AfricaOther Asia and Islands
Former Socialist Countries
China
India
1990 2020
8.4 million
3 million
4.5 million
2003

On average, smoking kills 6 people a minute around the world.
Up to 72% of available landis taken up by tobaccocultivation in some developing countries
Zimbabwe derives most of itsforeign exchange fromtobacco
Smoking prevalence amongmen in Jakarta is 60%
On average, smoking kills 6 people a minute
- 1 in the European Union
- 1 in the United States
- 1 in the former USSR
- 1 in the other developed populations
- 1 in China
- 1 in other developing populations

Current Daily Smoker, 15+, by Age Group and Gender, Canada, 2005
0.0
5.0
10.0
15.0
20.0
25.0
30.0
Age Group
Perc
en
t (%
)
Females Males
Females 8.4 15 15 17 14 12 6.6
Males 7.4 18 21 21 24 17 4.3
15-17 18-19 20-22 23-24 25-44 45-64 65+
Source: Centre for Chronic Disease Prevention and Control, Public Health Agency of Canada, 2006 using Health Canada, Canadian Tobacco Use Monitoring Survey Data.
?

Current Daily Smoker, 15+, by Province/Territory, Canada, 2005
0
2
4
6
8
10
12
14
16
18
20
BC AB SA MA ON QU NB NS PEI NFLProvince/Territory
Per
cen
t (%
)
Source: Centre for Chronic Disease Prevention and Control, Public Health Agency of Canada, 2006 using Health Canada, Canadian Tobacco Use Monitoring Survey Data.
Canada

Current Daily Smoker, 15+, by Education and Gender, Canada, 2005
0
5
10
15
20
25
30
Education
Per
cen
t (%
)
Females Males Both
Females 14 16 10 10
Males 20 27 15 12
Both 17 21 13 11
Less than secondary Secondary Some Post-secondary Post-secondary Deg.
Source: Centre for Chronic Disease Prevention and Control, Public Health Agency of Canada, 2006 using Health Canada, Canadian Tobacco Use Monitoring Survey Data.

Health Care Costs

HEALTH CARE EXPENDITURE IN CANADA
(in current dollars)
1975 1980 1985 1990 1995 2000 2005
130120110100 90 80 70 60 50 40 30 20 10 0
Bil l
ion
s of
dolla
rs
Source: Canadian Institute for Health Information
5.9% increase in 200410% of GDP in 2004
billions of $ 130.3 in 2004123.0 in 2003114.0 in 2002106.3 in 2001 97.9 in 2000 89.9 in 1999 83.7 in 1998 78.4 in 1997

Costs of disease by diagnostic category, Canada, 2000
$0.0 $2.5 $5.0 $7.5 $10.0 $12.5 $15.0 $17.5 $20.0 $22.5
Oral conditionsNutritional deficiencies
Other neoplasmsCongenital anomalies
Skin diseasesMaternal conditions
Perinatal conditions*Endocrine disorders
Diabetes mellitusRespiratory infections
Infectious and parasitic diseasesGenitourinary diseases
Sense organ diseasesRespiratory diseases
Digestive diseasesNeuropsychiatric conditions
Malignant neoplasmsInjuries
Musculoskeletal diseasesCardiovascular diseases
Costs ($ billion)
Direct Costs
Indirect Costs
Indirect Costs include Mortality and LTD onlySource: Economic Burden of Ilness in Canada, 2000

Selected Costs for Cardiovascular Diseases Diagnostic Subcategory, Canada, 2000
($000,000s) (% of CVD Costs in Category)
Ischaemic heart disease
Cerebrovascular disease
Hospital Care $1028.20 (31.24%) $821.20 ( 24.96%)
Drugs $465.70 (21.59%) $40.90 ( 1.9%)
Mortality (as cost of premature
death)
$5554.10 (59.93%) $1498.30 (16.17%)
Long-term Disability
$480.6 (11.53%) $966.10 ( 23.18%)

HEALTH CARE COSTS
Table 3-2 Selected Costs, Cardiovascular Diseases by Sex, Canada, 2000 (in $000,000s)
Component Males Females Total
Hospital Care $1,745.9 $1,544.7 $3,290.6
Drugs $1,093.2 $1,064.0 $2,157.3
Physician Care $827.0 $804.0 $1,631.0
Mortality (as cost of premature death) $6,250.0 $3,017.9 $9,268.0
Long-Term Disability $2,444.9 $1,723.3 $4,168.2
$12,361.0 $8,154.0 $20,515.0

Future directions

Canadian Heart Health Strategy and Action Plan (CHHS-AP)Headed by Eldon R. Smith
Contact613. 569.4361 ext [email protected]
• Purpose– To reduce the growing burden and loss due to CV
disease in Canada • Description
– Independent, stakeholder driven– Comprehensive, integrated strategy– Continuum of the health system: health
policy/prevention to end-of-life care– Continuum of life: preconception to death– Address disparities– Evidence-based/best practices

CHHS-AP Leadership
• Leadership partners: – Heart and Stroke Foundation of Canada– Canadian Cardiovascular Society– Canadian Institutes of Health Research
(Institute for Circulatory and Respiratory Health)
• Funder:– Public Health Agency of Canada

Context for a Canadian Strategy
• CVD is Canada’s number one public health problem.• Risk factors, particularly obesity, diabetes and
hypertension are increasing.• Gaps between what we know and what we do exist in
primary and secondary prevention as well as in treatment.
• The health care system lacks integration – access is limited with significant disparities.
• Health human resources are deficient.• Care delivery models have been relatively stagnant.• Canada lacks a surveillance system for CVD.

CHHS-AP Theme Working Groups
1. Strengthening information systems for monitoring, management, evaluation and policy development
2. Creating environments conducive to cardiovascular health
3. Preventing, detecting and controlling major risk factors
4. Addressing and enhancing Aboriginal / indigenous cardiovascular health
5. Timely access to quality (acute) care and diagnostics
6. Timely access to quality chronic disease management, rehabilitation services and end-of-life care

Framework for a Comprehensive Canadian Heart Health Strategy and Action Plan
OUTCOMES
The Vision
Interventions Required
Favourable environments
Healthybehaviours
Lower population risk
Fewer acute events
Less chronic disease
Additional quality life years
Policy and environmental change
Behaviour change strategies
Prevention, detection & management of risk factors
Timely access to quality (acute) care
Timely access to quality chronic disease manage-ment/rehab
Timely access to end oflife care
1. Healthier population
3. Added quality life years
4. Decreased burden of cardiovascular disease
5. Sustainable health system
HEALTH PROMOTION PRIMARY SECONDARY
PREVENTION
TREATMENT
Improved Information and Monitoring
ACCESS to Services
Health Human Resources
2. Reducedinequities

prevalence, incidence, risk factors, mortality, etc yearly
by health region, plus Dissemination
specific research questions
Monitor treatment outcomes
Improving health care
Evaluate health promotion programs
Waiting list evaluation
Are consensus conference guidelines followed
Cost, economics
Projections, predictions models
core questions
After-discharge care
Train future staff and researchers
micro level information to aid & evaluate local efforts in improving health care
Outreach
provide follow-up
information on patients to clinics
& clinical trials.
Data validation
Knowledge Dissemination
Advisory meetings, conferences
What is wanted from a CVD surveillance system?

Appendix

0
5000
10000
15000
20000
25000
30000
35000
40000
45000
50000
55000
60000
1994 1995 1996 1997 1998 1999 2000 2001 2002 2003
year
Nu
mb
er
0
25
50
75
100
125
150
175
200
225
250
275
300
325
350
Ag
e st
d r
ate
per
100
,000
Number Crude rate Standardized rate
CHF Hospitalized Patients (Most Responsible Diagnosis), Canada, 1994-2004

0
5,000
10,000
15,000
20,000
25,000
30,000
35,000
40,000
45,000
50,000
55,000
60,000
1994 1995 1996 1997 1998 1999 2000 2001 2002 2003
year
Nu
mb
er
0
25
50
75
100
125
150
175
200
225
250
275
300
325
350
Ag
e st
d r
ate
per
100
,000
Number Crude rate Standardized rate
Acute stroke Hospitalized Patients (Most Responsible Diagnosis), Canada, 1994-2004

0
2000
4000
6000
8000
10000
12000
14000
16000
25-34 35-44 45-54
55-64 65-74 75-85+
CVD Hospitalization Rates per 100,000 for Males and Females by Age Group, Canada, 1971-2004
MALE FEMALE
Source: Public Health Agency of Canada, 2007 using data from Hospital Morbidity Database, Statistics Canada and CIHI.

0
500
1000
1500
2000
2500
3000
3500
25-34 35-44 45-54
55-64 65-74 75-85+
Cerebrovascular Hospitalization Rates per 100,000 for Males and Females by Age Group, Canada, 1971-2004
MALE FEMALE
Source: Public Health Agency of Canada, 2007 using data from Hospital Morbidity Database, Statistics Canada and CIHI.