overview of data analysis using statgraphics centurion analysis overview.pdf · what is...
TRANSCRIPT
Neil W. Polhemus, CTO, StatPoint Technologies, Inc.
Overview of Data Analysis Using Statgraphics Centurion
Copyright 2011 by StatPoint Technologies, Inc.
Web site: www.statgraphics.com
What is Statgraphics?
2
Statgraphics is a data analysis and data visualization program that runs as a standalone application under Microsoft Windows.
It is designed to make it easy to take data from various data sources (such as Excel or databases) and extract the important information from that data.

Short History First version of Statgraphics for PC’s was released in 1983.
Earliest major stat package for PCs and the first to incorporate graphics directly into every statistical procedure.
Current version is Version 16 with more than 170 procedures.
Desktop application now called “Statgraphics Centurion” to distinguish it from early versions marketed by Manugistics and from our “Statgraphics Online” product.
3

Data Analysis Model
4
Data source (Excel,
database, text file)
Output (printer, Word,
PowerPoint, Excel, HTML)
Statgraphics analytics
Types of Data Analysis
Exploratory data analysis (data mining) – not sure ahead of time what methods will be needed.
Repetitive data processing – repeats a pre-selected set of methods on different data sets or at different times.
5

Example: Countries of the world
6

Main Window
7
DataBookNavigationbar
Main toolbarAnalysis toolbar

Statgraphics DataBook
8

Tabulation
9
BALTICS (3)
EASTERN EUROPE (12)
NEAR EAST (16)
OCEANIA (21)
SUB-SAHARAN AFRICA (51)
WESTERN EUROPE (28)
Piechart for Region
ASIA (EX. NEAR EAST) (28)
C.W. OF IND. STATES (12)
LATIN AMER. & CARIB (45)
NORTHERN AFRICA (6)NORTHERN AMERICA (5)

Variable of interest: infant mortality
10

Box-and-whisker plot
11

Frequency Histogram
12
Histogram
-10 30 70 110 150 190 230Infant mortality
0
20
40
60
80
freq
uenc
y

LOG Transformation
13
Histogram
0 1 2 3 4 5 6LOG(Infant mortality)
0
5
10
15
20
25
30
freq
uenc
y
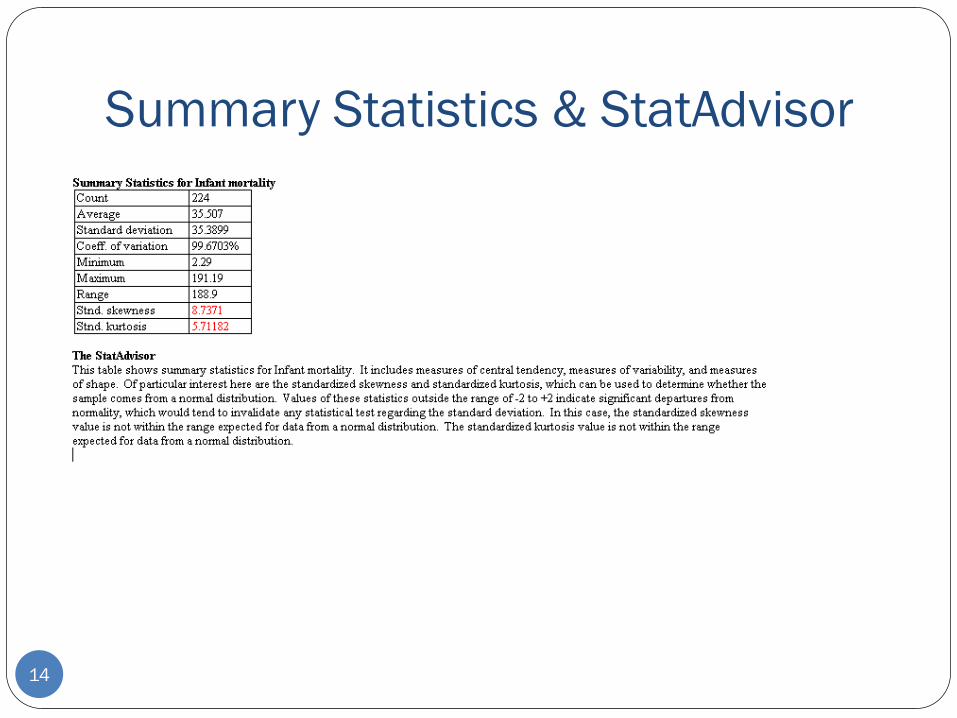
Summary Statistics & StatAdvisor
14
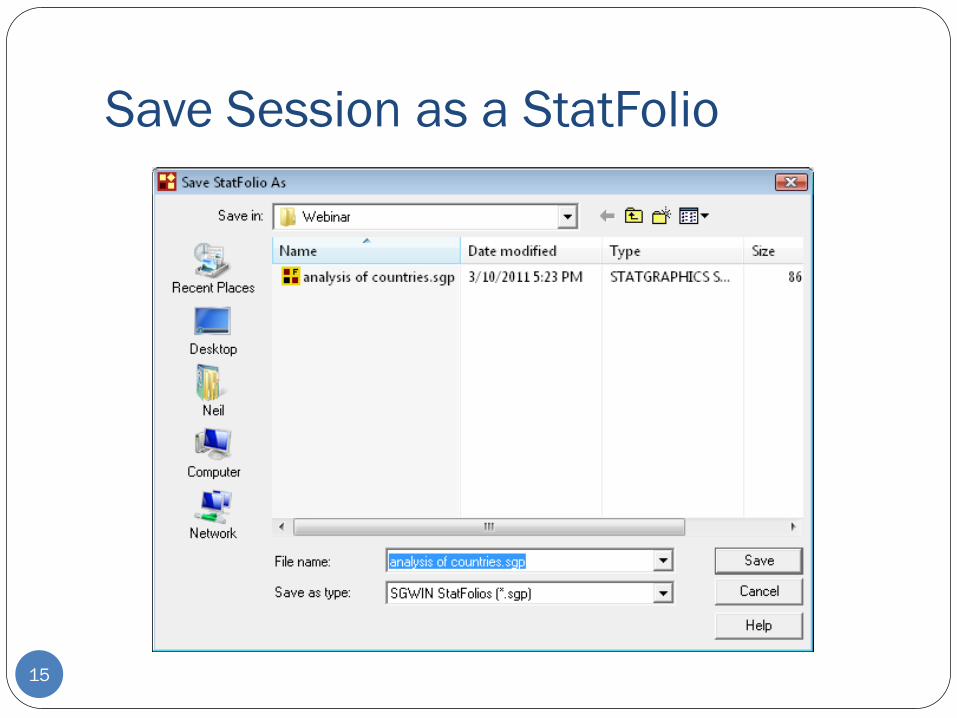
Save Session as a StatFolio
15
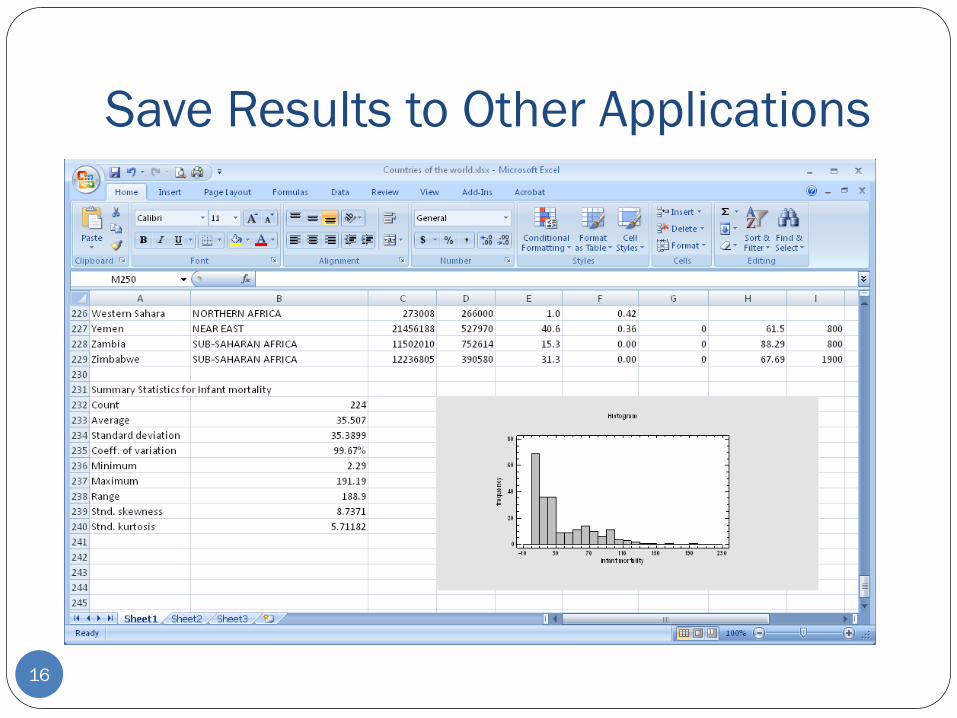
Save Results to Other Applications
16

Save All Results in StatReporter
17

Save results as HTML using StatPublish
18

Multivariate AnalysisLooking at more than one column simultaneously requires
different techniques, such as:
1. Correlation analysis2. Matrix plot3. Cluster analysis
19

Correlations
20

Matrix Plot
21
Infant Mortality
LOG(GDP)
Literacy
LOG(Phones)
Birthrate
Deathrate
Agriculture
Industry
Service

2-D ScatterplotUseful for plotting 2 dimensions.
22

3-D ScatterplotUseful for plotting 3 dimensions.
23
Plot of Infant mortality vs LOG(GDP) and Literacy
6.2 7.2 8.2 9.2 10.2 11.2LOG(GDP)
0 20 40 60 80 100
Literacy
0
40
80
120
160
200
Infa
nt m
orta
lity
RegionASIA (EX. NEAR EAST) BALTICS C.W. OF IND. STATES EASTERN EUROPE LATIN AMER. & CARIB NEAR EAST NORTHERN AFRICA NORTHERN AMERICA OCEANIA SUB-SAHARAN AFRICA WESTERN EUROPE
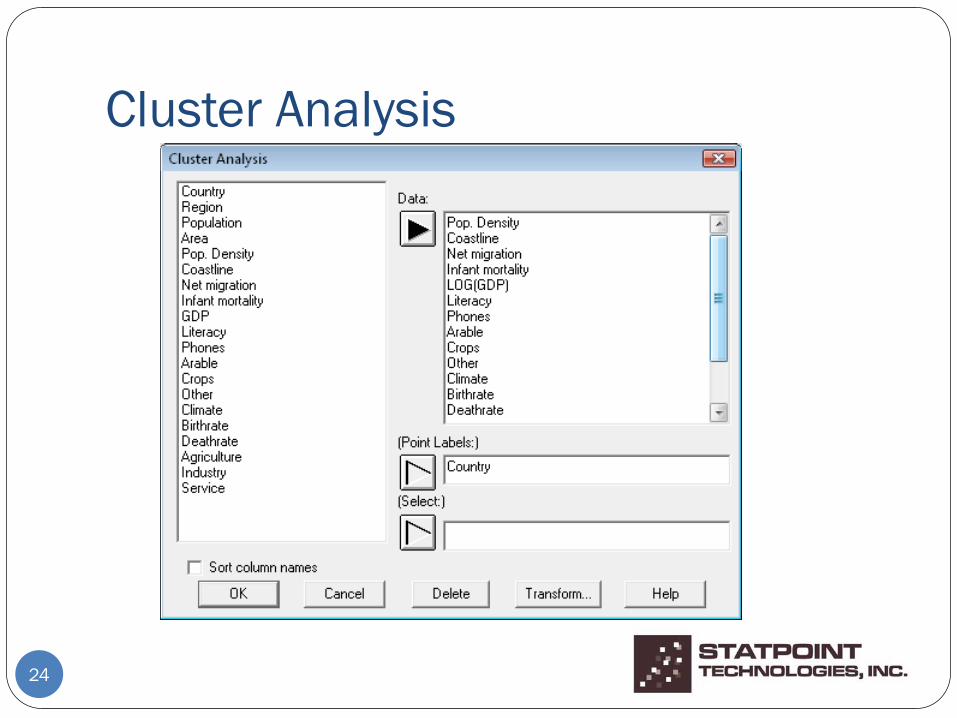
Cluster Analysis
24

Cluster Plot
25
Cluster ScatterplotWard's Method,Squared Euclidean
0 40 80 120 160 200Infant mortality
0 20 40 60 80 100
Literacy
0
200
400
600
800
1000
1200
Phon
es
Cluster 123Centroids

Dendrogram
26