overview of distillers corn oil and feed · pdf fileoverview of distillers corn oil and feed...
TRANSCRIPT
Overview of Distillers Corn Oil and Feed Fat
Joe Riley
General Manager
FEC Solutions


Feed Energy History
1986 Feed Energy Founded
1987 Sioux City Production Facility
Opened
2000 Pacific Junction Production Facility
Opened
2002 Patent Granted for Method for Soapstock
Acidulation
2006 FEC Solutions Formed
All facilities earned Safe Food/Safe Feed
Certification
R&D Director, Mohan Dasari, Receives
Presidential Green Chemistry Award
2010 Decision Innovation Solutions
Formed
2010 Riverhead Resources Formed
2014 Corn Oil ONE facility starts up
2014 Pure Lipid Technologies Formed

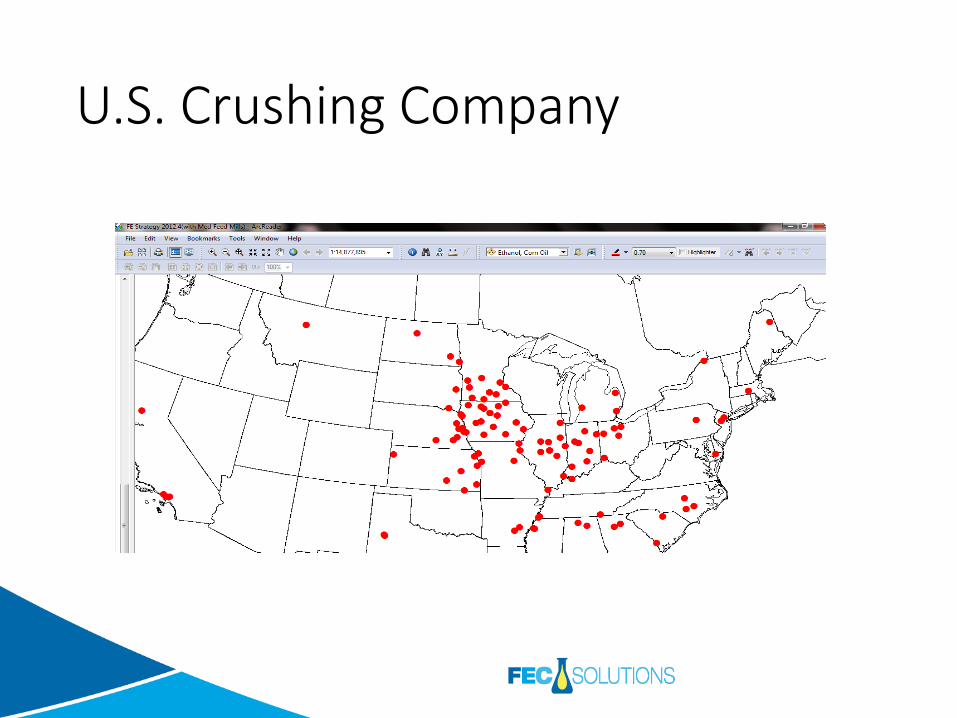
U.S. Crushing Company

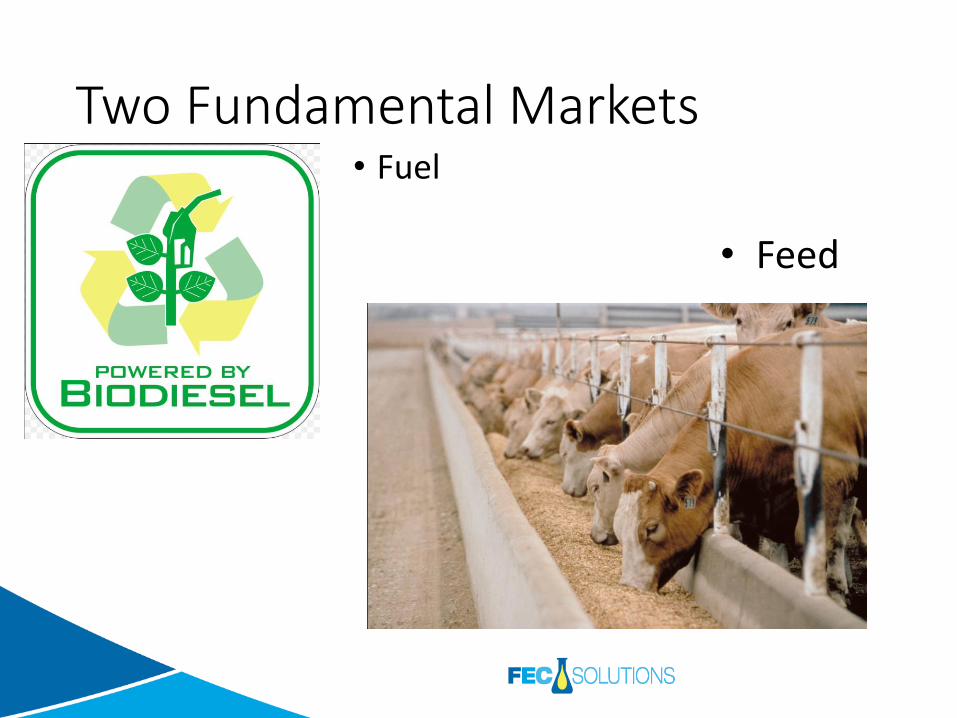
Two Fundamental Markets• Fuel
• Feed
Where should each fat molecule go? Feed or Fuel???
• Mono• Saturated/Unsaturated mix
• Swine
• Poultry
• Fish
• Ruminant• Different animal
• Acidosis
• Rumen Protected fat (mostly Palm Oil)
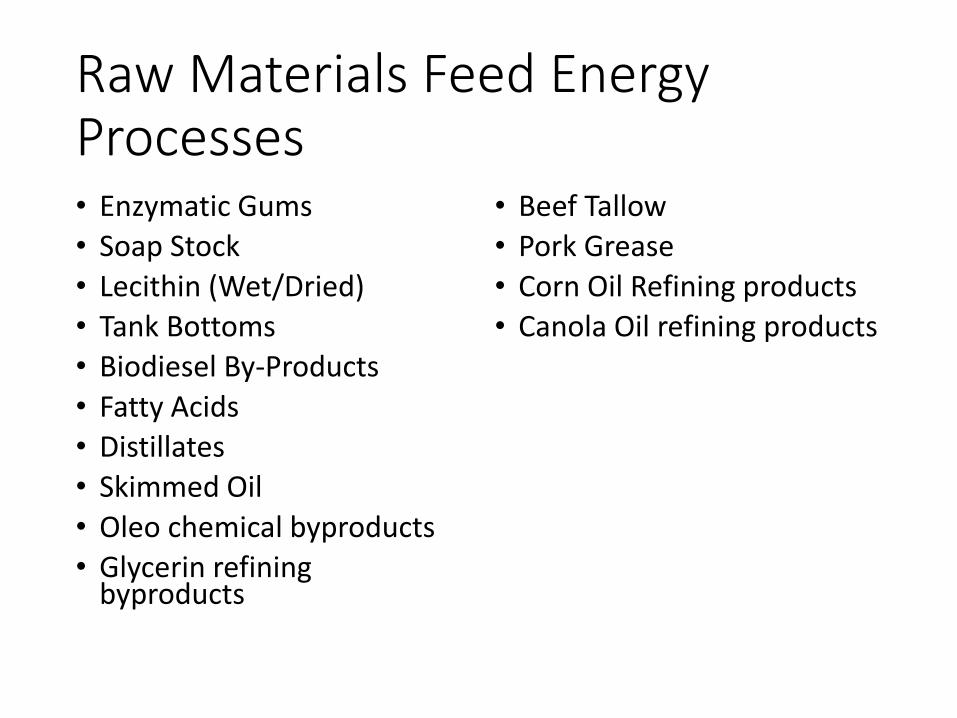
Raw Materials Feed Energy Processes• Enzymatic Gums
• Soap Stock
• Lecithin (Wet/Dried)
• Tank Bottoms
• Biodiesel By-Products
• Fatty Acids
• Distillates
• Skimmed Oil
• Oleo chemical byproducts
• Glycerin refining byproducts
• Beef Tallow
• Pork Grease
• Corn Oil Refining products
• Canola Oil refining products
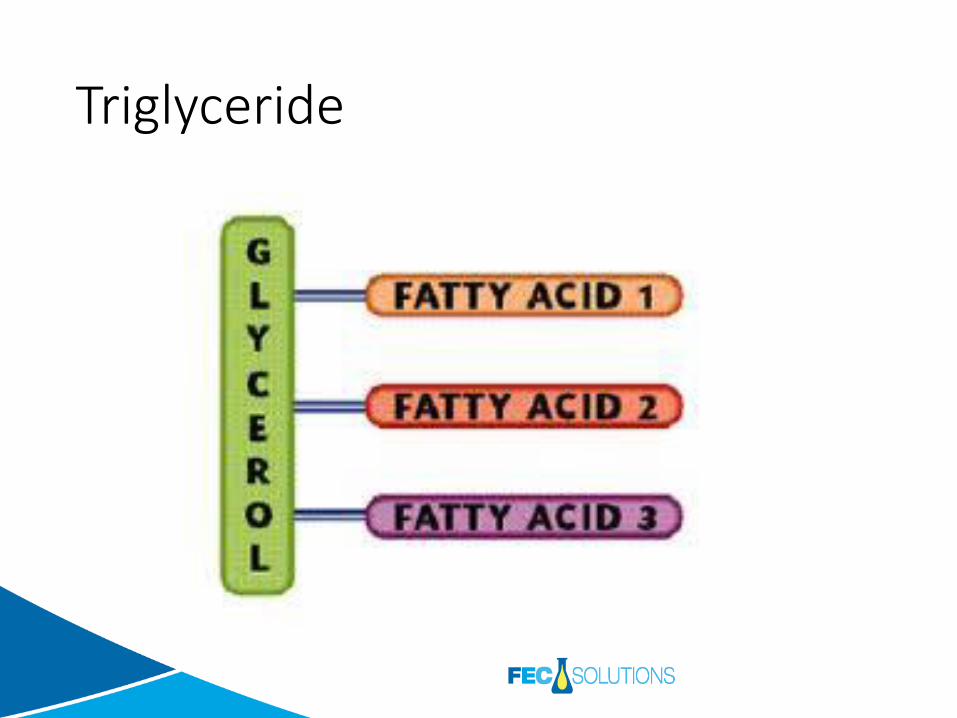
Triglyceride

Triglyceride
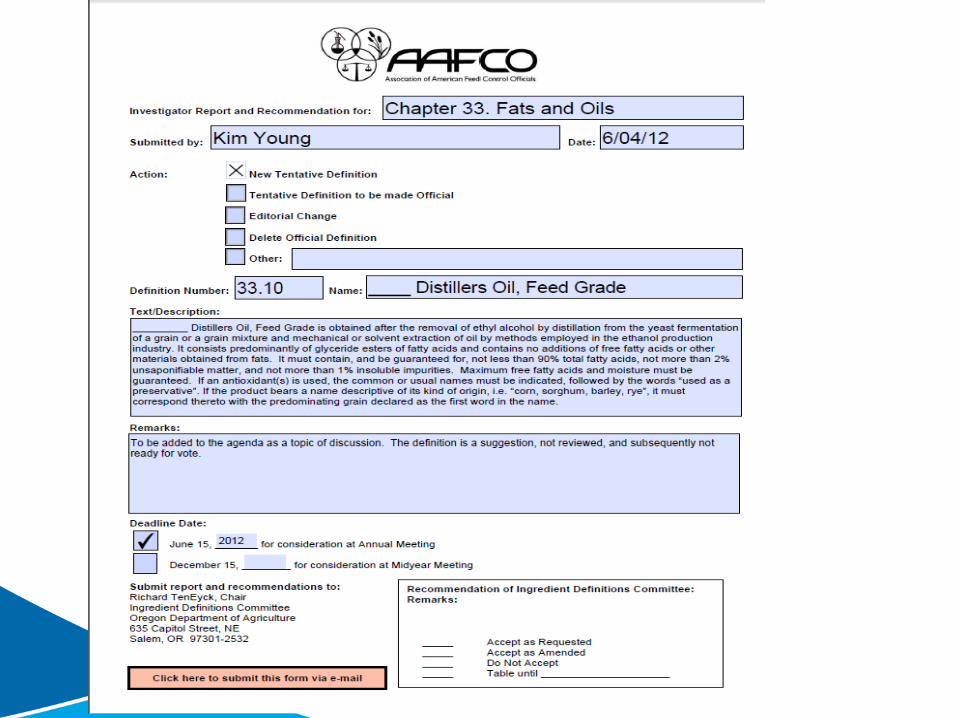
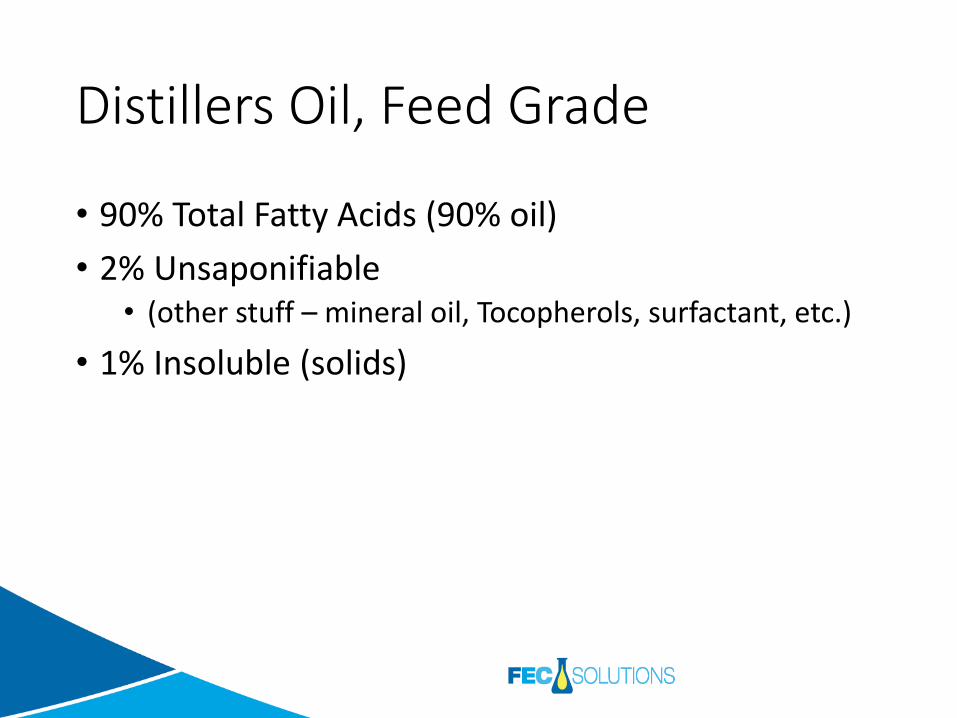
Distillers Oil, Feed Grade
• 90% Total Fatty Acids (90% oil)
• 2% Unsaponifiable• (other stuff – mineral oil, Tocopherols, surfactant, etc.)
• 1% Insoluble (solids)
Ethanol Industry
• 227 EtOH Plants
• >95% extracting Oil (Slower historic adoption rate due to litigation, which seems to have been resolved)
• Use of Surfactant and upstream grinding technology are driving higher extraction rates (litigation could stifle best utilization of surfactants in the industry)
• Best Plants are getting 1 lbs/ground bushel of corn
• Low performers are getting 0.5lbs/ground bushel of corn
• 0.8-0.9 lbs/ bushel is the tipping point for DDGS value sustainability

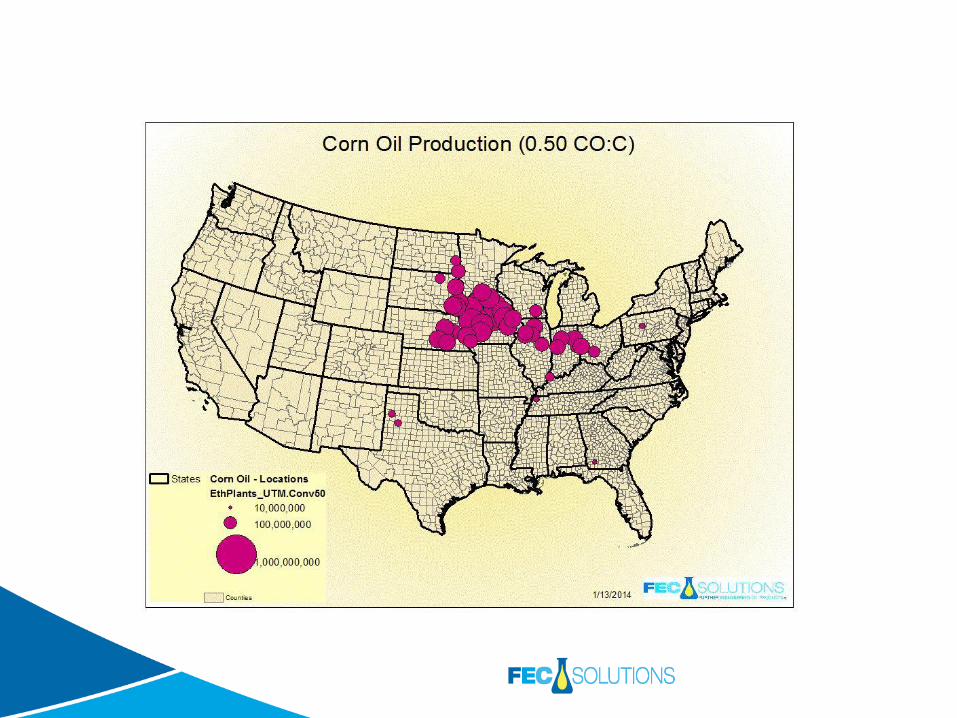
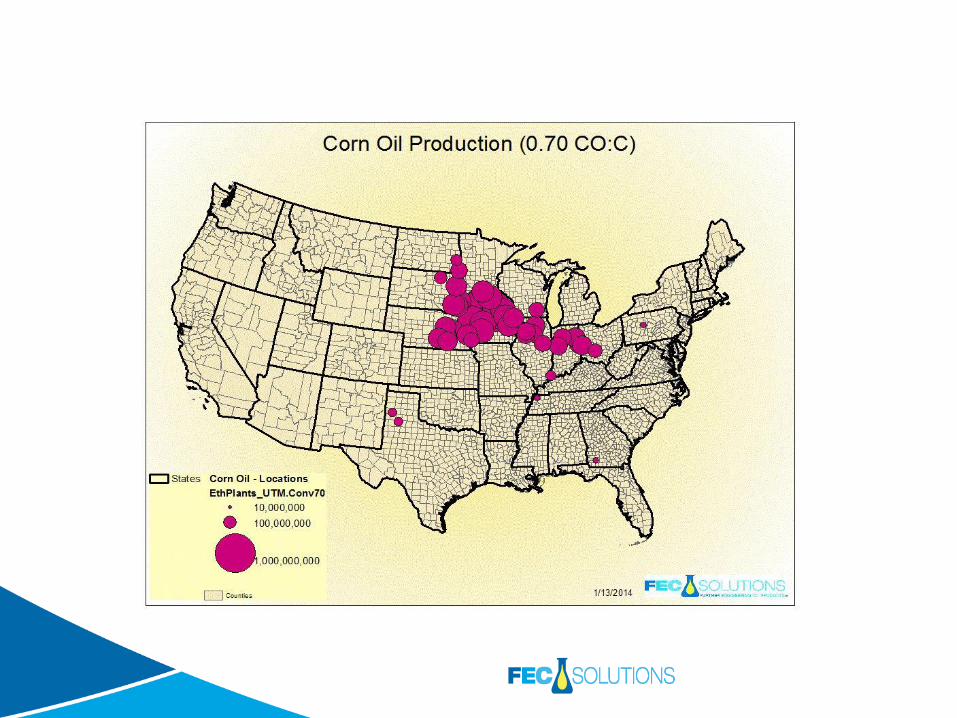
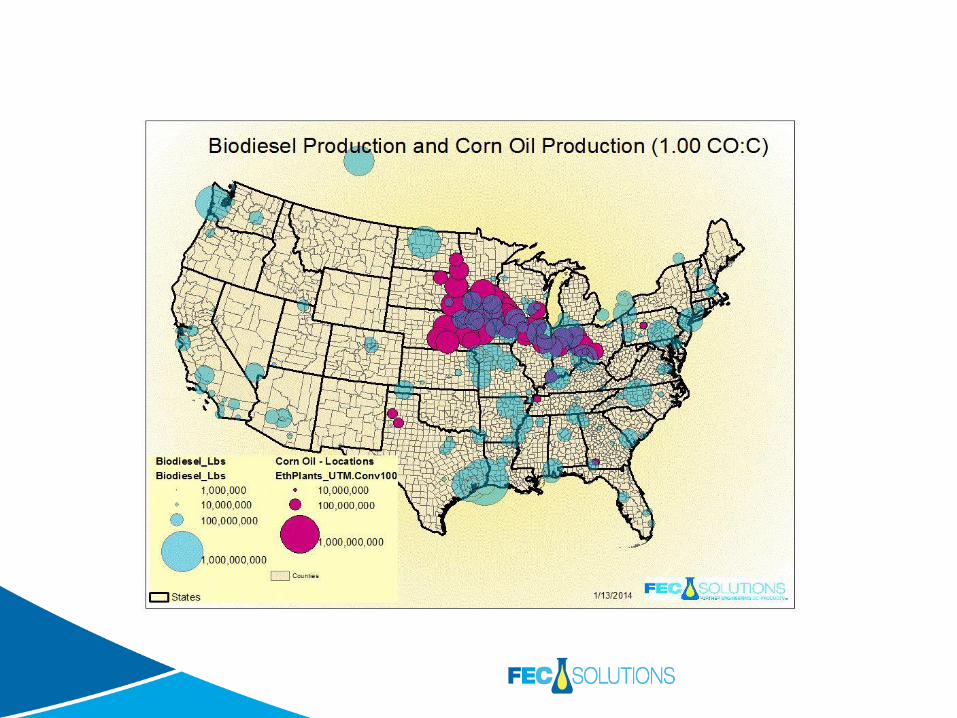
Corn Oil Use Projections
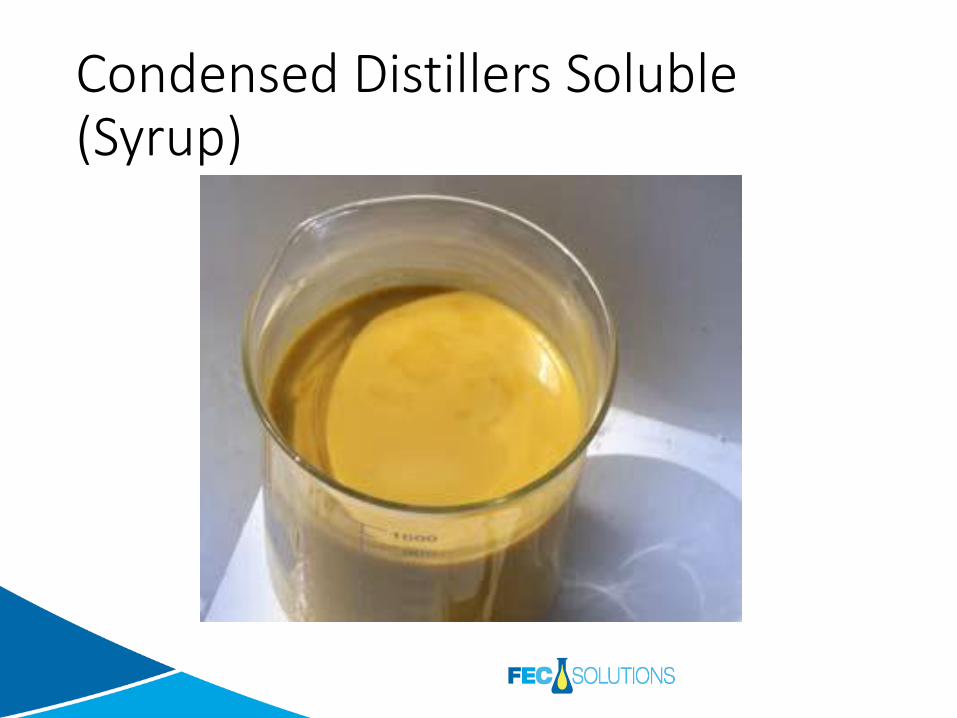
Condensed Distillers Soluble (Syrup)
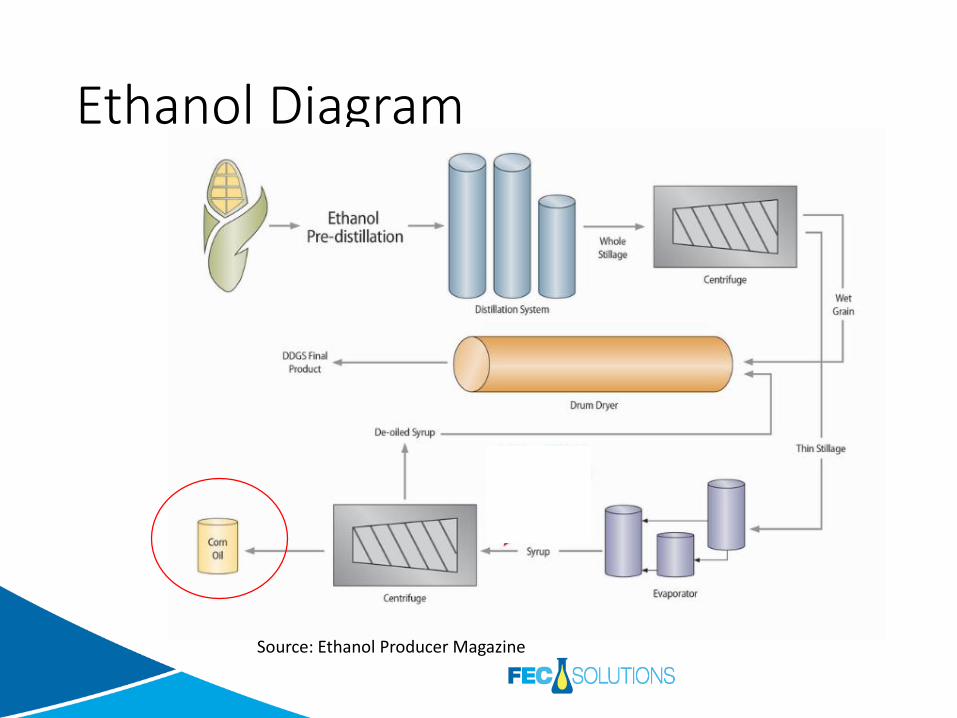
Ethanol Diagram
Source: Ethanol Producer Magazine
How much Corn Oil?
•3 Billion Pounds!!•1228 Trucks/Week!•175 Trucks/Day!!• (1 Truck load is 46,500 lbs)


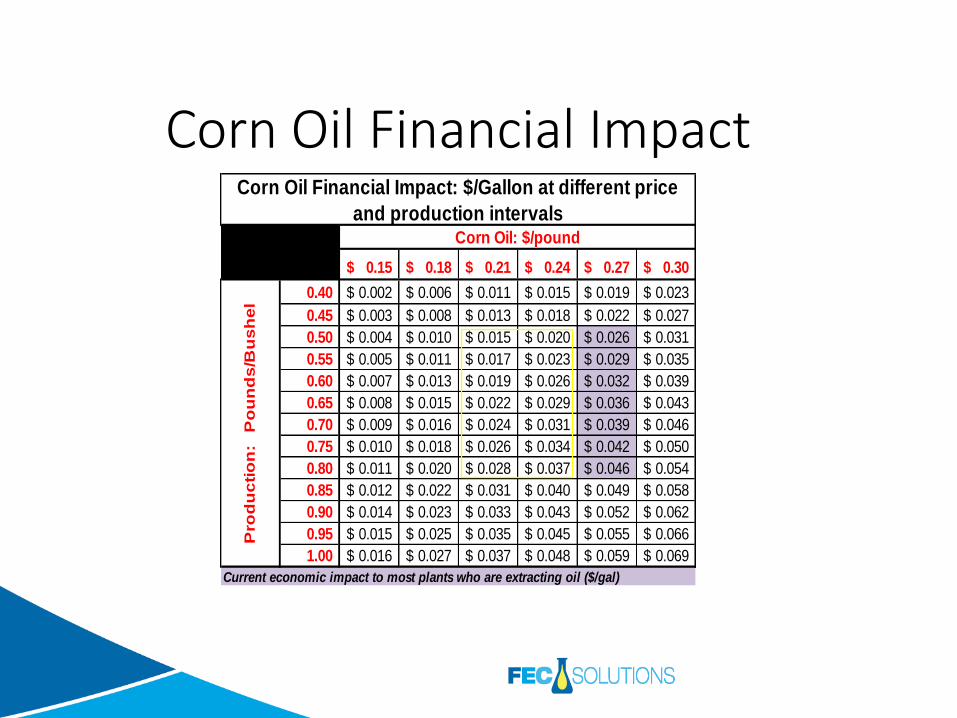
Corn Oil Financial Impact
0.026$ 0.15$ 0.18$ 0.21$ 0.24$ 0.27$ 0.30$
0.40 0.002$ 0.006$ 0.011$ 0.015$ 0.019$ 0.023$
0.45 0.003$ 0.008$ 0.013$ 0.018$ 0.022$ 0.027$
0.50 0.004$ 0.010$ 0.015$ 0.020$ 0.026$ 0.031$
0.55 0.005$ 0.011$ 0.017$ 0.023$ 0.029$ 0.035$
0.60 0.007$ 0.013$ 0.019$ 0.026$ 0.032$ 0.039$
0.65 0.008$ 0.015$ 0.022$ 0.029$ 0.036$ 0.043$
0.70 0.009$ 0.016$ 0.024$ 0.031$ 0.039$ 0.046$
0.75 0.010$ 0.018$ 0.026$ 0.034$ 0.042$ 0.050$
0.80 0.011$ 0.020$ 0.028$ 0.037$ 0.046$ 0.054$
0.85 0.012$ 0.022$ 0.031$ 0.040$ 0.049$ 0.058$
0.90 0.014$ 0.023$ 0.033$ 0.043$ 0.052$ 0.062$
0.95 0.015$ 0.025$ 0.035$ 0.045$ 0.055$ 0.066$
1.00 0.016$ 0.027$ 0.037$ 0.048$ 0.059$ 0.069$
Current economic impact to most plants who are extracting oil ($/gal)
Corn Oil Financial Impact: $/Gallon at different price
and production intervalsCorn Oil: $/pound
Pro
du
cti
on
: P
ou
nd
s/B
us
he
l
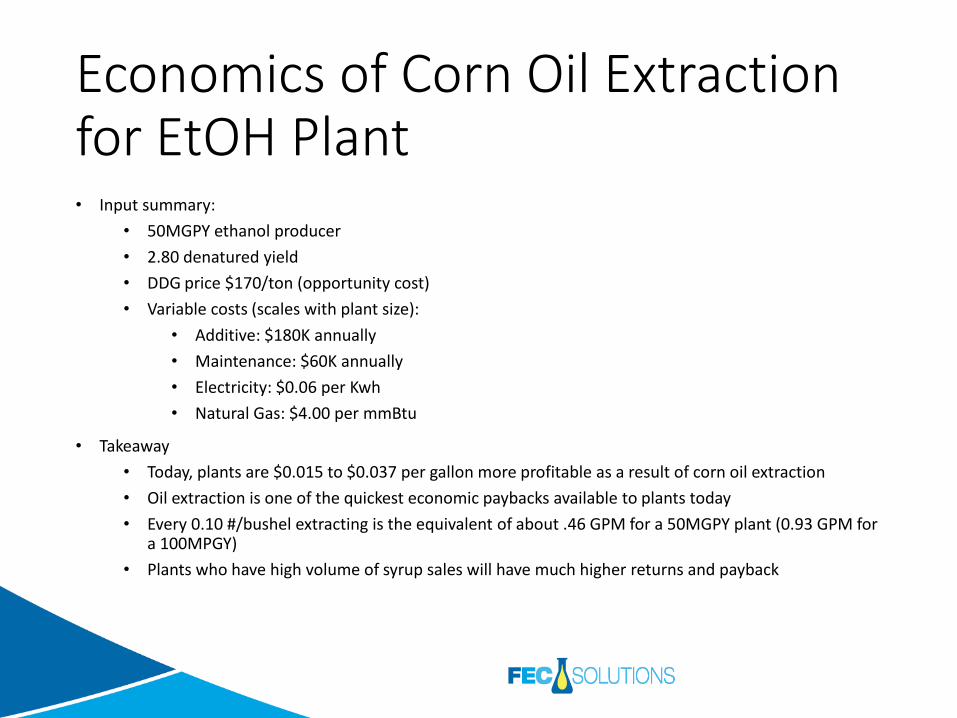
Economics of Corn Oil Extraction for EtOH Plant• Input summary:
• 50MGPY ethanol producer
• 2.80 denatured yield
• DDG price $170/ton (opportunity cost)
• Variable costs (scales with plant size):
• Additive: $180K annually
• Maintenance: $60K annually
• Electricity: $0.06 per Kwh
• Natural Gas: $4.00 per mmBtu
• Takeaway
• Today, plants are $0.015 to $0.037 per gallon more profitable as a result of corn oil extraction
• Oil extraction is one of the quickest economic paybacks available to plants today
• Every 0.10 #/bushel extracting is the equivalent of about .46 GPM for a 50MGPY plant (0.93 GPM for a 100MPGY)
• Plants who have high volume of syrup sales will have much higher returns and payback
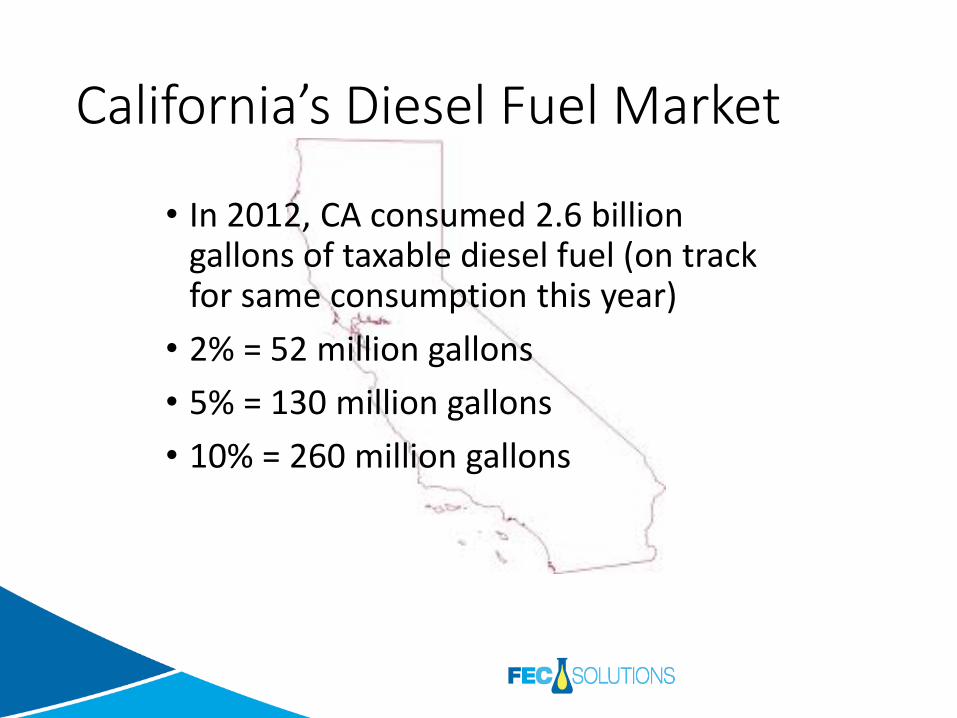
California’s Diesel Fuel Market
• In 2012, CA consumed 2.6 billion gallons of taxable diesel fuel (on track for same consumption this year)
• 2% = 52 million gallons
• 5% = 130 million gallons
• 10% = 260 million gallons
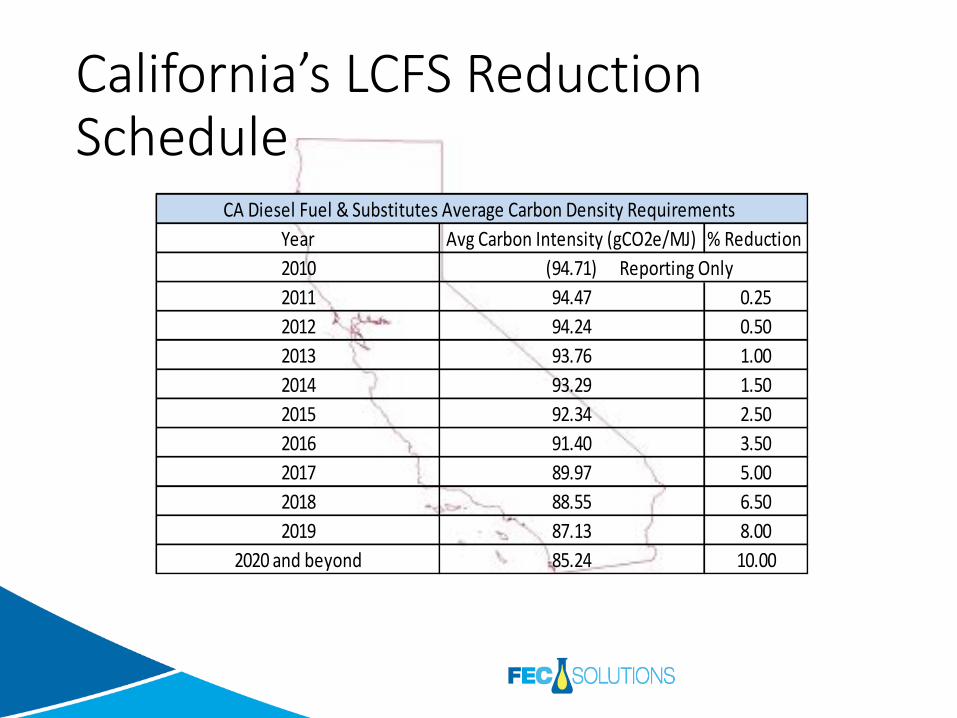
California’s LCFS Reduction Schedule
Year Avg Carbon Intensity (gCO2e/MJ) % Reduction
2010
2011 94.47 0.25
2012 94.24 0.50
2013 93.76 1.00
2014 93.29 1.50
2015 92.34 2.50
2016 91.40 3.50
2017 89.97 5.00
2018 88.55 6.50
2019 87.13 8.00
2020 and beyond 85.24 10.00
(94.71) Reporting Only
CA Diesel Fuel & Substitutes Average Carbon Density Requirements

Total Vegetable Oil Supply, 31,598,197, 72%
Total Animal Fats Supply, 12,528,424, 28%
Total Animal Fats/Veg Oil Supply 44,126,621 (1,000 lbs)
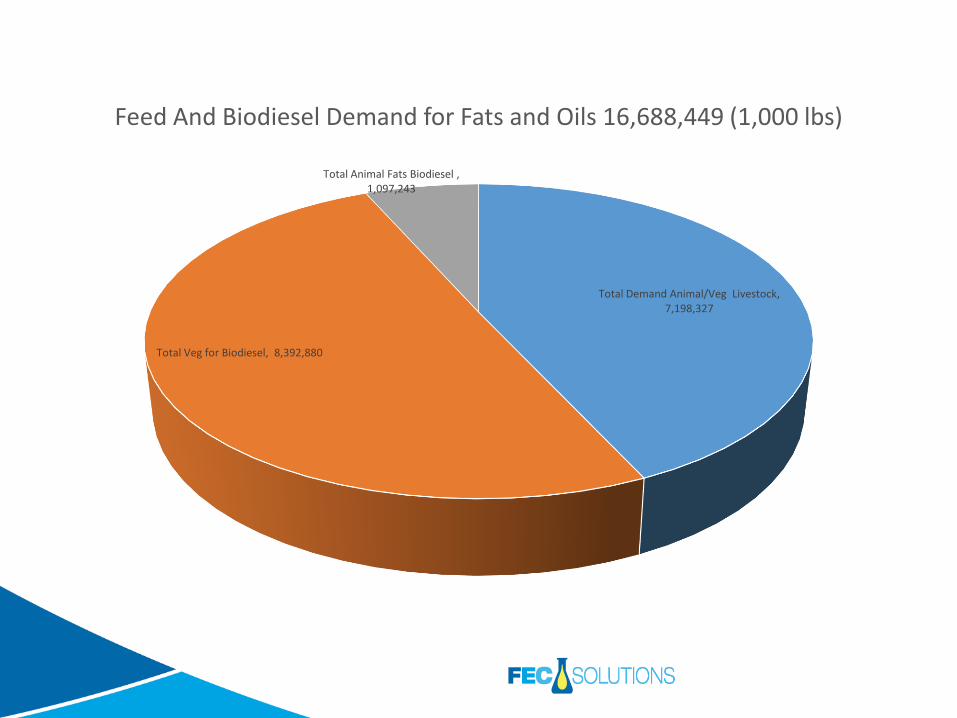
Total Demand Animal/Veg Livestock, 7,198,327
Total Veg for Biodiesel, 8,392,880
Total Animal Fats Biodiesel , 1,097,243
Feed And Biodiesel Demand for Fats and Oils 16,688,449 (1,000 lbs)
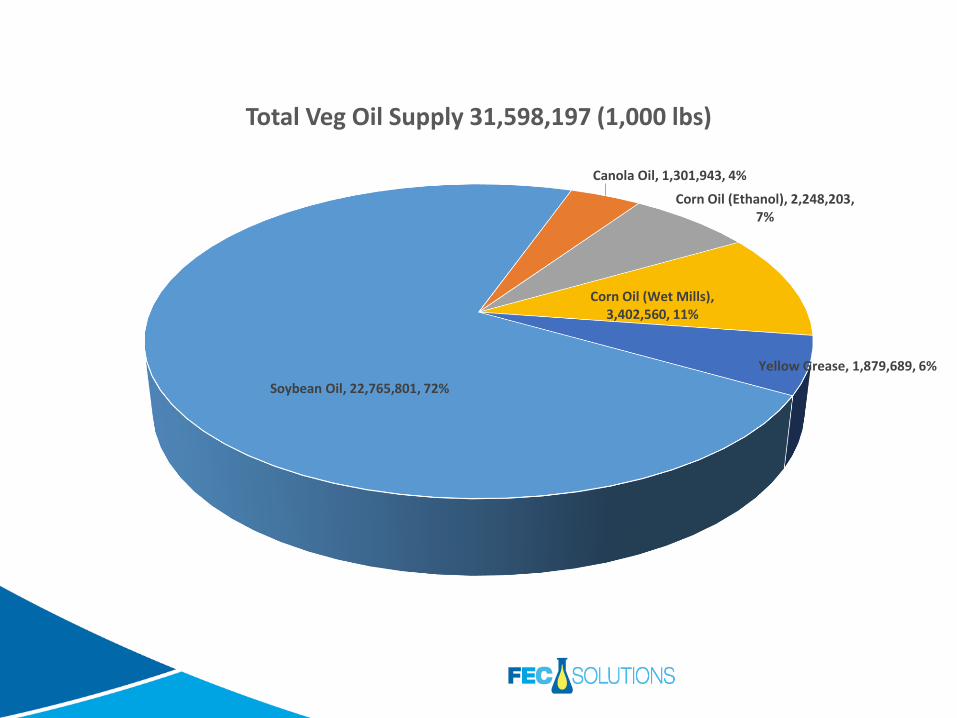
Soybean Oil, 22,765,801, 72%
Canola Oil, 1,301,943, 4%
Corn Oil (Ethanol), 2,248,203, 7%
Corn Oil (Wet Mills), 3,402,560, 11%
Yellow Grease, 1,879,689, 6%
Total Veg Oil Supply 31,598,197 (1,000 lbs)
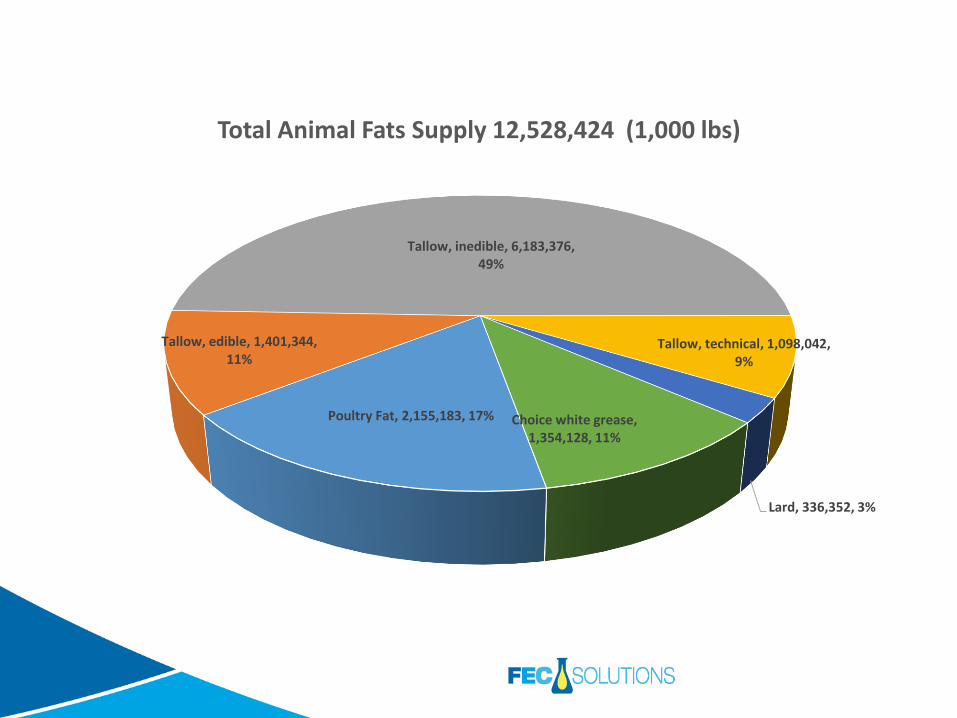
Poultry Fat, 2,155,183, 17%
Tallow, edible, 1,401,344, 11%
Tallow, inedible, 6,183,376, 49%
Tallow, technical, 1,098,042, 9%
Lard, 336,352, 3%
Choice white grease, 1,354,128, 11%
Total Animal Fats Supply 12,528,424 (1,000 lbs)
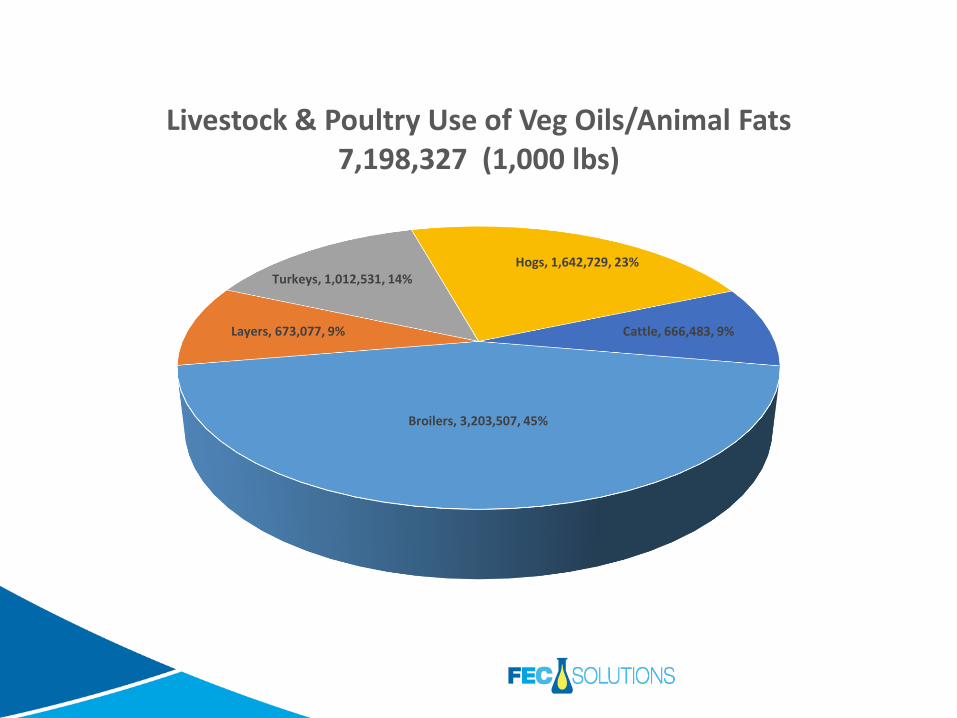
Broilers, 3,203,507, 45%
Layers, 673,077, 9%
Turkeys, 1,012,531, 14%Hogs, 1,642,729, 23%
Cattle, 666,483, 9%
Livestock & Poultry Use of Veg Oils/Animal Fats 7,198,327 (1,000 lbs)
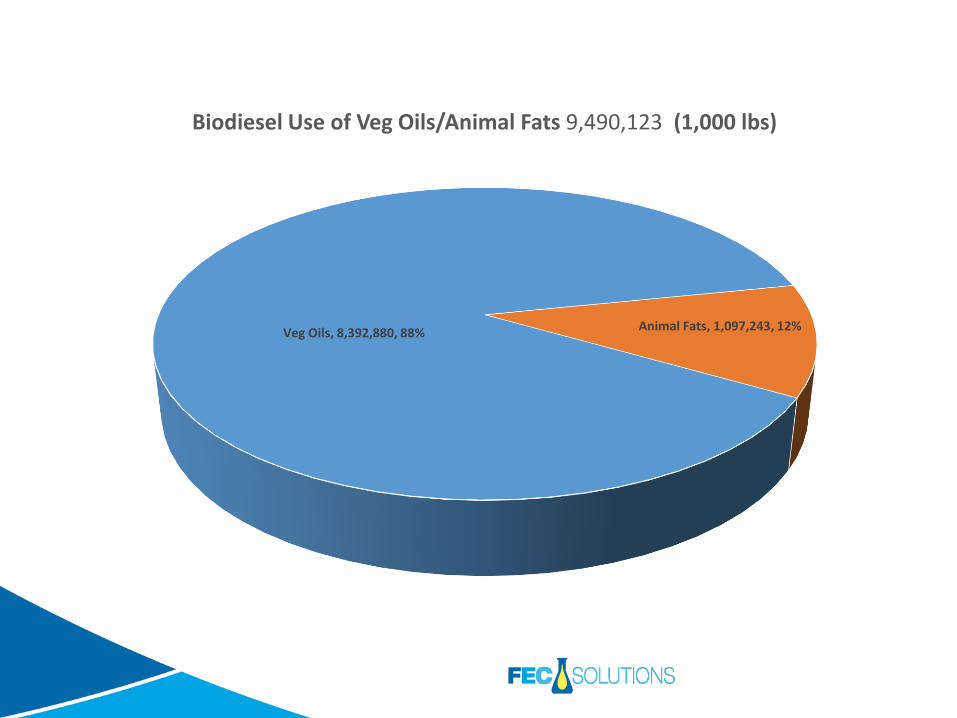
Veg Oils, 8,392,880, 88% Animal Fats, 1,097,243, 12%
Biodiesel Use of Veg Oils/Animal Fats 9,490,123 (1,000 lbs)

-
5,000,000
10,000,000
15,000,000
20,000,000
25,000,000
30,000,000
35,000,000
40,000,000
45,000,000
50,000,000
Total Anim/VegSupply
Net SupplyAnimal/Veg After
Biodiesel
Net Animal VegAfter LivestockConsumption
Fats and Oils Availability (1,000 lbs)
Key Takeaways For Corn Oil
• New Technology to clean up corn oil to create more access to markets
• Corn oil supply has increased greatly the past few years
• More supply to come, but mostly by way of process improvements
• Strong usage into feed, but greatest potential into biomass-based diesel production

Q & A
Joe Riley
General Manager
www.fecsolutions.com

Thank You
Joe Riley
515-537-4000
www.feedenergy.com
www.fecsolutions.com
www.cornoilone.com