overview of fabric manager€ removing data collection files from the list, page 3-19 launching...
TRANSCRIPT
Cisco MDS 9000 FabrOL-7753-01
C H A P T E R 3
Overview of Fabric ManagerThis chapter contains descriptions of, and instructions for using, the Cisco MDS 9000 Fabric Manager.
This chapter contains the following topics:
• Launching Cisco Fabric Manager, page 3-1
• Using Fabric Manager, page 3-2
• Discovering and Viewing the Network Fabric, page 3-7
• Controlling Administrator Access with Users and Roles, page 3-7
• Modifying Device Grouping, page 3-7
• Setting Fabric Manager Preferences, page 3-8
• Viewing Reports in Fabric Manager, page 3-9
• Using Device Manager, page 3-10
• Using Performance Manager, page 3-14
• Configuring PM for Use with Cisco Traffic Analyzer, page 3-16
• Stopping Data Collection, page 3-19
• Exporting Data Collection to XML Files, page 3-19
• Removing Data Collection Files from the List, page 3-19
Launching Cisco Fabric ManagerWhen you click on the Fabric Manager icon, the dialog box allows you to enter the IP address of a computer running the FMServer component. If the server component is running on your local machine, leave “localhost” in that field. If you try to run Fabric Manager without specifying a valid server, you are prompted to start the FMServer.
On a Windows PC, you install the FMServer as a service. This service can then be administered using the Service Panel in the Control Panel. The default setting for the FMServer service is that the server is automatically started when the machine is rebooted. You can change this behavior by modifying the properties in the Service panel.
Note If your computer has multiple interface cards (NICs), choose a local interface that can reach Fibre Channel network on clients and on the server.
3-1ic Manager Switch Configuration Guide

Chapter 3 Overview of Fabric Manager Using Fabric Manager
Using Fabric ManagerThe Fabric Manager displays a view of your network fabric, including Cisco MDS 9000 and third-party switches and end devices. To launch the Fabric Manager from your desktop, double-click the Fabric Manager icon and follow the instructions described in the “Launching the Applications” section on page 2-6. The figure below shows the Fabric Manager main window.
Note Changes made using Fabric Manager are applied to the running configuration of the switches you are managing and the changes may not be saved when the switch restarts. After you make a change to the configuration or perform an operation (such as activating zones), Fabric Manager prompts you to save your changes before you exit.
Figure 3-1 Fabric Manager Main Window
The menu bar at the top of the Fabric Manager window provides access to options, that are organized by menus (see Number 1, Figure 3-1). The toolbar provides icons that duplicate the most commonly used options on the File, Tools, and Help menus (see Number 2, Figure 3-1).
3-2Cisco MDS 9000 Fabric Manager Switch Configuration Guide
OL-7753-01
Chapter 3 Overview of Fabric Manager Using Fabric Manager
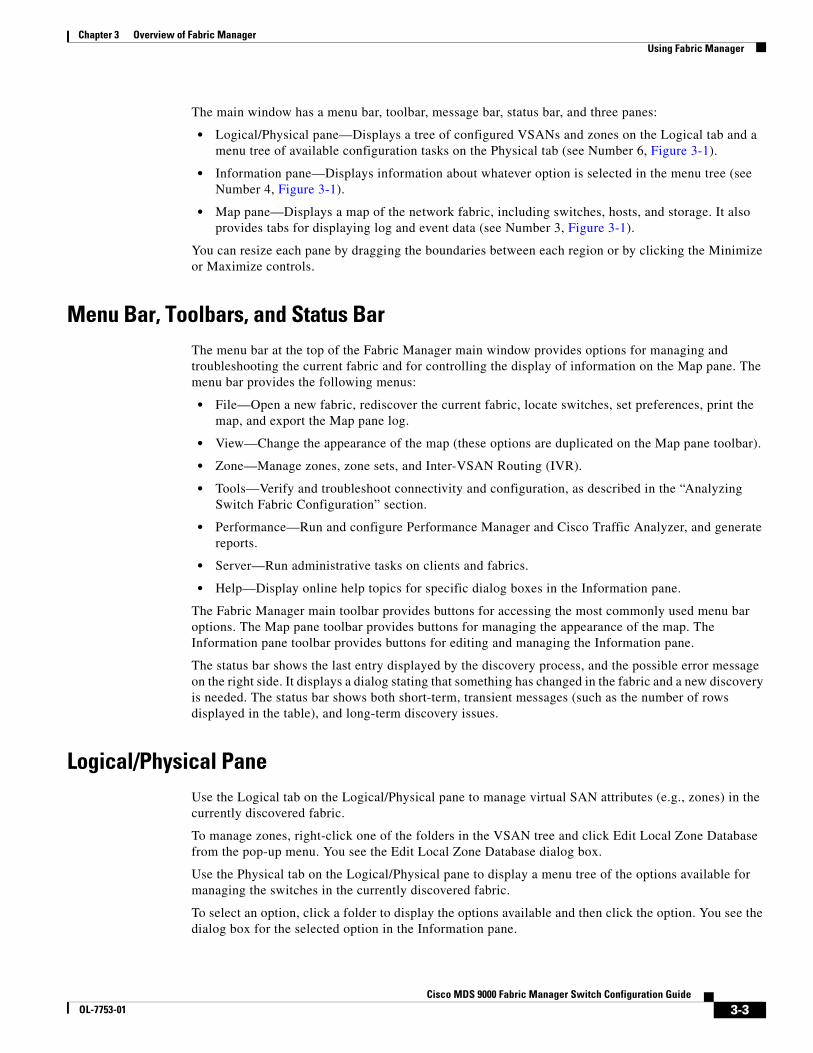
The main window has a menu bar, toolbar, message bar, status bar, and three panes:
• Logical/Physical pane—Displays a tree of configured VSANs and zones on the Logical tab and a menu tree of available configuration tasks on the Physical tab (see Number 6, Figure 3-1).
• Information pane—Displays information about whatever option is selected in the menu tree (see Number 4, Figure 3-1).
• Map pane—Displays a map of the network fabric, including switches, hosts, and storage. It also provides tabs for displaying log and event data (see Number 3, Figure 3-1).
You can resize each pane by dragging the boundaries between each region or by clicking the Minimize or Maximize controls.
Menu Bar, Toolbars, and Status BarThe menu bar at the top of the Fabric Manager main window provides options for managing and troubleshooting the current fabric and for controlling the display of information on the Map pane. The menu bar provides the following menus:
• File—Open a new fabric, rediscover the current fabric, locate switches, set preferences, print the map, and export the Map pane log.
• View—Change the appearance of the map (these options are duplicated on the Map pane toolbar).
• Zone—Manage zones, zone sets, and Inter-VSAN Routing (IVR).
• Tools—Verify and troubleshoot connectivity and configuration, as described in the “Analyzing Switch Fabric Configuration” section.
• Performance—Run and configure Performance Manager and Cisco Traffic Analyzer, and generate reports.
• Server—Run administrative tasks on clients and fabrics.
• Help—Display online help topics for specific dialog boxes in the Information pane.
The Fabric Manager main toolbar provides buttons for accessing the most commonly used menu bar options. The Map pane toolbar provides buttons for managing the appearance of the map. The Information pane toolbar provides buttons for editing and managing the Information pane.
The status bar shows the last entry displayed by the discovery process, and the possible error message on the right side. It displays a dialog stating that something has changed in the fabric and a new discovery is needed. The status bar shows both short-term, transient messages (such as the number of rows displayed in the table), and long-term discovery issues.
Logical/Physical PaneUse the Logical tab on the Logical/Physical pane to manage virtual SAN attributes (e.g., zones) in the currently discovered fabric.
To manage zones, right-click one of the folders in the VSAN tree and click Edit Local Zone Database from the pop-up menu. You see the Edit Local Zone Database dialog box.
Use the Physical tab on the Logical/Physical pane to display a menu tree of the options available for managing the switches in the currently discovered fabric.
To select an option, click a folder to display the options available and then click the option. You see the dialog box for the selected option in the Information pane.
3-3Cisco MDS 9000 Fabric Manager Switch Configuration Guide
OL-7753-01

Chapter 3 Overview of Fabric Manager Using Fabric Manager
The Physical tree provides the following main folders:
• Switches—View and configure hardware, system, licensing, and configuration files.
• Interfaces—View and configure FC Physical, FC Logical, Ethernet, SVC, and Port Channels interfaces.
• FC—View and configure Fibre Channel network configurations.
• IP—View and configure IP storage and IP services.
• Events—View and configure events, alarms, thresholds, notifications, and informs.
• Security—View and configure MDS management and FC-SP security.
• Connectivity—View and configure ISLs, Hosts, and Storage components.
Information PaneThe Information pane displays tables or other information associated with the option selected from the menu tree. The Information pane toolbar provides buttons for performing one or more of the following operations:
• Apply Change— Apply configuration changes.
• Refresh Value— Refresh table values.
• Copy (Ctrl-C)—Copy data from one row to another.
• Paste (Ctrl-V)—Paste the data from one row to another.
• Undo Changes (Ctrl-Z) —Undo the most recent change.
• Export—Export and save information to a file.
• Print Table—Print the contents of the Information pane.
Note After making changes you must save the configuration or the changes will be lost when the device is restarted.
Note The buttons that appear on the toolbar vary according to the option you select. They are activated or deactivated (grayed) according to the field or other object that you select in the Information pane.
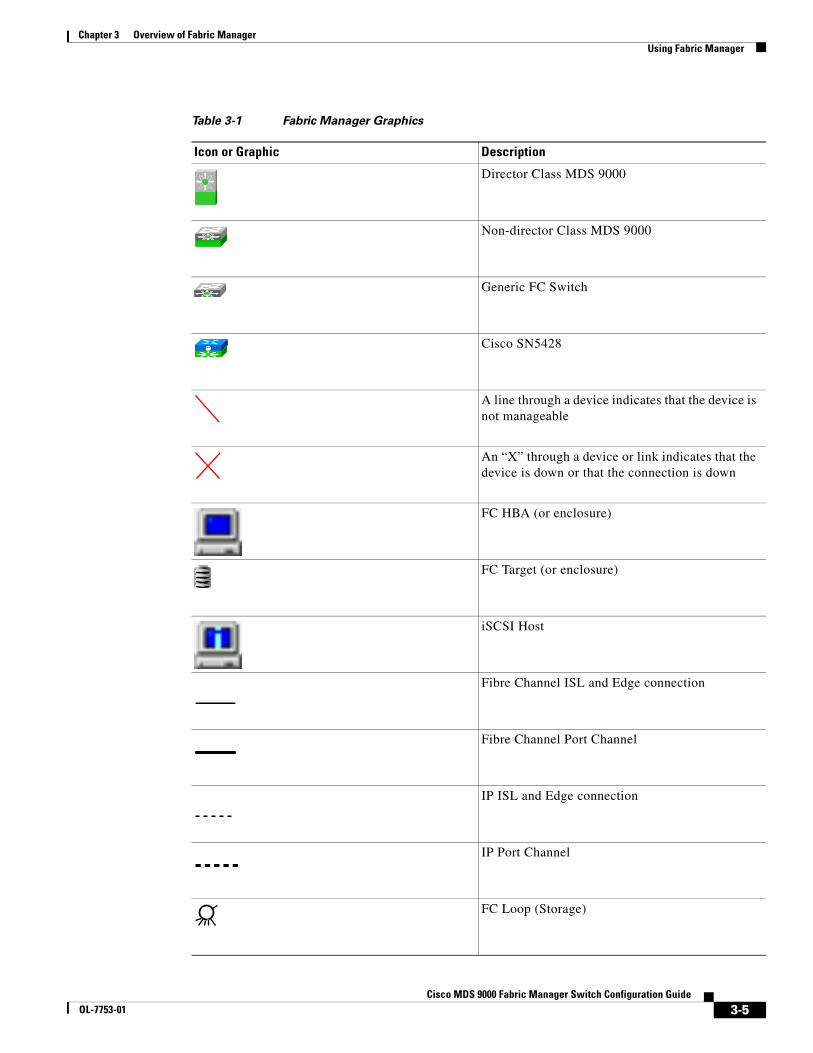
Map PaneThe Map pane shows the graphical representation of your fabric.Table 3-1 explains the graphics you may see displayed, depending on which devices you have in your fabric.
3-4Cisco MDS 9000 Fabric Manager Switch Configuration Guide
OL-7753-01
Chapter 3 Overview of Fabric Manager Using Fabric Manager
Table 3-1 Fabric Manager Graphics
Icon or Graphic Description
Director Class MDS 9000
Non-director Class MDS 9000
Generic FC Switch
Cisco SN5428
A line through a device indicates that the device is not manageable
An “X” through a device or link indicates that the device is down or that the connection is down
FC HBA (or enclosure)
FC Target (or enclosure)
iSCSI Host
Fibre Channel ISL and Edge connection
Fibre Channel Port Channel
IP ISL and Edge connection
IP Port Channel
FC Loop (Storage)
iSAN
3-5Cisco MDS 9000 Fabric Manager Switch Configuration Guide
OL-7753-01

Chapter 3 Overview of Fabric Manager Using Fabric Manager
There are three tabs on the bottom of the Map pane:
• Map—Displays a graphical view of the network fabric with switches, hosts, and storage subsystems.
• Log—Displays messages that describe Fabric Manager operations, such as fabric discovery.
• Events—Displays information about the SNMP traps received by the management station.
When viewing large fabrics in the Map pane, it is helpful to:
• Turn off end device labels
• Collapse loops
• Collapse expanded multiple links (collapsed multiple links are shown as very thick single lines)
• Dim or hide portions of your fabric by VSAN
When you right-click an icon, you see a pop-up menu with options that vary depending on the type of icon selected. The various options available for different objects include the following:
• Open an instance of Device Manager for the selected switch.
• Open a CLI session for the selected switch.
• Copy the display name of the selected object.
• Execute a ping or traceroute command for the device.
• Show or hide end devices.
• View attributes
• Quiesce and Disable Members for PortChannels
• Set the trunking mode for an ISL.
• Create or add to a PortChannel for selected ISLs.
The Map pane has its own toolbar with options for saving, printing, and changing the appearance of the map. When you right-click on the map, a pop-up menu appears that provides options (duplicated on the toolbar) for changing the appearance of the map.
Note When a VSAN, zone, or zone member is selected in the VSAN tree, the map highlighting changes to identify the selected objects. To remove this highlighting, click the Clear Highlight button on the Map pane toolbar or choose Clear Highlight from the pop-up menu.
IP Cloud (Hosts)
Any device, cloud, or loop with a box around it means that there are hidden links attached
Table 3-1 Fabric Manager Graphics (continued)
Icon or Graphic Description
3-6Cisco MDS 9000 Fabric Manager Switch Configuration Guide
OL-7753-01

Chapter 3 Overview of Fabric Manager Discovering and Viewing the Network Fabric
Discovering and Viewing the Network FabricCisco Fabric Manager collects information on the fabric topology through SNMP queries to the switches connected to Fabric Manager. The switch replies after having discovered all devices connected to the fabric by using the information coming from its FSPF technology database and the Name Server database, and collected using the Fabric Configuration Server’s request/response mechanisms defined by the FC-GS3/4 standard. When you start the Fabric Manager, you enter the IP address (or host name) of a “seed” switch for discovery.
After you start Fabric Manager and discovery completes, Fabric Manager presents you with a view of your network fabric, including all discovered switches, hosts, and storage devices.
Controlling Administrator Access with Users and RolesCisco MDS 9000 Family switches support role-based management access whether using the CLI or the Cisco Fabric Manager. This lets you assign specific management privileges to particular roles and then assign one or more users to each role.
Cisco Fabric Manager uses SNMPv3 to establish role-based management access. After completing the setup routine, a single role, user name, and password are established. The role assigned to this user allows the highest level of privileges, which includes creating new users and roles. Use the Cisco Fabric Manager to create roles and users, and to assign passwords as required for secure management access in your network.
Modifying Device GroupingBecause of not all the devices are capable of responding to FC-GS3 requests, different ports of a single server or storage subsystem may be displayed as individual end devices on the Fabric Manager map.
To group end devices in a single enclosure in order to have them represented by a single icon on the map, follow these steps:
Step 1 Select Storage or Hosts from the Fabric Manager’s Physical tree in the Navigation pane.
The end devices appear in the Information pane.
Step 2 Click on the Name field for one of the devices you want to be in the enclosure.
Step 3 Enter a name to identify the new enclosure’s icon on the Fabric Manager Map pane.
Step 4 Click once on the Name field for that device. To select more than one Name, hold down the Shift key and click each of the other Names.
Step 5 Press Ctrl-C to copy the selected Name(s).
Step 6 Press Ctrl-V to paste the name into the Name field for that device.
Note To remove devices from an enclosure, triple click on the name of the device and press Delete. To remove an enclosure, repeat this step for each device in the enclosure.
3-7Cisco MDS 9000 Fabric Manager Switch Configuration Guide
OL-7753-01
Chapter 3 Overview of Fabric Manager Setting Fabric Manager Preferences
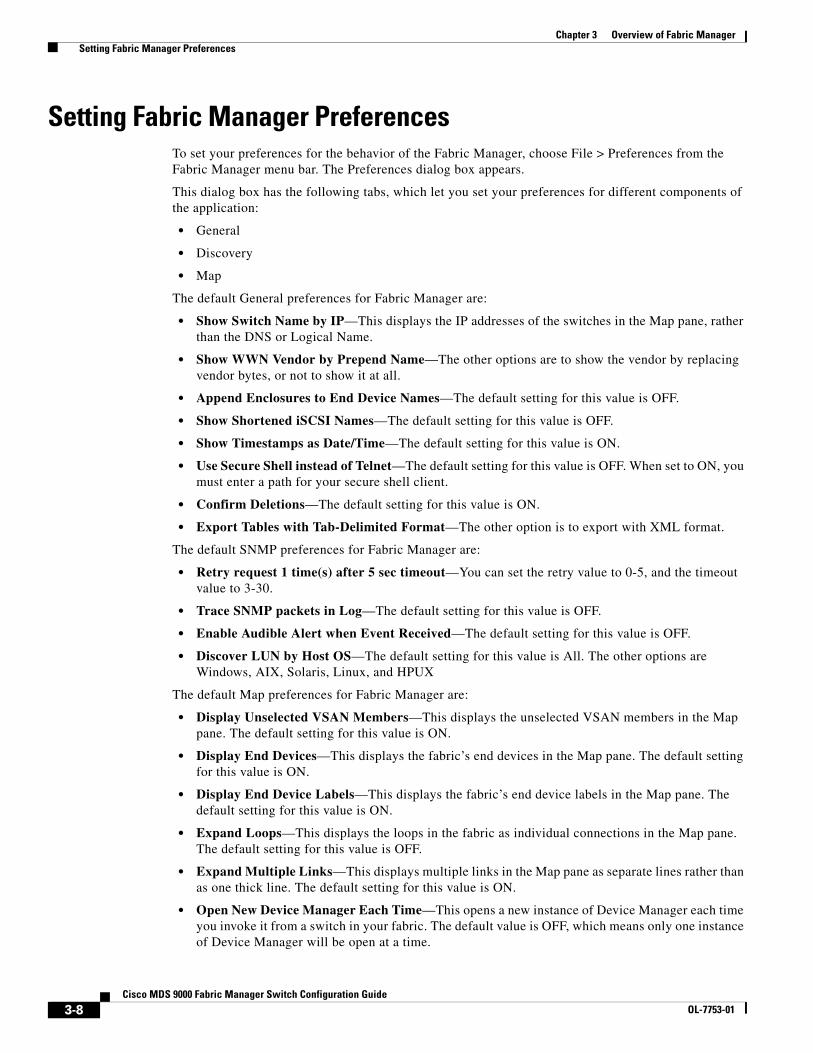
Setting Fabric Manager PreferencesTo set your preferences for the behavior of the Fabric Manager, choose File > Preferences from the Fabric Manager menu bar. The Preferences dialog box appears.
This dialog box has the following tabs, which let you set your preferences for different components of the application:
• General
• Discovery
• Map
The default General preferences for Fabric Manager are:
• Show Switch Name by IP—This displays the IP addresses of the switches in the Map pane, rather than the DNS or Logical Name.
• Show WWN Vendor by Prepend Name—The other options are to show the vendor by replacing vendor bytes, or not to show it at all.
• Append Enclosures to End Device Names—The default setting for this value is OFF.
• Show Shortened iSCSI Names—The default setting for this value is OFF.
• Show Timestamps as Date/Time—The default setting for this value is ON.
• Use Secure Shell instead of Telnet—The default setting for this value is OFF. When set to ON, you must enter a path for your secure shell client.
• Confirm Deletions—The default setting for this value is ON.
• Export Tables with Tab-Delimited Format—The other option is to export with XML format.
The default SNMP preferences for Fabric Manager are:
• Retry request 1 time(s) after 5 sec timeout—You can set the retry value to 0-5, and the timeout value to 3-30.
• Trace SNMP packets in Log—The default setting for this value is OFF.
• Enable Audible Alert when Event Received—The default setting for this value is OFF.
• Discover LUN by Host OS—The default setting for this value is All. The other options are Windows, AIX, Solaris, Linux, and HPUX
The default Map preferences for Fabric Manager are:
• Display Unselected VSAN Members—This displays the unselected VSAN members in the Map pane. The default setting for this value is ON.
• Display End Devices—This displays the fabric’s end devices in the Map pane. The default setting for this value is ON.
• Display End Device Labels—This displays the fabric’s end device labels in the Map pane. The default setting for this value is ON.
• Expand Loops—This displays the loops in the fabric as individual connections in the Map pane. The default setting for this value is OFF.
• Expand Multiple Links—This displays multiple links in the Map pane as separate lines rather than as one thick line. The default setting for this value is ON.
• Open New Device Manager Each Time—This opens a new instance of Device Manager each time you invoke it from a switch in your fabric. The default value is OFF, which means only one instance of Device Manager will be open at a time.
3-8Cisco MDS 9000 Fabric Manager Switch Configuration Guide
OL-7753-01

Chapter 3 Overview of Fabric Manager Viewing Reports in Fabric Manager
• Layout New Devices Automatically—This automatically places new devices in the Map pane in an optimal configuration. The default setting for this value is OFF. In this mode, when you add a new device, you must manually reposition it if the initial position does not suit your needs.
• Use Quick Layout when Switch has >=30 End Devices—The default setting for this value is 30. You can enter any number in this field. Enter 0 to disable Quick Layout.
• Override Preferences for Non-default Layout—The default setting for this value is ON.
• Automatically Save Layout—When this option is enabled, any changes in layout are automatically saved. The default setting for this value is ON.
Viewing Reports in Fabric ManagerThe Fabric Manager provides a series of reports, showing various information in tabular form. When you select one of these options, you see the available information in tabular form in the Information pane of the Fabric Manager main window. The table below describes the reports provided by each option.
Table 3-2 Fabric Manager Reports
Reports Description
ISL Statistics Click on Connectivity > ISLs > Statistics in the Physical tab of the Fabric Manager Logical/Physical pane to display information about the Inter-Switch Links in the currently discovered fabric. You can use the controls at the top of the table to change the Poll Interval and Scale parameters.
ISL Choose Connectivity > ISLs in the Physical tab of the Fabric Manager Logical/Physical pane to display information about the Inter-Switch links in the currently discovered fabric.
Switches Choose Switches in the Physical tab of the Fabric Manager Logical/Physical pane to display information about the switches in the currently discovered fabric.
Hosts Choose Connectivity > Hosts in the Physical tab of the Fabric Manager Logical/Physical pane to display information about the hosts in the currently discovered fabric.
Storage Choose Connectivity > Storage in the Physical tab of the Fabric Manager Logical/Physical pane to display information about the links to hosts and storage in the currently discovered fabric.
LUNs Choose Connectivity > Storage > LUNs in the Physical tab of the Fabric Manager Logical/Physical pane to display information about the LUNs in the currently discovered fabric.
3-9Cisco MDS 9000 Fabric Manager Switch Configuration Guide
OL-7753-01
Chapter 3 Overview of Fabric Manager Using Device Manager
Using Device ManagerDevice Manager provides a physical representation of your switch chassis, with the modules, ports, power supplies, and fan assemblies. The menu bar at the top of the Device Manager window provides access to options, organized into menus that correspond to the menu tree in Fabric Manager.
The legend at the bottom right of the Device Manager indicates port status, as follows:
• Green—The port is up.
• Brown—The port is administratively down.
• Red—The port is down or has failed.
• Gray—The port is unreachable.
Launching Device Manager from Fabric ManagerDevice Manager gives a graphic representation of a Cisco MDS 9000 Family switch, including the installed switching modules, the supervisor modules, the power supplies, and the status of each port within each module.
To launch the Device Manager from your desktop, double-click the Device Manager icon and follow the instructions described in the “Launching the Applications” section.
To launch Device Manager from Fabric Manager, right-click the switch you want to manage on the Fabric Manager map and click Device Manager from the pop-up menu that appears. The Device Manager main window is shown below.
Device Manager can also be started by double-clicking on a switch in the Fabric Manager topology view, or by selecting a switch in the Fabric Manager Map page and choosing the Device Manager option from the Tools menu.
3-10Cisco MDS 9000 Fabric Manager Switch Configuration Guide
OL-7753-01
Chapter 3 Overview of Fabric Manager Using Device Manager
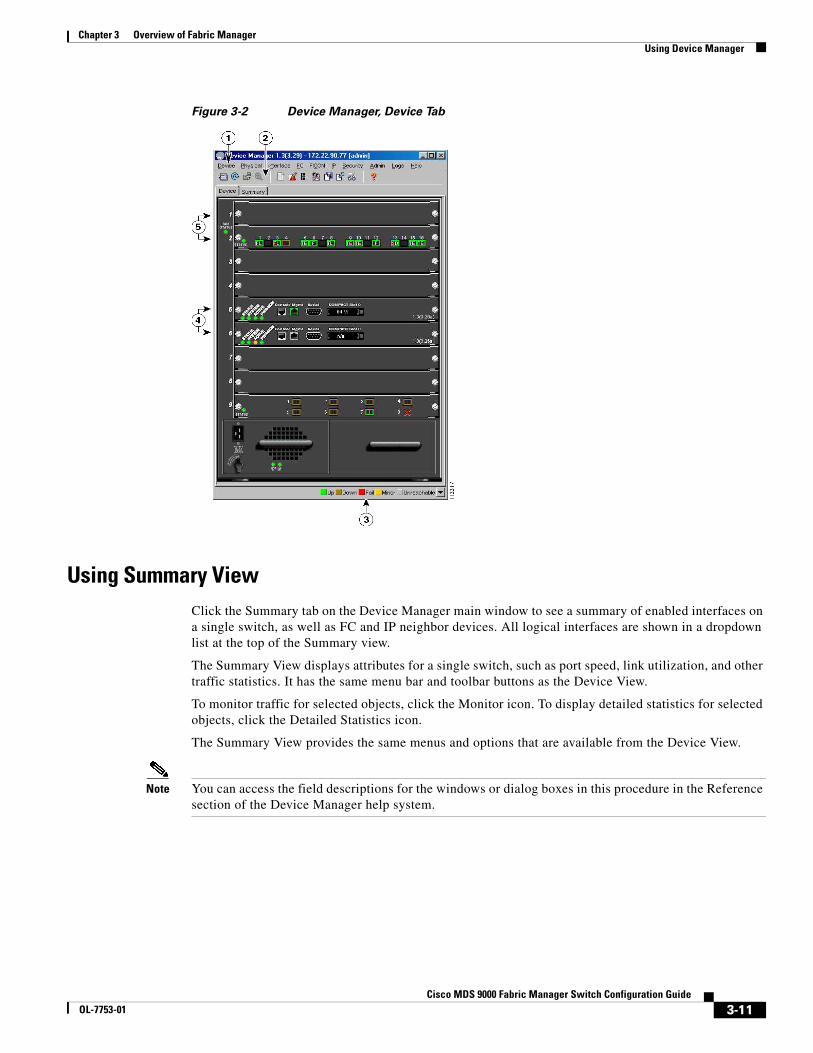
Figure 3-2 Device Manager, Device Tab
Using Summary ViewClick the Summary tab on the Device Manager main window to see a summary of enabled interfaces on a single switch, as well as FC and IP neighbor devices. All logical interfaces are shown in a dropdown list at the top of the Summary view.
The Summary View displays attributes for a single switch, such as port speed, link utilization, and other traffic statistics. It has the same menu bar and toolbar buttons as the Device View.
To monitor traffic for selected objects, click the Monitor icon. To display detailed statistics for selected objects, click the Detailed Statistics icon.
The Summary View provides the same menus and options that are available from the Device View.
Note You can access the field descriptions for the windows or dialog boxes in this procedure in the Reference section of the Device Manager help system.
3-11Cisco MDS 9000 Fabric Manager Switch Configuration Guide
OL-7753-01
Chapter 3 Overview of Fabric Manager Using Device Manager
Comparing Device Manager to Fabric ManagerThe menu bar at the top of the Device Manager contains the same menus as the Fabric Manager menu tree.
For information about the options provided by these menus, see the “Logical/Physical Pane” section on page 3-3. The Device menu provides the following options:
• Open—Open the Device Manager for a different switch.
• Open Last—Open the Device Manager for the most recently managed switch.
• Preferences—Set management preferences for controlling the behavior and appearance of the Device Manager.
• Refresh—Update the current display.
• Command Line Interface—Open a Telnet/SSH session with the current switch.
• Exit—Close the Device Manager application.
The tables in the Fabric Manager roughly correspond to the dialog boxes that appear in Device Manager. However, the Fabric Manager tables show values for multiple switches and so the first column identifies the specific switch. The Device Manager dialog box shows values for a single switch, while the Fabric Manager shows the same values for one or more switches.
The toolbar on the Device Manager dialog box provides the same options as the toolbar on the Information pane in Fabric Manager, as summarized here:
• Create—Insert a new row into a table (if applicable).
• Delete Row—Delete the selected row from a table (if applicable).
• Copy (Ctrl-C)—Copy data from one row to another.
• Paste (Ctrl-V)—Paste the data from one row to another.
• Apply Changes—Apply configuration changes. (Note: After making changes you must save the configuration. Otherwise, the changes will be lost when the device is restarted.)
• Refresh Values—Refresh table values.
• Reset Changes (Ctrl-Z)—Undo the most recent change.
• Print table—Print the contents of the Information pane.
Tip You can copy values from one cell in a table to the rest of the column. Copy the value to the clipboard, hold down the shift key while pressing the down arrow key (or click on the bottom cell in the column). Then paste the value to all the selected cells and click Apply.
When you click the Create button, you see a dialog box that lets you enter the values required for the specific table. As you can see the fields and options are the same from both views, but the appearance of the window may vary slightly. For instance, the dialog box from Fabric Manager may have an option for selecting a specific switch, while the dialog box from Device Manager may have additional port-level detail.
3-12Cisco MDS 9000 Fabric Manager Switch Configuration Guide
OL-7753-01

Chapter 3 Overview of Fabric Manager Using Device Manager
Performing Device ManagementMost tasks that you can perform with Device Manager can also be performed for multiple switches using the Fabric Manager. However, Device Manager may be more convenient to use when you are working with a single switch. Also, the Device Manager provides more detailed information for verifying or troubleshooting device-specific configuration than what is available from the Fabric Manager.
The Device View provides a graphic representation of a Cisco MDS 9000 switch, including the installed switching modules, services modules, supervisor modules, and the status of each port within each module. You can use the Device View to perform any switch-level configuration tasks including the following:
• Manage ports, Port Channels, and trunking
• Manage SNMPv3 security access to switches
• Manage CLI security access to switches
• Manage alarms, events, and notifications
• Save and copy configuration files and software images
• View hardware configuration
• View chassis, module, and port status and statistics
Summary View provides a way of monitoring all of the ports on the switch, categorized by operative modes (Fx-Ports and E-Ports).
When you click the Summary tab on the Device Manager window, you see the Summary View, which provides summary information about the interfaces on a single switch.
Managing Ports
Tip You can select multiple ports in Device Manager and apply options to all the selected ports at one time. Either select the ports by clicking the mouse and dragging it around them, or hold down the Control key and click on each port.
To enable or disable a port, right-click the port and click Enable or Disable from the pop-up menu. To enable or disable multiple ports, drag the mouse to select the ports and then right-click the selected ports. Then click Enable or Disable from the pop-up menu.
To manage trunking on one or more ports, right-click the ports and click Configure. On the dialog box that appears, in the Trunk column, right-click the current value and click nonTrunk, trunk, or auto from the pull-down list.
To create PortChannels using Device Manager, click PortChannels from the Interface menu. For detailed instructions, see the“About PortChanneling and Trunking” section on page 14-3. You can also use Fabric Manager to conveniently create a PortChannel.
Note To create a PortChannel, all the ports on both ends of the link must have the same port speed, trunking type, and administrative state.
3-13Cisco MDS 9000 Fabric Manager Switch Configuration Guide
OL-7753-01

Chapter 3 Overview of Fabric Manager Using Performance Manager
Setting Device Manager PreferencesFrom the Device menu, choose Preferences to set your preferences for the behavior of the Device Manager application.
Note You can access the field descriptions for the windows or dialog boxes in this procedure in the Reference section of the Device Manager help system.
Using Performance ManagerPerformance Manager monitors network device statistics historically, and provide this information graphically using a web browser. It presents recent statistics in detail and older statistics in summary. Performance Manager also integrates with external tools, such as Cisco Traffic Analyzer.
Performance Manager ArchitectureThe Performance Manager has three parts:
• Definition—Use a configuration wizard to create a configuration file
• Collection—Performance Manager reads the configuration file and collects the desired information
• Presentation—Performance Manager generates web pages to present the collected data Performance Manager can collect a variety of data, about these fabric components: ISLs, host ports, storage ports, route flows, and site-specific statistical collection areas.
Creating a PM Configuration FilePerformance Manager has a Configuration File Wizard, which steps you through the process of creating configuration files.
To create a configuration file, perform the following steps:
Step 1 Choose Performance > Create Collection in Fabric Manage to launch the wizard.
Step 2 Select the VSANs from which you want to collect data.
Step 3 Check the types of SAN objects for which you want to collect data.
Step 4 If you want to ignore flows with Zero counter values, check that check box.
Step 5 If you are using Cisco Traffic Analyzer, enter the URL where it is located on your network.
Step 6 Click Next to review the collected data.
3-14Cisco MDS 9000 Fabric Manager Switch Configuration Guide
OL-7753-01
Chapter 3 Overview of Fabric Manager Using Performance Manager
Step 7 Enter the name of the file (the default is the switch’s IP address with a .XML suffix).
Step 8 Select the definitions that you wish to remove, then click Finish to create the configuration file.
Note The FV Interface mentioned at the bottom of the second screen of this wizard is the Veritas virtualization interface. It is documented in the Veritas documentation.
Collecting the DataOne year’s worth of data for two variables (Rx and Tx Bytes) requires an rrd file size of 76K. The default internal values are:
• 600 samples of 5 minutes (2 days and 2 hours)
• 700 samples of 30 minutes (2 days and 2 hours, plus 12.5 days)
• 775 samples of 2 hours (above + 50 days)
• 300 samples of 1 day (above + 300 days, rounded up to 365)
A 1000-port SAN requires 76MB for a year’s worth of historical data. If there were 20 switches in this SAN with equal distribution of fabric ports, about 2-3 SNMP packets per switch would be sent every 5 minutes for a total of about 100 total request/response SNMP packets required to monitor the data.
Flows, because of their variable counter requests, are more difficult to predict. But as a rule of thumb, each extra variable adds another 38K.
The Performance Manager collector is designed to run as a background process on the various supported OSs. On Microsoft Windows, it runs as a service.
Presenting the Collected DataThe Summary page presents the top 10 Hosts, ISLs, Storage, and Flows by average throughput for the last 24 hour period. This period changes on every polling interval ñ this is unlikely to change the average significantly, but it could affect the maximum value. The intention is to provide a quick summary of the fabric’s bandwidth consumption and highlight any hotspots.
• Clicking on any Host, Storage, ISL, or Flow title will provide a view of traffic over the past day for all Hosts, Storage, ISLs, or Flows respectively.
• Clicking on a host port from the summary page will provide you with a similar detail page. If flows exist for that port, you could see which storage ports it was sending data to.
• Clicking on the ISLs link from the summary page will list the daily traffic charts for all monitored ISLs in the fabric.
3-15Cisco MDS 9000 Fabric Manager Switch Configuration Guide
OL-7753-01

Chapter 3 Overview of Fabric Manager Configuring PM for Use with Cisco Traffic Analyzer
Exporting and Importing DataYou can export an rrd file to XML with the command:
pm xport <rrdFile> <xmlFile>
This will produce an XML format that rrdtool is capable of reading with the command:
rrdtool restore filename.xml filename.rrd
You can import an XML with the command:
pm restore <xmlFile> <rrdFile>
This will read the XML export format that rrdtool is capable of writing with the command:
rrdtool xport filename.xml filename.rrd
Integration with Cisco Traffic AnalyzerSNMP and Performance Manager can only provide a top-level view of what data the fabric is carrying. The Cisco MDS 9000 switch has no LUN-level flow counters, and cannot count SCSI commands. In order to view this detailed information, it is necessary to look at the data on a SPAN destination port with the help of the Cisco Traffic Analyzer, which uses the Cisco Port Adapter Analyzer.
Cisco Traffic Analyzer must be downloaded and installed separately.
Caution The Cisco Traffic Analyzer for Fibre Channel throughput values are not accurate when used with the original Cisco Port Adapter Analyzer if data truncation is enabled. The A version of the Cisco Port Adapter Analyzer is required to achieve accurate results with truncation, because it adds a count that enables the Cisco Traffic Analyzer to determine how many data bytes were actually transferred.
Configuring PM for Use with Cisco Traffic AnalyzerPerformance Manager works in conjunction with the Cisco Traffic Analyzer to allow you to monitor and manager the traffic on your fabric. The figure below is a graphic representation of how Performance Manager works with the Cisco Traffic Analyzer to monitor traffic on your fabric.
3-16Cisco MDS 9000 Fabric Manager Switch Configuration Guide
OL-7753-01

Chapter 3 Overview of Fabric Manager Configuring PM for Use with Cisco Traffic Analyzer
Figure 3-3 Overview of Performance Manager/Cisco Traffic Analyzer Configuration
Note See Chapter 30, “Monitoring Network Traffic Using SPAN” for information on configuring the settings for your span destination port. It is important that the data you collect through this port matches the data collected by Performance Manager through the MGMT0 port. If the data does not match, you will not be able to view the Cisco Traffic Analyzer information through a Traffic Analyzer link on the detail page of a Performance Manager report.
For information on setting up the Cisco Traffic Analyzer, refer to the Cisco MDS 9000 Family Port Analyzer Adapter 2 Installation and Configuration Note.
To configure Performance Manager to work with the Cisco Traffic Analyzer, perform these steps:
Step 1 Set up the Cisco Traffic Analyzer according to the instructions in the Cisco MDS 9000 Family Port Analyzer Adapter 2 Installation and Configuration Note.
Step 2 You will need three pieces of information:
• The IP address of the management workstation on which you are running Performance Manager and Cisco Traffic Analyzer
• The path to the directory where Cisco Traffic Analyzer is installed.
• The port that is used by Cisco Traffic Analyzer (the default is 3000).
Step 3 Start the Cisco Traffic Analyzer.
1. From the Fabric Manager Performance menu, choose Traffic Analyzer > Open.
2. Enter the URL for the Cisco Traffic Analyzer, in the format
http://<ip address>:<port number>
where:
<ip address> is the address of the management workstation on which you have installed the Cisco Traffic Analyzer, and
:<port number> is the port that is used by Cisco Traffic Analyzer (the default is :3000).
Management workstation
PerformanceManager
Cisco TrafficAnalyzer
GUI Collection GUI Collection
NIC 1 NIC 2 PAA MDS 9000 switch
Network
SPAN destination port
mgmt0port
1134
85PC PC PC
3-17Cisco MDS 9000 Fabric Manager Switch Configuration Guide
OL-7753-01
Chapter 3 Overview of Fabric Manager Configuring PM for Use with Cisco Traffic Analyzer
3. Click OK.
4. From the Fabric Manager Performance menu, choose Traffic Analyzer > Start.
5. Enter the location of the Cisco Traffic Analyzer, in the format
D:\<directory>\ntop.bat
where:
D: is the drive letter for the disk drive where the Cisco Traffic Analyzer is installed, and
<directory> is the directory containing the ntop.bat file.
6. Click OK.
Step 4 Create the flows you want Performance Manager to monitor, using the Flow Configuration Wizard.
Step 5 Define the data collection you want Performance Manager to gather, using the Performance Manager Configuration Wizard.
1. Select the VSAN you want to collect information for, or select All VSANs.
2. Check the types of items you want to collect information for (hosts, ISLs, Storage devices, and Flows).
3. Enter the URL for the Cisco Traffic Analyzer, in the format
http://<ip address>/<directory>
where:
<ip address> is the address of the management workstation on which you have installed the Cisco Traffic Analyzer, and
<directory> is the path to the directory where the Cisco Traffic Analyzer is installed.
4. Click Next.
5. Review the Data Collection to make sure this is the data you want to collect.
6. Click Finish to begin collecting data.
Note Data is not collected for JBOD or for virtual ports. If you change the data collection configuration parameters during a data collection, you must stop and restart the collection process in order for your changes to take effect.
Step 6 To generate a report, choose Performance > Reports.
You see a list of XML files. These files are the data collection files you specified in the Performance Manager Configuration Wizard.
Note It takes about five minutes to collect enough data to generate a report. Do not attempt to generate a report in Performance Manager during the first five minutes of collection.
3-18Cisco MDS 9000 Fabric Manager Switch Configuration Guide
OL-7753-01
Chapter 3 Overview of Fabric Manager Stopping Data Collection
Step 7 Choose a file for which you want to generate a report.
In about five minutes, an HTML report appears in your default web browser.
Step 8 To view the Cisco Traffic Analyzer information, click the Cisco Traffic Analyzer link at the top of the Host or Storage detail pages.
Note For information on capturing a SPAN session and starting a Cisco Traffic Analyzer session to view it, refer to the Cisco MDS 9000 Family Port Analyzer Adapter 2 Installation and Configuration Note.
Note For information on viewing and interpreting your Performance Manager data see the “Using Performance Manager” section on page 3-14.
For information on viewing and interpreting your Cisco Traffic Analyzer data, refer to the Cisco MDS 9000 Family Port Analyzer Adapter 2 Installation and Configuration Note.
Stopping Data CollectionYou can stop a data collection process in Windows using the services panel. Right click on the Cisco Performance Manager service and select Stop.
On a Unix machine, enter the following command:
$HOME/.ciscomds9000/bin/pm.sh stop
Exporting Data Collection to XML FilesTo export the collection to an XML file, enter the following command at the operating system command line prompt:
$HOME/.ciscomds9000/bin/pm.bat xport xxx yyy
Removing Data Collection Files from the ListTo remove a data collection file from the list, edit the pm.txt file and comment out the line (#), or remove the line entirely.
3-19Cisco MDS 9000 Fabric Manager Switch Configuration Guide
OL-7753-01

Chapter 3 Overview of Fabric Manager Removing Data Collection Files from the List
3-20Cisco MDS 9000 Fabric Manager Switch Configuration Guide
OL-7753-01