overview of local fiscal stress in virginiasfc.virginia.gov/pdf/retreat/2017...
TRANSCRIPT

SENATE FINANCE COMMITTEE
Senate Finance Committee Annual Meeting
November 16, 2017
Overview of Local Fiscal Stress in Virginia

SENATE FINANCE COMMITTEE 2
Overview of Local Fiscal Stress
Demographic and Statistical Information
Policy Options for Consideration
Topics:
SENATE FINANCE COMMITTEE
01
03
Distress Text Title This is a sample text, place your own text here
Bankruptcy
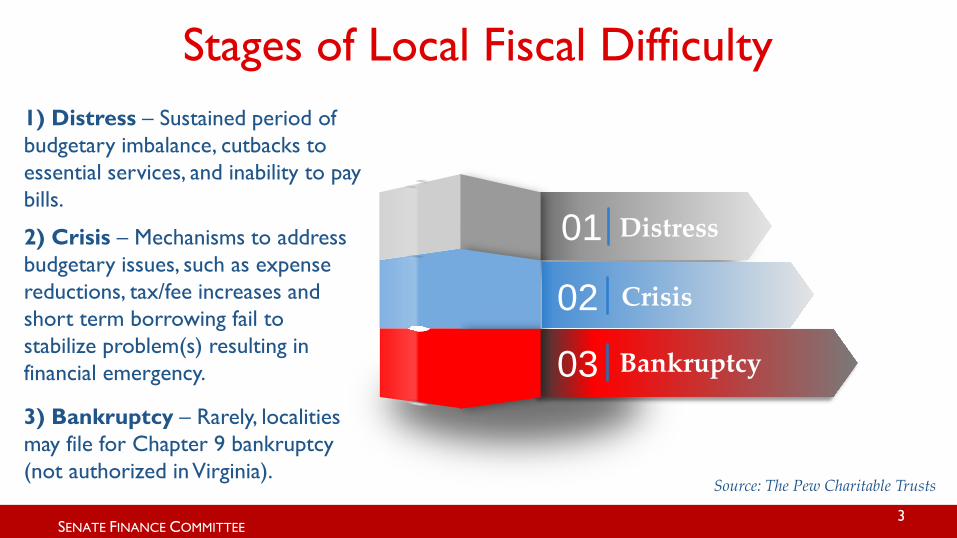
Stages of Local Fiscal Difficulty
02 Crisis
1) Distress – Sustained period of budgetary imbalance, cutbacks to essential services, and inability to pay bills.
2) Crisis – Mechanisms to address budgetary issues, such as expense reductions, tax/fee increases and short term borrowing fail to stabilize problem(s) resulting in financial emergency. 3) Bankruptcy – Rarely, localities may file for Chapter 9 bankruptcy (not authorized in Virginia).
3
Source: The Pew Charitable Trusts

SENATE FINANCE COMMITTEE 4
Why Should the State Help Prevent and/or Remedy Local Fiscal Stress?
Ensure public health and safety Need to
maintain essential services
Preserve credit worthiness and reputation Rating agencies
value local support
Promote economic growth and stability State is stronger
when localities are strong
Attract and retain businesses Stable economies
promote business and job growth
Source: The Pew Charitable Trusts
SENATE FINANCE COMMITTEE
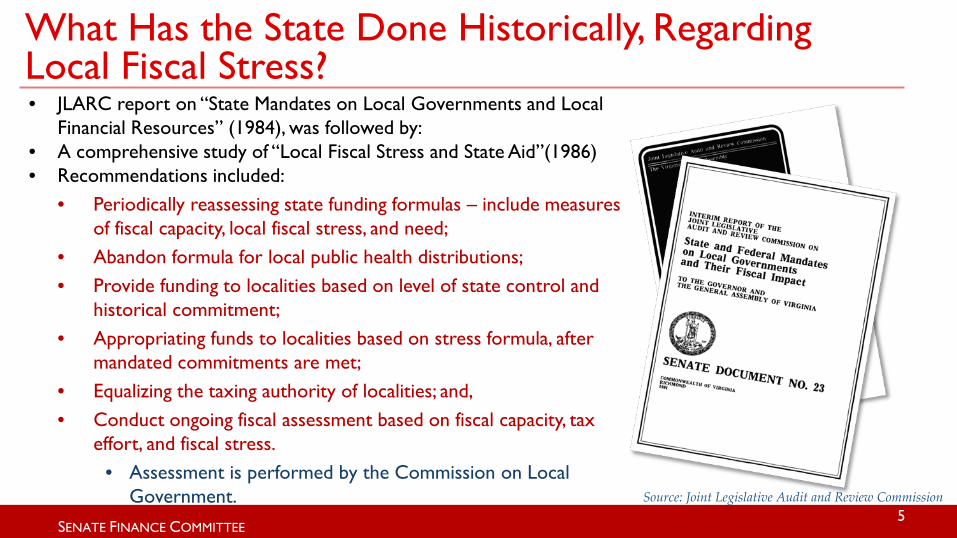
What Has the State Done Historically, Regarding Local Fiscal Stress? • JLARC report on “State Mandates on Local Governments and Local
Financial Resources” (1984), was followed by: • A comprehensive study of “Local Fiscal Stress and State Aid”(1986) • Recommendations included:
• Periodically reassessing state funding formulas – include measures of fiscal capacity, local fiscal stress, and need;
• Abandon formula for local public health distributions; • Provide funding to localities based on level of state control and
historical commitment; • Appropriating funds to localities based on stress formula, after
mandated commitments are met; • Equalizing the taxing authority of localities; and, • Conduct ongoing fiscal assessment based on fiscal capacity, tax
effort, and fiscal stress. • Assessment is performed by the Commission on Local
Government.
5 Source: Joint Legislative Audit and Review Commission
SENATE FINANCE COMMITTEE
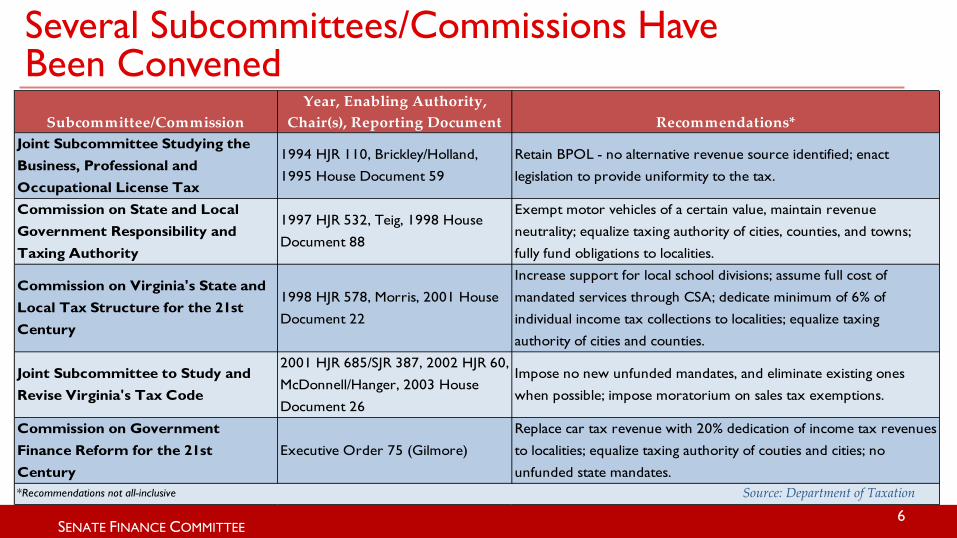
Several Subcommittees/Commissions Have Been Convened
6
Subcommittee/CommissionYear, Enabling Authority,
Chair(s), Reporting Document Recommendations*Joint Subcommittee Studying the Business, Professional and Occupational License Tax
1994 HJR 110, Brickley/Holland,
1995 House Document 59
Retain BPOL - no alternative revenue source identified; enact
legislation to provide uniformity to the tax.
Commission on State and Local Government Responsibility and Taxing Authority
1997 HJR 532, Teig, 1998 House
Document 88
Exempt motor vehicles of a certain value, maintain revenue
neutrality; equalize taxing authority of cities, counties, and towns;
fully fund obligations to localities.
Commission on Virginia's State and Local Tax Structure for the 21st Century
1998 HJR 578, Morris, 2001 House
Document 22
Increase support for local school divisions; assume full cost of
mandated services through CSA; dedicate minimum of 6% of
individual income tax collections to localities; equalize taxing
authority of cities and counties.
Joint Subcommittee to Study and Revise Virginia's Tax Code
2001 HJR 685/SJR 387, 2002 HJR 60,
McDonnell/Hanger, 2003 House
Document 26
Impose no new unfunded mandates, and eliminate existing ones
when possible; impose moratorium on sales tax exemptions.
Commission on Government Finance Reform for the 21st Century
Executive Order 75 (Gilmore)
Replace car tax revenue with 20% dedication of income tax revenues
to localities; equalize taxing authority of couties and cities; no
unfunded state mandates.*Recommendations not all-inclusive Source: Department of Taxation

SENATE FINANCE COMMITTEE
Timeline of Recent State Involvement in Local Government Fiscal Stress
Petersburg
• City requests assistance May 2016.
• Finance team assembled, deployed in June 2016.
• SFC and HAC briefings in Sept. and Nov. 2016 raise issue of Early Warning System.
Workgroup • Situation in Petersburg,
legislative briefings raise general awareness of potential for local fiscal distress.
• Workgroup begins examining issue in January 2017.
Budget Language • Workgroup discussions,
analysis facilitate development of budget language (Chapter 836) for Jt. Subcommittee on Local Government Fiscal Stress, APA workgroup, local auditor requirements, funding.
Local Government Fiscal Stress
7
SENATE FINANCE COMMITTEE
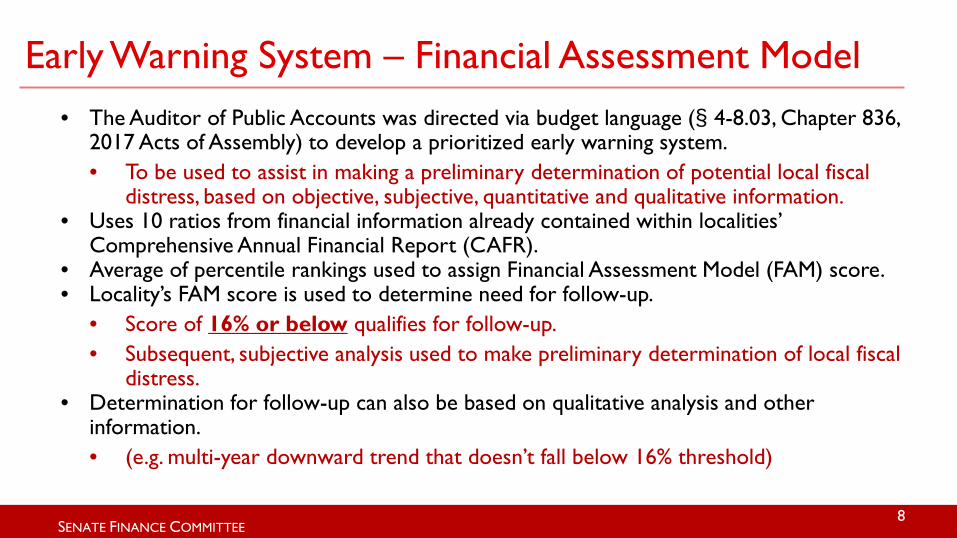
Early Warning System – Financial Assessment Model • The Auditor of Public Accounts was directed via budget language (§ 4-8.03, Chapter 836,
2017 Acts of Assembly) to develop a prioritized early warning system. • To be used to assist in making a preliminary determination of potential local fiscal
distress, based on objective, subjective, quantitative and qualitative information. • Uses 10 ratios from financial information already contained within localities’
Comprehensive Annual Financial Report (CAFR). • Average of percentile rankings used to assign Financial Assessment Model (FAM) score. • Locality’s FAM score is used to determine need for follow-up.
• Score of 16% or below qualifies for follow-up. • Subsequent, subjective analysis used to make preliminary determination of local fiscal
distress. • Determination for follow-up can also be based on qualitative analysis and other
information. • (e.g. multi-year downward trend that doesn’t fall below 16% threshold)
8

SENATE FINANCE COMMITTEE
Financial Assessment Model (FAM) Ratios
9
Example: Ratios calculated using GF activity from the Balance Sheet, Statement of Revenues, Expenditures and Changes in Fund Balance – 4 of 10 Ratios.
Source : “Financial Indicator Ratios” and “Description/Interpretation” – Auditor of Public Accounts
Financial Indicator Ratio Description/InterpretationCash and Cash Equivalents + Investments - Current
Liabilities (incl. any applicable cash overdraft) / Charges for Services + General Revenues
Measures the sufficiency of unrestricted reserves relative to the locality's normal (non-grant) revenue
Cash and Cash Equivalents + Investments / Current Liabilities (incl. any applicable cash overdraft)
Measures the sufficiency of unrestricted reserves relative to the locality's current liabilities
Cash and Cash Equivalents + Investments / Total (current and long-term) liabilities
Measures the sufficiency of unrestricted reserves relative to the locality's total liabilities
Financial Indicator Ratio Description/Interpretation
Cash and Cash Equivalents + Investments (incl. unrestricted and restricted) / Total current and long-term liabilities
Measures the sufficiency of reserves relative to the locality's general fund liabilities
Example: Ratios calculated using localities’ Government Wide Statement of Net Position and Statement of Net Activities (all funds) – 6 of 10 Ratios.

SENATE FINANCE COMMITTEE
0-5% 5-10% 10-15% 15-20% 20-30% 30-40% 40-50% 50-75% 75-100%2014 0 2 3 7 18 16 22 49 182015 0 2 5 4 15 24 21 44 192016 2 1 2 5 12 26 20 45 20
0
10
20
30
40
50
60
% Sc
ore
Distribution of FAM Scoring
10
Avg. of 8.2% of localities in 0% - 20% range
Avg. of 43.3% of localities in 20% - 50% range
Avg. of 48.5% of localities in 50% - 100% range
Source: Auditor of Public Accounts data
Range Considered Fiscally Healthy*
Based on FY 2016 FAM scoring and qualitative analysis, seven
localities were identified for follow-up.
*For purposes of APA objective FAM scoring

SENATE FINANCE COMMITTEE
• The Fiscal Stress Index is comprised of the aggregate of three separately computed indices. • Revenue Capacity; Revenue Effort; and Median Household Income.
• Origin of the Fiscal Stress Index contained within 1984 JLARC report. • While useful in several capacities, the CLG has no statutory authority for local intervention in cases
of suspected fiscal distress, and the index alone is not sufficient as a fiscal monitoring tool. 11
Commission on Local Government – Fiscal Stress Index
Source: VA Department of Housing & Community Development, Commission on Local Government

SENATE FINANCE COMMITTEE 12
FAM vs. CLG Fiscal Stress Indices – Different Measurements
The CLG Fiscal Stress Index is a relative score of a locality’s revenue generating capacity, and effort and ability to meet that capacity, while the FAM scoring largely reflects assets, liabilities and liquidity as indicated through financial metrics.
Fiscal Stress Rank (CLG) (1) FAM Score (2014)
Score Indicates APA
Follow-up (2014) (2)
1 Emporia 66.9% No2 Buena Vista 19.9% No3 Petersburg 13.9% Yes4 Martinsville 52.4% No5 Covington 12.8% Yes 6 Galax 11.6% Yes7 Lynchburg 38.1% No8 Franklin City 41.1% No
9 Hopewell 57.6% No10 Radford 45.5% No
(1) Commission on Local Government Fiscal Stress Rank reflects FY2014 data.
(2) Follow-up by APA based only on FAM quantitative score, objective criteria.
Of the top 10 in the CLG ranking, only 3 localities would have
qualified for APA follow-up in FY 2014.

SENATE FINANCE COMMITTEE
What Are Other States Doing?
13 Source: The Pew Charitable Trusts
• Currently, twenty-two states assess the fiscal conditions of localities.
• Eight of the twenty-two have some sort of early warning system.
• There is wide variability in states’ efforts to monitor the fiscal health of localities. – Scope – Responsibility – Tools to assist and mechanisms
for intervention
Doesn’t Yet Reflect Virginia’s Recent Fiscal Monitoring
Initiatives

SENATE FINANCE COMMITTEE
Demographic and Statistical Information
14
SENATE FINANCE COMMITTEE
Roanoke City
Covington
Charlottesville
Albemarle
Williamsburg
Matthews
Henry
Bedford
Bedford
Norton Pulaski Radford
Lynchburg
Isle of Wight
Frederick Winchester
Lexington
Richmond Chesterfield
Petersburg Col.Heights
Portsmouth
Newport News Norfolk
Southampton Emporia
Franklin
Galax Bristol Martinsville Danville
Rockbridge
Buena Vista
Staunton
Waynesboro
Augusta
King & Queen
New Kent
Fredericksburg
Montgomery Edward Campbell
Northumberland Caroline Essex
Accomack Fluvanna
Northampton
Wythe Franklin Sussex Wise
Charles City
Craig Gloucester
Buchanan
Appomattox
Virginia Beach
Floyd Smyth Pittsylvania
Fauquier Shenandoah
Dickenson
Giles
Washington Lee Scott
Russell
Tazewell Bland
Grayson Carroll
Patrick
Botetourt
Charlotte
Amherst
Mecklenburg Greensville
Suffolk
Surry Dinwiddie
Amelia
Henrico Powhatan
Middlesex Lancaster
Richmond
Hanover King William
Louisa
Goochland
Highland Greene
Stafford
Page Prince
Bath
Clarke
Rappahannock
Madison
Westmoreland
Nelson
Buckingham
Chesapeake
Spotsylvania Orange
Alexandria Arlington Warren
Fairfax City
Manassas Park
Manassas Rockingham
Brunswick
King George
Alleghany
Cumberland
Falls Church
Roanoke
Prince George
Halifax
Culpeper
Loudoun
York
James CIty
Lunenburg
Nottoway
Harrisonburg
Hopewell Poquoson Hampton
Salem
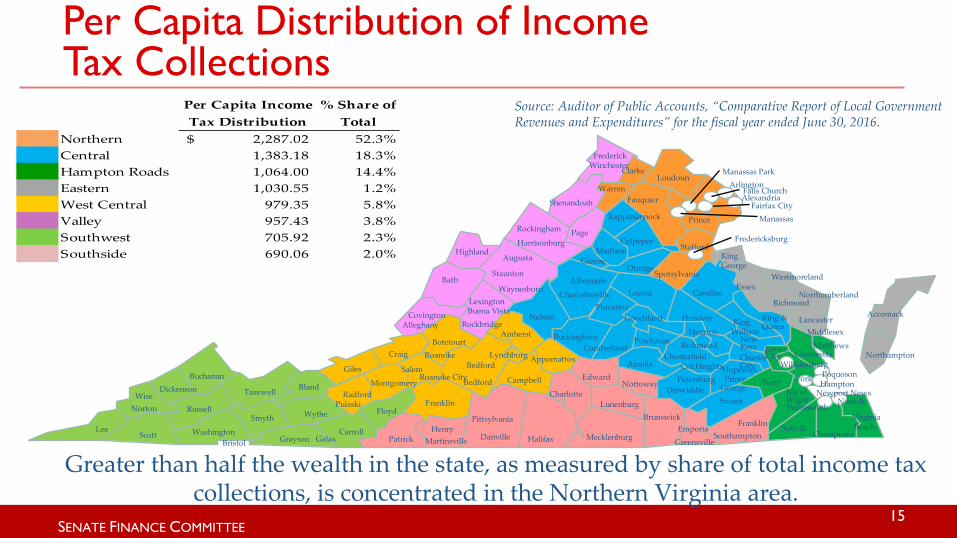
Per Capita Distribution of Income Tax Collections
Per Capita Income Tax Distribution
% Share of Total
Northern 2,287.02$ 52.3%Central 1,383.18 18.3%Hampton Roads 1,064.00 14.4%Eastern 1,030.55 1.2%West Central 979.35 5.8%Valley 957.43 3.8%Southwest 705.92 2.3%Southside 690.06 2.0%
Greater than half the wealth in the state, as measured by share of total income tax collections, is concentrated in the Northern Virginia area.
Source: Auditor of Public Accounts, “Comparative Report of Local Government Revenues and Expenditures” for the fiscal year ended June 30, 2016.
15
SENATE FINANCE COMMITTEE
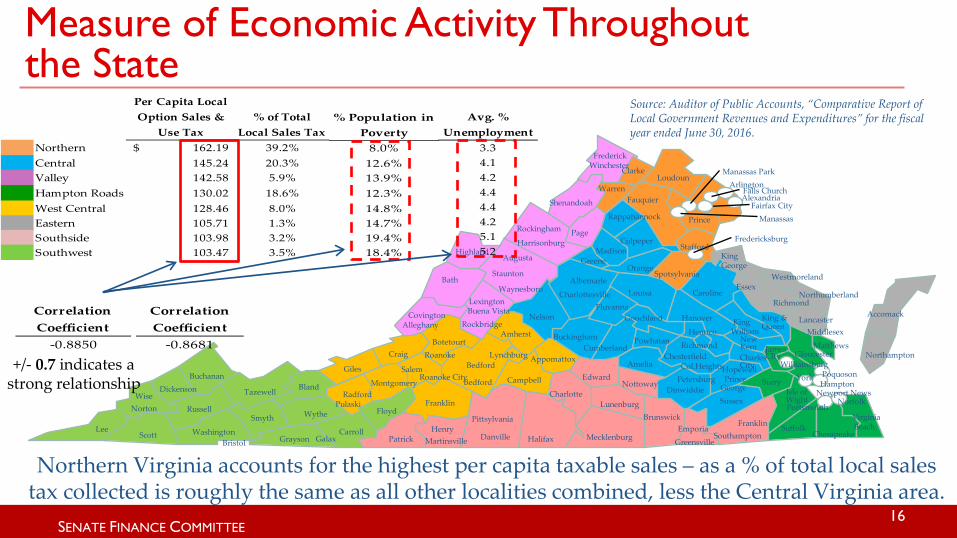
Per Capita Local Option Sales &
Use Tax % of Total
Local Sales Tax Northern 162.19$ 39.2%Central 145.24 20.3%Valley 142.58 5.9%Hampton Roads 130.02 18.6%West Central 128.46 8.0%Eastern 105.71 1.3%Southside 103.98 3.2%Southwest 103.47 3.5%
Roanoke City
Covington
Charlottesville
Albemarle
Williamsburg
Matthews
Henry
Bedford
Bedford
Norton Pulaski Radford
Lynchburg
Isle of Wight
Frederick Winchester
Lexington
Richmond Chesterfield
Petersburg Col.Heights
Portsmouth
Newport News Norfolk
Southampton Emporia
Franklin
Galax Bristol Martinsville Danville
Rockbridge
Buena Vista
Staunton
Waynesboro
Augusta
King & Queen
New Kent
Fredericksburg
Montgomery Edward Campbell
Northumberland Caroline Essex
Accomack Fluvanna
Northampton
Wythe Franklin Sussex Wise
Charles City
Craig Gloucester
Buchanan
Appomattox
Virginia Beach
Floyd Smyth Pittsylvania
Fauquier Shenandoah
Dickenson
Giles
Washington Lee Scott
Russell
Tazewell Bland
Grayson Carroll
Patrick
Botetourt
Charlotte
Amherst
Mecklenburg Greensville
Suffolk
Surry Dinwiddie
Amelia
Henrico Powhatan
Middlesex Lancaster
Richmond
Hanover King William
Louisa
Goochland
Highland Greene
Stafford
Page Prince
Bath
Clarke
Rappahannock
Madison
Westmoreland
Nelson
Buckingham
Chesapeake
Spotsylvania Orange
Alexandria Arlington Warren
Fairfax City
Manassas Park
Manassas Rockingham
Brunswick
King George
Alleghany
Cumberland
Falls Church
Roanoke
Prince George
Halifax
Culpeper
Loudoun
York
James CIty
Lunenburg
Nottoway
Harrisonburg
Hopewell Poquoson Hampton
Salem
Source: Auditor of Public Accounts, “Comparative Report of Local Government Revenues and Expenditures” for the fiscal year ended June 30, 2016.
Measure of Economic Activity Throughout the State
Northern Virginia accounts for the highest per capita taxable sales – as a % of total local sales tax collected is roughly the same as all other localities combined, less the Central Virginia area.
% Population in Poverty
8.0%12.6%13.9%12.3%14.8%14.7%19.4%18.4%
Avg. % Unemployment
3.34.14.24.44.44.25.15.2
Correlation Coefficient
-0.8850
Correlation Coefficient
-0.8681
16
+/- 0.7 indicates a strong relationship

SENATE FINANCE COMMITTEE 17
Shares of Local Revenue
• Just under 1/3 comes from state aid to localities, excluding federal pass-through dollars. • Just under 2/3 of total revenue for localities is generated at the local level. • Federal aid accounts for about 6%, of which, only about one percentage point is
attributable to direct federal aid to localities.
6% = Federal 31.4% = State 62.7% = Local
Source: Auditor of Public Accounts, “Comparative Report of Local Government Revenues and Expenditures” for the fiscal year ended June 30, 2016.

SENATE FINANCE COMMITTEE 18
General Property
Taxes, 66.0%
Other Local Taxes , 18.2%
Permits, Fees, Licenses, 1.2%
Fines & Forfeitures,
0.4%
Charges for Services ,
11.0%
Use of Money and Property,
1.2%
Miscellaneous, 2.0%
Local Sales & Use = 33%
BPOL = 19.9%
Food & Beverage = 15.6%
Consumer Utility = 8.6%
Hotel & Motel = 6%
"Other" = 16.9%
Composition of Local Revenue Sources
Source: Auditor of Public Accounts, “Comparative Report of Local Government Revenues and Expenditures” for the fiscal year ended June 30, 2016.

SENATE FINANCE COMMITTEE
Over ¾ of State Funding for Mandated Services Goes to Education
19
81.8%
62.1%
86.0%
99.7%
74.9%
82.3%
49.3%
18.2%
37.9%
14.0%
0.3%
25.1%
17.7%
50.7%
0% 20% 40% 60% 80% 100%
General Government
Judicial
Public Safety
Public Works
Health & Welfare
Community Development
Education
Local % share State % share
General Government
1%
Judicial 3%
Public Safety 8% Public Works
0%
Health & Welfare
9% Community
Development 2%
Education 77%
Data Source: VA Department of Housing & Community Development, Commission on Local Government, FY 2014 data

SENATE FINANCE COMMITTEE
The South and Southwest Regions Receive the Highest Proportional Share of State Funding
20
$436 $481 $698 $467 $126 $1,506 $1,607
$2,178 $334 $424
$827 $571
$172
$2,265 $2,571
$6,142
$0
$1,000
$2,000
$3,000
$4,000
$5,000
$6,000
$7,000
$8,000
$9,000
Southside Southwest West Central Valley Eastern Central HamptonRoads
NorthernState Share of Mandated Cost Local Share of Mandated Cost
Data Source: VA Department of Housing & Community Development, Commission on Local Government, FY 2014
(In $ millions)
RegionState % Share of Total Funding
Local % Share of Total Funding
Southside 56.6% 43.4%Southwest 53.1% 46.9%West Central 45.8% 54.2%Valley 45.0% 55.0%Eastern 42.2% 57.8%Central 39.9% 60.1%Hampton Roads 38.5% 61.5%Northern 26.2% 73.8%
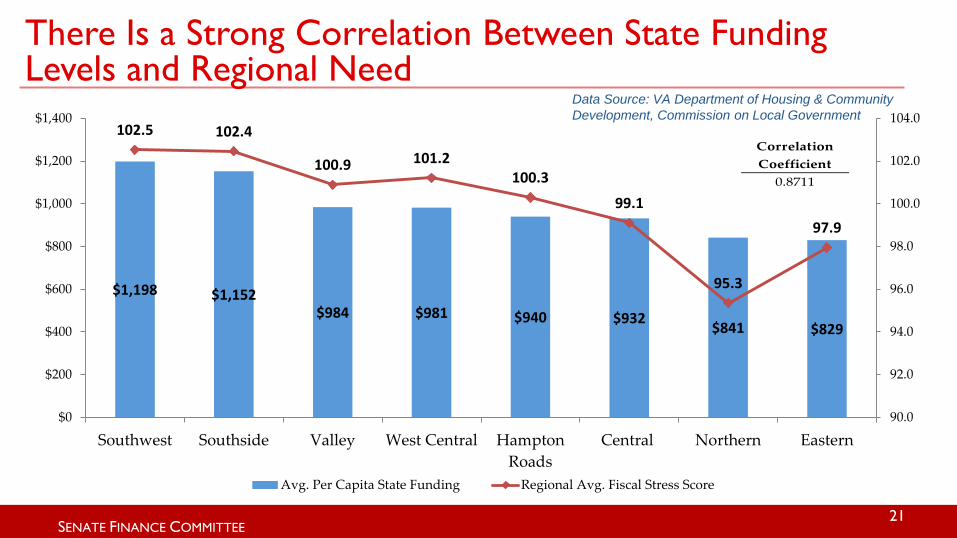
SENATE FINANCE COMMITTEE 21
There Is a Strong Correlation Between State Funding Levels and Regional Need
$1,198 $1,152 $984 $981 $940 $932 $841 $829
102.5 102.4
100.9 101.2 100.3
99.1
95.3
97.9
90.0
92.0
94.0
96.0
98.0
100.0
102.0
104.0
$0
$200
$400
$600
$800
$1,000
$1,200
$1,400
Southwest Southside Valley West Central HamptonRoads
Central Northern Eastern
Avg. Per Capita State Funding Regional Avg. Fiscal Stress Score
Data Source: VA Department of Housing & Community Development, Commission on Local Government
Correlation Coefficient
0.8711

SENATE FINANCE COMMITTEE
Growth in Real Property Lags Behind an Economic Recovery
22
6,000
7,000
8,000
9,000
10,000
11,000
12,000
13,000
2007 2008 2009 2010 2011 2012 2013 2014 2015 2016
(in
$ m
illio
ns)
Real Property Individual Income Tax
From 2007 through 2010, avg. annual real property revenues increased 4.3%...
While avg. annual state income tax revenues declined by 2.4%
From 2011 through 2016, avg. annual state income tax revenues increased by 5.6%...
While avg. annual real property tax revenues grew by 1.8%
-2.4% growth
4.3% growth
5.6% growth
1.8% growth
Data source: Department of Taxation Annual Reports (FY 2007 – FY 2016)

SENATE FINANCE COMMITTEE
Population Dispersion Compounds Regional Economic Challenges
23
-9.3% -10.8%
3.3%
16.8%
26.7% 17.4%
33.7%
58.5%
-40%
-20%
0%
20%
40%
60%
80%
100%
120%
140%
160%
Southwest Southside Eastern West Central Valley HamptonRoads
Central Northern
% Chg. 2010 - 2016 % Chg. 2010 - 2025 % Chg. 2010 - 2035 % Chg. 2010 - 2045
Population projections forecast continual growth in the Northern, Central and select Eastern portions of
the state, while the Southern and Southwestern areas of the state show continual decline into the
foreseeable future.
Data Source: Weldon Cooper Center Population Estimates, Projections

SENATE FINANCE COMMITTEE
Policy Options for Consideration
24

SENATE FINANCE COMMITTEE
Fiscal Monitoring and Early Detection - Policy Options for Consideration
• Refine processes for prevention, identification and remediation (including intervention, if required). • To include early warning system, ongoing fiscal monitoring. • Clearly define state role in local financial matters in cases of fiscal distress/crisis. • Determine if state intervention laws are required, and the mechanics of state
intervention.
• Determine extent of state technical and financial assistance. • Technical – State assistance to include review of accounting, operational procedures
and causes of distress, identification of structural problems and mechanisms to remedy them.
• Financial – Funding for outside consultancy (similar to Petersburg), if necessary. • Other?
25

SENATE FINANCE COMMITTEE
Ways To Address Local Fiscal Stress – Policy Considerations
• Revenue diversification – diversify sources, move away from dependence on real estate tax revenues.
• Address differences in local taxing authority. • Economic development efforts – What makes a locality attractive to a
current or prospective business (tax structure, educated/trained workforce, good schools, etc.) and how to improve the local infrastructure, given economic and demographic challenges in certain regions?
• Ways to encourage local/regional collaboration, consolidation, and reversion
when necessary.
26

SENATE FINANCE COMMITTEE
Issues to be Addressed by the Joint Subcommittee on Local Government Fiscal Stress
• The Joint Subcommittee on Local Government Fiscal Stress continues to examine the issue (authority specified in Item 1, paragraph U., Chapter 836).
• Has met twice during 2017 interim – June and August. • The stated goals and objectives of the Subcommittee include the review of several
issues that contribute to, and could potentially alleviate local fiscal stress, including: • Savings opportunities from increased regional cooperation and consolidation of services; • Local responsibility for service delivery of state mandated or high-priority items; • Causes of fiscal stress among local governments; • Potential financial incentives and other governmental reforms to encourage increased
regional cooperation; and, • Different taxing authorities of cities and counties.
27

SENATE FINANCE COMMITTEE
Virginia’s Efforts Acknowledged Among States
Virginia’s effort to address the situation in Petersburg and other
potentially fiscally distressed localities has
been acknowledged among states looking to address issues of local
fiscal stress.
28