overview of non-parametric statistics for independent samples t-test: the mann-whitney u test also...
TRANSCRIPT

PRESENTER: ELAINE EISENBEISZOWNER AND PRINCIPAL, OMEGA STATISTICS
Overview of Non-Parametric Statistics
Private practice consultancy based in Southern California,
Medical and Clinical Research: Epidemiology data, clinical trials phases I though IV, design and analysis of experiments, journal article assistance
Business Statistics: Econometrics, predictive modeling
Dissertation Assistance: Methods and Results Chapters
Survey Design
Projects of any size. Individual researchers, small business and start-ups, large corporations, government contracts.
Your one stop shop for all things measurable
About Omega Statistics

Parametric tests such as t-tests, ANOVA, linear regressions…require assumptions to be met in order to make accurate estimates and inferences.
IndependenceNormal DistributionHomogenous Variances Between GroupsContinuous (ratio/interval) Dependent
Variable
Parametric Tests for Normal Data
www.OmegasStatistics.com
Non-Normal Data is NOT Abnormal Data
Nonparametric techniques do not have the stringent assumptions of parametric techniques, such as a need for a normal distribution.
This is why nonparametric techniques are also referred to as “distribution-free” tests.
Nonparametric techniques are useful when data are measured on a nominal (categorical) or ordinal (ranked) scale. They are also useful when sample sizes are small.
www.OmegaStatistics.com

Distribution-Free Tests - General Assumptions
Random Samples
Independence
Note.Many studies and fields of research do not make use of random sampling and this assumption is often relaxed.Independence is not assumed for repeated measures tests.
www.OmegaStatistics.com
Alternative for Independent Samples t-test: The Mann-Whitney U Test
Also called the Mann-Whitney Test, the Wilcoxon Rank Sum Test, or Wilcoxon Test.
Tests if two independent populations have the same center. Uses medians of ranked data instead of means and standard deviations.
When to use:Responses can only be ranked (data is at least ordinal)Variances between two groups are not equalNormality assumption is violated
www.OmegaStatistics.com

Example: Mann-Whitney U Test
A study was conducted to test diastolic blood pressure readings between patients with sedentary lifestyles (Group A) and those who exercised 60 minutes at least 2 times per week (Group B).
It was not clear whether the assumptions for a t-test were valid, so the researcher employed nonparametric methods
Group A 85 89 86 91 77 93 100 82 92 86
Group B 83 73 65 65 90 77 78 97 85 75
www.OmegaStatistics.com

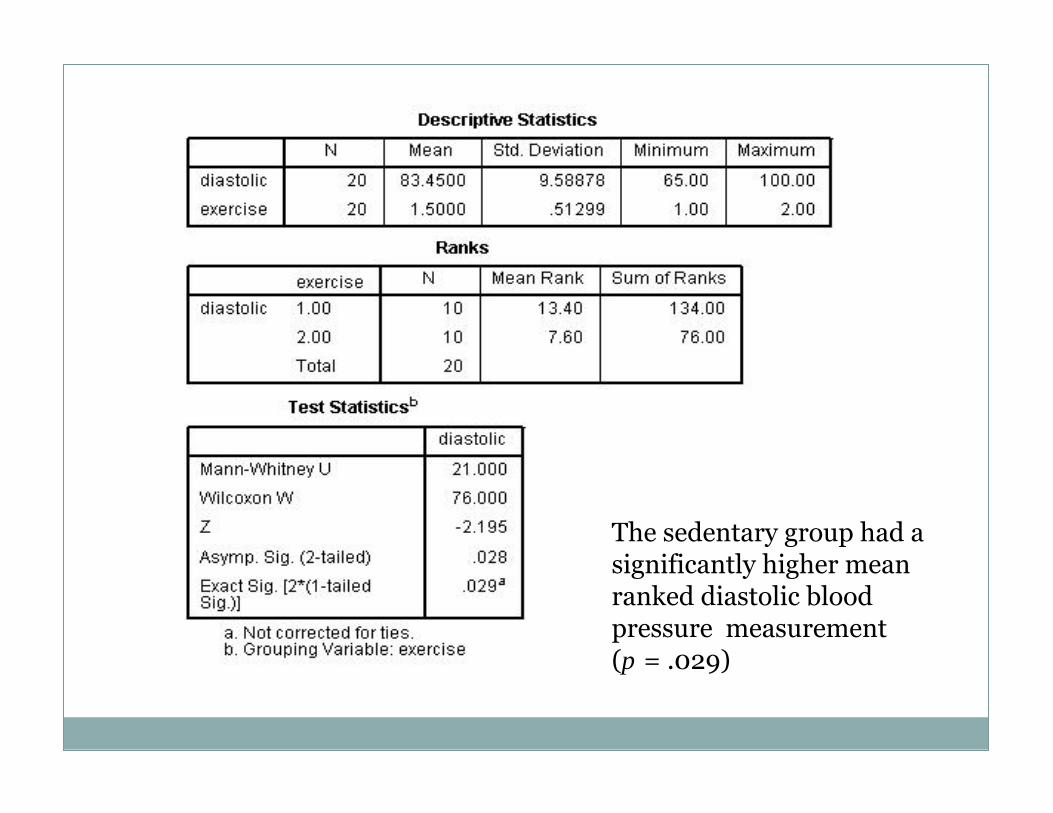
The sedentary group had a significantly higher mean ranked diastolic blood pressure measurement(p = .029)
Alternative for One-Way Analysis of Variance (ANOVA)
The Kruskal-Wallis Test
The Kruskal-Wallis Test is set-up in the same manner as the Mann-Whitney U test (making use of ranks) but there are more than 2 independent groups to be tested.
Example:
The effect of supermarket shelf height was tested on a specific brand of ice cream. Three levels of shelf height were tested, (a) knee level, (b) waist level, and (c) eye level.
The shelf height of the ice cream was randomly changed three times per day for each of eight days.

Kruskal-Wallis Test (cont’d)
The total sales in hundreds of dollars was recorded for the 8-day period:
Knee 77 82 86 78 81 86 77 81
Waist 88 94 93 90 91 94 90 87
Eye 85 85 87 81 80 79 87 93
The same process is used in SPSS, except we now choose:

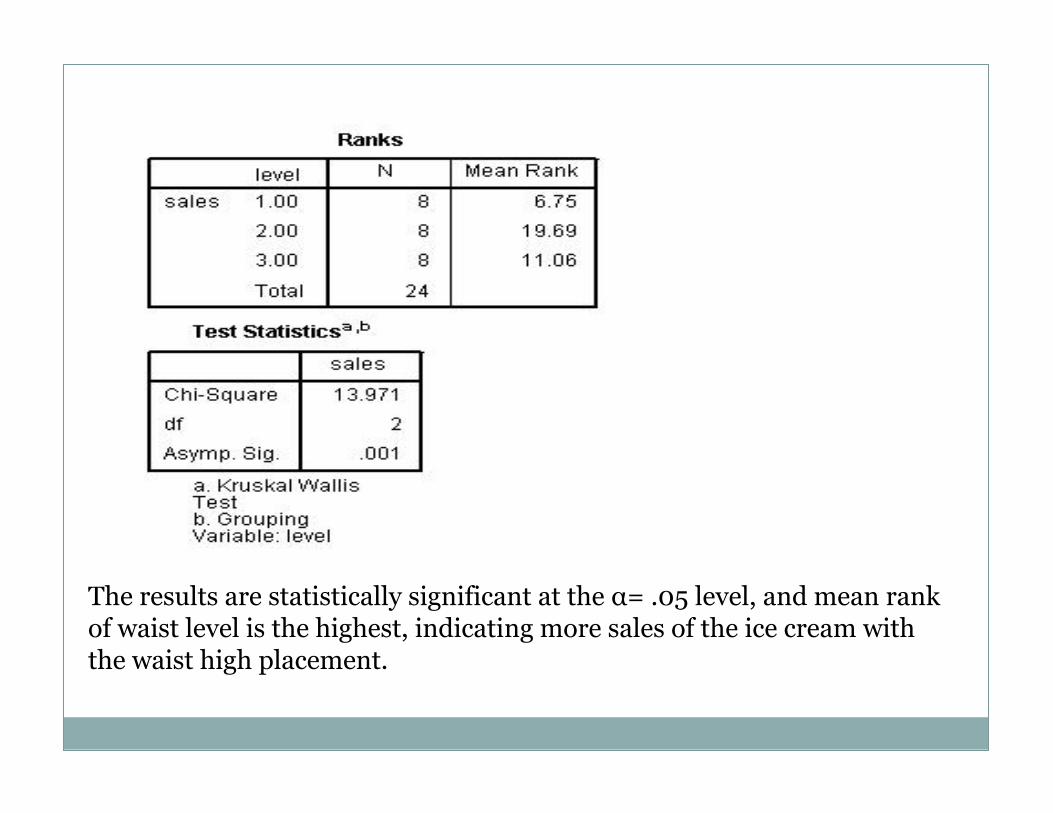
The results are statistically significant at the α= .05 level, and mean rank of waist level is the highest, indicating more sales of the ice cream with the waist high placement.
Nonparametric Alternative for Paired t-test The Wilcoxon Signed Rank Test
Subjects are measured at 2 different times, or under 2 different conditions, or are matched on a specific criteria. Also referred to as the Wilcoxon matched pairs signed ranks test.
Example:A shoe manufacturer wants to compare the wear of a new sole to the shoe sole currently in use. A random sample of 10 cross country runners was chosen and the old and new soles were places on each runners shoes in random order (some had the new sole on the left foot, others the right foot)
www.OmegaStatistics.com

Wilcoxon Signed Rank Test (cont’d)
Runner Old Sole New Sole
1 45.5 47.0
2 50.0 51.0
3 43.0 42.0
4 45.5 46.0
5 58.5 58.0
6 49.0 50.5
7 29.5 39.0
8 42.0 53.0
9 48.0 48.0
10 57.5 61.0


Results are not statistically significant at theα= .05 level.

Nonparametric Alternative to the One-Way Repeated Measures ANOVA
The Freidman Test
Use the Freidman test when you measure the same subjects at 3 or more time points, or under 3 conditions.
Example:A farmer tested the effects of 3 different fertilizers on his avocado yield. She chose 5 locations in her field and divided each of these five locations into 3 plots. She then randomly assigned one of the three fertilizers to one of the 3 plots in each location such that all 3 fertilizers were represented one time at each location. After one year she measured the yield of avocados for each plot.

Location Fertilizer A Fertilizer B Fertilizer C
1 11 14 10
2 13 17 15
3 16 20 13
4 10 12 10
5 12 16 12
Friedman Test (cont’d)
Here is the data:
www.OmegaStatistics.com


Friedman Test (cont’d)
We have statistical significance at the α= .05 level, and it appears that fertilizerB is the best.
www.OmegaStatistics.com

Nonparametric Alternative to Pearson’s Product Moment Correlation:
Spearman’s Rank Order Correlation
Pearson’s correlation can be used with continuous or dichotomous data. Spearman’s Rank Order correlation can be used when the data is at least ordinal.
As with the other techniques presented, Spearman’s correlation coefficient is determined by ranking data.
www.OmegaStatistics.com
Spearman’s Rank Order Correlation (Cont’d)
Example:
Five high school mathematics teachers were ranked by their principal according to their teaching ability. The teachers also took an exam that assessed their knowledge of the required mathematics subject matter. Is there agreement between the principal’s ranking and the assessment scores?
www.OmegaStatistics.com
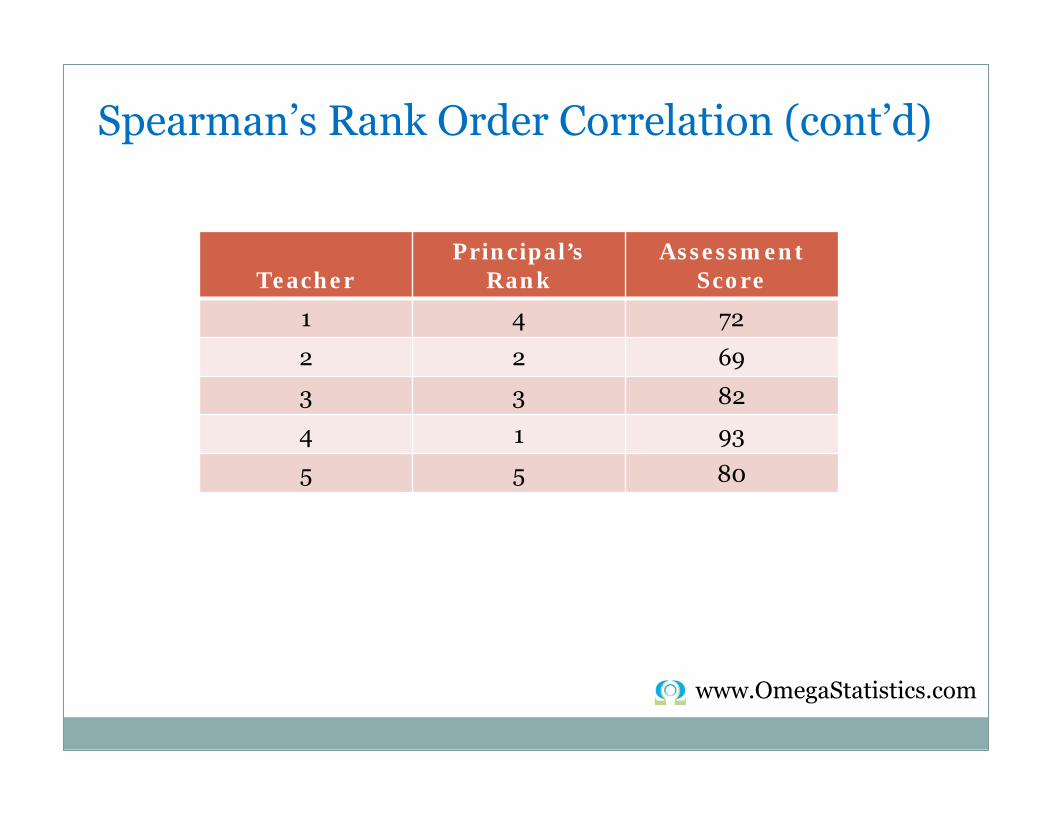
Spearman’s Rank Order Correlation (cont’d)
TeacherPrincipal’s
RankAssessment
Score
1 4 72
2 2 69
3 3 82
4 1 93
5 5 80
www.OmegaStatistics.com

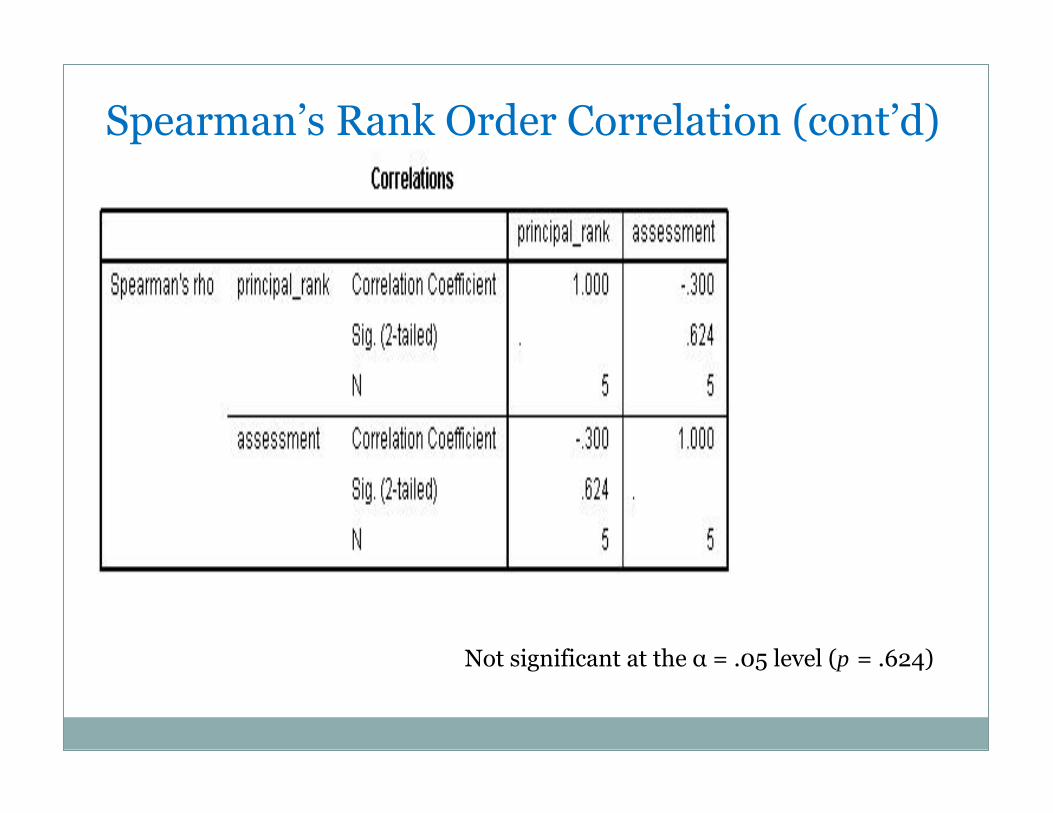
Spearman’s Rank Order Correlation (cont’d)
Not significant at the α = .05 level (p = .624)

So what do I do when my data is Nominal?The Chi-Square Test of Independence
Use the chi-square test of independence when you want to explore the relationship between 2 categorical variables.
Assumptions for the chi-square test of independence are:
Independence
Each in the contingency table must have an expected value of 5 or more. Some statistician relax this assumption a bit and require that at least 80% of the cells have an expected value of 5 or more.
www.OmegaStatistics.com

Chi-Square Test of Independence (cont’d)
Example: From SPSS Survival Manual, (Pallant ,2007)
Is there a relationship between gender and smoking behavior?
Smoker?
Gender Yes No Total
Male 18 107 184
Female 26 74 252
Total 85 351 436
www.OmegaStatistics.com


Some Final Notes
Parametric tests are very robust to deviations from the normality assumption and the presence of outliers if you have equal variance between your independent groups.
Q. Why don’t we always use nonparametric techniques?
A. Because the parametric tests are more powerful, meaning you will have a better probability of seeing significance that is truly in your data

I’ve covered only a small amount of nonparametric tests which were based almost entirely on the use of ranking data. I suggest you research more into the subject and you will discover many other types of tests that can be used.
Final Notes (cont’d)
A Useful Reference:
UCLA’s Academic Technology Department (ATS) has a great site with annotated output of tests for many statistical programs such as SPSS, R, and SAS.
http://www.ats.ucla.edu/stat/
www.OmegaStatistics.com
Thank You for Attending! Elaine Eisenbeisz, Owner and PrincipalOmega Statistics
41690 Ivy Street, Suite D6Murrieta, CA 92562
Phone: 951-461-7226 Fax: 951-461-7339Toll Free: 877-461-7226Email: [email protected]: www.OmegaStatistics.com
You can request a free copy of the webinar recording at:http://www.theanalysisfactor.com/webinars/recordings
This presentation was part of The Craft of Statistical Analysis Webinar Series, a free program of The Analysis Factor.