overview of pg&e’s der and smart grid activities · overview of pg&e’s der and smart...
TRANSCRIPT

Overview of PG&E’s DER and Smart Grid Activities Enabling Customer Options and California’s Clean Energy Future
Grid Integration & Innovation Team February 3, 2017

2
Agenda
• Safety & Introductions (9:00am - 9:10am)
• Overview of CA Policy Landscape (9:10am - 9:45am)
• Integration of DERs and Smart Grid Activities (9:45am - 10:45am) Operational
Technologies (inc. EV program, rates, and PG&E vehicles providing distribution services)
• PG&E Smart Grid/DER Pilots (10:45am-11:30am)
• Q&A/Discussion (11:30am-12:00pm)

3
Company Facts Fortune 200 company located in San Francisco, CA
$16.8B in operating revenues in 2015
Over 20,000 employees
Energy Supply Services to 16M people:
• 5.4M Electric accounts
• 4.3M Natural Gas accounts
Peak electricity demand: Approx. 21,000 MW
Approx. 60% of PG&E’s electric supply comes from
non-greenhouse gas emitting facilities
Service Territory 70,000 sq. miles with diverse topography
160,000 circuit miles of electric trans. and dist. lines
49,000 miles of natural gas trans. and dist. pipelines
Pacific Gas & Electric Company (PG&E)
Source: http://www.pge.com/en/about/company/profile/index.page , CEC California Energy Demand Forecast 2014-2024 Preliminary Forecast and PG&E 2015 10-K filing

4
Focus on Sustainability
4
PG&E U.S. Avg
RPS GHG Free
58%
32%
Nearly 2x More Carbon Free and Renewable
Energy Than The U.S. Average in 2015
Sustainability Advisory Council established in 2015
PG&E Customers Lead the Nation in
Clean Technology Adoption
~800 GWh/yr of efficiency savings Ranked #2 among U.S. utilities
>280,000 solar customers Ranked #1 with ~25% of all U.S. rooftop solar
Nearly 100,000 electric vehicles Ranked #1 with ~20% of all U.S. vehicles
Extensive Third Party Recognition

5
0
100
200
300
400
500
600
2000 2005 2010
California’s Climate Goals
5
California is Targeting:
50% renewables by 2030
1.5M electric vehicles by 2025
2X energy efficiency in existing buildings by 2030
California Greenhouse Gas Reduction Goals
and Historic Emissions*
Million metric tons CO2e
PG&E is a critical partner in achieving California’s clean energy goals
*Source: California Air Resources Board
2020 2030 2015 2025
AB 32 requires
California to return to
1990 levels by 2020
SB 32 requires at
least 40% below 1990
levels by 2030
Historic Emissions
Ag. & Forestry
Res. & Comm.
Transportation
Electricity
Generation
Industrial

Data Sources: PG&E’s 2002 Corporate Environmental Report, and PG&E’s 2015 10-K. PG&E 2020 forecast is based on PG&E’s 2014 RPS Compliance report filing.
2015
30% of total sales 2002
11% of total bundled retail
sales
2020
37% of total sales
PG&E’s Renewable Portfolio Progress
Almost 60% of the power supplied by PG&E in 2015 came from
renewable or carbon-free sources
6
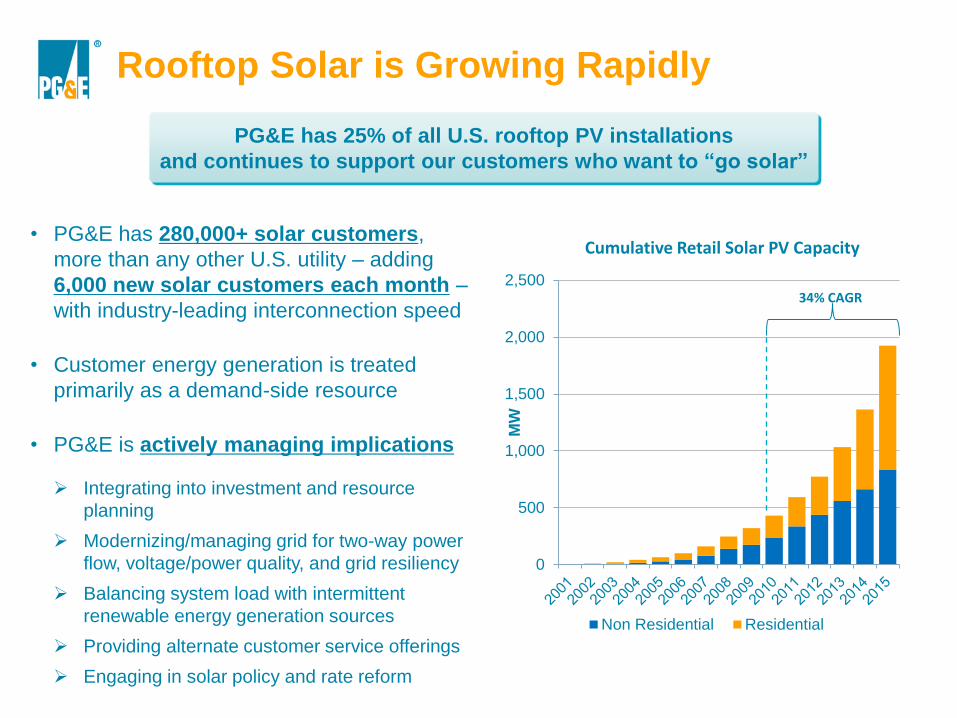
• PG&E has 280,000+ solar customers,
more than any other U.S. utility – adding
6,000 new solar customers each month –
with industry-leading interconnection speed
• Customer energy generation is treated
primarily as a demand-side resource
• PG&E is actively managing implications
Integrating into investment and resource
planning
Modernizing/managing grid for two-way power
flow, voltage/power quality, and grid resiliency
Balancing system load with intermittent
renewable energy generation sources
Providing alternate customer service offerings
Engaging in solar policy and rate reform
Rooftop Solar is Growing Rapidly
0
500
1,000
1,500
2,000
2,500
MW
Non Residential Residential
Cumulative Retail Solar PV Capacity
34% CAGR
PG&E has 25% of all U.S. rooftop PV installations
and continues to support our customers who want to “go solar”
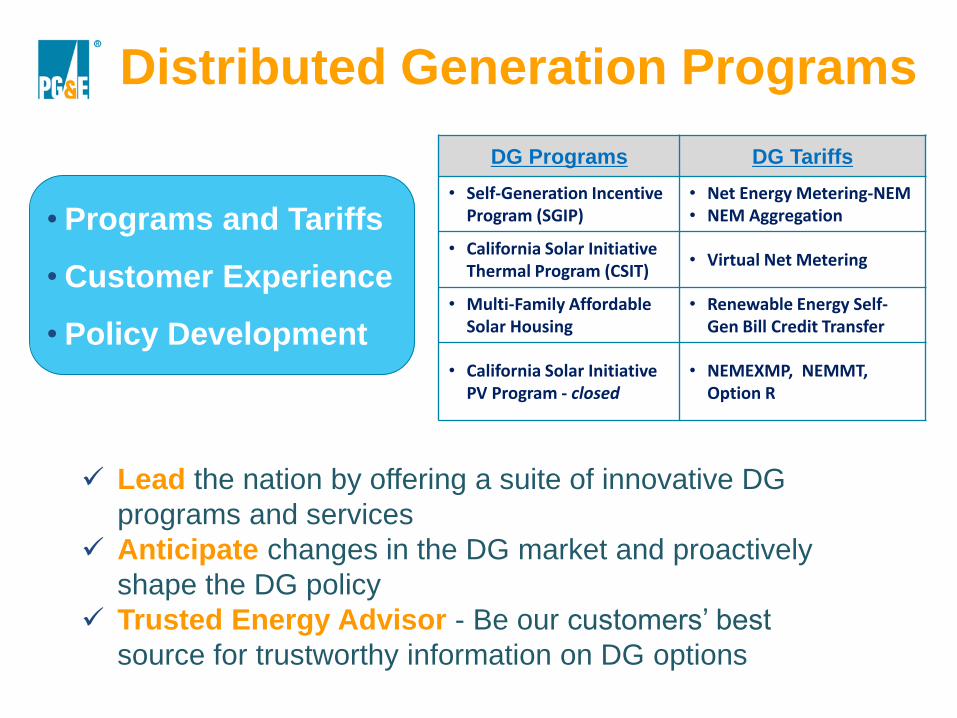
• Programs and Tariffs
• Customer Experience
• Policy Development
Lead the nation by offering a suite of innovative DG
programs and services
Anticipate changes in the DG market and proactively
shape the DG policy
Trusted Energy Advisor - Be our customers’ best
source for trustworthy information on DG options
DG Programs DG Tariffs
• Self-Generation Incentive Program (SGIP)
• Net Energy Metering-NEM • NEM Aggregation
• California Solar Initiative Thermal Program (CSIT)
• Virtual Net Metering
• Multi-Family Affordable Solar Housing
• Renewable Energy Self-Gen Bill Credit Transfer
• California Solar Initiative PV Program - closed
• NEMEXMP, NEMMT, Option R
Distributed Generation Programs

SGIP Program Technologies Offered
Revisions from D.16-06-055; “Current” as of 2016, “Adopted” as of 2017

SGIP Program Budget; 2017-2020
Category 2016 New Program 2017 - 2020
PG&E SGIP Budget $33.48M Double the budget &
CSI-style steps
Approx. $285M excluding
admin funds
Renewable & Emerging
Technologies (75%) $25.11M
Change to AES,
receiving 75% of
budget
~$214M
Non-Renewable Fueled
Conventional CHP Projects
(25%)
$8.37M
Change to Gen
receiving 25% of
budget
~$71M
Administration $2.52M No change ~$10M
*Before program opening in 2017, the 2017-2020 budget will be summed, split into the AES & Gen buckets
(75/25), and then split into 5 AES and 3 Gen incentive steps with carve-outs for 15% Resi AES and 40%
Renewable Generation.

11 11
Managing Evolution of Energy Landscape
Flexible Electric Portfolio
Utility-Owned Generation
~45%
Procured ~55%
Constructive Regulatory Mechanisms
Revenues decoupled from sales
Cost allocation mechanisms for
departing customers
Modernizing Rate Structures Focus on Continuous Improvement
Residential
Rate Design
Time of Use
Rates
Fixed/
Demand
Charges
Net Energy
Metering
CPUC Distributed Energy Resources Action Plan
Procurement
Efficiencies
Leveraging
Technology
Process Standardization
Sustainable Efficiencies

• Expand System Monitoring • Test and deploy new sensing and communication
technologies
• Develop and utilize sophisticated system modeling and forecasting
• Dynamic and Localized Control • Build communication and control systems to
mitigate any grid instability
• Test and deploy controls to capture potential grid value from DERs and other customer solutions
• Simple & Standard Integration • Strengthen the core system in preparation for
expanded DER penetration
• Develop and deploy standardized interconnection and ensure easy customer participation
The increase in distributed energy resources (DERs) leads to increased grid complexity
Significant investment in the grid is needed to address this complexity
The Grid is a Vital Component to a Reliable Energy Future & for Further PV Enablement
12

Integration of DERs and Smart Grid Activities

Objectives of Renewable Integration
Maintain current safety and reliability
Maximize the amount of interconnected renewable resources to meet GHG goals
Minimize interconnection and system upgrade costs
Lower energy costs to customers
Enhance System power quality and reliability
14

Power System Operation
Requirements
Existing system capabilities and
limitations
Regulatory Requirements
(Rule 2)
Renewable gen characteristics
& output profiles
Load characteristics
& profiles
Mitigation Measures
State Policy
Economics
Considerations for Renewable Integration
Solutions
15

DG must coordinate with various devices on a typical PG&E circuit.
Protection Devices Devices in RED such as breakers, reclosers, and fuses must be coordinated with DG protection
schemes, including anti-islanding, taking into account the additional fault contributions from DG.
Voltage Regulation Devices in GREEN are voltage devices that must be re-coordinated to account for DG flow
Most PGE feeders have voltage regulated by a substation Load Tap Changer and many have multiple capacitors and tap changing regulators
Conductors A portion of the feeder is considered “main line” where conductors are large
Tap lines are used to further distribute power and connect customers
Line transformers are used to step power down to secondary voltage to serve multi customers
Most of the lines are economically sized for the load that they are serving
SUB
R F F F
F
Typical Distribution Circuit Design
16
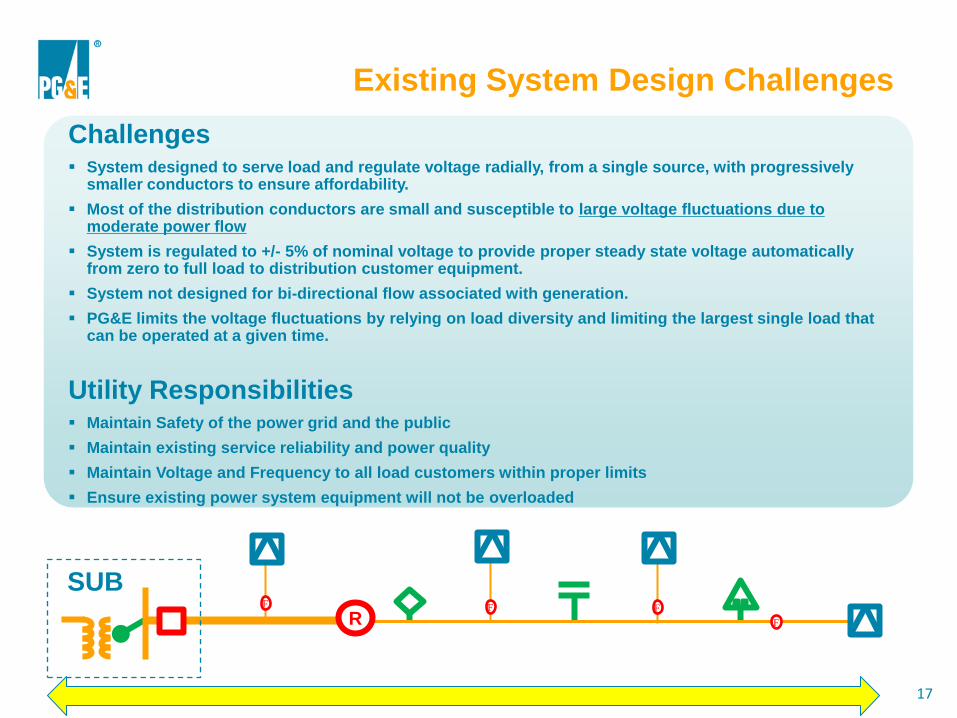
Challenges System designed to serve load and regulate voltage radially, from a single source, with progressively
smaller conductors to ensure affordability.
Most of the distribution conductors are small and susceptible to large voltage fluctuations due to moderate power flow
System is regulated to +/- 5% of nominal voltage to provide proper steady state voltage automatically from zero to full load to distribution customer equipment.
System not designed for bi-directional flow associated with generation.
PG&E limits the voltage fluctuations by relying on load diversity and limiting the largest single load that can be operated at a given time.
Utility Responsibilities Maintain Safety of the power grid and the public
Maintain existing service reliability and power quality
Maintain Voltage and Frequency to all load customers within proper limits
Ensure existing power system equipment will not be overloaded
Existing System Design Challenges
SUB
R F F F
F
17

DG Voltage Concerns
114 V
126 V
Acceptable
voltage band
With DG (PV)
Without DG (PV)
Feeder
Acceptable
Service
Voltage Band
Electric
Rule 2
18

Existing Requirements – Rule 21
Line Capacitor Line Regulator Substation LTC Customer
Load
Distributed
Generation
If the DG is operating within the existing distribution system design parameters, with no reverse flow, it has minimal system impact.
Rule identified low impact conditions and provided simplified requirements to allow small DG units at low penetration levels to be interconnected quickly as long as safety issues are addressed.
Typically, there are sufficient existing design & operating margin to accommodate the small DG units when they trip off-line. Some over-trip of the DG is deemed tolerable at the local level.
This significantly simplified the review & approval process and reduced the interconnect review time for the small units.
Typically, the small NEM PV units < than 30 kW can be approved and interconnected in < than 10 Working Days.
1. Majority of the existing inverters designed for lo penetration, grid interactive mode, set at unity power
factor and certified not to operate when the grid is de-energized (certified anti-islanding)
2. Grid interactive inverters produce the maximum available energy and rely on the grid for voltage and
frequency support, as well as back-up service when the DGs are not generating.
3. Some inverters are designed for stand-alone operation and have the capability to follow load and
regulate voltage after they are isolated from the gird. But schemes are more customized, costly and
complex; requiring further review.
Line Capacitor Line Regulator Substation LTC Customer
Load
Distributed
Generation
19

Today’s Planning Process
1. Forecast 5 Year Demand
2. Simulate to Identify Deficiencies
3. Develop Mitigations
1. Demand forecasting is performed for each feeder and bank using both regression and spatial forecasting algorithms with weather normalized peak KW and customer KWH consumption
2. One in 10 weather normalized peak load projections for each circuit is imported into the power flow CYME program to determine system adequacy. CYME incorporates historical PV through the load allocated using KWH consumption and other types of DG are added directly to each feeder model.
3. Mitigation options to address deficiencies are developed including system upgrades such as substation transformers, feeders, re-conductoring, voltage regulating devices and switching/load transfers. Non-wire options are also considered.
Preparing for the Future
Anticipated Changes At higher penetration, cumulative DG impacts are no longer negligible
Current interconnection requirements need to be revised (IEEE 1547, UL1741 and Rule 21)
Ride through capability needs to be expanded to avoid common mode failure
Smart inverter features are being expanded and certified
At high penetrations, there may be opportunities to realize DG benefits. DGs may need to be monitored and controlled by the distribution system operator (DSO).
20

AC Grids • Load and generation on the grid must be dynamically balanced at all times.
1. Adjust generation output level, add reserve generation or curtail generation to match load (traditional set-up)
2. Adjust load level by shedding load, or insert load banks (used only during emergency conditions)
3. Grid utilization voltage and frequency and power system equipment maintained within limits
Microgrids • DGs designed and operated to be capable of both grid-interactive and islanded modes, and to
coordinate with other generators on the microgrid.
– Sufficient aggregate local generation capacity to supply specified load at all times. May require adding storage, or standby generators, to accommodate intermittency:
• load following and frequency regulation
• voltage regulation- the micro grid studied at all load/generation conditions to have proper voltage on the entire micro grid
• redundant generation for reliability
• load shedding
• separation from the main grid without tripping generation
• synchronization with the grid at the return of main grid
Power Systems Requirements
21
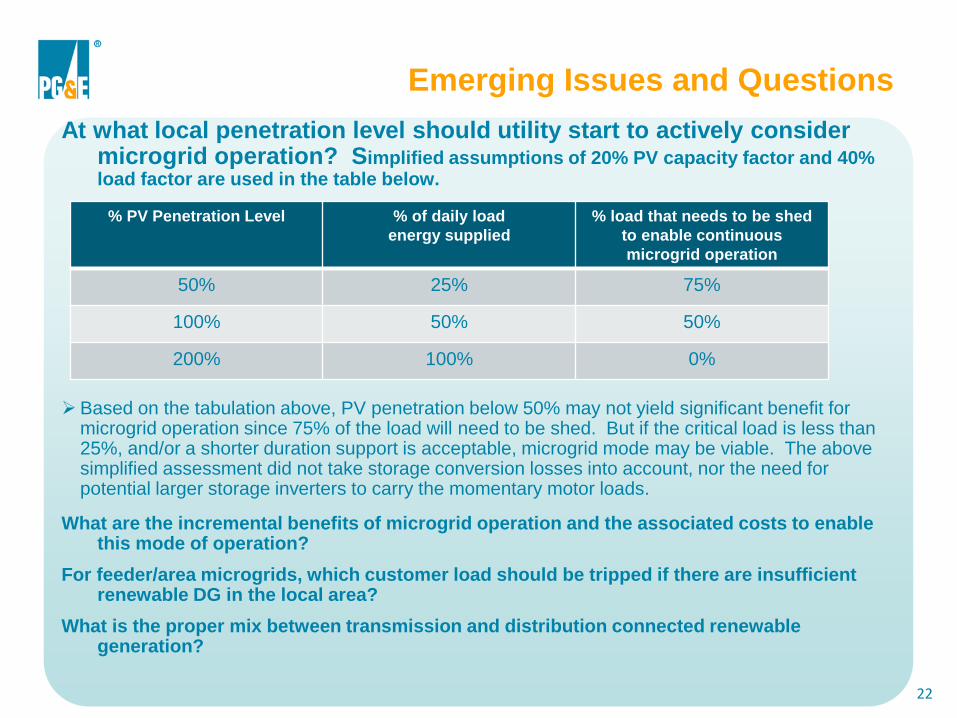
At what local penetration level should utility start to actively consider microgrid operation? Simplified assumptions of 20% PV capacity factor and 40% load factor are used in the table below.
Based on the tabulation above, PV penetration below 50% may not yield significant benefit for microgrid operation since 75% of the load will need to be shed. But if the critical load is less than 25%, and/or a shorter duration support is acceptable, microgrid mode may be viable. The above simplified assessment did not take storage conversion losses into account, nor the need for potential larger storage inverters to carry the momentary motor loads.
What are the incremental benefits of microgrid operation and the associated costs to enable this mode of operation?
For feeder/area microgrids, which customer load should be tripped if there are insufficient renewable DG in the local area?
What is the proper mix between transmission and distribution connected renewable generation?
Emerging Issues and Questions
% PV Penetration Level % of daily load
energy supplied
% load that needs to be shed
to enable continuous
microgrid operation
50% 25% 75%
100% 50% 50%
200% 100% 0%
22

1. Limit behind the meter installations to non-export
Allow the distribution system to operate with power flow in one direction and may significantly reduce the mitigation costs.
2. Connect larger installations to large mainline conductors close to substations.
3. Connect the large units with dedicated feeders to avoid causing voltage problems with other distribution customers.
4. Install batteries on larger PV installations and modify the inverter design to ramp power up and down gradually to minimize voltage flicker, as needed.
Allow the voltage regulators sufficient time to correct for voltage fluctuations due to sudden PV/wind output changes during cloud movements/wind gusts. Trade-off some increase in wear and tear on the existing voltage regulators.
5. Use smart inverters to control voltage within limits.
6. Use storage for load/generation peak shaving and short term UPS applications.
7. Design the PV to align the PV output closer to load peak.
8. For microgrid applications, consider using fuel-based generators, in addition to short term storage, for infrequent long outage support.
9. At high system-wide PV penetrations, use TOU rates to shift the load peak close to noon and minimize the need to deploy expensive batteries.
Enable a broader set of DG capabilities to fully utilize resources to support the grid.
Potential Mitigations to Reduce Cost
23

24
PG&E and California are seeing strong EV adoption
1. EPRI, R.L. Polk Data, 2016
5,000-30,000
1,000-4,999
500-999
100-499
0-99
Cumulative EV Sales by County1
PG&E Service Area
110,000 EVs in PG&E service
area today
PG&E’s service area adds over 2,400 new EVs
each month. Adoption has been strongest
around the Bay Area.
5% of 2016 new vehicle sales in PG&E
service area were electric vehicles
-
30,000
60,000
90,000
120,000
-
1,000
2,000
3,000
4,000
2011 2012 2013 2014 2015 2016
Cu
mu
lati
ve E
V r
egi
stra
tio
ns
Mo
nth
ly E
V r
egi
stra
tio
ns
Plug-in hybrid electric vehicles Battery electric vehicles Cumulative Total

25
PG&E offers special time-of-use rates for residential EV charging
Summer: $0.45
Winter: $0.31
Summer: $0.24
Winter: $0.19
Summer: $0.12
Winter: $0.12
Approx.
cost per
kWh
80% of EV charging occurs at home • Time of use rates encourage off-peak charging and lower fuel costs
Best for higher energy users (Tier 2 & 3), who can shift usage to overnight
Visit www.pge.com/myrateanalysis

26
Utility infrastructure programs address key barrier to adoption
Summary of Approved Decision:
• Scope: 3-years, $130M budget
• Scale: Up to 7,500 level 2
chargers (approx. 500-750 sites)
• Sites: Multi-unit dwellings (MUDs)
and workplaces
Details:
• Minimum 15% of sites located in disadvantaged communities
• Site host choice of charging equipment and products from prequalified vendors
• Option to own chargers or sponsor PG&E-owned chargers in certain sectors
• Rolling procurement/qualification process
• Driver pricing & load management flexibility for site hosts
Timeline for implementation:
• Commission voted unanimously to approve decision on December 15th
• PG&E beginning program contracting and site host recruitment in early 2017.
• First site deployments expected Q4 2017

27
Utility fleet vehicles for power export and distribution services
Project Objective:
• Develop vehicle technology and
demonstrate “vehicle on-site grid
support system” with utility-grade
power
• Use fleet vehicles to power distribution
circuit or independent load
• Increase reliability through avoiding
planned or unplanned outages
Use cases tested:
• Transformer replacement
• Power on demand (Events) and EV
charging
• Establish temporary microgrid
• Remote specialty equipment
transport and power
Benefits
Safety: support for emergency response, quieter
work environment for crews
Reliability: reduced outage impacts
Affordability: leverage vehicle fleet instead of
investment in generator sets
Societal: Reduced emissions and noise pollution

PG&E Smart Grid/DER Pilots

PG&E Electric Emerging Technology Programs
Smart Grid
Pilot Projects
Overview: Test and pilot Smart
Grid technologies to determine
the business case for larger
scale deployment
2013-2016 (~4 years)
Pilot Projects: 1. Smart Grid Line Sensors
2. Volt/VAR Power Optimization
3. Detect & Locate Outages and
Faulted Circuits
4. Short-term Demand Forecasting
EPIC Program (Electric Program Investment Charge)
Overview: Test and field trial new
automation, analytics, control and
measurement technologies to
meet priority utility objectives.
2014-2020 (6 years)
31 projects underway
Focus Areas: 1. Renewables and Distributed Energy
Resource Integration
2. Grid Modernization and Optimization
3. Customer Service and Enablement
4. Cross-cutting / Foundational
CES-21 (California Energy Systems
for the 21st Century)
Overview: Partnership with
Lawrence Livermore National
Laboratories (LLNL) and IOUs to
use advanced computational and
analytical capabilities for utility
challenges
2015-2017
(3 years, possible ext. to 2019)
Focus Areas:
1.Cybersecurity
2.Grid Integration
New research, development, and demonstration programs approved by the CPUC to bring
new technologies and new insights to support PG&E’s business priorities in the future
Research & Develop New Technologies Demonstrate Emerging Technologies Pilot Existing Technologies
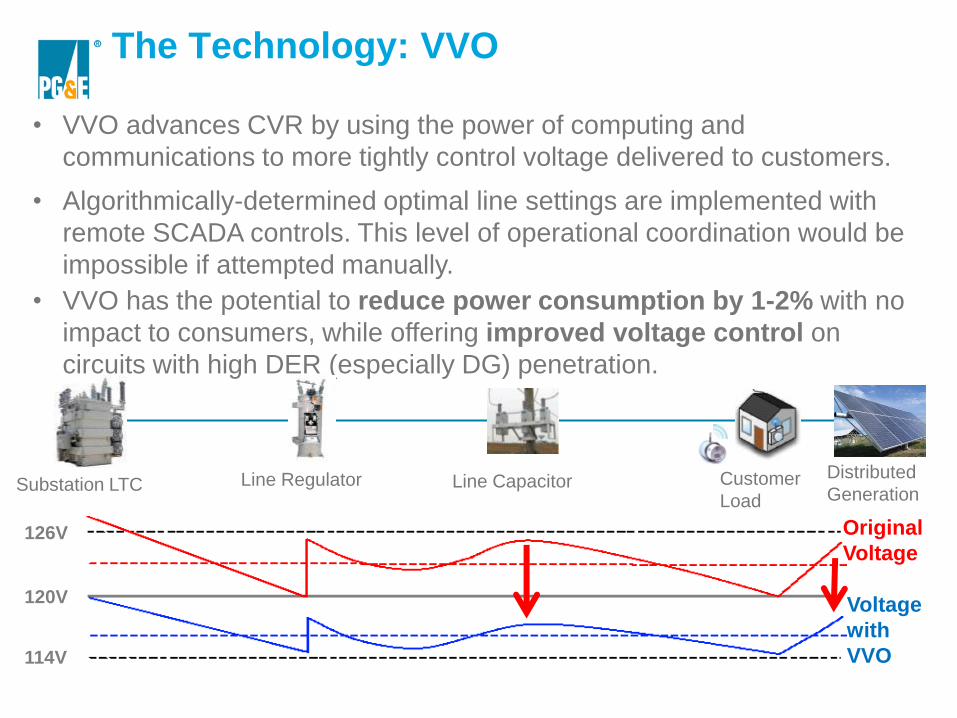
The Technology: VVO
120V
126V
114V
• VVO advances CVR by using the power of computing and
communications to more tightly control voltage delivered to customers.
• Algorithmically-determined optimal line settings are implemented with
remote SCADA controls. This level of operational coordination would be
impossible if attempted manually.
• VVO has the potential to reduce power consumption by 1-2% with no
impact to consumers, while offering improved voltage control on
circuits with high DER (especially DG) penetration.
Line Capacitor Line Regulator Substation LTC Customer
Load
Distributed
Generation
Original
Voltage
Voltage
with
VVO

Standard Characteristics Top Capabilities of Certain Models
• Powered by line current • Easy to install
• Constant communications
• Real-time load and fault
values
• Electric sinusoidal waveform capture
• Electric indication of voltage levels
• Ability to detect current direction reversal
(useful for high DG environments)
The Technology: Line Sensors
• Traditional Faulted Circuit Indicators are “dumb” – they
turn on a light, providing a visual clue to field teams to
isolate a fault.
• Wireless Line Sensors are “smart” – they add
communications capability and provide sophisticated
data and sensing capabilities.
Characteristics of Modern Line Sensors
Traditional
Faulted
Circuit
Indicator
Line Sensors are remotely communicating devices that safely attach to
distribution wires, detect line current magnitude, and provide fault alerts.

The Technology: Calculated Fault Location
Using the knowledge of the
relationship between voltage,
current, and resistance, CFL
calculates the probable distance
from the substation to the fault.
Calculated Fault Location (CFL) is a mathematical method
of locating faults extrapolated from Ohm’s Law.
However, CFL is insufficient alone
because it can identify: • Too many possible fault locations because of
line branching
• Incorrect locations due to faulty
measurement data or system models
Too Many Results: All five are the
same distance from the substation

Layering Fault Location Approaches
CFL only Voltage Line Sensors “Layered View”
Filtered view shown
to operators
• In the example above left, all CFL-identified
locations are mathematically correct, but dispersed
and not helpful.
• The layered approach taken by the FDL project
reduced the area of potential fault location down to
the two orange highlighted areas at right. Actual fault
location
Solution Demonstrated: Layer data from CFL calculations, wireless line
sensors, and voltage data to narrow the results.

Enhance Decision Making
Enable Customers
Automate and Self
Heal
How PG&E is building the Grid of Things
Integrate Clean DERs
Move beyond accommodating DERs
to realizing the full resource value
Enhance decision making by gathering, analyzing, and visualizing new and expanding data streams to improve
operations, manage costs and support new services
Leverage technology to anticipate and respond to a more dynamic environment
Provide valuable services and products to further unlock benefits of the grid
Evolving four main capabilities to support a long term and sustainable business strategy, while continuing efforts to modernize existing grid assets

Landscape
• By 2025, millions of third party-owned DERs (ex. PV, battery storage, electric vehicles) are estimated to be interconnected to the
PG&E electric grid
• The DRP and other regulatory drivers are directing CA IOUs to enable behind-the-meter DERs to provide grid benefits
Demonstrating the Technology
• EPIC BTM Smart Inverters: demonstrate how Smart Inverters can be utilized to mitigate voltage issues that can be caused by
reverse power flow from solar PV to the grid
• EPIC BTM Energy Storage: demonstrate how aggregated BTM energy storage can be used to reduce electric load or absorb
distributed generation as needed
• EPIC DERMS: demonstrate how a centralized management system can control utility-owned and BTM DERs to realize utility and
customer benefits
• Smart Grid VVO: understand how smart inverters can work as optimization devices to manage voltages and save customers
money through conservation voltage reduction
PG&E DG Pilots – Background
35

Detailed Overview of Pilots
# Pilot
Name Goal
How Does it Work /
Value Proposition
Customer
Enrollment
Target
Installation
Date
Target
Audience
Customer
Count
Target
Location
1
EPIC
BTM
Smart
Inverters
Demonstrate how
Smart Inverters can be
utilized to mitigate
voltage issues that can
be caused by reverse
power flow from solar
PV to the grid.
Voltage can spike, tripping solar
inverters and cascading to
transformers and other
equipment; communications can
protect grid by turning off the
inverter to not continue the
cascading voltage trip.
≈100
customers
(500kW)
Q3 2016
Res;
Commercial;
Industrial
Res ≈ 100
C&I ≈ 0 San Jose Div.:
Swift Bk 1
2
EPIC
BTM
Storage
Demonstrate
aggregated BTM
storage resources can
be used to reduce
electric load or absorb
distributed generation
as needed.
During peak usage periods,
loading on some utility
distribution feeders can
approach or exceed the rated
capacity of those feeders. BTM
storage can help with peak-load
reduction. Unexpected increase
in demand can be filled quickly
by battery storage.
40-70
customers
(0.5 MW;
4 MWh)
Late 2016/
Early 2017
Res: 30%
C&I: 70%
Res ≈ 30
C&I ≈ 20 San Jose Div.:
Swift Bk 1
3 EPIC
DERMS
Prove management
capabilities of DER
technology integration.
Two way communications
network between utility and DER
equipment.
Part of EPIC
projects
above
Late 2016/
Early 2017 - -
San Jose Div.:
Swift Bk 1
36

BTM Smart Inverters
Project Description: Deploy a 0.5 MVAR of Smart Inverters in San Jose (Grid of Things™ feeder) can be
utilized to mitigate voltage issues that can be caused by reverse power flow from solar PV to the grid. This
project will demonstrate various options to utilize customer-sited smart inverters (utility-controlled or
automated) vs. standard inverters to derive grid benefits.
Response to Abnormal Conditions
• L/HVRT-L/HFRT – Stay connected through short-term disturbances
• Anti-Islanding – Disconnect, prevent unintentional islanded operation during grid outage
• Reconnect and Ramp – Controlled reconnect and ramp following grid recovery
Active Power Control
• Limit Power Output – Limit maximum generation
• Volt-Watt – Adjust active power output based on grid voltage
• Ramp up/down rate – Provide gradual increase/decrease of power output when connecting/disconnecting
Reactive Power Supply
• Power Factor – Compensate for grid voltage rise/drop or reactive power demands
• Volt-VAr – Support grid voltage stabilization
Key functionalities tested:
37
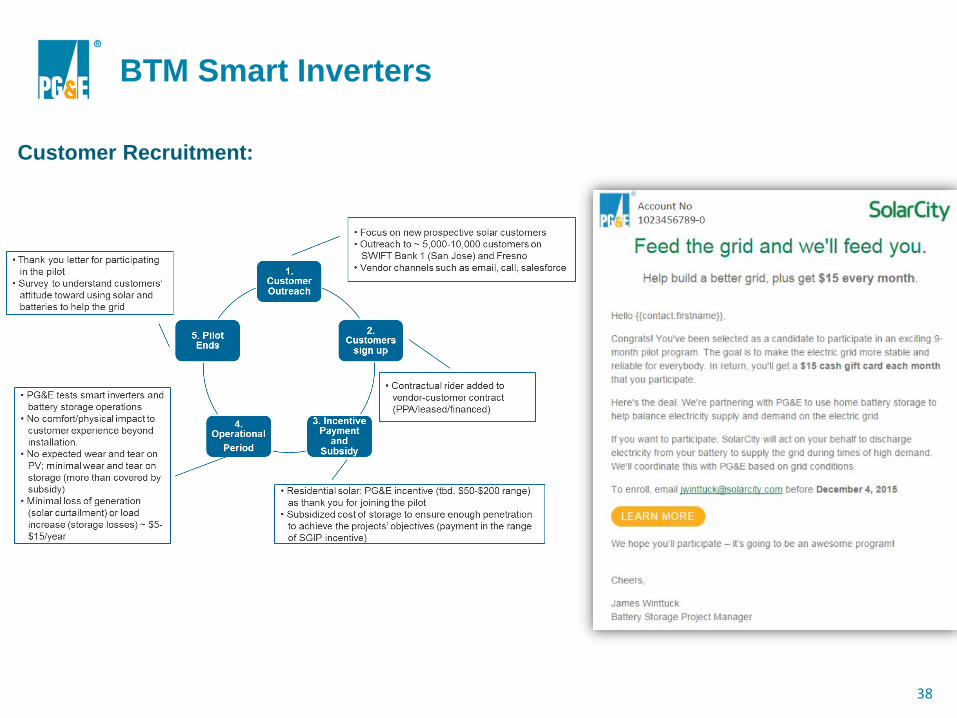
BTM Smart Inverters
Customer Recruitment:
38
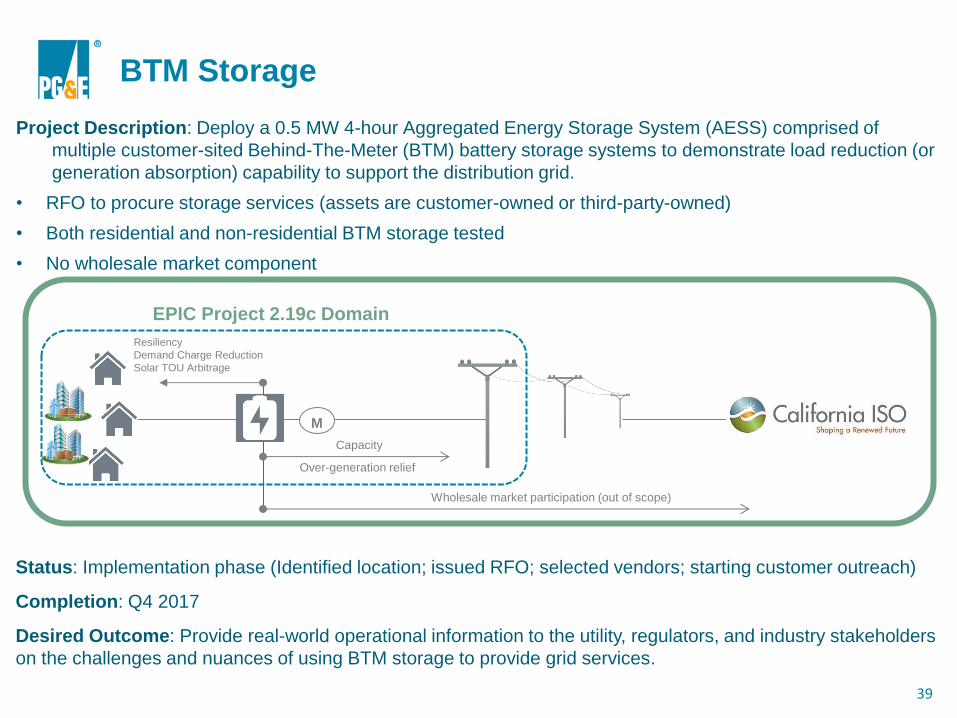
BTM Storage
Project Description: Deploy a 0.5 MW 4-hour Aggregated Energy Storage System (AESS) comprised of
multiple customer-sited Behind-The-Meter (BTM) battery storage systems to demonstrate load reduction (or
generation absorption) capability to support the distribution grid.
• RFO to procure storage services (assets are customer-owned or third-party-owned)
• Both residential and non-residential BTM storage tested
• No wholesale market component
M
Resiliency
Demand Charge Reduction
Solar TOU Arbitrage
Over-generation relief
Wholesale market participation (out of scope)
EPIC Project 2.19c Domain
Capacity
Status: Implementation phase (Identified location; issued RFO; selected vendors; starting customer outreach)
Completion: Q4 2017
Desired Outcome: Provide real-world operational information to the utility, regulators, and industry stakeholders
on the challenges and nuances of using BTM storage to provide grid services.
39
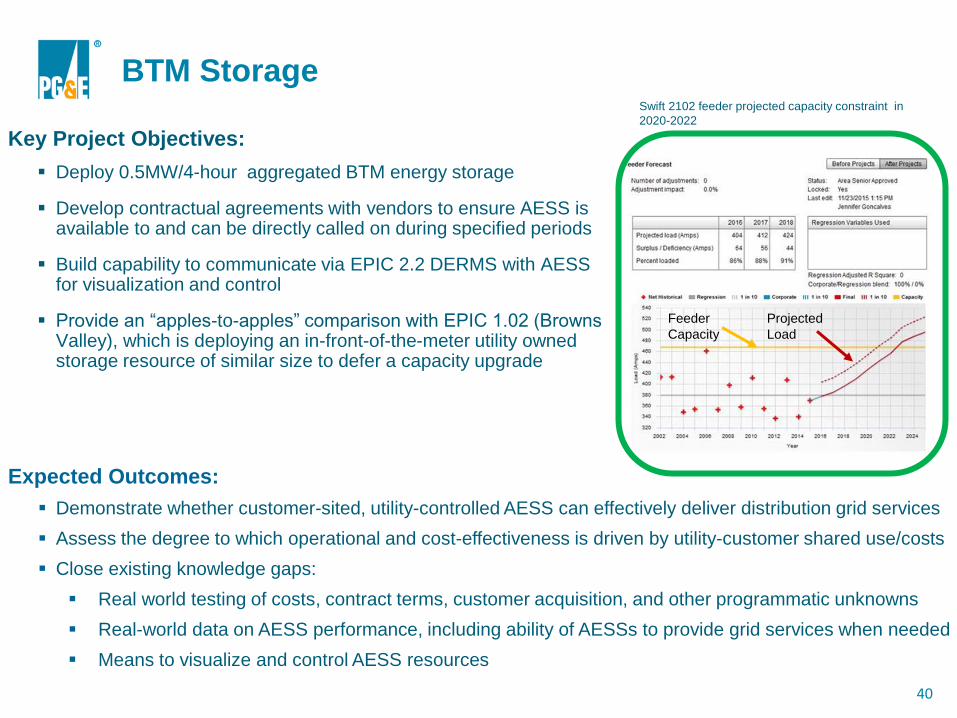
Key Project Objectives:
Deploy 0.5MW/4-hour aggregated BTM energy storage
Develop contractual agreements with vendors to ensure AESS is available to and can be directly called on during specified periods
Build capability to communicate via EPIC 2.2 DERMS with AESS for visualization and control
Provide an “apples-to-apples” comparison with EPIC 1.02 (Browns Valley), which is deploying an in-front-of-the-meter utility owned storage resource of similar size to defer a capacity upgrade
BTM Storage
Expected Outcomes:
Demonstrate whether customer-sited, utility-controlled AESS can effectively deliver distribution grid services
Assess the degree to which operational and cost-effectiveness is driven by utility-customer shared use/costs
Close existing knowledge gaps:
Real world testing of costs, contract terms, customer acquisition, and other programmatic unknowns
Real-world data on AESS performance, including ability of AESSs to provide grid services when needed
Means to visualize and control AESS resources
Swift 2102 feeder projected capacity constraint in
2020-2022
Feeder
Capacity
Projected
Load
40

Grid of Things Feeder™ Press Release (July 12 )
Recent PG&E announcement highlights collaboration between PG&E and GE, SolarCity and Enphase Energy to test deployment of Behind-the-Meter Smart Inverters (and Storage) to provide grid benefits.

Location and Customer Acquisition
Customer acquisition in targeted areas
• Up to three waves of customer outreach
• PG&E-Vendor co-branded material
• Vendor-led, PG&E-supported effort
Channels:
• email, field sales, calls
Communications:
• Press-release (Corp Comm)
• Coordination PG&E Contact Center and Vendor Contact Center
Closeout:
• Customer survey