overview of private equity in the real estate market irf conference 20 august 2013
TRANSCRIPT

Overview ofPrivate Equity inthe Real Estate
Market
IRF Conference 20 August 2013

The Basics – A Generic PE Structure
Private Equity Firm (General Partner or GP)
Limited Partner or LP (Public Pension Funds, Corporate Pension Funds, Insurance Companies,
High Net-Worth Individuals, Family Offices, Endowments, Foundations, Sovereign Wealth Funds)
Private Equity Fund (generally an LLP)
Investment Investment Investment
Fund ownership of portfolio investments
Ownership of the Fund
Fund Investment & Management

Alignment between GP and LPs
• GPs and LPs are aligned as minimum watermark IRR for LPs needs to be achieved before GP participates in the carry
• Common carry split between LPs and GPs is 80/20, and the common base fee is 2%, hence the PE jargon of “2 and 20”
• A preferred return or watermark IRR is usually determined by the sector
• In African property, the watermark IRR ranges from 8 to 10%, depending on the type of real estate fund (income vs development)
• LPs are also starting to take positions in GPs
Private Equity in South Africa
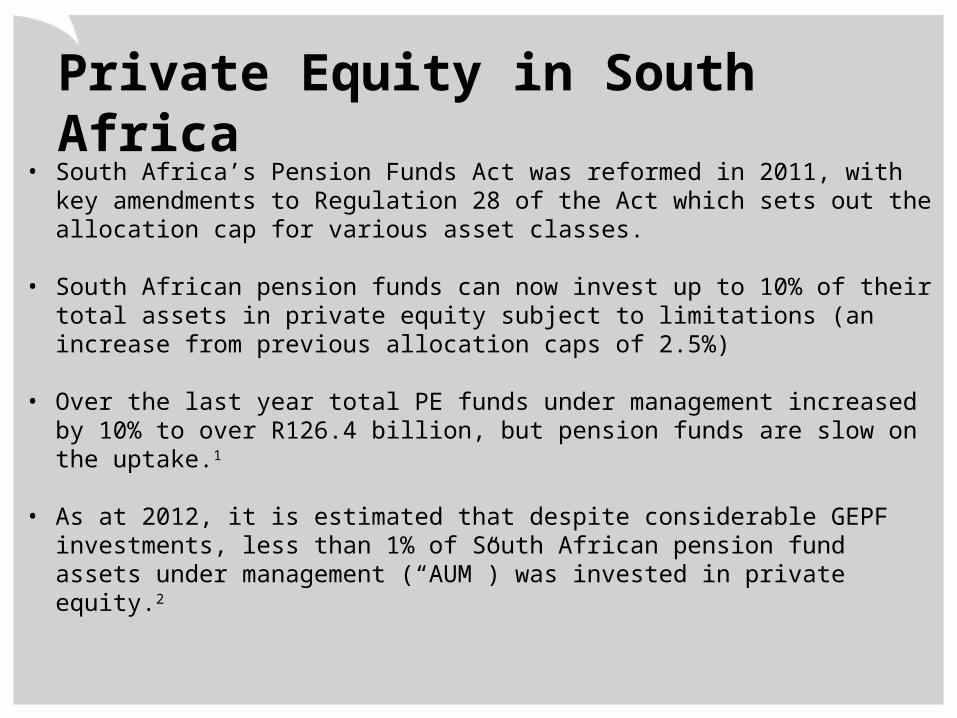
• South Africa’s Pension Funds Act was reformed in 2011, with key amendments to Regulation 28 of the Act which sets out the allocation cap for various asset classes.
• South African pension funds can now invest up to 10% of their total assets in private equity subject to limitations (an increase from previous allocation caps of 2.5%)
• Over the last year total PE funds under management increased by 10% to over R126.4 billion, but pension funds are slow on the uptake.1
• As at 2012, it is estimated that despite considerable GEPF investments, less than 1% of South African pension fund assets under management (“AUM”) was invested in private equity.2
1 South African Venture Capital Association
2 E. Pickworth (2012) “Pension fund ‘missing out on private equity”, Business Day (South Africa), 11 September 2012
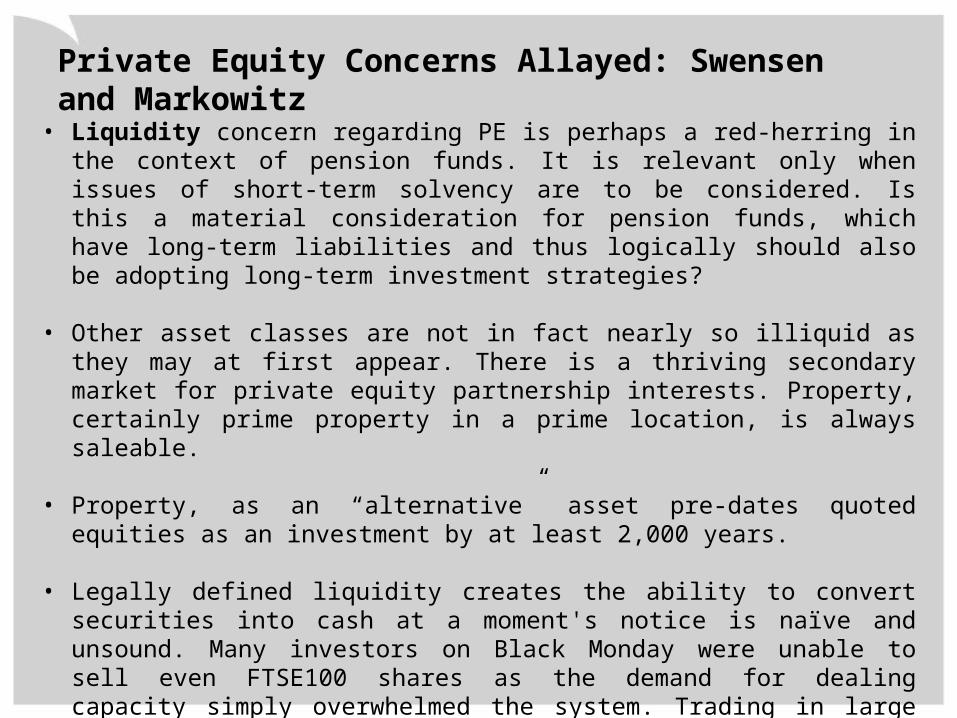
Private Equity Concerns Allayed: Swensen and Markowitz
• Liquidity concern regarding PE is perhaps a red-herring in the context of pension funds. It is relevant only when issues of short-term solvency are to be considered. Is this a material consideration for pension funds, which have long-term liabilities and thus logically should also be adopting long-term investment strategies?
• Other asset classes are not in fact nearly so illiquid as they may at first appear. There is a thriving secondary market for private equity partnership interests. Property, certainly prime property in a prime location, is always saleable.
• Property, as an “alternative” asset pre-dates quoted equities as an investment by at least 2,000 years.
• Legally defined liquidity creates the ability to convert securities into cash at a moment's notice is naïve and unsound. Many investors on Black Monday were unable to sell even FTSE100 shares as the demand for dealing capacity simply overwhelmed the system. Trading in large blocks of listed equities is not as liquid as imagined.
• There is a tendency among trustees and consultants alike to regard “illiquid” and “alternative” assets as the same, and it seems followers of “alternative” assets might be compared to the original protestants who brought about the Reformation.

Private Equity Funds looking for a homeGPs stockpiled with dry powder fuelling deal demand
Source: Bain and Company

Funds on the road and capital split by fund type in 2012
Source: Bain and Company

PE versus other Asset Classes:Developed Markets
Note: Data based on review of public pension funds in North America and EuropeSource: Bain and Company
Median returns for public pension funds by asset class, 10 year horizon IRR, June 2012

What Emerging Market Investors are saying…

LPs planning to begin or expand investment in Select Emerging Markets by Institution Type
Investors in Private Equity
Source: Emerging Markets Private Equity Association LP Survey 2013

Investors in Private Equity – Views on Africa
The Attractiveness of Emerging Markets for GP Investment Over the Next 12 Months – LP Views Overall Ranking 2013 2012 2011Sub-Saharan Africa 1 5 7Southeast Asia* 2 4 2=Latin America (ex-Brazil) 3 1 4China 4 3 2=Turkey 5 7 6Brazil 6 2 1Central and Eastern Europe 7 10 8Russia/CIS 8 8 10India 9 6 5Middle East and North Africa 10 9 9*Classified as “Other Emerging Asia” in 2011 and 2012
• Sub-Saharan Africa for the first time leads a new tier of Emerging Markets, for the first time, jumping from 5th place in 2012
• Displaced BRICs as most attractive • First time In the EMPEA survey’s nine-year history, none of the BRIC markets
broke the top three.
Why we like Africa...

Large consumer marketHome to more than 1 billion people
1 dot = 100,000 people
Source: Market Decisions
• Fast growing economies, underpinned by domestic consumption
• CAGR in consumption of 11.4% over the next three years1
• Increased urbanisation, 47% of Africans will live in cities by 20251
• Emerging middle class; 95% of the market currently informal; 20% of the market to be formal by 20302
1 United Nations Human Settlements Programme (UN-HABITAT) 2 BofA Merrill Lynch Global Research

Africa continues to riseFDI has grown considerably over the last decade
• FDI in SSA has grown to 5.6% of world FDI over the past five years• South Africa invested over US$ 800 million in SSA during 20121
1 Real Capital Analytics

0
1
2
3
4
5
6
7
8
%y/y
Sub-Saharan Africa real GDP growth
Source: STANLIB Research

1.8
2.0
2.2
2.4
2.6
1992
1993
1994
1995
1996
1997
1998
1999
2000
2001
2002
2003
2004
2005
2006
2007
2008
2009
2010
2011
2012
2013
% of world GDP, PPP
Sub-Saharan Africa percentage of World GDP
Source: STANLIB Research
-20
-15
-10
-5
0
5
10
15
20
25
2000
2001
2002
2003
2004
2005
2006
2007
2008
2009
2010
2011
2012
2013
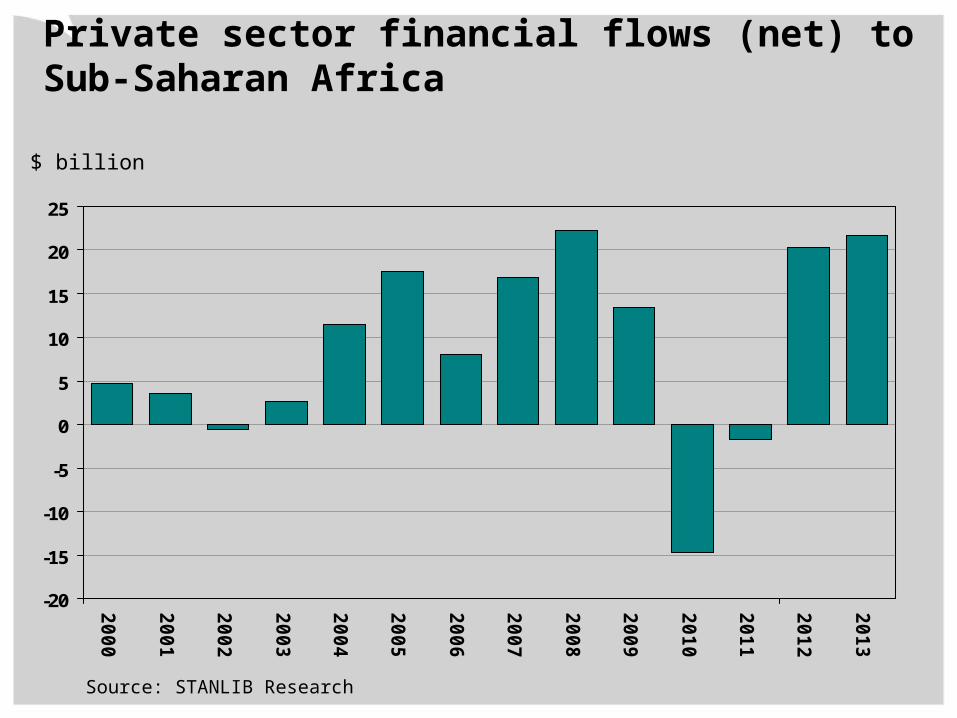
$ billion
Private sector financial flows (net) to Sub-Saharan Africa
Source: STANLIB Research
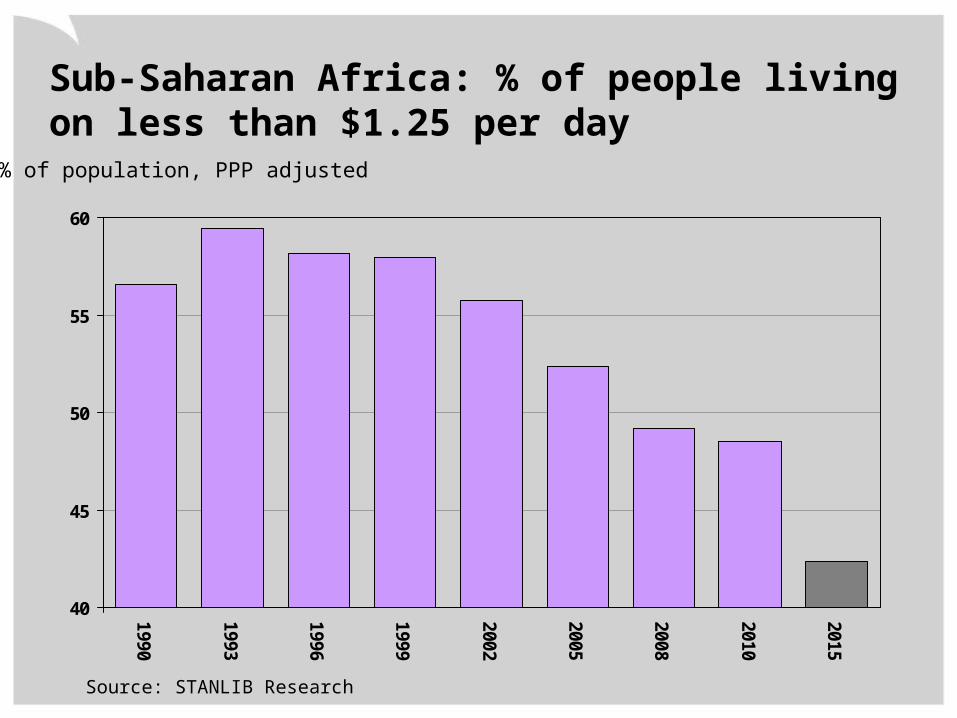
40
45
50
55
60
1990
1993
1996
1999
2002
2005
2008
2010
2015
% of population, PPP adjusted
Sub-Saharan Africa: % of people living on less than $1.25 per day
Source: STANLIB Research

RISING STRIVER PROFILE- 27 year old father of 2- Thriving taxi business- Lives in city centre and has a car- Most of income on household needs + a new smartphone + drink after work
Aspirational consumer market

Growing consumer expenditure

African Property Fundamentals…
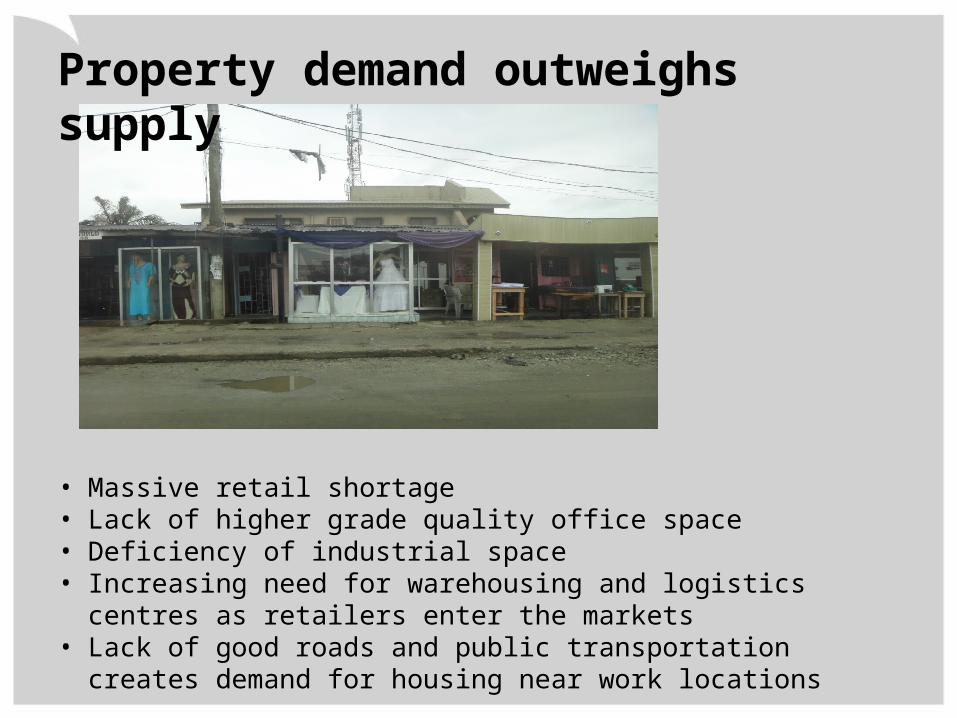
• Massive retail shortage• Lack of higher grade quality office space• Deficiency of industrial space• Increasing need for warehousing and logistics centres as retailers enter the
markets• Lack of good roads and public transportation creates demand for housing
near work locations
Property demand outweighs supply

Property fundamentals are strongAn opportunity for further 3 million m2 of retail in Lagos
Source: BofA Merrill Lynch Global Research, IMF, Euromonitor, SACSC, CIA Factbook
• Johannesburg: 4,200,000m2 formal retail & 3.6 million people
• Lagos: 42,000m2 formal retail & 10.2 million people
City m² : people
Johannesburg > 1 m² per capita
Lagos 0.005m² per capita
City m² : people
Johannesburg >1m² per capita
Lagos 0.2m² per capita
and if 1 person’s spending power in Johannesburg equals 4 people’s spending power in Lagos
This represents an opportunity to develop up to 3,000,000m2 of formal retail property in Lagos.
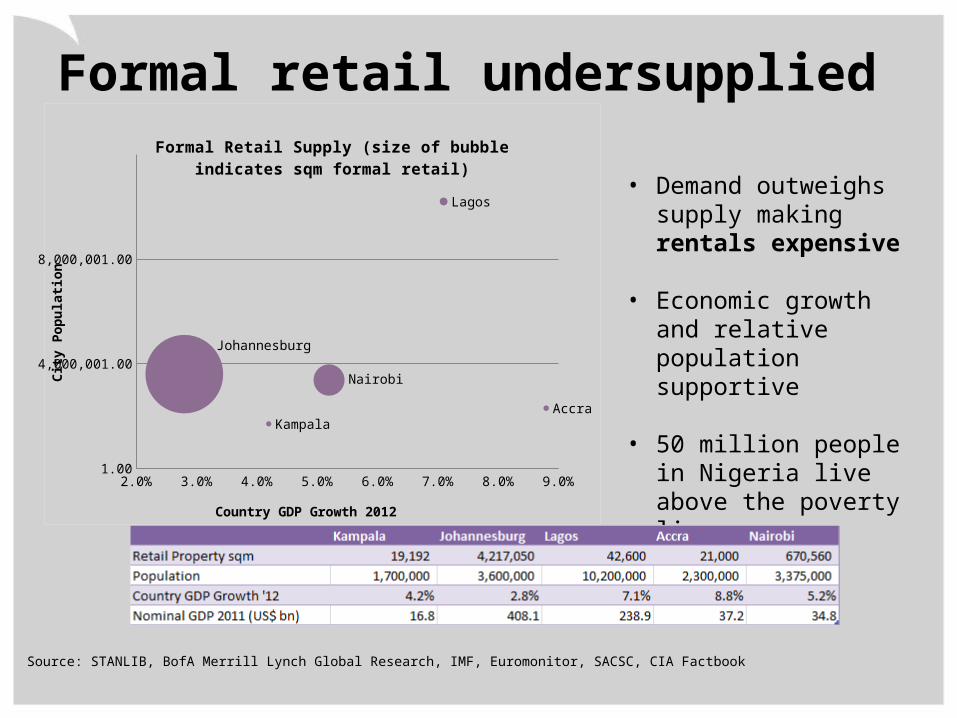
Formal retail undersupplied
Source: STANLIB, BofA Merrill Lynch Global Research, IMF, Euromonitor, SACSC, CIA Factbook
• Demand outweighs supply making rentals expensive
• Economic growth and relative population supportive
• 50 million people in Nigeria live above the poverty line
2.0% 3.0% 4.0% 5.0% 6.0% 7.0% 8.0% 9.0%
1.00
4,000,001.00
8,000,001.00
Kampala
Johannesburg
Lagos
Accra
Nairobi
Formal Retail Supply (size of bubble indicates sqm formal retail)
Country GDP Growth 2012
City
Pop
ulati
on

Sound underlying drivers of return
Source: Knight Frank, Africa Report 2013STANLIB Research
• Average Regional retail rentals / m²• Lagos $65 Nairobi $31• Accra $45 Johannesburg $45
• Average High grade office rentals / m²• Lagos $85 Nairobi $15• Accra $40 Johannesburg $20
• Average yields are in the region of 11 – 14%;
• Targeted IRR’s (10 year) are between 20 – 25%
• Good risk-adjusted returns
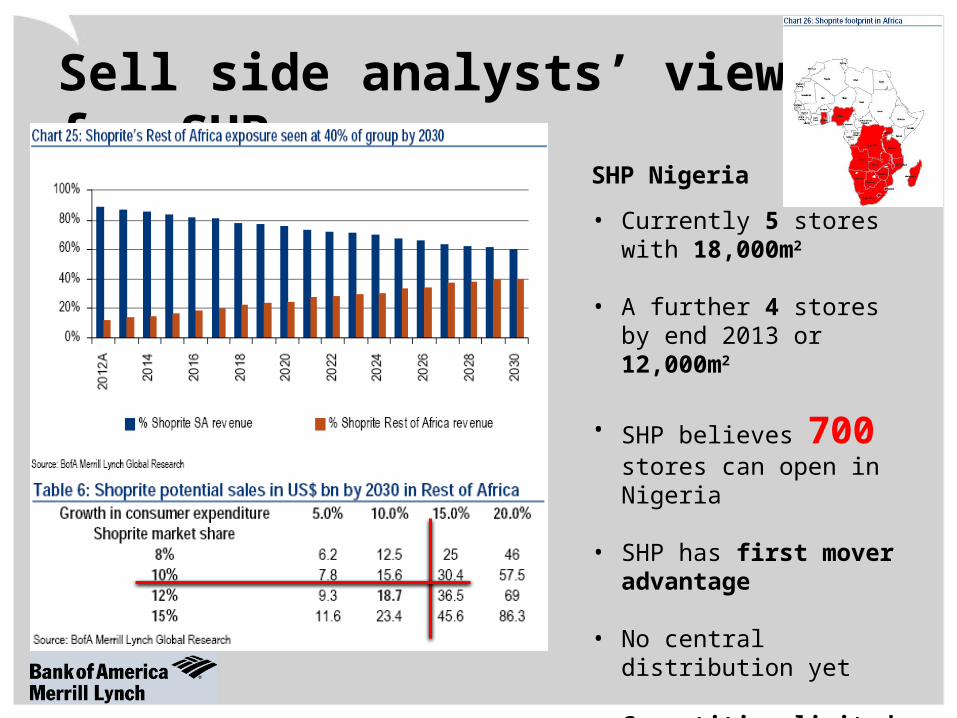
Sell side analysts’ view for SHP
SHP Nigeria
• Currently 5 stores with 18,000m2
• A further 4 stores by end 2013 or 12,000m2
• SHP believes 700 stores can open in Nigeria
• SHP has first mover advantage
• No central distribution yet
• Competition limited with 95% of the market still informal

Private Equity in Property Development: a different type of investment
• Spend time on the ground walking the streets
• Develop partnerships with long term local developers
• Entrench in the economic environment
• Long – term sustainable, responsible investing
• Take time to understand how things work

Recognise the Opportunities
but alsoRecognise the
Risks

Opportunities are bright, but challenges remainAfrica clustered toward the bottom of global rankings
• The World Bank recognises progress made by African countries since its first listing in 2005
• African countries have a long way to go

Long list of risks to be considered
• Buckets of Risk to Manage
Country• Political risk• Bribery and corruption • Bleak international perception
Currency and Interest Rates• Currency risk• Rental payments in local currency• Interest rate and tenor risk
Operating Environment• Lack of infrastructure• Credibility of partners• Lack of available debt funding
Legal Environment• Inefficient policies• Tax risk• Legal and contracting risks
Risks are real and have to be managedExercise even greater caution to ensure you are protected
Specifically related to Property:
• Land Tenure – need for local partnerships
• Ability to Execute – need for service provider partnerships
• Ease of distribution – need for retailer & investor/developer partnerships

We need to take action
• Perspective: assuming a glass-half-full perspective that focuses first on opportunity, and only then on the risks that need to be managed
• Partnerships: investing in building strong collaborative partnerships across government, business and communities and with each other
• Planning: adopting careful long-term planning, and patience; persistence and flexibility in implementing those plans
• People: nurturing and developing Africa's human talent: arguably the continent’s greatest resource
Embracing Africa’s diversity unlocks opportunities
Source ERNST & YOUNG Business in Africa Survey

STANLIB Africa Direct Property Development
Fund
(“SADPDF”)

The Fund1. Scope
Stage of development Greenfield, brownfield, land acquisition, early development phase
Geographic focus Sub Sahara Africa (excluding CMA), with a key focus on Nigeria, Ghana, Kenya, and Uganda
Property segment Retail (60%-80%) and other commercial assets (20%-40%)
Project involvement Land acquisition, concept design/management, project management (construction), portfolio management (leasing, maintenance)
2. Role and Nature of Investments
Size range of investment $15 - $ 30 million
Where in capital structure Land owner (10-25%) / Fund equity (25-40%) / quasi equity (10-15%) / Senior debt (50-65%)
Targeted return profile 22-25% IRR (nominal gross)
Hurdle rate / Preferred return 10% IRR
Level of control Varied, but select reserved matters for Fund at shareholder level
Maximum deal size No more than 33% of the total Fund capital ($50 million)
Partnerships Local institutions (land access), SA retailers, private equity funds (e.g. Actis)
3. Fund scale and Structure
Size $150 million (4-6 projects)
Duration 4 year investment period, 4 year harvesting period (with a two year extension option)
Domicile Mauritius
Co-investment allowed Allowed for select investors
Minimum ticket size $5 million
Fees charged 1.5% (25% discount charged to usual rate)

Disclaimer
Information and Content
The information and content (collectively 'information') provided herein are provided by STANLIB Asset Management (“STANLIBAM”) as general information for information purposes only. STANLIB does not guarantee the suitability or potential value of any information or particular investment source. Any information herein is not intended nor does it constitute financial, tax, legal, investment, or other advice. Before making any decision or taking any action regarding your finances, you should consult a qualified Financial Adviser. Nothing contained herein constitutes a solicitation, recommendation, endorsement or offer by STANLIBAM.
Copyright
The information provided herein are the possession of STANLIBAM and are protected by copyright and intellectual property laws. The information may not be reproduced or distributed without the explicit consent of STANLIBAM.
Disclaimer
STANLIB has taken care to ensure that all information provided herein is true and accurate. STANLIB will therefore not be held responsible for any inaccuracies in the information herein. STANLIBAM shall not be responsible and disclaims all loss, liability or expense of any nature whatsoever which may be attributable (directly, indirectly or consequentially) to the use of the information provided.
STANLIB Asset Management LimitedRegistration No: 1969/002753/06. A Financial Services Provider licensed under the Financial Advisory and Intermediary Services Act, 37 of 2002. FSP license No: 719.