overview of stop-bsi program bsi program peter pronovost… · peter pronovost, md, phd. slide 4...
TRANSCRIPT
Overview of STOPOverview of STOP--BSI ProgramBSI Program Peter Pronovost, MD, PhDPeter Pronovost, MD, PhD

Slide 4
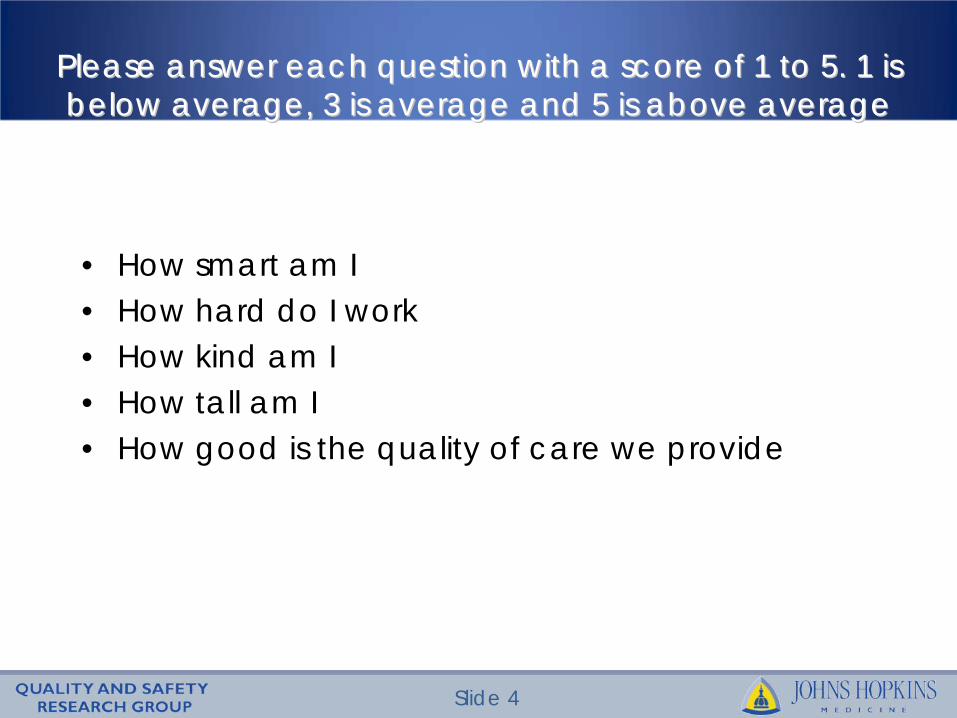
Please answer each question with a score of 1 to 5. 1 is Please answer each question with a score of 1 to 5. 1 is below average, 3 is average and 5 is above average below average, 3 is average and 5 is above average
• How smart am I• How hard do I work• How kind am I• How tall am I• How good is the quality of care we provide
Slide 5
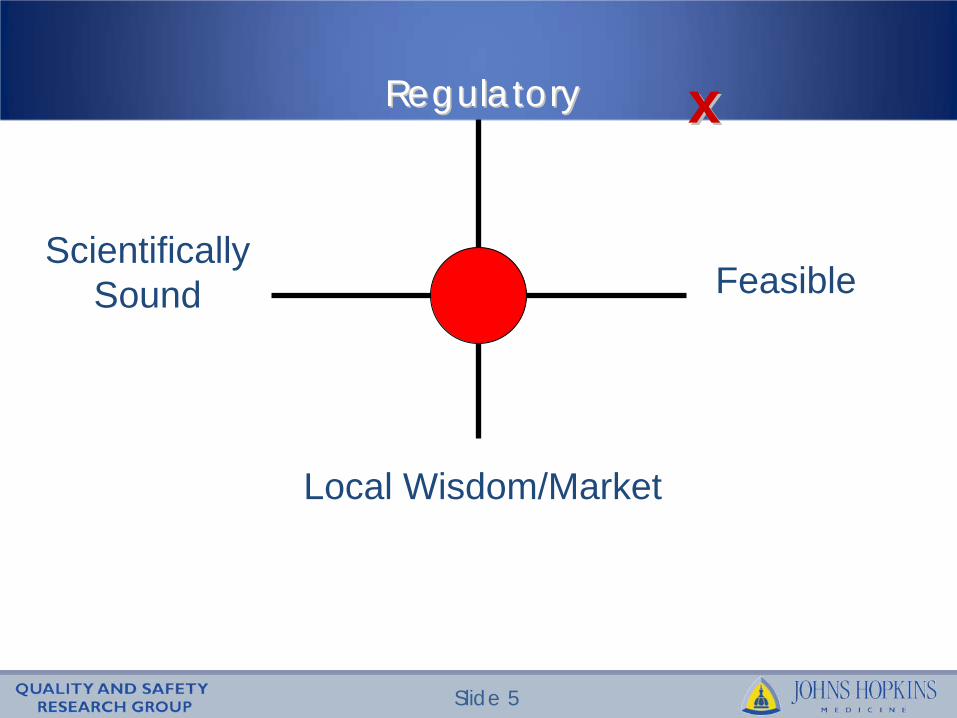
RegulatoryRegulatory
Local Wisdom/Market
Scientifically Sound Feasible
xx
Slide 6
GoalsGoals
• To work to eliminate central line associated blood stream infections (CLABSI); state mean < 1/10000 catheter days, median 0
• To improve safety culture
• To learn from one defect per month
Slide 7
Project OrganizationProject Organization
• Partner with HRET, MHA, JHU, State Hospital Associations
• State wide effort coordinated by Hospital Association
• Use collaborative model (2 face to face meetings, monthly calls)
• Standardized data collection tools and evidence
• Local ICU modification of how to implement interventions
Slide 8
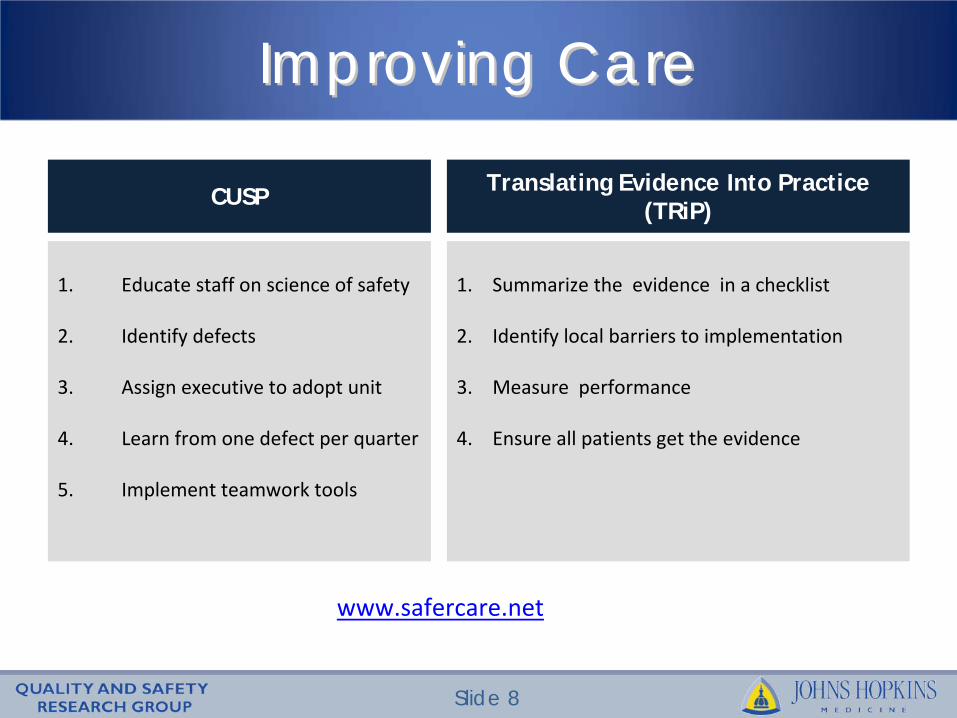
Improving CareImproving Care
CUSP
1. Educate staff on science of safety
2. Identify defects
3. Assign executive to adopt unit
4. Learn from one defect per quarter
5. Implement teamwork tools
Translating Evidence Into Practice (TRiP)
1. Summarize the evidence in a checklist
2. Identify local barriers to implementation
3. Measure performance
4. Ensure all patients get the evidence
www.safercare.net
Intervention to Eliminate CLABSIIntervention to Eliminate CLABSI
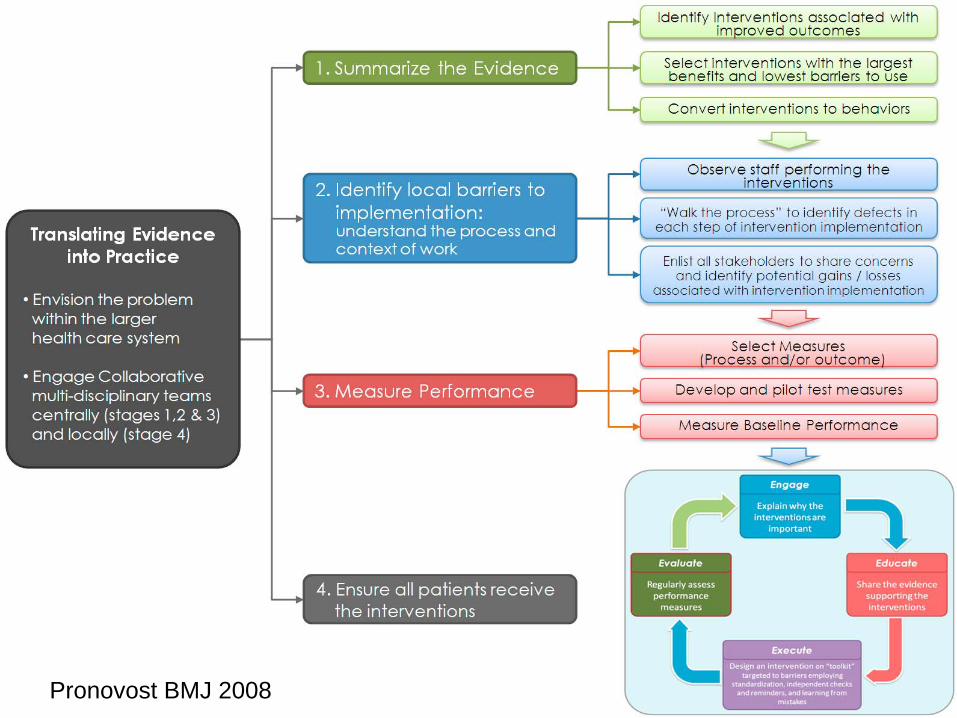
Pronovost BMJ 2008
Slide 11
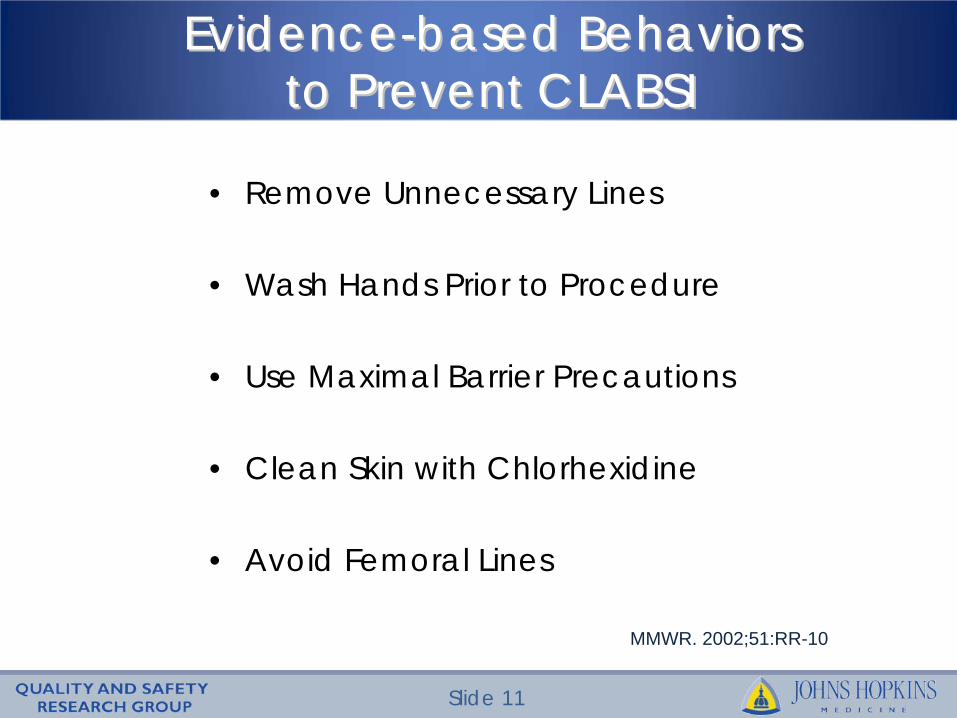
EvidenceEvidence--based Behaviorsbased Behaviors to Prevent CLABSIto Prevent CLABSI
• Remove Unnecessary Lines
• Wash Hands Prior to Procedure
• Use Maximal Barrier Precautions
• Clean Skin with Chlorhexidine
• Avoid Femoral Lines
MMWR. 2002;51:RR-10
Slide 12
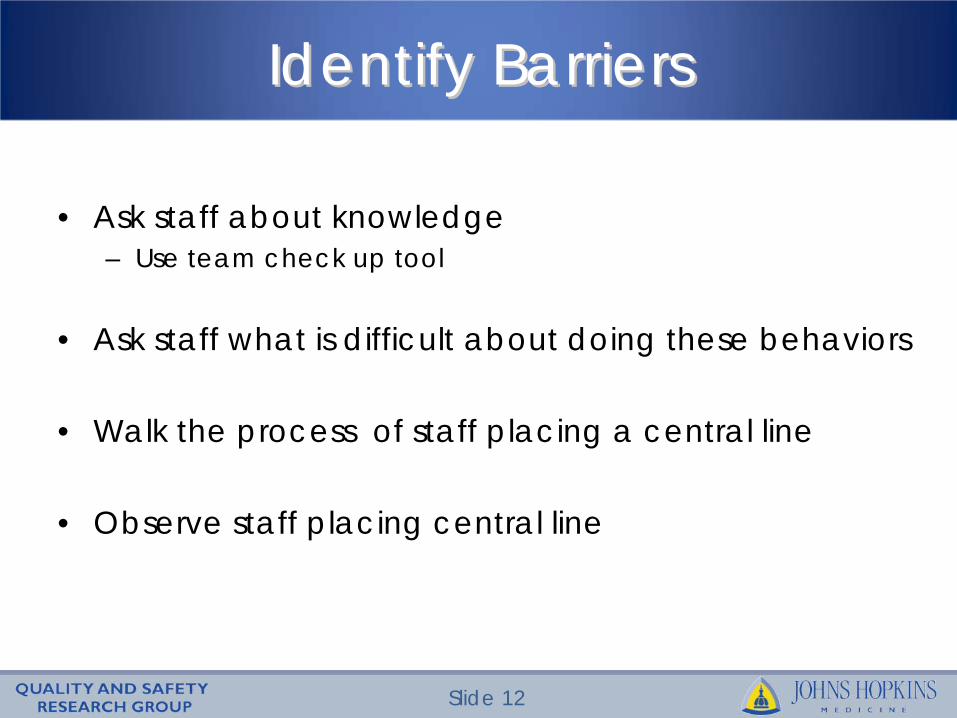
Identify BarriersIdentify Barriers
• Ask staff about knowledge – Use team check up tool
• Ask staff what is difficult about doing these behaviors
• Walk the process of staff placing a central line
• Observe staff placing central line
Slide 13
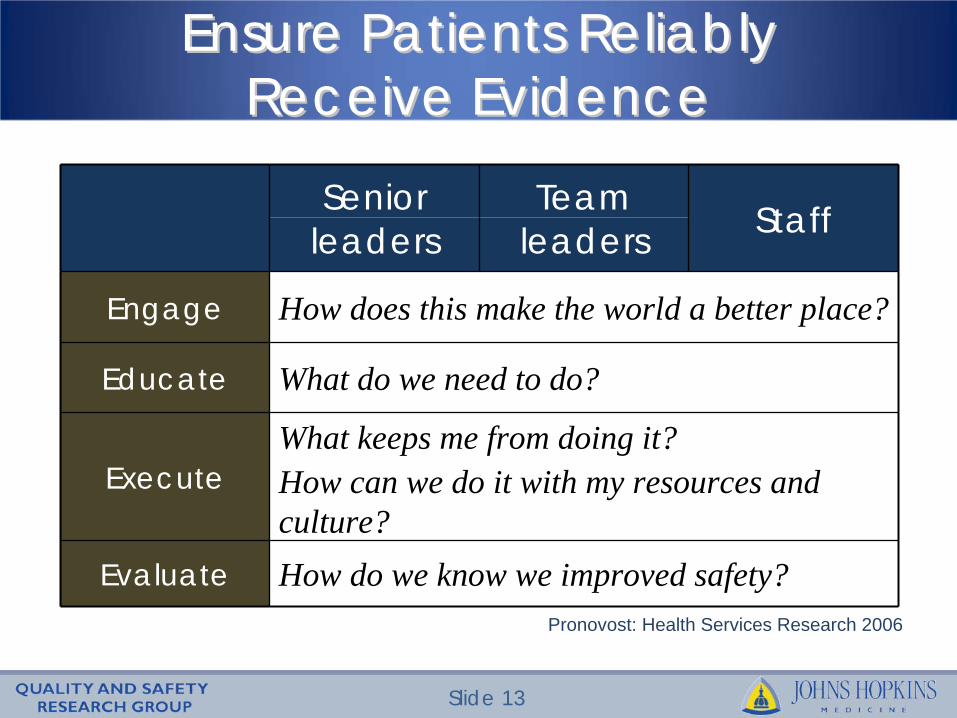
Ensure Patients ReliablyEnsure Patients Reliably Receive EvidenceReceive Evidence
Pronovost: Health Services Research 2006
Senior Team Staffleaders leaders
Engage How does this make the world a better place?
Educate What do we need to do?
ExecuteWhat keeps me from doing it?How can we do it with my resources and culture?
Evaluate How do we know we improved safety?
Slide 14
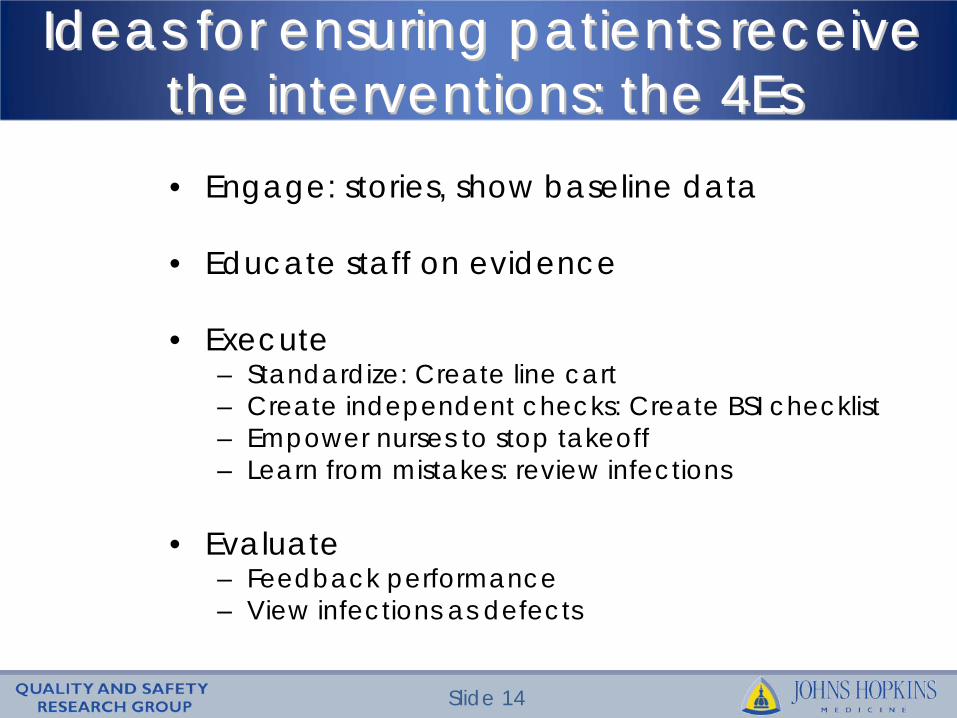
Ideas for ensuring patients receive Ideas for ensuring patients receive the interventions: the 4Esthe interventions: the 4Es• Engage: stories, show baseline data
• Educate staff on evidence
• Execute– Standardize: Create line cart– Create independent checks: Create BSI checklist– Empower nurses to stop takeoff– Learn from mistakes: review infections
• Evaluate– Feedback performance– View infections as defects
Slide 15
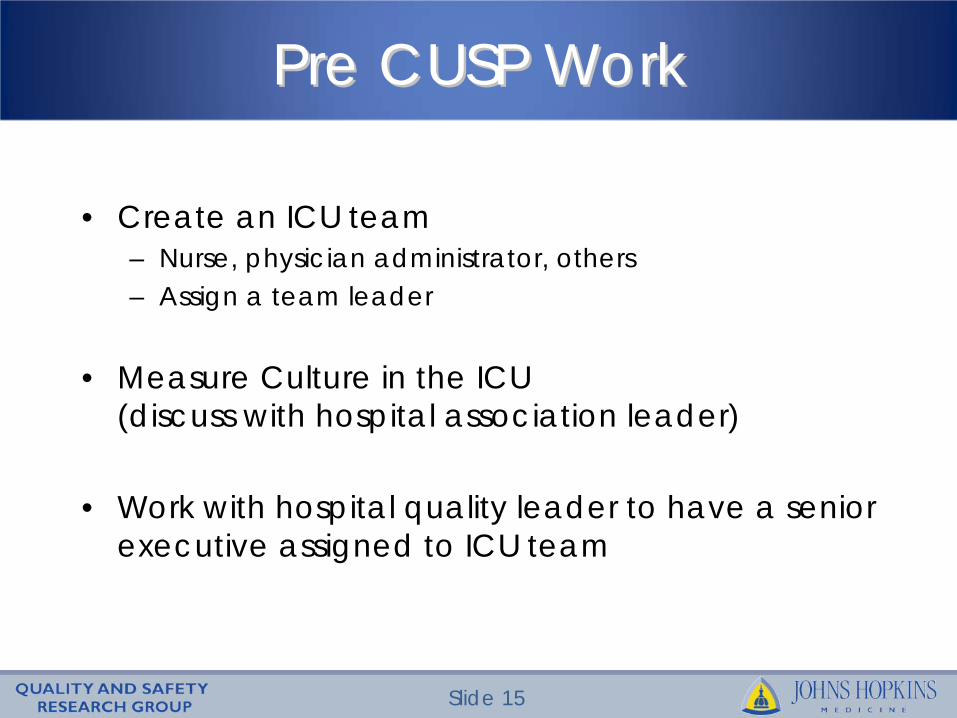
Pre CUSP WorkPre CUSP Work
• Create an ICU team– Nurse, physician administrator, others– Assign a team leader
• Measure Culture in the ICU (discuss with hospital association leader)
• Work with hospital quality leader to have a senior executive assigned to ICU team
Slide 16
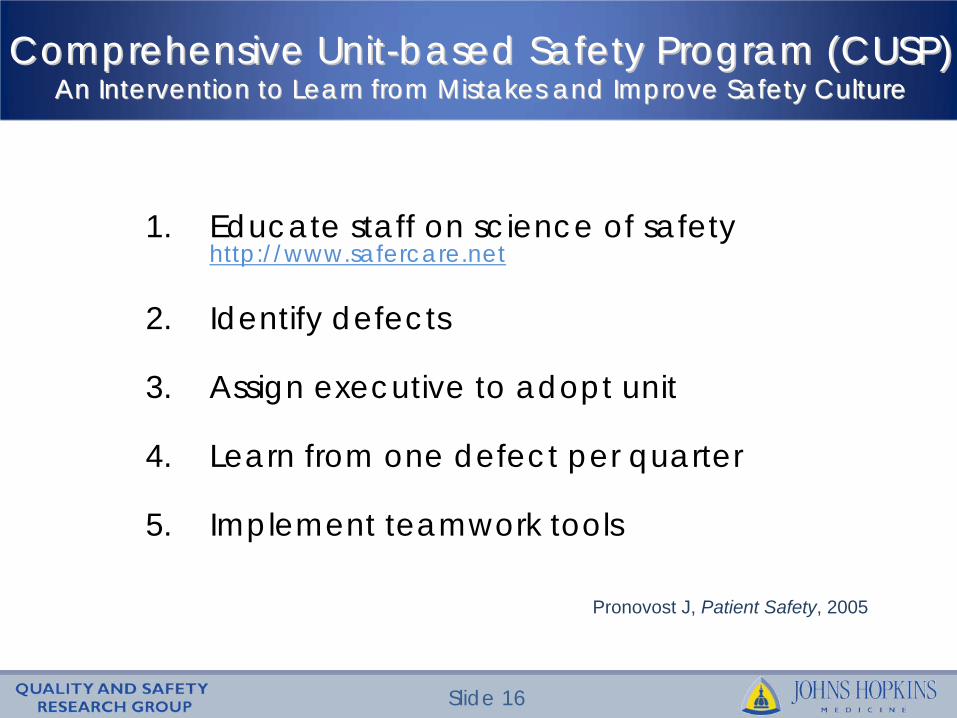
Comprehensive UnitComprehensive Unit--based Safety Program (CUSP) based Safety Program (CUSP) An Intervention to Learn from Mistakes and Improve Safety CulturAn Intervention to Learn from Mistakes and Improve Safety Culturee
1. Educate staff on science of safety http://www.safercare.net
2. Identify defects
3. Assign executive to adopt unit
4. Learn from one defect per quarter
5. Implement teamwork tools
Pronovost J, Patient Safety, 2005
Slide 17
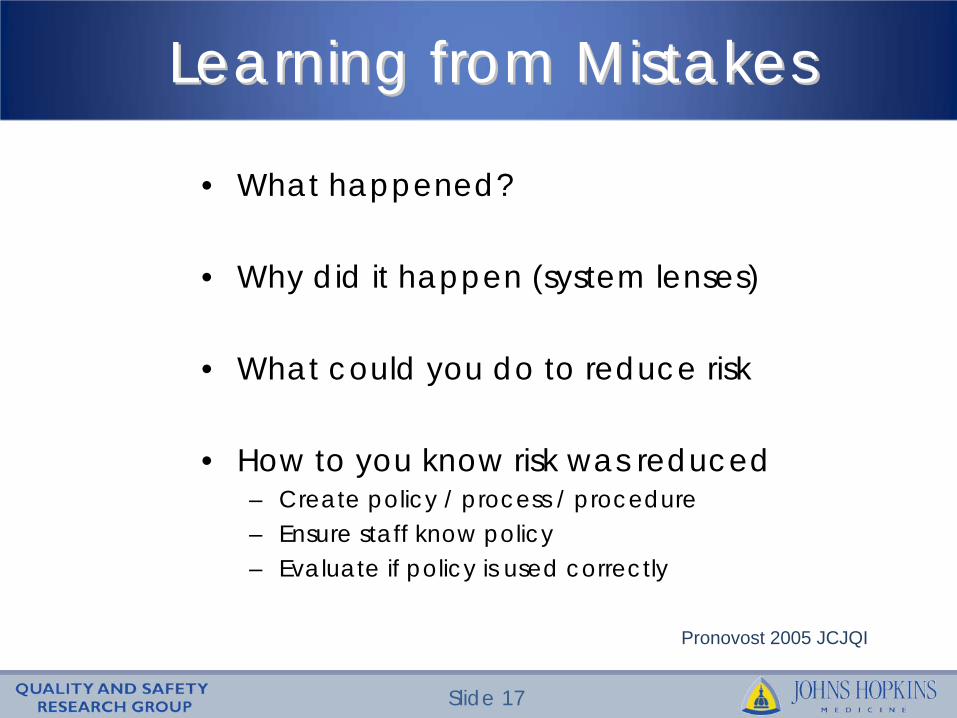
Learning from MistakesLearning from Mistakes
• What happened?
• Why did it happen (system lenses)
• What could you do to reduce risk
• How to you know risk was reduced– Create policy / process / procedure– Ensure staff know policy– Evaluate if policy is used correctly
Pronovost 2005 JCJQI
Slide 18
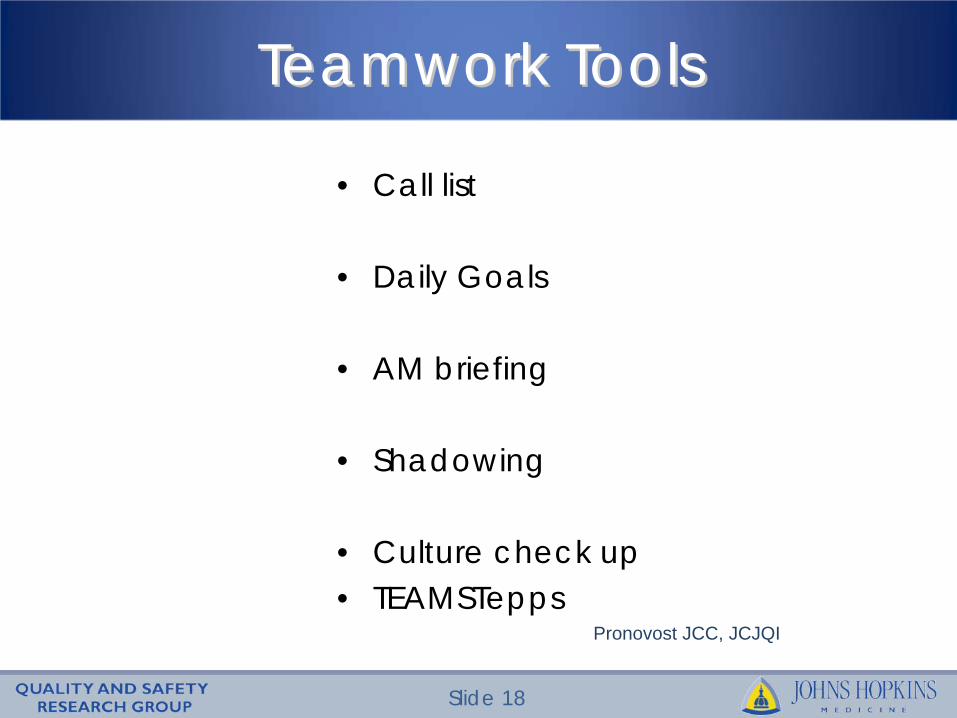
Teamwork ToolsTeamwork Tools
• Call list
• Daily Goals
• AM briefing
• Shadowing
• Culture check up• TEAMSTepps
Pronovost JCC, JCJQI
Can We Do thisCan We Do this
Slide 20
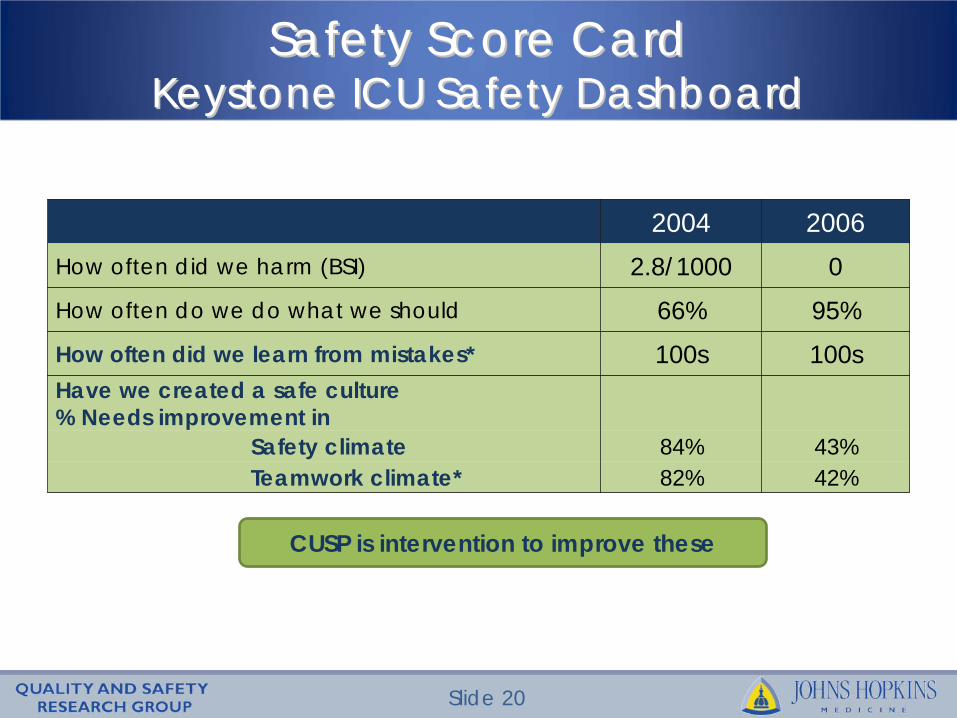
Safety Score CardSafety Score Card Keystone ICU Safety DashboardKeystone ICU Safety Dashboard
CUSP is intervention to improve these
2004 2006How often did we harm (BSI) 2.8/1000 0How often do we do what we should 66% 95%How often did we learn from mistakes* 100s 100sHave we created a safe culture% Needs improvement in
Safety climate 84% 43%Teamwork climate* 82% 42%
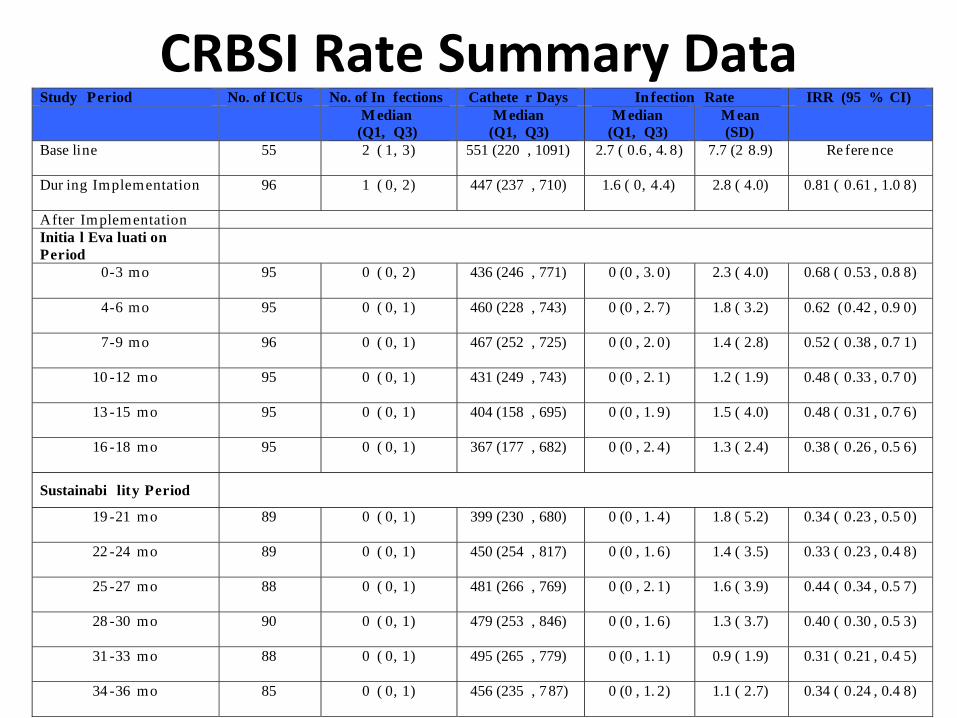
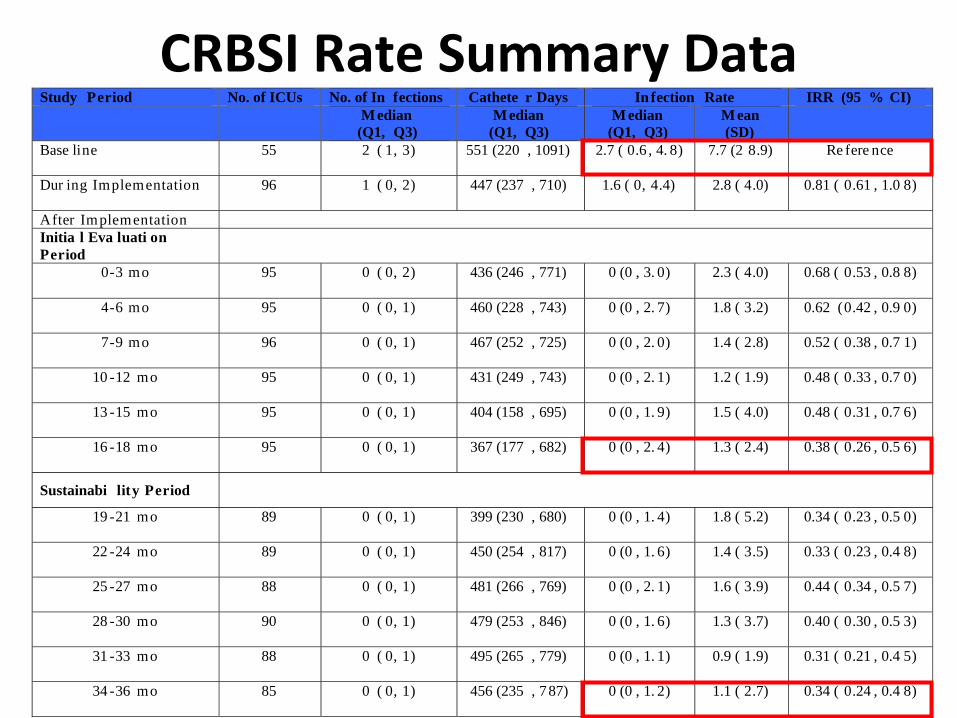
CRBSI Rate Summary DataStudy Period No. of ICUs No. of In fections Cathete r Days In fection Rate IRR (95 % CI)
M edian (Q1, Q3)
M edian (Q1, Q3)
M edian (Q1, Q3)
M ean (SD)
Base line 55 2 ( 1, 3) 551 (220 , 1091) 2.7 ( 0.6 , 4. 8) 7.7 (2 8.9) Re fere nce
Dur ing Implementation 96 1 ( 0, 2) 447 (237 , 710) 1.6 ( 0, 4.4) 2.8 ( 4.0) 0.81 ( 0.61 , 1.0 8)
After Implementation Initia l Eva luati on Period
0-3 mo 95 0 ( 0, 2) 436 (246 , 771) 0 (0 , 3. 0) 2.3 ( 4.0) 0.68 ( 0.53 , 0.8 8)
4-6 mo 95 0 ( 0, 1) 460 (228 , 743) 0 (0 , 2. 7) 1.8 ( 3.2) 0.62 (0.42 , 0.9 0)
7-9 mo 96 0 ( 0, 1) 467 (252 , 725) 0 (0 , 2. 0) 1.4 ( 2.8) 0.52 ( 0.38 , 0.7 1)
10 -12 mo 95 0 ( 0, 1) 431 (249 , 743) 0 (0 , 2. 1) 1.2 ( 1.9) 0.48 ( 0.33 , 0.7 0)
13 -15 mo 95 0 ( 0, 1) 404 (158 , 695) 0 (0 , 1. 9) 1.5 ( 4.0) 0.48 ( 0.31 , 0.7 6)
16 -18 mo 95 0 ( 0, 1) 367 (177 , 682) 0 (0 , 2. 4) 1.3 ( 2.4) 0.38 ( 0.26 , 0.5 6)
Sustainabi lity Period
19 -21 mo 89 0 ( 0, 1) 399 (230 , 680) 0 (0 , 1. 4) 1.8 ( 5.2) 0.34 ( 0.23 , 0.5 0)
22 -24 mo 89 0 ( 0, 1) 450 (254 , 817) 0 (0 , 1. 6) 1.4 ( 3.5) 0.33 ( 0.23 , 0.4 8)
25 -27 mo 88 0 ( 0, 1) 481 (266 , 769) 0 (0 , 2. 1) 1.6 ( 3.9) 0.44 ( 0.34 , 0.5 7)
28 -30 mo 90 0 ( 0, 1) 479 (253 , 846) 0 (0 , 1. 6) 1.3 ( 3.7) 0.40 ( 0.30 , 0.5 3)
31 -33 mo 88 0 ( 0, 1) 495 (265 , 779) 0 (0 , 1. 1) 0.9 ( 1.9) 0.31 ( 0.21 , 0.4 5)
34 -36 mo 85 0 ( 0, 1) 456 (235 , 787) 0 (0 , 1. 2) 1.1 ( 2.7) 0.34 ( 0.24 , 0.4 8)
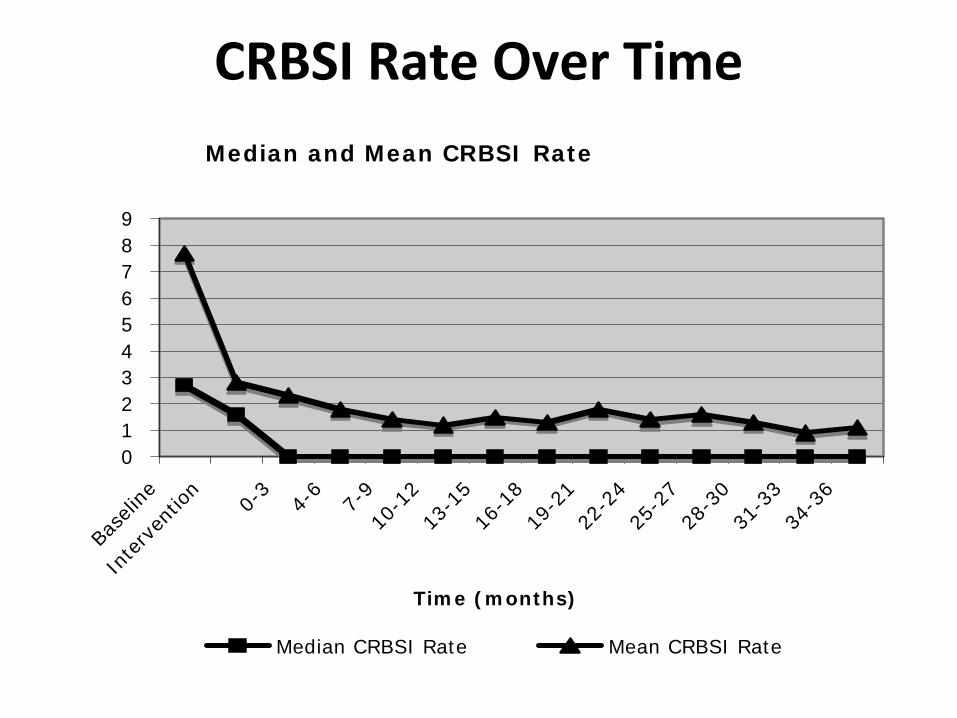
CRBSI Rate Over TimeMedian and Mean CRBSI Rate
0123456789
Base
line
Inte
rven
tion
0-3
4-6
7-9
10-1
213
-15
16-1
819
-21
22-2
425
-27
28-3
031
-33
34-3
6
Time (months)
Median CRBSI Rate Mean CRBSI Rate
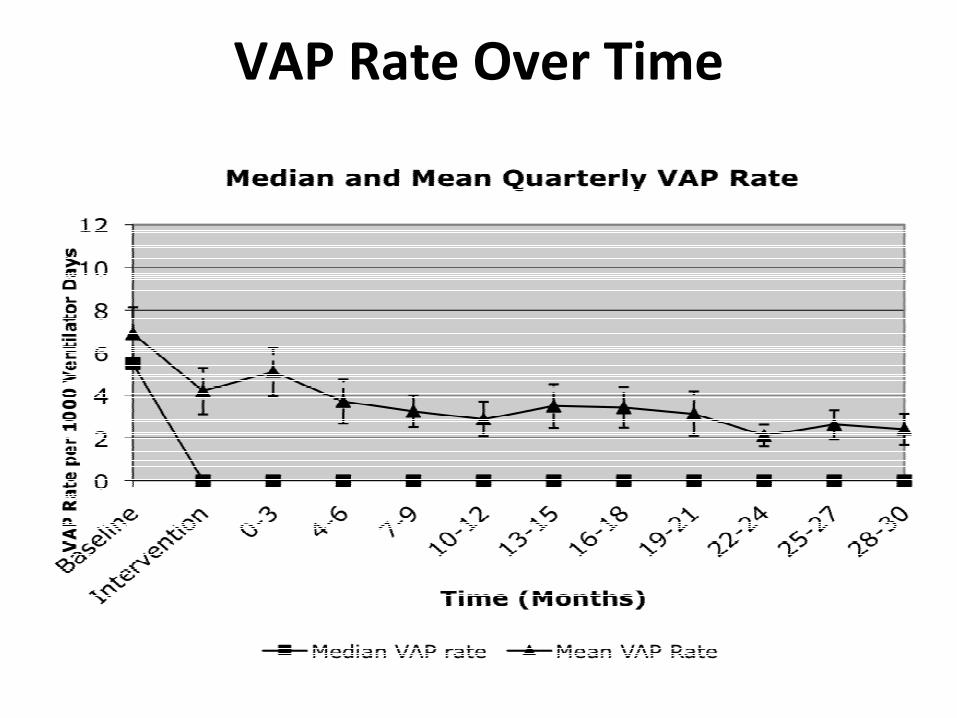
VAP Rate Over Time
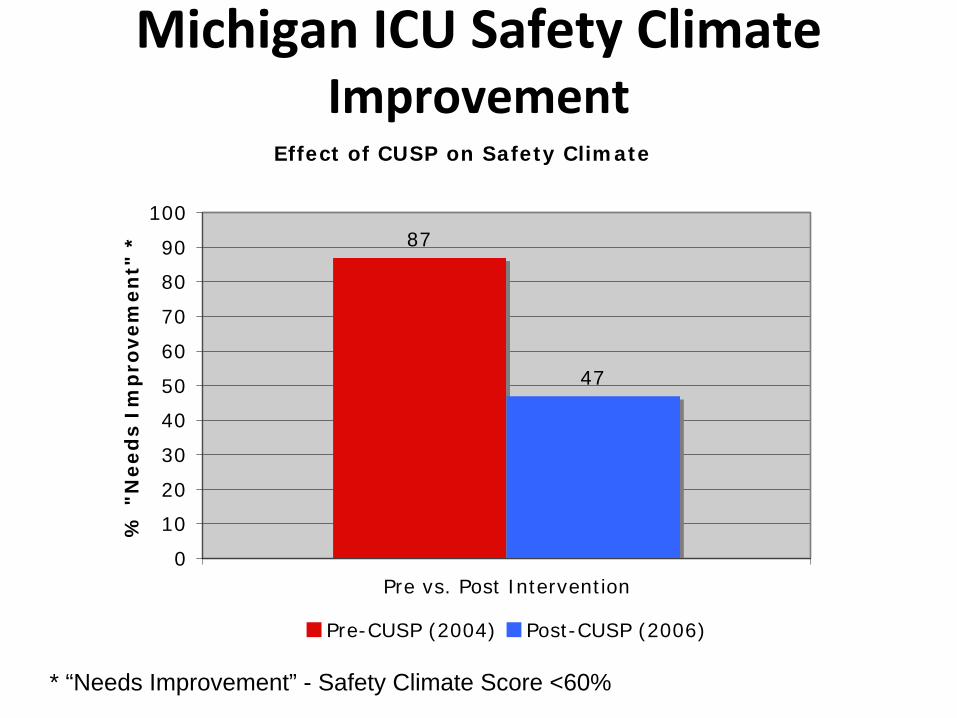
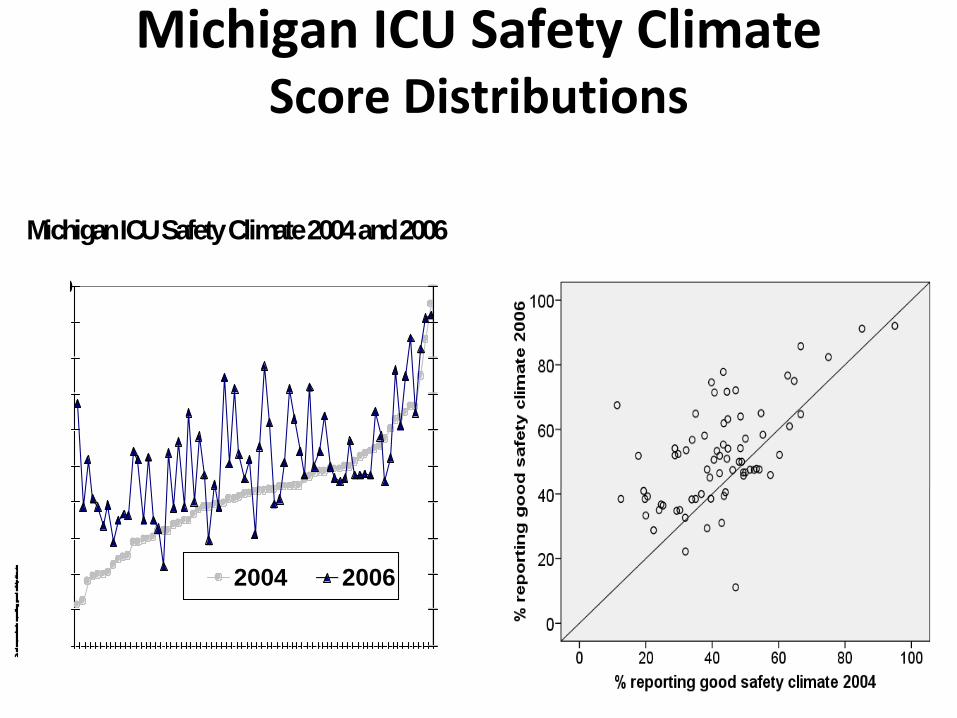
Michigan ICU Safety Climate Improvement
Effect of CUSP on Safety Climate
87
47
0
10
20
30
40
50
60
70
80
90
100
Pre vs. Post Intervention
% "
Need
s Im
pro
vem
en
t" *
Pre-CUSP (2004) Post-CUSP (2006)
* “Needs Improvement” - Safety Climate Score <60%
0
2004 2006
Michigan ICU Safety Climate 2004 and 2006
Michigan ICU Safety Climate Score Distributions
Focus and Execute

Slide 29
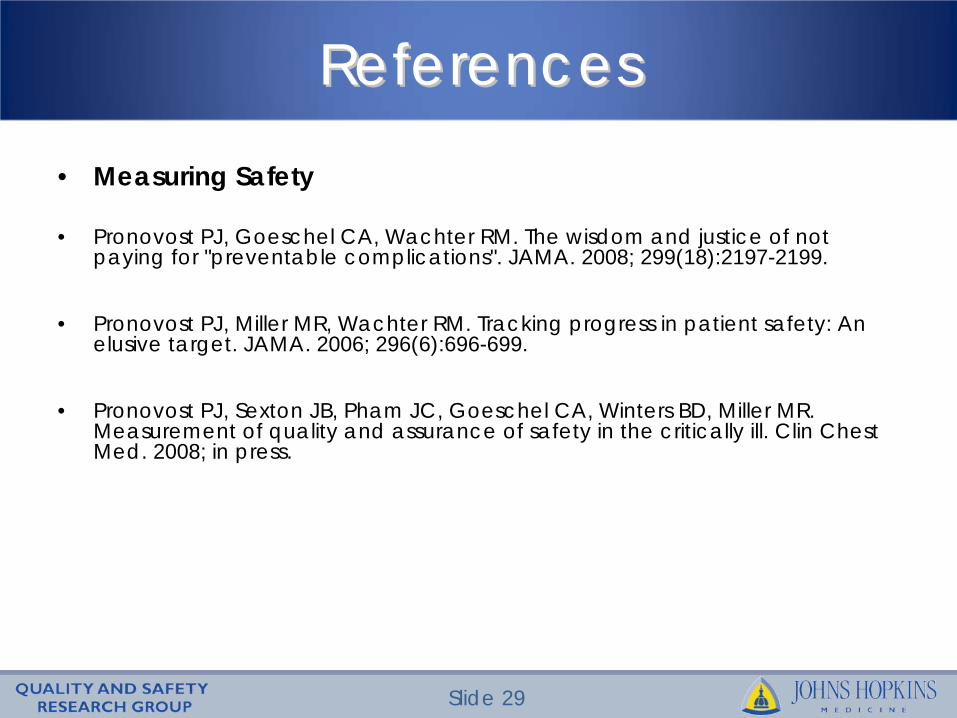
ReferencesReferences
• Measuring Safety
• Pronovost PJ, Goeschel CA, Wachter RM. The wisdom and justice of not paying for "preventable complications". JAMA. 2008; 299(18):2197-2199.
• Pronovost PJ, Miller MR, Wachter RM. Tracking progress in patient safety: An elusive target. JAMA. 2006; 296(6):696-699.
• Pronovost PJ, Sexton JB, Pham JC, Goeschel CA, Winters BD, Miller MR. Measurement of quality and assurance of safety in the critically ill. Clin Chest Med. 2008; in press.
Slide 30
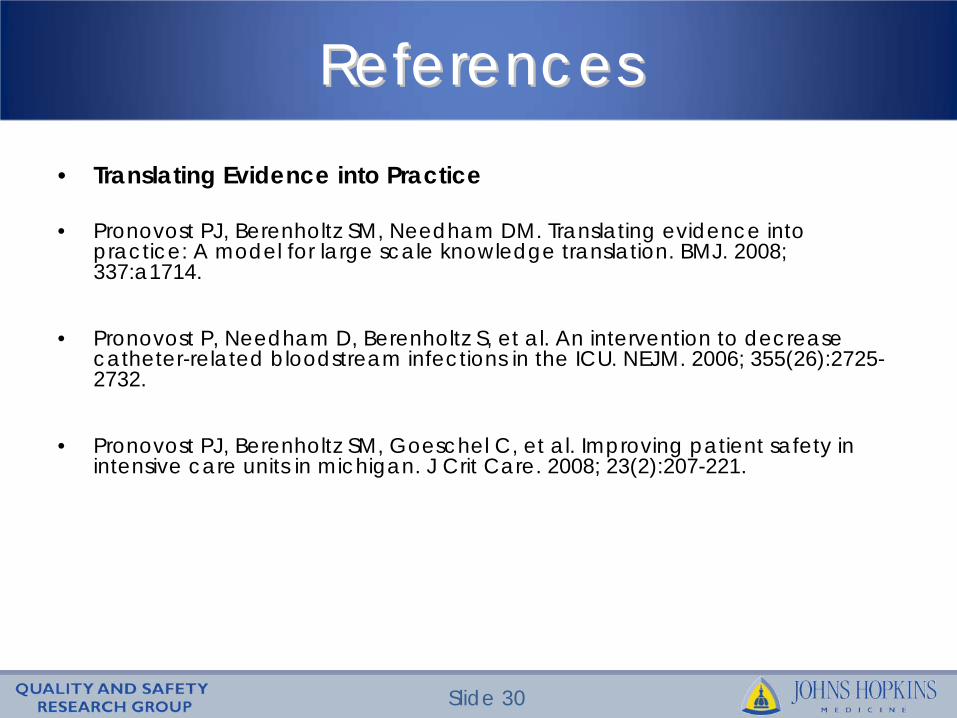
ReferencesReferences• Translating Evidence into Practice
• Pronovost PJ, Berenholtz SM, Needham DM. Translating evidence into practice: A model for large scale knowledge translation. BMJ. 2008; 337:a1714.
• Pronovost P, Needham D, Berenholtz S, et al. An intervention to decrease catheter-related bloodstream infections in the ICU. NEJM. 2006; 355(26):2725- 2732.
• Pronovost PJ, Berenholtz SM, Goeschel C, et al. Improving patient safety in intensive care units in michigan. J Crit Care. 2008; 23(2):207-221.
Slide 31
ReferencesReferences• Pronovost P, Weast B, Rosenstein B, et al. Implementing and validating a
comprehensive unit-based safety program. J Pat Safety. 2005; 1(1):33-40.
• Pronovost P, Berenholtz S, Dorman T, Lipsett PA, Simmonds T, Haraden C. Improving communication in the ICU using daily goals. J Crit Care. 2003; 18(2):71-75.
• Pronovost PJ, Weast B, Bishop K, et al. Senior executive adopt-a-work unit: A model for safety improvement. Jt Comm J Qual Saf. 2004; 30(2):59-68.
• Thompson DA, Holzmueller CG, Cafeo CL, Sexton JB, Pronovost PJ. A morning briefing: Setting the stage for a clinically and operationally good day. Jt Comm J Qual and Saf. 2005; 31(8):476-479.