overview of the nmec procedures manual
TRANSCRIPT

1
Overview of the NMEC Procedures Manual
An SCE Emerging Technology Project
Presentation to EM&V – NMEC Forum
February 13, 2018David Jump, Ph.D., P.E., CMVP
kW Engineering

Agenda
Background Purpose Quick Review Organization Procedures Issues Availability

Background NMEC = normalized metered energy consumption Authorized under
AB 802 in California (2015) Enables program administrators (PAs) to provide incentives for all EE
measures based on the “overall reduction in normalized metered energy consumption.”
Creates a new program ‘pathway’ separate from custom or deemed measures Actually two EE programmatic pathways:
a site specific pathway a population-based treatment and control group pathway
‘Metered’ not whole building Stakeholders are unfamiliar with ‘NMEC methods’ Past experience with a similar program (MBCx) showed that without
specific guidance, PAs will get as many M&V methods are there are implementers.
WO33 Appendix G listed a number of issues to resolve

Purpose To provide common procedures and requirements for
documenting savings achieved with meter-based approaches Based on industry best practices
To establish consistency in site-specific NMEC savings analysis To document current best practices in an adaptable format Enable revisions as the industry learns
To align with CPUC guidance

Quick Review - Savings Methodology
Whole Building Building Subsystem

Graphical Representation of Method
Baseline Period Installation Period Post-Installation Period
Energy
Time
Savings
Predicted by baseline model: What baseline use would have been
Metered Energy Use

Savings Based on NMEC
Baseline Period Installation Period Post-Installation Period Normal Conditions Period (e.gTMY or CACZ)
Predicted by baseline model: What baseline use would have been
Predicted by post-install model: What post-installation use would have been
NMEC Savings
Energy
Time

M&V 1.0 – Monthly Data
Linear regressions
12 months/data points per year
Less Accuracy
12 mo. monitoring duration

M&V 2.0 - lnterval Data
Advanced analytics
8760 hourly/365 daily points per year
More Accuracy
Shorter monitoring duration: 3 to 6 months
Applicable to subsystems (Option B)

Advanced Analytics Familiar Linear OLS Regression
More Advanced ASHRAE RP1050 Change-Point Models LBNL Temperature and Time-of-Week Model
Exotic Neural Networks Nearest Neighbor Machine Learning Much More..

Comparison
Linear OLS Model Temperature only
Advanced Model Temperature and
Time-of-Week
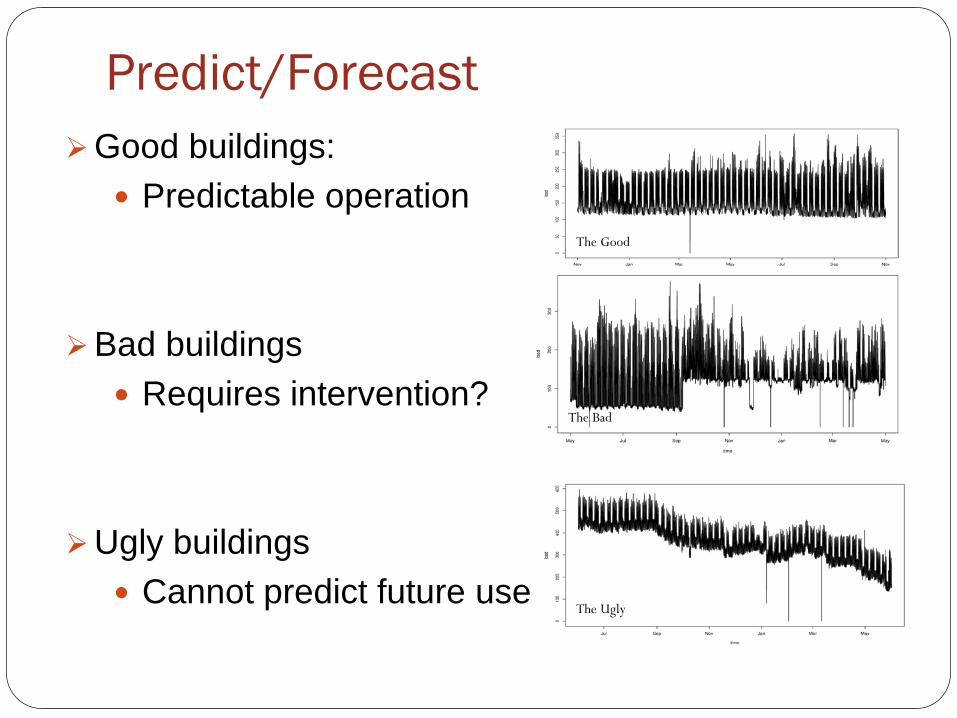
Predict/Forecast
The Good
The Bad
The Ugly
Good buildings: Predictable operation
Bad buildings Requires intervention?
Ugly buildings Cannot predict future use

NMEC Manual Organization
Executive Summary Introduction Background, Method Overview, Structure of Manual
NMEC Procedures and Requirements Issues Templates M&V Plan Savings Report

Procedures and Requirements
Associated text describes each step and summarizes the step’s requirements

Issues Section Energy Metering Independent Variables Weather Coverage Does baseline weather include all anticipated conditions?
Modeling Algorithms Change-point, TTOW described, other algorithms not excluded
Goodness-of-Fit Metrics Assessing Savings Uncertainty ASHRAE method
Non-Routine Events Normalized Savings Uncertainty Resources

Metering Concern: Meter Accuracy Bias Measurement Error - eliminate Random Measurement Error – reduce as possible
Energy Source Type Typical Accuracy Common Mfgrs
Electric Solid state ± 0.2% of readingSquare DEaton
Natural Gas Positive displacement ± 1 - 2% of readingDresserAmerican
CHW/HHW
Temperature sensors: solid stateFlow meter: turbine, electromagnetic, ultrasonic, or vortex
Temp sensors: ± 0.15°F from 32-200 °FFlow meter: ± 0.2% to ± 2.0% per flow meterCalculator accuracy: within ± 0.05%
OniconFlexim
SteamFlow: Vortex sheddingTemperature: RTD Mass flow: ± 2% of mass flow calculation
RosemountYokogawa
Mfgr’s product test results, installed meter calibration reports, should be submitted with the documentation for all meters.

Weather Coverage
Aide in determining if enough baseline data collected (duration of baseline period)

Goodness of Fit Metrics Baseline Models NDBE (bias error) < 0.005% CV(RMSE) (random error) < 25% R2 (independent variables ‘explanatory power’) > 0.7
Linear Model, CV = 25% TTOW Model, CV = 11%

Non-Routine Adjustments Process Identify the NRE (visualize data or owner report) Determine if NRE Impact is Material (if not, stop) Assess Temporary or Permanent? Constant or Variable Load? Added or Removed Load?
Quantify Impact Engineering calcs + assumptions (low quality/cost) Engineering calcs + logged data (med-high quality/cost) Analysis of before/after NRE using metered data (high
quality/low cost)
Adjust Savings Estimate
Other Elements of NMEC Manual
Change Log Track revisions by version number
Tracking reviewer comments (Appendix A) For consideration in future versions
M&V Plan and Savings Reports Evolution expected

Questions?
NMEC Procedures Manual to be available on California Emerging Technologies Coordinating Council
Website in February 2018www.etcc-ca.com


M&V Documentation M&V Plan Describe Model Why chosen? Mathematical form Independent variables
Baseline Period Coverage factor Goodness-of-fit statistics Uncertainty Assessment
Calculations How often & how savings are reported Non-routine adjustments More!

Best Applications – Project Level M&V
‘Predictable’ buildings, systems Weather sensitive, regularly scheduled
Multiple and interactive ECMs Affecting multiple building systems (HVAC, lighting, etc.)
Deep savings projects Savings are “above the noise”
Data useful for other purposes Anomaly detection, Performance drift

Risks and Issues Sub Meter Calibration Requirements & Frequency Complex Analysis Methods Not simple OLS anymore!
Unpredictable buildings Prescreening may be required
Non-Routine Events Added building loads, major occupancy shifts Must remove impacts from savings estimations
Data accessibility and security (not covered)