overview of the system of accounts - … or... · web viewoverview of the system of national...
TRANSCRIPT

OVERVIEW OF THE SYSTEM OF NATIONAL ACCOUNTS(CHAPTER 1 OF THE ESA 2010 GNI INVENTORY)
LUXEMBOURG201
following the agreed recommendations as laid down in document GNIC/280 rev. 2 EN - "ESA2010 GNI Inventory Guide".

VERSION JUNE 2016
LUXEMBOURG
GROSS NATIONAL INCOME INVENTORY
ESA 2010
1st editionJune 2016

CHAPTER 1: OVERVIEW OF THE SYSTEM OF ACCOUNTS....................................................17
1.1 Introduction..................................................................................................................................................171.1.1 Organisation and responsibilities within the National Statistical Institute (NSI)...................................171.1.2 Supervisory and control system..............................................................................................................17
1.1.2.1 National accounts compilation process..............................................................................................181.1.2.2 Graph of data flow (GOD).................................................................................................................181.1.2.3 Version analysis and backups.............................................................................................................201.1.2.4 « Doors » and « GateKeeper » applications.......................................................................................201.1.2.5 « MASTER » application for supply and use balancing....................................................................21
1.1.3 Source data.............................................................................................................................................221.1.4 Formal control and supervision instruments..........................................................................................22
1.1.4.1 Quality reports....................................................................................................................................221.1.4.2 Audits.................................................................................................................................................221.1.4.3 Data flow inventory (DFI)..................................................................................................................23
1.1.5 Organisation and management...............................................................................................................231.1.6 Main approaches used............................................................................................................................231.1.7 Geographical coverage...........................................................................................................................24
1.2 Revisions policy and timetable for revising and finalising the estimates................................................24
1.3 Outline of the production approach...........................................................................................................251.3.1 Reference framework.............................................................................................................................251.3.2 Main data sources...................................................................................................................................271.3.3 Calculation of gross value added and Gross Domestic Product.............................................................291.3.4 The role of direct and indirect estimation methods and of benchmarks and extrapolation....................301.3.5 Independence of the different approaches to GDP.................................................................................311.3.6 Main compilation steps of the production approach..............................................................................311.3.7 Exhaustiveness.......................................................................................................................................32
1.3.7.1 Business register (Répertoire des entreprises)....................................................................................321.3.7.2 Rectifications on the basis of tax audits (VAT fraud)........................................................................321.3.7.3 Tips.....................................................................................................................................................321.3.7.4 Undeclared work................................................................................................................................331.3.7.5 Representatives of foreign companies................................................................................................331.3.7.6 Illegal activities..................................................................................................................................33
1.4 Outline of the income approach..................................................................................................................351.4.1 Reference framework.............................................................................................................................351.4.2 Main data sources...................................................................................................................................351.4.3 Compensation of employees...................................................................................................................361.4.4 Other taxes on production......................................................................................................................371.4.5 Other subsidies on production................................................................................................................371.4.6 Gross operating surplus and mixed income............................................................................................371.4.7 Consumption of fixed capital.................................................................................................................371.4.8 Main approaches taken with respect to exhaustiveness.........................................................................37
1.5 Outline of the expenditure approach..........................................................................................................381.5.1 Reference framework.............................................................................................................................381.5.2 Households’ final consumption expenditure..........................................................................................391.5.3 NPISH final consumption expenditure...................................................................................................411.5.4 Government final consumption expenditure..........................................................................................421.5.5 Gross capital formation..........................................................................................................................44
1.5.5.1 Gross fixed capital formation.............................................................................................................441.5.5.1.1 Data validation.............................................................................................................................461.5.5.1.2 Adjustment for exhaustiveness....................................................................................................461.5.5.1.3 Conceptual adjustments...............................................................................................................46

1.5.5.1.4 Balancing......................................................................................................................................471.5.5.2 Changes in inventories.......................................................................................................................471.5.5.3 Net acquisitions of valuables..............................................................................................................48
1.5.6 Exports and imports of goods.................................................................................................................491.5.7 Exports and imports of services.............................................................................................................521.5.8 Main approaches taken with respect to exhaustiveness.........................................................................54
1.6 The balancing or integration procedure, and main approaches to validation.......................................54
1.7 Overview of the allowances for exhaustiveness.........................................................................................561.7.1 Production approach...............................................................................................................................56
1.7.1.1 Statistical register of businesses and legal persons............................................................................561.7.1.2 Rectifications on the basis of tax audits (VAT fraud)........................................................................561.7.1.3 Tips.....................................................................................................................................................561.7.1.4 Undeclared work................................................................................................................................571.7.1.5 Representatives of foreign companies................................................................................................571.7.1.6 Illegal activities..................................................................................................................................57
1.8 The transition from GDP to GNI................................................................................................................591.8.1 Compensation of employees (D.1).........................................................................................................591.8.2 Taxes on production and imports paid to the Institutions of the EU and subsidies granted..................601.8.3 Property income (D.4)............................................................................................................................60
1.9 Main classifications used..............................................................................................................................61
1.10 Main data sources used................................................................................................................................611.10.1 Production approach...............................................................................................................................611.10.2 Expenditure approach............................................................................................................................621.10.3 Statistical surveys and other data sources used for the income approach..............................................631.10.4 Statistical surveys and other sources used for the transition from GDP to GNI....................................63

CHAPTER 1: OVERVIEW OF THE SYSTEM OF ACCOUNTS
1.1 Introduction
This inventory describes the sources and methods used for the compilation of gross domestic product (GDP), gross national income (GNI) and other national accounts main aggregates at current prices for Luxembourg. National Accounts are compiled according to the ESA 2010 methodology as laid out in Annex A of regulation (EU) No 549/2013.
1.1.1 Organisation and responsibilities within the National Statistical Institute (NSI)Compiling the national accounts is the responsibility of the National Institute of statistics and economic studies of the Grand Duchy of Luxembourg ( Institut national de la statistique et des études économiques du Grand-Duché de Luxembourg (STATEC)). Article 2 (2) of the Law of the 10th of July 2011 on the organisation of the National Institute for Statistics and Economic Studies states that “STATEC’s remit is ... to draw up national, global or sectoral accounts”. By the terms of the convention of the 18th of December 2009, STATEC collaborates with the Central bank of Luxembourg (BCL) for the compilation of the financial sector accounts. Nevertheless STATEC has the full responsibility for the transmission to Eurostat of the financial sector accounts tables of the ESA 2010 transmission program.STATEC is placed under the authority of the Minister of the Economy and is, in administrative terms, an integral part of the Ministry. However the law of the 10th of July 2011 assures through article 11 that “In carrying out its remit … STATEC is endowed with scientific and professional independence. The director of STATEC decides on the statistical methods, standards and procedures as well as on the content and the date of dissemination of the statistical publications. …Statistics are drawn up and statistical sources and techniques are chosen according to statistical considerations.” Thus STATEC has full scientific independance. Within STATEC, units “MAC1 – National Accounts”, “MAC2 - Sector accounts “, and “MAC4 - General government accounts” located inside Division MAC – “Macroeconomic statistics”, are in charge of compiling the annual and quarterly national accounts (see the organisation chart). Unit MAC1 has currently a statff of 7.5 permanent full time equivalent persons. For MAC2 there are 6.5, and for MAC4 4. This makes a total of 18, of which 16 have a university degree, most of them in economics or business administration. Currently there are also 2 external experts with medium term contracts.STATEC’s small size (199 staff members in total) allows its various divisions and units to cooperate closely in providing basic statistics, in developing methodologies and questionnaires, and in providing direct access to specific pieces of information.
1.1.2 Supervisory and control systemThe present subchapter describes the supervisory and control system. This system ensures the quality of the production process of the Luxembourgish national accounts. The first subchapter provides a brief description of the national accounts’ compilation process by focusing on the elements which ensure the consistency and minimise the risk of errors in a system as complex as a national accounting system.The second subchapter indicates the benchmarks for the analysis and the treatment of current risks of the production approach’s main data source, namely the structural business survey (SBS). The third subchapter deals with the more formal, existing tools to ensure and improve the quality of Luxembourg’s national accounts. These tools are quality reports, audit processes as well as data flow inventories.
Finally the last subchapter deals with the work organisation and the work management in the unit MAC1 – National accounts.
1.1.2.1 National accounts compilation process
The compilation of national accounts is a complex process which is characterized by the following elements:
Existence of a variety of source data : with diverging formats (structure and format of files) derived from diversified collection systems (surveys, administrative sources, etc.) available at different moments subject to regular or occasional revision of varying quality
Necessity to adapt the source data to the concepts of national accounts : By ensuring the transition from business accounting standards, or conventions
adopted by administrative sources, to national accounting concepts. By imputing some flows foreseen in national accounting but not directly observable
in the real economy (example: imputed rents)
Necessity to ensure an exhaustive coverage of the national economy: By using survey results and administrative sources if they are available By extrapolating data collected by sampling to the overall observation universe By completing, when appropriate, source data by estimations (statistical reporting
threshold, activities with minor importance, undeclared work, illegal economy, etc.)
Necessity to integrate all source data (surveys, administrative data, estimations) in a system of nomenclatures and economic accounts forming an integrated and consistent representation of the national economy
Necessity to arbitrate between diverging source data in order to fulfil production accounting identities (equilibria between uses and resources) and to ensure alignment of production equilibria by breaking down the economy into branches and institutional sectors. All of this in an integrated supply and use framework
Necessity to set up coherent time series of the main aggregates and the different breakdowns of national accounting (branches, institutional sectors, functional nomenclatures (COICOP, COFOG)). This in current prices as wells as previous year prices.
Necessity of total coherence with the ESA2010 methodological framework. On a conceptual level as well as regarding the compulsory elements of the transmission program.
1.1.2.2 Graph of data flow (GOD)
During the production of national accounts data processing is a determining factor. A significant effort in computing is needed in order to process and organise multiple statistical sources as well as numerous data formats. To ensure that all the different programs in the national accounts chain of production are successfully executed, data flows are documented and modelled using graphs of data flow (GOD – Graph of Dataflow).

GODs are diagrams (see Figure 1.1) constructed in EXCEL, using the flowchart tool. Input and output files are shown graphically for each program in the production chain of national accounts. Furthermore each program and file is directly accessible via hypertext links. GODs can be used to navigate through the execution of the different programs ensuring that each step is executed.
Figure 1.1
Procédure Analyse_Production_Par_EntrepriseLa procédure sert à confronter la répartition par produits CPA3 par entreprise issue de trois souces différentes à savoir:
enquête structurelle d'entreprises (Unité C3)enquête d'activité mensuelle (Unité C4)commerce extérieur Intrastat/Extrastat (Unité D1)
L'outil Analyse_Production_Par_Entreprises sert alors à eventuellement appliquer des taux de répartitions par produits aux résultats de l'enquête structurelle d'entreprises. Environnement UNIX sous controle de l'unité C1
Fichier de base mensuel unité C1:Fichier de base annuel unité C1: NomenclaturesNomenclatures Numunitleg ; UnitéActiviteNumunitleg ; UnitéActivite NumNaceRev1 (5 positions)NumNaceRev1 (5 positions) ; NA60e NC8 ; CPA6 ; P60eCPA3CPA6 ; P60eCPA3 CodePays (détaillé) ; CGCECodePays (agrégé) ; CGCE (réduite dans variables) Nature de la transaction (ntra)Données annuelles Données mensuelles
cextXXXX -> cextXXXX..\METHODE\Commerce extérieur\Fichiers de base commerce extérieur.doc ..\METHODE\Commerce extérieur\Fichiers de base commerce extérieur.doc(contient description des variables et explications sur ajustement INTRASTAT) (contient description des variables et explications sur ajustement INTRASTAT)
Procédure désactivée le 28/2/2005 (fichier mdb trop volumineux). John.
Etape manuelle !!!1) Ouvrir cextnathnorm.mdb 3) Importer cextnath.mdb2) Effacer table cext 4) Effacer fichier cextnath.mdb3) Compacter base
Remarque:L'outil ne permet d'afficher que celle des entreprises quisont compris dans la source enquête structurelle etfigurent en même temps dans au moins une des deuxautres sources.
cext_base_XXXX.dbfXXXX = 1993 à année la plus récente
ana_vent_produit_95-99.sps
comp_enq_prod_cext.xls
analyse_production_par_entreprise.xlsConfrontation de la répartition par produits CPA3 des sources enquête structurelle, enquête d'activité mensuelle et Intrastat/Extrastat au niveau entreprise
comp_enq_prod_cext_taux.xls
comp_enq_prod_unique_entreprise.xls
cextnathnorm.mdb
cextnath.mdb
commerce extérieur unix.sas
\usr\haas\cext\base\cextXXXXXXXX = 1993 à année la plus récente
Furthermore, the Metadata of the main files (databases, intermediate files showing important steps (for example CNTOT, BASTOT)) are included in the GODs. Metadata sheets inform about stratification variables (nomenclatures, periods and other subdivisions) as well as variables containing statistical information (production, intermediate consumption, wages, employment etc.) (see Figure 1.2).

Figure 1.2: Example of a metadata template
Métadonnées fichier: G:\CN\EMPLOI\CN-empsal.sav1) Caractéristiques généralesNom/localisation: ..\..\EMPLOI\CN-empsal.savAuteur principal: MarcSource: base de données IGSSRythme de mis à jour: mensuelPrincipales utilisations: Estimation des variables emploi et salaires par branches et par secteurs institutionnelsPrincipaux utilisateurs: Teams T4 et T1Taille:Descriptif: Avant corrections travail au noir et bateliers rhénansFichiers descriptifs: néant2) Nomenclatures - variables de catégoriesNom variables: Descriptif variables: Link classifi:annee annéenarev NACE Rév.1.1 ..\..\CLASSIFI\Nac
e\NaceRev11.xlssecteur secteur (CN)narev narev23) Variables de donnéesNom variables: Descriptif variables: Link:frouv nombre d'ouvrierscsouv coût salarial (y compris cotisations patronales, hors cotisations bénévoles) ouvrierssbouv salaire brut (y compris gratifications) ouvriershoouv heures rémunérées ouvriershtouv heures travaillées ouvriershmouv heures maladies ouvriershcouv heures chômées ouvriersfremp nombre d'employéscsemp coût salarial (y compris cotisations patronales, hors cotisations bénévoles) employéssbemp salaire brut (y compris gratifications) employéshoemp heures rémunérées employéshtemp heures travaillées employés
For the moment GODs are available for the majority of the production chains. However, due to the implementation in simple Excel flowcharts, regular maintenance and updating is a major challenge. There are plans to replace the Excel tool with GSBPMN modelling tools.
1.1.2.3 Version analysis and backups
A second tool to ensure the quality of national accounting data is the analysis of the version of a file associated to the system of backups.Key files are analysed on a regular basis and have several backups of successive versions. This is particularly important to be able to analyse the consistency and the impact of revisions on the times series. Hence, for example the two main databases BASTOT (main reference for the results of the structural business statistics) and CNTOT (main input in the integration process of the production and expenditure approach into the framework of annual supply and use tables) have version analyses at a very detailed level at the start of a new annual campaign when the newly available data as well as all revised data are integrated. Analysis happens at a more and more detailed level of the NACE, going up to the 5-position NACELux level. If any anomalies are detected, a return to the microdata files is possible. If needed, the data supplier can be contacted to provide explanations and/or to correct the observed errors.It is possible to compare older versions of key files, available via the archiving system, over time given the standardised structure over several years. For each annual campaign, a large number of basic, intermediate as well as final files are saved in a read-only archive.While feeding the data into the supply and use balancing tool, the “MASTER”, another very detailed analysis of versions is realised and major changes are archived for future reference.
1.1.2.4 « Doors » and « GateKeeper » applications
Prior to the loading of the supply and use balancing tool, all data are saved in the database “Doors”. This database is the only and compulsory entry point, the unique “door”, for the data in transit towards the “MASTER”.The “Doors” are a large collection of files with the following characteristics:
complete standardisation concerning the nomenclatures and the variables included one single file per year per variable

Data are regrouped in subsets: MAKE matrix, USE matrix, vectors of imports and exports, vectors of trade margins, etc.
documentation of the date and time of the creation of the file existing for each record in each file (TDate and TTime)
During the loading of the balancing tool, the concerned data is loaded one by one through the tool “GateKeeper” towards the balancing tool “MASTER”.“GateKeeper”allows to:
select years and/or variables to be loaded into the “MASTER” individually compare the version of the concept to be loaded (for example exports) to the version
previously loaded. This is helpful during the revisions of national accounting series (production of semi-final and final accounts).
visualise differences between versions by products and by branches used in the balancing of resources and uses, respectively the MAKE and USE matrixes in the most detailed level of the nomenclature available
visualise differences between the loaded version and an already balanced version for the year under review. This allows to control if potential changes in the database will have the same effect as previous arbitrages in the “MASTER” during previous campaigns.
keep an automatic and time stamped trace of the main differences while loading (“GateKeeper Log”)
keep track of the time, the hour and the user having charged the selected variable in the “MASTER”.
“GateKeeper” and “GateKeeper Log” make it possible to retrace each change on a database level during its transition to the “MASTER”. The “Doors” database is subject to a read-only backup in the archives and serves as a documentation of the national accounts successive versions.
1.1.2.5 « MASTER » application for supply and use balancing
The arbitrage between resources and uses per product is made in the tool “MASTER”. The tool “MASTER ERE” allows visualising and working on three “MASTER”-files simultaneously. For example, this three “MASTER”-files can be for different years (balancing a 3-year time series) or multiple versions of the same year. The following is an often used constellation: an old, already balanced version for the year’s t-1 and t and a version to be balanced for year t. Other constellations are possible as well.The arbitrage between resources and uses is a manual process. All disequilibria need to be resorbed manually based on decisions by the responsible national accountant. In order to make the best arbitrage possible, all the decisions are based on archive previous balancing decisions made available in the tools “MASTER” and “MASTER ERE”. However, an automatic rule is never applied. The products which need to be balanced are allocated to different members of the units MAC1 and MAC2 in respect of their specialization. For example the main financial services are treated by the specialists of the financial sector. The products whose final uses are largely composed by households’ final consumption (for example meat, tobacco, etc.) are balanced by the person in charge of households’ final consumption.Meetings are organised to balance larger disequilibria and to arbitrate products with a very high importance within the Luxembourgish economy. During these meetings, the supply and use equilibria are projected on a large screen (“cinema” meetings) and resorbed interactively by a team. The decisions taken are documented in a statement: “Remarks on the balancing campaign XXXX”.The “MASTER” allows documenting each arbitrage decision in a special information file. This file memorizes all the decisions taken and helps to make consistent arbitrage decisions.

1.1.3 Source dataA particularly elaborated control system has been developed to exploit the data of the structural business survey (SBS) by ENT3 - Structural Business Statistics. Since GDP is largely estimated in the production approach, this control system is very important for Luxembourg’s national accounts Hence, for the SBS survey an analysis and risk treatment system has been elaborated. The goal of this risk analysis is to document the production chain relative to the structural business statistics by refocussing the validation environment of the quality of these statistics. This risk analysis1:
allows to define guiding principles on how to document the processes and the methodology and thus allows to adapt the detail level of such a documentation.
provides an identification method for the evaluation criteria and the risks impacting the latter, yielding in a more trustworthy auto-evaluation process.
links the methodological documentation to the evaluation of statistics with respect to quality and methodology criteria
1.1.4 Formal control and supervision instruments
1.1.4.1 Quality reports
To determine the contribution of each member state of the EU to the 4 th own resource GNI, Luxembourg communicates the GNI, calculated according to the SEC2010 concepts, each year on the 22nd of September.The notification questionnaire of the GNI is accompanied by a quality report informing on:
the main changes made to the national accounts’ sources and methods revision policy and national publication date the quality inquiry results recent developments of statistical sources which may impact GNI changes of sources and methods made to the final estimates of national accounts revisions of years n-1, n-2, n-3 and n-4
The GNI questionnaire and the quality report are then submitted to the « Comité relatif à l'harmonisation du revenu national brut aux prix du marché » (GNI committee) for formal approval.
1.1.4.2 Audits
In the light of its rather small size the STATEC has no internal audit service.Nevertheless the units MAC1 – National Accounts, MAC2 – Sector accounts and MAC4 – General government accounts have been subject to audits by external advisers.
Firstly there are the regular audits by services of the European Commission (Eurostat, General-Directorate Economy and Finance, General-Directorate Budget) and by the European Court of Auditors. Generally these audits position themselves in the European regulatory environment relating to own resources (4th own resource GNI and 3rd own resource VAT) or the notification of excessive deficits (Stability Pact).
Secondly, STATEC has commissioned an external audit by an independent external auditor from French INSEE. The conclusions of this audit (available in written final report) are currently under review and some important medium and long term decisions have already taken account of them (e.g. the need for a fundamental redesign of the IT production process of Luxembourg’s national accounts).
1 From « Analyse de risque dans le domaine de l’information statistique – appliquée aux données de l’enquête structurelle sur les entreprises » ; Georges Zangerlé ; 28/07/2009 ; Economie et statistiques Working papers du STATEC Nr 29/2009 (a free pdf version can be downloaded here : http://www.statistiques.public.lu/fr/publications/series/Economie_et_statistiques/2009/29_2009/index.html )

1.1.4.3 Data flow inventory (DFI)
A recurring requirement/request made by the different institutions of the EU (Eurostat, Court of Auditors) during their audits is about the implementation of more formal service agreements (“Service level agreement” (SLA)) between suppliers and users of the statistical data. This should be done for both, internal and external suppliers of STATEC. STATEC is an administration with a small size (199 staff members in total), the setup of SLAs can be seen as a disproportionate venture with respect to STATEC’s size. Therefore STATEC rather opted for the implementation of a data flow inventory (DFI) without formal service agreements.The main goal of the DFI is to formalize data flow between suppliers and users by determining the persons in charge of data supply, the supply deadlines, the timetables of availability and of updates, etc. All of this is possible without the administrative and legal background accompanying “real” SLAs (for example formal agreement, no respect clauses, etc.). A DFI allows to ensure transparency of data flows and to raise the awareness of STATEC’s members as well as external suppliers of their obligations towards the users of their data. Currently the DFI is work in progress.
1.1.5 Organisation and managementIn general the work program for a year t is fixed during the annual planning of STATEC’s executives in year t-1. The planning is forward looking on the three next years. The strategical objectives for years t, t+1 and t+2 are fixed during the annual planning. At that moment the tasks of year t-1 are critically reviewed. The work program then needs to be formally approved by the “Conseil supérieur de la statistique”.The follow-up of the work program is made on multiple levels. Subgroups of STATEC’s executives meet and discuss transversal issues:
Issues concerning multiple divisions at the same time are discussed in the “Comité de direction”
Each week all head of units of the MAC division meet to discuss the working plan.Most of the follow-up of the work program concerning national accounts is done internally in the MAC division. In order to be more efficient, MAC division is subdivided into 5 units (see Figure 1.3):
MAC1 – National Accounts (including quarterly and annual accounts) MAC2 – Sector Accounts (including financial institutions) MAC3 – Balance of payments MAC4 – Government Accounts MAC5 – Environmental accounts and energy statistics
Each head of unit meets with the full staff of the unit once a week to monitor progress and discuss problems.
1.1.6 Main approaches usedThe production approach is the main approach for calculating GDP (Gross Domestic Product) both for the provisional and the final accounts. For the expenditure approach, STATEC aims to do an idenpendant estimate of all the components of final demand (provided that the supply and production approaches are not conceptually linked (e.g. public consumption)). Nevertheless there are cases where elements of the production and expenditure approach are confronted at earlier stage in the production process of the accounts. The annual supply-and-use tables ensure the full integration and coherence of the two approaches at the level of 135 industries and 270 products. In contrast, the income approach plays no role in assessing the level of GDP. Gross operating surplus is derived as a balancing item.

Figure 1.3: STATEC organisational chart (1.6.2016)
STATEC Organisation Chart
Director(Serge Allegrezza)
Division SG General Services(Denise Schroeder)
SG1 - Dissemination and Communication
(Guy Zacharias)Deputy head of
division
SG2 - Information Technology
(Laurent Maretti)
SG3 - Human Resources and
Budget(Denise Schroeder)
SG4 - Central Balance Sheet Office(Patricia Gonzalez)
Division SOCSocial Statistics
(Jérôme Hury)
SOC1 - Living Conditions(Liliane Reichmann)
SOC2 - Labour Market and Education
(Marco Schockmel)
SOC2 - Marché du travail et éducation(Jan Ries) SOC3 - Population et eChef de division adjoint
SOC4 - Price Statistics(Claude Lamboray)
Division ENTBusiness Statistics
(Lucia Gargano)
ENT1 - External Trade(Alain Hoffmann)
Deputy head of division
ENT2 - Foreign Direct Investments
(Gilles Genson)
ENT3 - Structural Business Statistics(Georges Zangerlé)
ENT4 - Short Term Indicators
(Frank Hansen)
ENT5 - Business Register
(Mike Hartmann)
Division MAC Macroeconomic
Statistics(John Haas)
MAC1 - National Accounts
(René Krippes)
MAC2 - Sector Accounts
(Laurent Pütz)Deputy head of division
MAC3 - Balance of Payments
(Nico Weyer)
Division CMP Economic, Modelling
and Forecast(Ferdy Adam)
CMP1 - Short Term Economics
(Bastien Larue)Deputy head of division
Secretary's Office(Sandra Paul, Anne-Marie Koltz, Arlette
Steffen)
MAC5 - Energy and Environment
(Olivier Thunus)
Deputy Director(Nico Weydert)
MAC4 - Government Accounts
(David Soppelsa)
SG5 -Documentation
Centre(Simone Casali)
Division RED Applied Research
(Chiara Peroni)
SOC3 - Population and Housing
(Germaine Thill) Deputy head of division
ANECResearch
CMP2 - Modelling and Forecast
(Ferdy Adam)
1.1.7 Geographical coverageThe economic territory of Luxembourg comprises: the geographic territory; customs warehouses; national airspace; geostationary positions in space; territorial enclaves in the rest of the world (embassies).However, it excludes all of the parts of the national territory used by other countries (embassies) or international organisations, particularly the institutions of the European Union and NATO.
1.2 Revisions policy and timetable for revising and finalising the estimates
The timetable for revising the accounts is mainly based on the timetable for submitting the ESA2010 tables to Eurostat (annex B of regulation (EU) No 549/2013) :
t + 85 days: preliminary estimate for the year t by adding together the 4 quarters of the year t taken from the quarterly national accounts (t+85 days is set according to a transmission program derogation which will expire on 1st of January 2019)

t + 9 months: provisional figures, preliminary “annual” estimate for the year t;t + 21 months: revised provisional figures;t + 33 months: semi-finalised figures;t + 45 months: final figures.The valuation methods used for the different versions vary insofar as the variables which are initially updated on the basis of trend indicators are replaced by figures from direct sources as soon as they become available. Only the data sources and statistical methods used for the final accounts are described in this inventory. In accordance with what was agreed by the EU Member States, the Luxembourg accounts undergo “benchmark revision” every five years. These major revisions are an opportunity to implement major changes in methodology or take account of significant changes in the data sources. The latest benchmark revision was carried out in 2014 (ESA 2010 benchmark revision). The next is scheduled for 2020.Transition from ESA 95 to ESA 2010 can be qualified as an “exceptional benchmark revision”, since it combined major methodological revisions with the usual benchmark revisions of longer time series.
1.3 Outline of the production approach
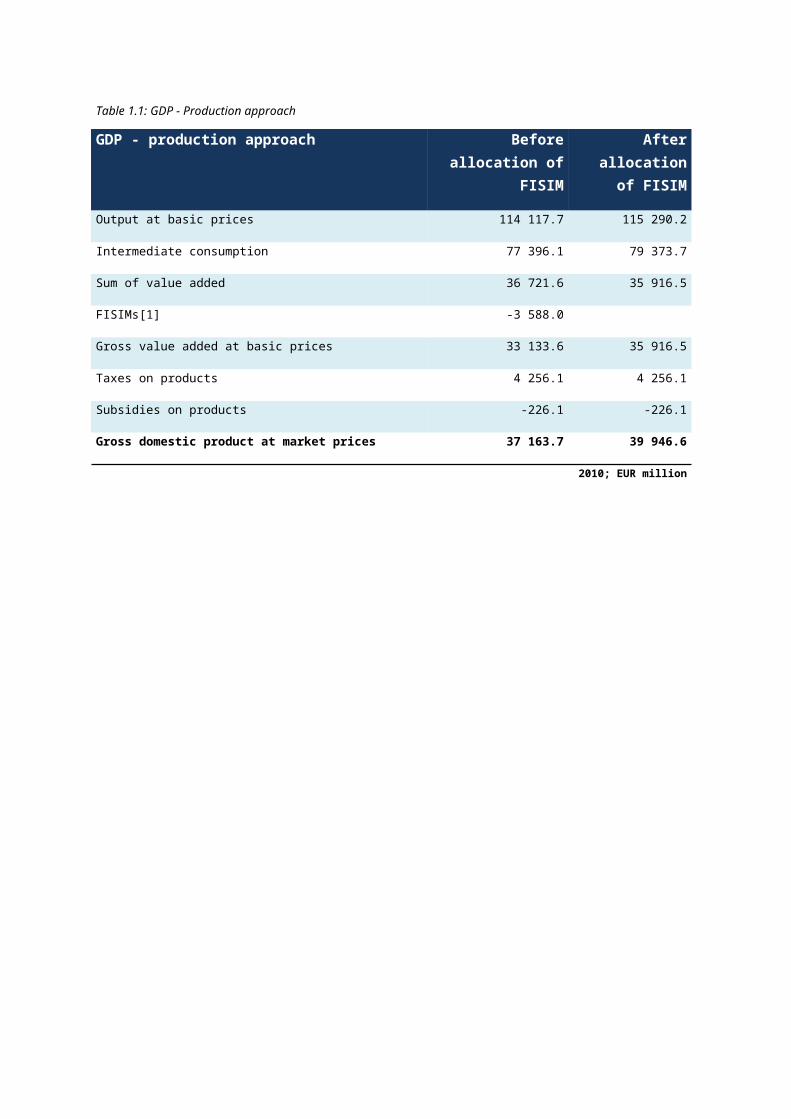
1.3.1 Reference frameworkIn the production approach, GDP is valued on the basis of the production accounts of the institutional units, industries, or institutional sectors. Gross value added of economic units is calculated by substracting intermediate consumption from the value of production.GDP is calculated by adding net taxes on products (taxes less subsidies on products) to the sum of value added for all industries. Production and gross value added are calculated at basic prices. GDP is valued at market prices.In Luxembourg the production approach is the dominant approach for valuing Gross Domestic Product.

Table 1.1: GDP - Production approach
GDP - production approach Before allocation of FISIM
After allocation of FISIM
Output at basic prices 114 117.7 115 290.2
Intermediate consumption 77 396.1 79 373.7
Sum of value added 36 721.6 35 916.5
FISIMs[1] -3 588.0
Gross value added at basic prices 33 133.6 35 916.5
Taxes on products 4 256.1 4 256.1
Subsidies on products -226.1 -226.1
Gross domestic product at market prices 37 163.7 39 946.6
2010; EUR million

Table 1.2: Value added by industry
Value added by industries Production at basic
prices
Intermediate
consumption
Gross value
added at basic
prices
Agriculture, forestry and fishing A 345.4 246.0 99.3
Mining and quarrying B 66.9 36.6 30.3
Manufacturing C 9286.7 7206.3 2080.4
Electricity, gas, steam and air conditioning supply D 1087.8 787.5 300.3
Water supply; Sewerage, waste management and remediation activities
E 410.7 186.7 224.0
Construction F 4859.3 2932.5 1926.8
Wholesale ans retail trade; Repair of motor vehicles and motorcycles
G 8975.7 5279.1 3696.6
Transportation and storage H 4219.6 2526.1 1693.5
Accomodation and food service activities I 1289.4 634.1 655.3
Information and communication J 7192.3 4931.8 2260.5
Financial and insurance activities K 56333.4 46137.6 10195.8
Real estate activities L 3936.5 962.3 2974.2
Professional, scientific and technical activities M 4294.2 1782.2 2512.0
Administrative and support service activities N 4600.9 3543.6 1057.4
Public administration and defence; compulsory social security
O 2835.1 764.0 2071.1
Education P 1783.7 266.9 1516.8
Human health and social work activities Q 2681.0 750.2 1930.7
Arts, entertainment and recreation R 476.8 229.7 247.1
Other service activities S 497.9 170.6 327.3
Activities of households as employers; Undifferentiated goods- and services-producing activities of households for own use
T 117.0 0.0 117.0
Activities of extraterritorial organisations and bodies U 0.0 0.0 0.0
Total for Industries: 115 290.2 79 373.7 35 916.5
2010; EUR million

Table 1.3:Value added by institutional sector
Value added by institutional sector Production at basic prices
Intermediate consumption
Gross value added at basic prices
Non-financial corporate sector S.11 47 115.6 29 942.2 17 173.4
Financial corporate sector S.12 56 289.9 46 136.2 10 153.7
Government sector S.13 6 024.5 1 550.6 4 473.9
Household sector S.14 5 192.6 1 527.1 3 665.6
Non-profit institutions serving households S.15 667.6 217.2 450.4
Total of all sectors 115 290.2 79 373.3 35 917.0
2010; millions EURO
Production is defined by ESA2010 as “an activity carried out under the control and responsibility of an institutional unit that uses inputs of labour, capital and goods and services to produce goods and services. Production does not cover natural processes which have no human involvement or direction” (ESA2010, 3.07).Production essentially comprises:
a) the production of goods and services supplied or intended to be supplied to units other than their producers;
b) the own-account production of all goods that are retained by their producers for their own final consumption or gross fixed capital formation.
Volunteer activities that do not result in goods, e.g. caring for the elderly without payment, are excluded.Production also excludes domestic and personal services that are produced and consumed within the same household, with the exception of the services of owner-occupied dwellings and of employment of paid domestic staff (ESA2010, 3.09).Production comprises informal production (production not declared to the tax authorities, undeclared work etc.) as well as illegal or even criminal production (production and distribution of drugs, procurement, etc.) for the extent that it is not already included in legal activities (money laundering via “fictitious” legal activities). The base unit of observation used in the production approach is the kind-of-activity unit (KAU).However, it should be pointed out that basic data (production and use accounts) are available at the level of the kind-of-activity unit only for businesses of a certain size. For the others, the business, or more precisely, the legal unit, constitutes the base unit. KAUs are grouped into industries according to their main activity. The nomenclature used is NACELUX Rev 2 a more detailed version (coded to 5 digits) of the Classification of Economic Activities in the European Community NACE Rev 2. Moreover, the base units are classified by institutional sector, which makes it possible to compile production accounts and generation of income accounts by industry and by institutional sector, as

well as by type of producer (market producer, producer for own final use, or other non-market producer). Base units are managed within the framework of the “Répertoire des entreprises”.
1.3.2 Main data sourcesOnly the data sources used to compile the final accounts are described in the scope of this inventory.Statistical register of businesses (“Répertoire des entreprises”)The statistical register of businesses and legal persons serves as the framework for identifying economic units and classifying them by industry and institutional sector; it is the basis for statistical surveys of businesses.The base unit is the legal unit (natural or legal person), as defined in the National register of natural and legal persons (“Répertoire national des personnes physiques et morales”) managed by the ”Centre des Technologies de l’Information de l’État” (CTIE).In the vast majority of cases, the legal unit corresponds to the institutional unit as defined in ESA2010 (“enterprise” for market industries). The directory includes all sole proprietorships which are subject to VAT or employ paid employees together with all businesses which are incorporated (legal persons). The statistical directory also includes all central and local government, social-security administration and non-profit institutions serving households.In addition to descriptive information on the statistical units, STATEC’s statistical directory also includes some accounting information (turnover, imports and exports, etc.) from VAT declarations and information on paid employment (by sex, status and duration of work) derived from the declarations of employment submitted to social security. The directory is also the basis for extrapolating from sample surveys and for estimating businesses which were not included in the survey samples.Annual VAT Declarations (“ESKORT” files)Since 2000, STATEC receives “ESKORT” files, which include legal units’ annual VAT declarations, from the CTIE. These declarations currently cover the period 1997 to 2014. The files contain 879 variables, as defined on the annual VAT declaration form (see chapter 10).One of main uses of the ESKORT files is to provide an estimate of gross fixed capital formation for missing legal units (see chapter 5).Annual Structural Business Survey (SBS) The main source for calculating GDP in the production approach is the annual Structural Business Survey first carried out in 1998 and covering the 1996 fiscal year (Council Regulation (EC, Euratom) No 295/2008 of 11th of March 2008 dealing with structural business statistics). The Annual Structural Business Survey replaced the annual survey of industrial enterprises and periodical surveys of service enterprises. It is a sample survey carried out using the quota method to ensure that all the industries at the group level of NACE Rev 2 are represented and that all businesses with a turnover exceeding EUR 7 million or having more than 45 employees are included in the sample. Estimates of businesses not included in the sample are made on the basis of the statistical register of businesses. The Structural Business Survey is the main data source for sections B to N (except for letting of own property) and R to S of NACE Rev 2.Accounting documentsFor certain large service enterprises (railways, postal services and telecommunications, radio and television, air transport, satellite operations, casinos and gambling), and for market and non-market public units not included in the government accounts, annual reports and accounting documents are used directly.Administrative sourcesAdministrative data are the main data source for sections A, K, O to Q of NACE Rev 2.

The economic accounts for agriculture and forestry (part of section A of NACE Rev 2) are compiled using the economic accounts and the agricultural statistics from the Service d’économie rurale (SER) du Ministère de l’agriculture and the “Service de l’Aménagement des Bois et de l’Economie Forestière” de l’Administration des Eaux et Forêts du Ministère de l’Environnement.For financial intermediation (section K of NACE Rev 2), the main sources are the statistics, accounts and balance sheets collected by supervisory bodies such as the Commissariat aux assurances (Insurance Authority - CAA), the Commission de surveillance du secteur financier (CSSF – the institution which supervises the professionals and products of the Luxembourg financial sector) and the Banque Centrale du Luxembourg (Luxembourg Central Bank).The accounting documents for hospitals (private and public) were provided by the Union des caisses de maladie (Association of Sickness Funds – UCM). These documents include:
• Profit and loss accounts for each hospital. These accounts relate to a sufficient product detail so to be able to assign the purchases and sales of the hospitals by product.
• Balance sheet data for each hospital.
The accounts of general government and its three sub-sectors are compiled on the basis of administrative accounts and budgetary data made available to STATEC by:
the Inspection générale des finances - IGF (Ministry of Finance) the Service de Contrôle de la Comptabilité des communes (Ministry of the Interior) the Inspection générale de la sécurité sociale - IGSS.
In addition, STATEC collects accounts and balance sheets directly from public establishments and other units within the general government sector that are not included in administrative accounts.
Decennial census of population and annual fiscal censusThe decennial census of population and annual fiscal census are the basis for the valuation of housing services. The population census data from 2001 and 2011 is used for the calculation of production of owner occupied dwelling services. The annual fiscal census is the base of the calculation of actual rents, although it is no longer be available for the years after 2012 (2009 for the town of Luxembourg). Household budget surveyThe annual household budget survey, together with data on paid employment and social security payments from the social-security registers are used as the basis for the valuation of domestic services. Data on paid employment and social security payments Statistics relating to paid employment and compensation by industry and institutional sector are calculated by the Centre informatique de la sécurité sociale and the Inspection générale de la Sécurité Sociale (IGSS) in close cooperation with STATEC. They relate to paid employment and payments declared to social security. These statistics are used to check the data from other statistical sources and for indirect estimates, particularly for non-profit institutions serving households.
1.3.3 Calculation of gross value added and Gross Domestic ProductUsing data sources described above, detailed production accounts are drawn up for all industries and institutional sectors.The basic statistics are processed to make it possible to classify units of production both by industry at the sub-class level of NACELux Rev 2 (breakdown of the five-digit NACE Rev. 2) and by institutional
sector (4 decimal places of ESA2010’s sectoral classification). The production account and generation of income account are calculated at this level of classification.Market output is initially valued at market prices. Subsidies and taxes on products are recorded at the level of basic statistics (surveys, company accounts, detailed administrative information per business for certain taxes or subsidies, etc.) and rendered consistent with the data from the general government accounts, thereby allowing the basic price to be calculated.Own-account production is in principle valued at basic prices of similar products sold on the market. In contrast, for one-of-a-kind investment goods, the production costs are used as best estimate.The valuation of other non-market output is calculated as some of costs:
Intermediate consumption (P.2);+ compensation of employees (D.1);+ other taxes on production (D.29);- other subsidies on production (D.39);+ consumption of fixed capital (K.1)
Intermediate consumption is valued at purchasers’ prices including trade and transport margins and non-deductible VAT.In principle, the basic data sources include all of the accounting details needed to calculate production and intermediate consumption according to ESA2010’s evaluation criteria.The following adjustments were made for the transition from business or administrative accounting to national accounting concepts: revaluation of changes in inventories to eliminate holding gains or losses included in the book
values of stocks; replacement of the charges for insurance premiums included in business or administrative
accounting by the value of the insurance service; reclassification as intermediate consumption of expenditures for market studies, impact studies
and certain start-up expenditure that business or administrative accounting allows to immobilize;
exclusion of financial leasing fees from intermediate consumption; valuation of consumption of fixed capital according to economic rather than fiscal criteria; recording of taxes on products at the time of the transaction giving rise to the tax rather than at
the time that the taxes are paid (which corresponds to traditional accounting in the administrative accounts of general government). No similar adjustment has been applied to subsidies on products since government expenditure – unlike revenue – are generally allocated to administrative accounts in the year where the related economic activity is occuring.
The balancing item in the production account for the various industries or institutional sectors is gross value added at basic prices.Gross Domestic Product at market prices (GDP) is calculated by adding taxes on products to the sum of value added at basic prices and deducting subsidies on products. Allocation to uses of financial intermediation services indirectly measured (FISIM) is made as a separate layer in the supply and use framework.Taxes on products comprise VAT (D.211), taxes and duties on imports, excluding VAT (D.212) and taxes on products except VAT and import taxes (D.214). Taxes on products are recorded at the time of the transaction giving rise to the tax (time adjusted cash registering), and thereby differ from the amounts recorded in the administrative accounts of general government which refer to the amounts received during the financial year (cash base registering).

Moreover, taxes on products except VAT and import taxes (D.214) need to be broken down by product, industry and institutional sector, as production and value added are valued at basic prices. The breakdown is achieved by benchmarking the data gathered from business accounts to the detailed data on taxes per product recorded in the general government accounts.Taxes on imports and other taxes on products mainly comprise customs duties, excise duties on mineral oils and on tobacco, and excise duties and consumption taxes on alcohol, taxes on gambling, taxes on insurance and registration fees.Subsidies on products include import subsidies (D.311) and other subsidies on products (D.319). Like taxes on products, subsidies on products are recorded at the time of the transaction giving rise to the subsidies. No adjustment similar to that applied to taxes on products has been applied to subsidies on products since government expenditure is generally allocated to administrative accounts in the year when the payables are created. The other subsidies on products are also broken down by industry and sector by adjusting the data gathered from business accounts to the detailed data per product recorded in the general government accounts.Subsidies on products mainly relate to public transport and agricultural products (as part of the common agricultural policy of the EU).
1.3.4 The role of direct and indirect estimation methods and of benchmarks and extrapolationDirect estimation methods are methods based on surveys (either census or sample surveys) or annual administrative data which include the main variables required (production, intermediate consumption, etc.). Indirect estimation methods include the following:
annual data estimated by extrapolating from the data of a base year using indicators; annual data not surveyed directly, but rather deduced from other sources of statistics.
Direct methods of estimation are predominant in the compilation process of Luxembourg’s GDP. They are used for all the industries covered by the Annual Structural Business Survey, accounting documents or administrative statistics.Indirect methods are used for a limited number of industries such as services provided by doctors, insurance agents, rental of commercial premises or owner-occupied dwellings and most non-market services of non-profit institutions serving households (NPISH). More frequently “combined” methods are used, whereby certain key components of the economic accounts are surveyed every year (e.g. production), while detailed breakdowns of production or general expenses are based on surveys with a less than annal frequency.
1.3.5 Independence of the different approaches to GDPAs the production approach is the main approach used for GDP evaluation, it can be considered to be independent of the expenditure approach.Nonetheless, in a limited number of cases production and final expenditure are valued on the basis of the same source data and in a completely integrated manner, meaning that the two approaches are not independent.This is the case for:• non-market government services;• non-market services of non-profit institutions serving households (NPISH);• housing services;• domestic services;• services of doctors, dentists and other health professionals.

In contrast, the income approach is not independent and is completely integrated within the production approach. Gross operating surplus is a residual item.
1.3.6 Main compilation steps of the production approachThe accounts using the production approach are prepared in the following steps:a) From basic data to “BASTOT” collection of basic data (surveys, administrative data, indirect estimates) in an initial
comprehensive file comprising all the variables required to compile the production and generation of income accounts together with the main variables for the production of the income account by industry (at the five-digit level of NACELux Rev 2) and by institutional sector/sub-sector. Note that at that level, most adjustments made to take account of the differences between business accounting or administrative statistics and national accounting concepts have already been applied (reclassification as intermediate consumption of market studies expenditure, or exclusion of financial leasing fees from intermediate consumption)
valuation of undeclared work; comparison of variables concerning resources and compensation of employees with the social
security statistics, applying adjustments if necessary.Result: the “BASTOT” database. This database is also partly the reference for the results of business structural statistics.b) From “BASTOT” to “CNTOT”: revaluation of changes in inventories to eliminate holding gains or losses included in the book
values of inventories; replacement of the charges for insurance premiums included in business or administrative
accounting by the value of the insurance service after pre-balancing of the insurance gross premiums;
valuation of consumption of fixed capital according to economic rather than fiscal criteria (incorporation of the results of the capital stock calculation in the database);
adjustment of taxes on production (taxes on products and other taxes on production), of subsidies (subsidies on products and other subsidies on production) and of current taxes on income, wealth, etc. on the taxes recorded in the general government accounts (in line with the time adjusted cash recording principle);
estimate of tips; estimate of tax evasion (fraud on turnover in relation to VAT declarations).Result: the “CNTOT” database. This database, which can be regarded as the “intermediate accounts”, is an input for the process of integrating the production and expenditure approaches within the framework of annual supply-and-use tables. Lastly, the final step in preparing the accounts, following the integration of the production and expenditure approaches, consists of allocating financial intermediation services indirectly measured (FISIM) to the the various uses and, in the production approach, to intermediate consumption by institutional sector and industry.
1.3.7 ExhaustivenessThis subchapter provides an overview of the main instruments used for assuring exhaustiveness and of the adjustments done in order to guarantee exhaustiveness of the production approach. A more detailed description is provided in chapter 7.

1.3.7.1 Business register (Répertoire des entreprises)
The statistical register of businesses and legal persons covers all units and is the reference framework for assuring the exhaustiveness of the production approach. The register is the basis for identifying economic entities and industries and for carrying out surveys on businesses: survey sampling, calculation of sample coverage versus total population, grossing up from the results of the survey, and adjustment for non-response to the survey.
1.3.7.2 Rectifications on the basis of tax audits (VAT fraud)
The data reported to the STATEC unit in charge of the business register by the “Administration de l’Enregistrement et des Domaines” includes information on declared turnover, administrative tax assessments, tax returns audited and rectifications as a result of audits or on-site inspections.On the basis of the rectifications made by the “Administration de l’Enregistrement et des Domaines” after auditing the declared turnover by businesses, average adjustment rates (3 year averages) are calculated by NACE activity while making a distinction between individual business and companies. These adjustment rates are applied to the turnover and output of unaudited businesses when compiling the production accounts by industry and sector (for audited businesses, the rectified figures are already included in the basic data used to calculate the accounts).This adjustment covers non-exhaustiveness type N6 in terms of the N1-N7 taxonomy of the tabular approach to exhaustiveness.
1.3.7.3 Tips
For hotel, restaurant services, taxis and hairdressing services output, value added and compensation of employees are adjusted for tips which are common for these services. Tipping percentages judged to be reasonable by representatives of the different industries have been used.
Table 1.4: Tipping rates
Activity Rate for tips
Restaurants 3% of the turnover (excluding resales)
Cafés and bars 5% of the turnover (excluding resales)
Hotels with restaurant 2% of the turnover (excluding resales)
Hotels without restaurant 1% of the turnover (excluding resales)
Taxis 5% of turnover
Hairdressing and other beauty treatment
7% of turnover (excluding resales)
This adjustment covers non-exhaustiveness type N7 in terms of the N1-N7 taxonomy of the tabular approach to exhaustiveness.
1.3.7.4 Undeclared work
Undeclared work is explicitly taken into account for estimating the following services: paid domestic services, undeclared private teaching courses undeclared construction or extensions to dwellings.

This adjustment covers non-exhaustiveness types N1 or N7 in terms of the N1-N7 taxonomy of the tabular approach to exhaustiveness.
1.3.7.5 Representatives of foreign companies
Finally the activity of representatives of foreign companies that have no branch as such within the country is estimated on the basis of the salaries paid by these companies (source: social security statistics).This adjustment covers non-exhaustiveness type N7 in terms of the N1-N7 taxonomy of the tabular approach to exhaustiveness.
1.3.7.6 Illegal activities
Trading of drugs and prostitution services are considered as relevant illegal activities for the Luxembourg economy and therefore adjustment are done for these types of activity. This is not the case for smuggling.This adjustment covers non-exhaustiveness type N2 in terms of the N1-N7 taxonomy of the tabular approach to exhaustiveness.
For general government, STATEC can rely on exhaustive administrative data sets. No special adjustment to guarantee exhaustiveness is necessary.
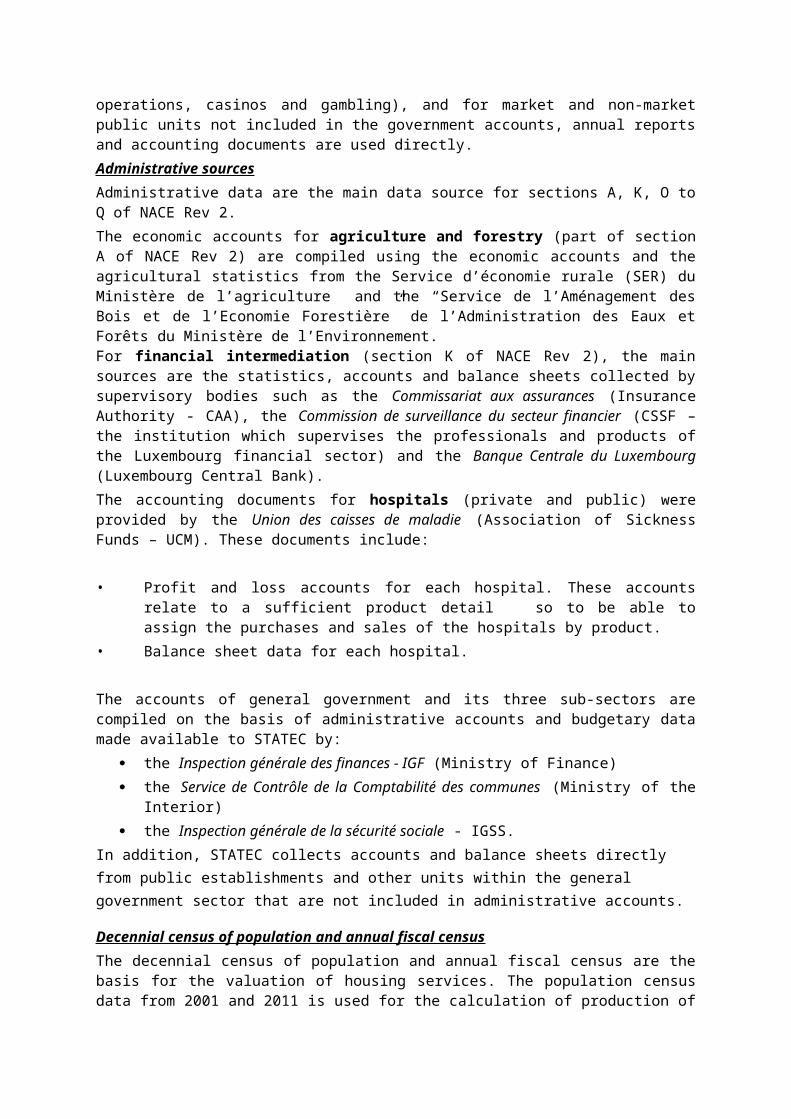
Table 1.5: Adjustments for exhaustiveness
Transaction Exhaustiveness Adjustments
N1 N2 N3 N4 N5 N6 N7 Total
Illegal Economy Output of goods and services (at basic prices)
0.0 86.9 0.0 0.0 0.0 0.0 0.0 86.9
Intermediate consumption (at purchasers' prices )
0.0 0.5 0.0 0.0 0.0 0.0 0.0 0.5
Gross value added (at basic prices)
0.0 86.5 0.0 0.0 0.0 0.0 0.0 86.5
Tips Output of goods and services (at basic prices)
0.0 0.0 0.0 0.0 0.0 0.0 42.1 42.1
Intermediate consumption (at purchasers' prices )
0.0 0.0 0.0 0.0 0.0 0.0 0.0 0.0
Gross value added (at basic prices)
0.0 0.0 0.0 0.0 0.0 0.0 42.1 42.1
Undeclared Work
Output of goods and services (at basic prices)
145.6 0.0 0.0 0.0 0.0 0.0 0.0 145.6
Intermediate consumption (at purchasers' prices )
61.0 0.0 0.0 0.0 0.0 0.0 0.0 61.0
Gross value added (at
84.6 0.0 0.0 0.0 0.0 0.0 0.0 84.6

Transaction Exhaustiveness Adjustments
N1 N2 N3 N4 N5 N6 N7 Total
basic prices)
Vat fraud with complicity
Output of goods and services (at basic prices)
0.0 0.0 0.0 0.0 0.0 134.9 0.0 134.9
Intermediate consumption (at purchasers' prices )
0.0 0.0 0.0 0.0 0.0 0.0 0.0 0.0
Gross value added (at basic prices)
0.0 0.0 0.0 0.0 0.0 134.9 0.0 134.9
Representatives of foreign companies
Output of goods and services (at basic prices)
0.0 0.0 0.0 0.0 0.0 0.0 25.5 25.5
Intermediate consumption (at purchasers' prices )
0.0 0.0 0.0 0.0 0.0 0.0 0.0 0.0
Gross value added (at basic prices)
0.0 0.0 0.0 0.0 0.0 0.0 25.5 25.5
Total Output of goods and services (at basic prices)
145.6 86.9 0.0 0.0 0.0 134.9 67.5 435.0
Intermediate consumption (at purchasers' prices )
61.0 0.5 0.0 0.0 0.0 0.0 0.0 61.5

Transaction Exhaustiveness Adjustments
N1 N2 N3 N4 N5 N6 N7 Total
Gross value added (at basic prices)
84.6 86.5 0.0 0.0 0.0 134.9 67.5 373.5
2010; millions EURO
1.4 Outline of the income approach
1.4.1 Reference frameworkTable 1.4 Gross domestic product at market prices in the income approach
Code Transaction Value
D1 Compensation of employees 19 899
B2G+B3G Gross operating surplus and mixed income 15 634
D2 Taxes on production and imports 4 933
D3 Subsidies 520
B.1*g Gross domestic product at market prices 39 947
2010; millions EURO
In Luxembourg’s national accounting system, only the production and expenditure approaches are available as independent compilation processes. The income approach, in contrast, is merely residual.The income approach places the emphasis on valuing compensation of employees (D.1), other taxes (D.29) and other subsidies (D.39) on production, while the operating surplus and mixed income are calculated as residual.
1.4.2 Main data sourcesThe same sources of data are used as for the production approach, e.g. the Annual Structural Business Survey, the accounting documents of large service enterprises, accounting statistics of supervisory bodies, general government budgets and accounts which include all of the information on compensation of employees. Additional data sources are:
• statistics relating to paid employment and compensation of employees are calculated by the “Inspection de la Sécurité Sociale2” in close cooperation with STATEC on the basis of data originating from the “Centre commun de la Sécurité Sociale” who is managing the affiliation process with legal social security . These statistics cover:
• gross wages; • bonuses;
2 Inspection de la Sécurité Sociale is the supervising body of the legal social security in Luxembourg. It collects as well statistics from the legal social security entities in Luxembourg. (http://www.mss.public.lu/acteurs/igss/index.html)

• employees’ and employers’ social contributions broken down by status (employed, self-employed, civil servants), duration of work (full or part time), sex and residence of the employee, along with the institutional sector, activity defined by NACE classification and residence of the employer;
• tax statistics from the various tax administrations (Administration des Douanes et Accises, Administration de l’Enregistrement et Administration des contributions directes) and from the Ministère de l’Intérieur (for municipal taxes);
• local and central government budgets and accounts for other subsidies on production.
1.4.3 Compensation of employeesCompensation of employees (D.1) includes:
• gross wages and salaries (D.11) prior to the deduction of income tax and employees’ social-security contributions; gross wages and salaries also include compensation for public holidays or paid leave, wages and salaries paid in kind, bonuses, allowances, 13th and 14th months, high-cost-of-living and remoteness allowances, commissions, tips, fees and percentages paid to employees, etc; • Employers’ social contributions (D.12), broken down into actual social contributions (D.121) and imputed social contributions (D.122).
Compensation of employees by industry and sector is evaluated on the basis of the same statistical sources as the other elements in the production approach. Statistics from “Inspection de la Sécurité Sociale” are mainly used to check the data from those other sources and to break compensation down by employees’ status in cases where the basic statistics do not provide such breakdowns and to estimate actual compulsory social contributions. For this component different adjustments are done in order to assure compliance with SEC2010 and exhaustiveness.

Table 1.6: Summary of the adjustments to compensation of employees
Data Value
Source data 19761
Data validation 0
Conceptual adjustment 23
Adjustment for exhaustiveness 116
N1 42
N2 32
N7a 42
Total adjustments 139
Total 19899
2010; millions EURO
1.4.4 Other taxes on productionOther taxes on production (D.29) are taken directly from general government accounts.
1.4.5 Other subsidies on productionLike other taxes, other subsidies on production (D.39) are taken directly from the public authorities’ accounts.
1.4.6 Gross operating surplus and mixed incomeSince the income approach does not exist as an independent method of GDP evaluation, gross operating surplus and mixed income are determined by deducting compensation of employees (D.1) and other taxes on production (D.29) from the gross value added at basic prices (as determined by the production and expenditure approaches) and by adding the other subsidies on production (D.39), or by deducting compensation of employees (D.1) and taxes on production and imports (D.2) from GDP and adding subsidies (D.3).
1.4.7 Consumption of fixed capitalConsumption of fixed capital (P.51c) is the decline in value of fixed assets owned, as a result of normal wear and tear and obsolescence. The estimate of decline in value includes a provision for losses of fixed assets as a result of accidental damage which can be insured against. (ESA2010, paragraph 3.139).Consumption of fixed capital is calculated during valuation of gross fixed capital stock and net fixed capital stock. As no direct survey-based observations for fixed assets are available, the capital stock is estimated using the Perpetual Inventory Method (PIM). 24 product categories are covered.
1.4.8 Main approaches taken with respect to exhaustivenessSTATEC considers that the data sources for taxes, subsidies and compensation of employees have a high degree of exhaustiveness since they stem from closely monitored administrative sources. Nevertheless national accountants need do some adjustments to assure exhaustiveness especially

for the component of compensations of employees (sub component wages and salaries). These adjustments concern:
Undeclared paid domestic services for cleaning Revenues from illegal activities Representatives of non-resident companies Tips and gratuities for different services
Table 1.7: Summary of the adjustments for exhaustiveness to compensation of employees
Adjustment methodType of non-exhaustiveness
N1 N2 N3 N4 N5 N6 N7 Total
Undeclared domestic services 42 42
Revenues from illegal activities 32 32
Representatives of non-resident companies
23 23
Tips and gratuities 42 42
Total 42 32 0 0 0 0 65 139
2010; millions EURO
1.5 Outline of the expenditure approach
1.5.1 Reference frameworkFor the expenditure approach, GDP can be calculated as the sum of the end use of goods and services, with imports deducted.Luxembourg’s national accounts are largely based on the production approach. The expenditure approach is not completely independent, despite the fact that it is largely estimated from databases and methods that are separate from those used for the production approach. Thus, as the various aggregates for the expenditure approach are compiled, reference elements from the production approach are often used, if only to validate an intermediate stage of the compilation of the expenditure approach by comparing a number of sources. The GDP estimate arrived at via the expenditure approach is not therefore fully independent. In fact, the definitive amounts for the various components of expenditure are determined using the annual supply-and-use tables.

Table 1.5 GDP according to the expenditure approach
Code Aggregate Value
P.3 Final consumption expenditure 20126
P.3 Household final consumption expenditure 12725
P.3 Final consumption expenditure of NPISHs 576
P.3 Public Administration final consumption expenditure 6826
P.5 Gross capital formation 7266
P.51 Gross fixed capital formation 7026
P.52 Changes in Inventories 462
P.53 Acquisition less disposals of valuables -222
P.6 Exports of goods and services 69949
Exports of goods 15964
Exports of services 50453
Final consumption expenditure of non-residents 3532
P.7 Imports of goods and services (FOB) 57394
Imports of goods (FOB) 16641
Imports of services (FOB) 39656
Final consumption expenditure of residents while abroad 1097
Gross domestic product at market prices (P.3+P.5+P.6-P.7) 39947
2010; millions EURO
1.5.2 Households’ final consumption expenditure
Definition:“Final consumption expenditure (P.3) consists of expenditure incurred by resident institutional units on goods or services that are used for the direct satisfaction of individual needs or wants or the collective needs of members of the community. (ESA2010, paragraph 3.94)Household final consumption expenditure includes the following borderline cases:a) services of owner-occupied dwellings;
b) income in kind, such as:
a. goods and services received as income in kind by employees;

b. goods or services produced as outputs of unincorporated enterprises owned by households that are retained for consumption by members of the household. Examples are food and other agricultural goods, housing services by owner-occupiers and household services produced by employing paid staff (servants, cooks, gardeners, chauffeurs, etc.);
c) items not treated as intermediate consumption, such as:
a. materials for small repairs to and interior decoration of dwellings of a kind typically carried out by tenants as well as owners;
b. materials for repairs and maintenance to consumer durables, including vehicles;
d) items not treated as capital formation, in particular consumer durables, that continue to perform their function in several accounting periods; this includes the transfer of ownership of some durables from an enterprise to a household (see transactions in existing goods, ESA2010, paragraph 3.181);
e) financial services directly charged and the part of FISIM used for final consumption purposes by households;
f) insurance services by the amount of the implicit service charge (see ESA2010, paragraph 3.74);
g) pension funding services by the amount of the implicit service charge (see ESA2010, paragraph 3.74);
h) payments by households for licences, permits, etc. which are regarded as purchases of services (see ESA2010, paragraphs 4.79 and 4.80);
i) the purchase of output at not economically significant prices, e.g. entrance fees for a museum (see ESA2010, paragraph 3.41).
Table 1.8 HFCE by concept
Household final consumptioon expenditure - by concept
on the domestic territory 15 159.2
of residents abroad 1 097.1
of non-residents on the domestic territory 3 531.7
of residents on the domestic territory and abroad 12 724.6
2010; millions EURO
Table 1.9 HFCE by purpose
Household final consumption expenditure by purpose - domestic concept
Coicop
FOOD AND NON-ALCOHOLIC BEVERAGES 01 1 438.9

Household final consumption expenditure by purpose - domestic concept
Coicop
Food 01.1 1 259.1
Non-alcoholic beverages 01.2 179.8
ALCOHOLIC BEVERAGES, TOBACCO AND NARCOTICS 02 1 295.4
Alcoholic beverages 02.1 319.2
Tobacco 02.2 918.4
Narcotics 02.3 57.8
CLOTHING AND FOOTWEAR 03 776.2
Clothing 03.1 631.4
Footwear 03.2 144.8
HOUSING, WATER, ELECTRICITY, GAS AND OTHER FUELS 04 3 393.6
Actual rentals for housing 04.1 517.0
Imputed rentals for housing 04.2 2 080.7
Maintenance and repair of the dwelling 04.3 192.7
Water supply and miscellaneous services relating to the dwelling 04.4 164.7
Electricity, gas and other fuels 04.5 438.5
FURNISHINGS, HOUSEHOLD EQUIPMENT AND ROUTINE HOUSEHOLD MAINTENANCE
05 986.7
Furniture and furnishings, carpets and other floor coverings 05.1 326.1
Household textiles 05.2 87.4
Household appliances 05.3 110.8
Glassware, tableware and household utensils 05.4 45.5
Tools and equipment for house and garden 05.5 48.9
Goods and services for routine household maintenance 05.6 368.1
HEALTH 06 335.9
Medical products, appliances and equipment 06.1 236.1
Out-patient services 06.2 73.6
Hospital services 06.3 26.2
TRANSPORT 07 2 596.8
Purchase of vehicles 07.1 905.6

Household final consumption expenditure by purpose - domestic concept
Coicop
Operation of personal transport equipment 07.2 1 558.2
Transport services 07.3 132.9
COMMUNICATION 08 242.4
Postal services 08.1 3.0
Telephone and telefax equipment 08.2 18.7
Telephone and telefax services 08.3 220.6
RECREATION AND CULTURE 09 1 041.8
Audio-visual, photographic and information processing equipment 09.1 133.8
Other major durables for recreation and culture 09.2 33.6
Other recreational items and equipment, gardens and pets 09.3 202.9
Recreational and cultural services 09.4 272.6
Newspapers, books and stationery 09.5 165.3
Package holidays 09.6 233.7
EDUCATION 10 121.1
Pre-primary and primary education 10.1 22.9
Secondary education 10.2 28.2
Post-secondary non-tertiary education 10.3 0.0
Tertiary education 10.4 1.0
Education not definable by level 10.5 69.0
RESTAURANTS AND HOTELS 11 1 073.4
Catering services 11.1 857.0
Accommodation services 11.2 216.4
MISCELLANEOUS GOODS AND SERVICES 12 1 857.1
Personal care 12.1 272.6
Prostitution 12.2 80.9
Personal effects n.e.c. 12.3 128.6
Social protection 12.4 326.6
Insurance 12.5 354.4
Financial services n.e.c. 12.6 356.9

Household final consumption expenditure by purpose - domestic concept
Coicop
Other services n.e.c. 12.7 337.0
2010; millions EURO
1.5.3 NPISH final consumption expenditure
Final consumption expenditure of NPISHs includes two separate categories:a) The value of the goods and services produced by NPISHs other than own-account capital formation and other than expenditure made by households and other units;b) Expenditures by NPISHs on goods or services produced by market producers that are supplied – without any transformation – to households for their consumption as social transfers in kind (ESA2010, paragraph 3.97).Collective consumption by non-profit institutions serving households is calculated by deducting investment goods produced on own account and incidental sales (net of VAT) to households and, where applicable, to social security funds or other government agencies from output.
NPISH final consumption expenditure
Before allocation of FISIMs
After allocation of FISIMs
Output P.1 651.5 667.6
For own final use P.12 0.0 0.0
Other non-market output P.13 651.5 667.6
Incidental sales P.131
91.7 91.7
Final consumption expenditure P.3 559.8 576.0
Individual consumption expenditure P.31 559.8 576.0
2010; millions EURO
1.5.4 Government final consumption expenditureFinal consumption expenditure (P.3) by government includes two categories of expenditures, similar to those by NPISHs:a) the value of the goods and services produced by general government itself (P.1) other than
own-account capital formation (corresponding to P.12), market output (P.11) and payments for non-market output (P.131);
b) purchases by general government of goods and services produced by market producers that are supplied to households, without any transformation, as social transfers in kind (D.632). General government pays for these goods and services that the sellers provide to households (ESA2010, paragraph 3.98).

Final consumption expenditure by general government is calculated by deducting market output, output for own final use and incidental sales from total output and adding social benefits in kind corresponding to expenditure on products supplied via market producers.
Table 1.10: Government final consumption expenditure before allocation of FISIM
Government final consumption expenditure before allocation of
FISIMs
General Governmen
t S.13
Central Governmen
t S.1311
Local Governmen
t S.1313
Social Security Funds S.1314
Output P.1 5 977.4 4 321.9 1 482.6 172.9
Market output P.11 439.5 104.5 309.6 25.5
Output produced for own final use P.12 190.3 190.3 0.0 0.0
Non-market output P.13 5 347.6 4 027.1 1 173.0 147.5
Payments for non-market output P.131 530.9 414.0 116.9 0.0
Social transfers in kind - market production purchased by general government and NPISHs
D.632 1 955.9 52.8 17.2 1 885.8
Final consumption expenditure P.3 6 772.6 3 665.9 1 073.4 2 033.3
Individual consumption expenditure P.31 4 442.1 1 979.6 429.1 2 033.3
Collective consumption expenditure P.32 2 330.5 1 686.3 644.2 0.0
2010; millions EURO
Table 1.11: Government final consumption expenditure after allocation of FISIM
Government final consumption expenditure after allocation of
FISIMs
General Governmen
t S.13
Central Governmen
t S.1311
Local Governmen
t S.1313
Social Security Funds S.1314
Output P.1 6 046.6 4 373.5 1 486.6 186.5
Market output P.11 439.5 104.5 309.6 25.5
Output produced for own final use P.12 190.3 190.3 0.0 0.0
Non-market output P.13 5 416.8 4 078.7 1 177.1 161.0
Payments for non-market output P.131 530.9 414.0 116.9 0.0
Social transfers in kind - market production purchased by general government and NPISHs
D.632 1 955.9 52.8 17.2 1 885.8

Final consumption expenditure P.3 6 841.8 3 717.5 1 077.4 2 046.9
Individual consumption expenditure P.31 4 471.3 1 995.1 429.3 2 046.9
Collective consumption expenditure P.32 2 370.5 1 722.4 648.1 0.02010; millions EURO
1.5.5 Gross capital formation
1.5.5.1 Gross fixed capital formation
Table 1.6 Gross fixed capital formation
NACE section
Total Dwellings (AN111)
Other buildings and
structures (AN112)
Machinery and equipment and
weapon systems (ANN113+AN114)
Cultivated biological resources
(AN115)
Intellectual property products (AN117)
A 128 0 93 38 -2 0
B 3 0 2 1 0 0
C 554 0 191 248 0 114
D 266 0 128 128 0 10
E 118 0 100 18 0 1
F 130 2 52 72 0 4
G 345 1 118 165 0 62
H 409 0 39 362 0 8
I 44 0 11 30 0 3
J 640 0 98 485 0 58
K 398 1 83 75 0 239
L 1647 1065 474 102 0 6
M 104 1 24 39 0 41
N 401 1 41 298 0 62
O 1204 7 880 159 0 158
P 300 0 285 14 0 1
Q 215 88 95 27 0 4
R 111 0 104 6 0 0

S 8 0 3 4 0 1
T 0 0 0 0 0 0
U 0 0 0 0 0 0
Total 7026 1168 2820 2269 -2 771
2010; millions EURO
Fixed capital formation (P.51) consists of resident producers’ acquisitions, less disposals, of fixed assets during a given period plus certain additions to the value of non-produced assets realised by the productive activity of producer or institutional units. Fixed assets are produced assets used in production for more than one year. (ESA2010, paragraphs 3.124 to 3.138).Gross fixed capital formation consists of both positive and negative values:
1. positive values:a. new or existing fixed assets purchased;b. fixed assets produced and retained for producers’c. own use (including own account production of fixed assets not yet completed or
fully mature);d. new or existing fixed assets acquired through barter;e. new or existing fixed assets received as capital transfers in kind;f. new or existing fixed assets acquired by the user under a financial lease;g. major improvements to fixed assets and existing historic monuments;h. natural growth of those natural assets that yield repeat products;
2. negative values, i.e. disposals of fixed assets recorded as negative acquisitions:a. existing fixed assets sold;b. existing fixed assets surrendered in barter;c. existing fixed assets surrendered as capital transfers in kind.
The disposals components of fixed assets exclude: consumption of fixed capital (which includes anticipated normal accidental damage); exceptional losses, such as those due to drought or other natural disasters, which are
recorded as other change in the volume of assets.
The following types of gross fixed capital formation are distinguished: dwellings; other buildings and structures; this includes major improvements to land; machinery and equipment, such as ships, cars and computers; weapons systems cultivated biological resources, e.g. trees and livestock; costs of ownership transfer on non-produced assets, like land, contracts, leases and licences; R&D, including the production of freely available R&D;

mineral exploration and evaluation; computer software and databases; entertainment, literary or artistic originals; other intellectual property rights.
The sources of data used to estimate gross fixed capital formation differ according to sector/industry. Estimation of CFCF for Agriculture and Forestry are based on following sources:
STATEC (Enquête sur la structure des exploitations agricoles) Service d’économie rurale - SER3; Institut Vitivinicole de l’Etat -IVV4; Administration des services techniques de l’agriculture - ASTA5; Office national du remembrement - ONR6.
Gross fixed capital formation figures for financial and non-financial corporations, certain non-profit institutions serving households, households as employers and own-account workers realizing market output are estimated on behalf of the data from the annual Structural Business Survey which includes a chapter on investments and from the survey about investment of banks, insurers and hospitals and retirement homes. These surveys provide figures about GCFC based on the business accounts.Estimation of CFCF for General government is based on following sources:
State accounts and budget (revenue and expenditure per budget heading, broken down where applicable) provided by the Inspection générale des Finances;
Local government accounts and budget provided by the Ministère de l’Intérieur as supervising body of the local governments;
Extra-budgetary accounts for the special funds, Chamber of Deputies, Court of Auditors,..; Business accounts of public bodies which classified under general government sector.
Estimation of household investment in dwellings is based on the two following sources: Statistics on completed buildings. This statistic is compiled annually by STATEC. The enquiry
is providing exhaustive data about new dwellings and new other buildings. Land registry: data about sales of dwellings, of other buildings and of land
Research & Development (R&D) survey provides data for R&D activities. In general data from balance sheets and budget accounts from general government are considered to be good proxy for the purchasing price of assets. Capital goods purchased by an entity are valued at business/budget accounts value, excluding deductible VAT, which include any installation and transfer charges. Nevertheless, national accountants have to apply adjustment to arrive at valid CFCF figures compliant with ESA 2010 methodology.
1.5.5.1.1 Data validation
3 Public body in charge of supervising the economic situation of the agriculture in Luxembourg (http://www.ser.public.lu).4 Public body in charge of supervising the viticulture in Luxembourg (www.ivv.publc.lu).5 Public body in charge of consulting the farmers in Luxembourg. (www.asta.etat.lu).6 National Land Consolidation Office (http://www.onr.etat.lu)

First sometimes source data contains issues which are not handled by the responsible of the source data. For these cases, national accountants make their own corrections.Brand names, licences and goodwill have to be eliminated from source data coming from business accounts. Assets under copyright reported in the balance sheet do not always meet the criteria to be considered as CFCF. Value for new dwellings have to be adjusted for the profit margin of property and building development activities when those dwellings are reported in the source data by companies active in these activities, as the value for the final owner will be higher than the construction costs of the declarant. In case of financial leasing, the leased asset is supposed to be invested by the economic owner (lessee). Double counting needs to be avoided as both the lessor and the lessee may report the leased asset in their balance sheet. Provisions have to be taken to avoid double counting because there are overlapping data sources especially for dwellings and other buildings. Non-deductible VAT, if applicable, is added to the source data in order to have the purchasing price of assets.
1.5.5.1.2 Adjustment for exhaustivenessNational accountants make adjustments for undeclared work on construction and repairs to dwellings and for own account construction and repairs to dwellings by households. Costs of ownership transfer for land, for dwellings and for buildings other than dwellings are not covered by a data source. To obtain estimates for these costs of ownership transfer, the value of land, dwellings and buildings other than dwellings is multiplied by an average rate for costs of ownership transfer (notary, registry fees of the owner). This rate depends on the nature of the asset.
1.5.5.1.3 Conceptual adjustmentsFigures about major repairs and renovations for dwellings and other buildings have to be estimated on behalf of turnover of companies active in construction industry and are added to the value of CFCF for dwellings and other buildings. The data from the R&D surveys is used to estimate first the R&D output. In a second step the part of R&D which is considered invested is calculated. In this respect, R&D output which is sold is not supposed to form CFCF for the selling R&D producer. Acquisitions of extramuros R&D is considered to CFCF unless the acquiring company is a main R&D producer. In this case, acquisition of extramuros R&D is intermediate consumption.
1.5.5.1.4 BalancingFinal valuation of gross fixed capital formation is done when reconciliation is carried out in the supply-and-use table.

Table 1.7 Excerpt from Process Table
Total Dwellings (AN111)
Other buildings and structures (AN112)
Machinery and equipment and weapon systems (ANN113+AN114)
Cultivated biological resources (AN115)
Intellectual property products (AN117)
Surveys & Censuses 5836 751 1278 1955 0 1852
Administrative Records 1705 7 1235 260 0 203
Combined Data 130 0 75 57 -2 0
Total (sources) 7672 759 2588 2273 -2 2054
Data validation -1761 -19 -273 -187 0 -1282
Other conceptual 122 220 101 0 0 -198
Total conceptual 122 220 101 0 0 -198
Exhaustiveness N1 101 101 0 0 0 0
Exhaustiveness N7a 171 101 70 0 0 0
Total exhaustiveness 273 203 70 0 0 0
Balancing 720 6 335 183 0 197
Total (adjustments) -646 410 232 -4 0 -1284
Final estimate 7 026 1 168 2 820 2 269 -2 771
2010; millions EURO
1.5.5.2 Changes in inventories
Table 1.11
Changes in inventories 461.9
Changes in inventories of finished goods and work in progress 319.0
Changes in inventories of goods for resale 110.0
Changes in inventories of intermediate goods 32.9
2010; millions EURO

Changes in inventories (P.52) are measured by the value of the entries into inventories less the value of withdrawals and the value of any recurrent losses of goods held in inventories (ESA2010, paragraph 3.146).Changes in inventories should be valued at the time of entering the inventories or at the time of withdrawal (ESA2010, paragraph 3.150). The prices used should be consistent with those of other flows, implying more specifically that (ESA2010, paragraph 3.151):a) output of finished goods transferred into the producer’s inventories are valued as if they were
sold at that time, at current basic prices;
b) additions to work-in-progress is valued in proportion to the estimated current basic price of the finished product;
c) reductions in work-in-progress as withdrawn from inventories when production is finished are valued at current basic prices of the unfinished product;
d) goods transferred out of inventories for sale are valued at basic prices;
e) goods for resale entering the inventories of wholesalers and retailers, etc. are valued at their actual or estimated purchasers’ prices of the trader;
f) goods for resale withdrawn from inventories are valued at the purchasers’ prices at which they can be replaced at the time they are withdrawn (not when acquired).
The estimation methods used are different depending on whether inventory growth is regular or subject to big changes over the period.Where changes in the volume of inventories are spread out regularly over the period, a practical method is to value the inventories at the beginning and end of the period by applying the average prices for the period (purchasers’ prices for inventories held by users or by wholesalers or retailers, basic prices for inventories held by their producers) and to use the difference between these two values.Most inventory data come from accounting documents. Entries into inventories are valued at the price at the time they enter, but this is not the case for withdrawals. Business accounts allow for either the FIFO method (first in, first out), or the average purchase price, but not the price on the day of withdrawal from the inventory.If prices have risen, withdrawals from inventories are underestimated with regard to the rules for national accounts. Where prices have dropped, the opposite is the case.For each sub-sector of activity, changes to inventories are estimated by applying the rate of change of the average price to the inventories from the start of the period.Changes in inventories recorded in the national accounts are thus equal to changes in accounting inventories, with the appreciation of the inventories deducted. Changes in inventories can nonetheless be further adjusted when supplies and uses are balanced.The sources of data used to value inventories are the same as those used to value the production accounts for the various industries (see Chapter 3).

1.5.5.3 Net acquisitions of valuables
Table 1.12 Acquisitions less disposals of valuables
Asset Acquisitions Disposals Acquisition less disposals
Precious metals and stones (AN.131) 742 964 -222
Antiques and other art objects (AN.132) 0
Other valuables (AN.133) 0 0
Total Valuables (AN.13) 742 964 -222
2010; millions EURO
Valuables are non-financial goods that are not used primarily for production or consumption, do not deteriorate (physically) over time under normal conditions and are acquired and held primarily as stores of value.Valuables include the following types of goods:
precious stones and metals, such as diamonds antiques and other art objects, such as paintings, sculptures, etc.; other valuables, such as jewellery fashioned out of precious stones and metals and
collectors’ items.Such types of goods are recorded as acquisition or disposal of valuables in the following examples:
the acquisition or disposal of non-monetary gold, silver, etc. by central banks and other financial intermediaries;
the acquisition or disposal of these goods by enterprises whose principal or secondary activity does not involve the production or trade in such types of goods. This acquisition or disposal is not included in the intermediate consumption or fixed capital formation of these enterprises;
the acquisition or disposal of such goods by households. Such acquisitions are not included in final consumption expenditure by households.
In the ESA, by convention also the following cases are recorded as acquisition or disposal of valuables:(a) the acquisition or disposal of these goods by jewellers and art dealers (following the general definition of valuables, the acquisition of these goods by jewellers and art dealers should be recorded as changes in inventories);(b) the acquisition or disposal of these goods by museums (following the general definition of valuables, the acquisition by a museum of these goods should be recorded as fixed capital formation).
The only data sources which currently make it possible to identify transactions on valuables are: Balance of payments (transactions on non-monetary gold); local and central government budgets and accounts the annual Structural Business Survey and the investment surveys of banks, insurers and
hospitals and retirement homes

Transactions on non-monetary gold are taken from the balance of payments.The amounts collected through the annual Structural Business Survey, the investment surveys of banks, insurers and hospitals and retirement homes and from local and central government budgets and accounts are in general very low. Therefore only transactions in gold are recorded under acquisitions less disposals of valuables.Moreover, no reclassification is carried out on changes of inventories for jewellery and art dealers.
1.5.6 Exports and imports of goodsTable 1.13 Exports and imports of goods
Exports and imports of goods CPA Exports
Imports
Products of agriculture, hunting and related services 01 397 592
Products of forestry, logging and related services 02 27 33
Fish and other fishing products; aquaculture products; support services to fishing 03 3 23
Mining and quarrying B 9 368
Food products, beverages and tobacco products 10_12 616 1 478
Textiles, wearing apparel and leather products 13_15 541 603
Wood and of products of wood and cork, except furniture; articles of straw and plaiting materials
16 164 144
Paper and paper products 17 344 353
Printing and recording services 18 1 1
Coke and refined petroleum products 19 1 110 1 921
Chemicals and chemical products 20 398 1 213
Basic pharmaceutical products and pharmaceutical preparations 21 54 323
Rubber and plastics products 22 1 347 744
Other non-metallic mineral products 23 333 342
Basic metals 24 2 982 2 343
Fabricated metal products, except machinery and equipment 25 600 447
Computer, electronic and optical products 26 560 918
Electrical equipment 27 214 469
Machinery and equipment n.e.c. 28 751 738
Motor vehicles, trailers and semi-trailers 29 503 1 828
Other transport equipment 30 110 607
Furniture; other manufactured goods 31_32 134 463

Repair and installation services of machinery and equipment 33 160 161
Electricity, gas, steam and air-conditioning D 138 219
Natural water; water treatment and supply services 36 0 0
Sewerage; waste collection, treatment and disposal activities; materials recovery; remediation activities and other waste management services
37_39 563 465
Merchanting 3 907
CIF/FOB reclassification -155
Total 15 964 16 641
2010 ; millions EUR
“Imports and exports of goods occur when economic ownership of goods changes between residents and non-residents. This applies irrespective of corresponding physical movements of goods across frontiers.”
“For deliveries between affiliated enterprises (branch or subsidiary, or foreign affiliate): a change of ownership is imputed whenever goods are delivered between affiliated enterprises. This applies only when the establishment receiving the goods assumes responsibility for making the decisions about the levels of supply and prices at which their output is delivered for the market.”
“Exports of goods occur without goods crossing the country’s frontier in the following example:
Merchanting, i.e. the purchase of a good by a resident from a non-resident and the subsequent resale of the good to another non-resident, without the good entering the merchant’s economy.”
“Imports and exports of goods exclude the following goods which nevertheless may cross the national frontier:
Equipment and other goods which are sent abroad for processing, maintenance, servicing or repair; this applies also to goods processed to order abroad when a substantial physical change in the goods is involved.” (ESA 2010, paragraphs 3.162, 3.163, 3.164, and 3.166).
“Imports and exports of goods are to be valued free on board at the border of the exporting country (FOB).” (ESA 2010, paragraph 3.168). The basic data regarding exports of goods are indeed valued free on board (FOB), while imports are valued at the cost, insurance and freight (CIF) price at the border of the importing country. The conversion from CIF to FOB is only done at the aggregate level to allow presentation as requested.The main sources of data are the statistics on Luxembourg’s extra-EU trade, which are compiled on the basis of customs documents in the form of detailed files (Extrastat), and the statistics on intra-EU trade compiled by STATEC on the basis of a monthly survey of businesses (Intrastat). The structural business statistics are the data source for merchanting and the surveys of the Balance of payments

are the sources for data of non-monetary gold. Data is completed with additional sources for imports and exports of European and international institutions as well as for exports of electricity.
The figures determined on the basis of customs documents and the Intrastat survey are adjusted in the following areas:
Data is validated with respect to the nature of transaction codes, return of goods, energy products (e.g.: gasoline, kerosene, gas oils, fuel oils), and satellites.
Nature of transactions codes regarding replacements (e.g. under warranty) for goods not being returned as well as operations regarding goods for repair free of charge are excluded from general merchandise.
Return of goods, the goods were not accepted, or a change of ownership occurred but the parties later agreed to annul the change of ownership. Revised entries are made to exports and imports for the period when the goods were initially recorded, so as to remove the voided transaction.
Energy and environment validates the sources regarding energy products (e.g.: gasoline, kerosene, gas oils, fuel oils) and Balance of payments validates the value of satellites, in particular the transport and insurance costs involved, before forwarding the data to National accounts.
Data is conceptual adjusted with respect to goods for repair, goods sent for processing and merchanting.
The two-digit coding system of the nature of transactions within Intrastat/Extrastat identifies operations with a view to repair as well as operations following repair. The cost of the repair service is recorded within the detailed and expanded declarations of Intrastat directly.
The cost of the repair service on the basis of trade in goods is calculated as follows: Outward repair Inward repair
Both methods of calculation follow the same approach: Connection between arrival/dispatch of operations with a view to repair and operation
following repair Aggregation per year, legal unit, and combined nomenclature Calculation of the difference between operations following repair and operations with a
view to repair The value of the repair service is recorded as trade in services (manufacturing services on
physical inputs owned by others)
The treatment of goods sent for processing and merchanting is mentionend within chapter Error:Reference source not found.

An explicit exhausitveness adjustmtent is made for imports of drugs within the framework of illegal activities.
The treatment of import of drugs is mentionend within chapter Error: Reference source not found.
The CIF/FOB reclassification concerns only the portion of imports entering from countries that do not share a border with Luxembourg. However, the three neighbouring countries – Belgium, Germany and France – account for the vast majority of Luxembourg’s imports. For this reason, the CIF/FOB reclassification concerns only a relatively limited number of transactions and the amounts in question are small.
The table below shows the various adjustments made to the basic data from the Intrastat/Extrastat survey in order to obtain the final figures for exports and imports of goods in the national accounts.
Table 1.13: Exports and imports of goods - Adjustments
Aggregate Basis for NA Figures Adjustments Final
Surveys Combined Data
Data Validation
Conceptual Exhaus-tiveness
Balancing
Exports of goods 11 696 0 647 3 586 0 35 15 964
Imports of goods 16 880 -155 -152 -287 14 341 16 641
2010; millions EURO
1.5.7 Exports and imports of servicesTable 1.14: Exports and imports of services
Exports and imports of services CPA Exports Imports
Constructions and construction works F 249 501
Wholesale and retail trade and repair services of motor vehicles and motorcycles
45 35 4
Wholesale trade services, except of motor vehicles and motorcycles 46 2 955 295
Retail trade services, except of motor vehicles and motorcycles 47 1 313 0
Land transport services and transport services via pipelines 49 924 91
Water transport services 50 20 0
Air transport services 51 1 336 46
Warehousing and support services for transportation 52 481 332
Postal and courier services 53 67 63
Accommodation and food services I 3 79

Publishing services 58 1 100 872
Motion picture, video and television programme production services, sound recording and music publishing; programming and broadcasting services
59_60 373 772
Telecommunications services 61 2 807 1 092
Computer programming, consultancy and related services; information services
62_63 1 773 1 102
Financial services, except insurance and pension funding 64 31 795 2 521
Insurance, reinsurance and pension funding services, except compulsory social security
65 2 073 417
Services auxiliary to financial services and insurance services 66 1 303 18 580
Real estate services 68 35 0
Legal and accounting services; services of head offices; management consulting services
69_70 820 300
Architectural and engineering services; technical testing and analysis services 71 186 429
Scientific research and development services 72 225 7
Advertising and market research services 73 311 335
Other professional, scientific and technical services; veterinary services 74_75 274 2 878
Rental and leasing services 77 3 202 3 776
Employment services 78 56 4
Travel agency, tour operator and other reservation services and related services
79 120 209
Security and investigation services; services to buildings and landscape; office administrative, office support and other business support services
80_82 196 2 085
Public administration and defence services; compulsory social security services
84 5 0
Education services P 56 118
Human health services 86 11 43
Social work services 87_88 4 14
Creative, arts and entertainment services; library, archive, museum and other cultural services; gambling and betting services
90_92 6 23
Sporting services and amusement and recreation services 93 5 11
Services furnished by membership organisations 94 0 47
Repair services of computers and personal and household goods 95 3 5

Other personal services 96 236 2 449
Services of households as employers; undifferentiated goods and services produced by households for own use
T 0 0
Services provided by extraterritorial organisations and bodies U 0 0
Purchases on the domestic territory by non-residents 3 532
Merchanting -3 907
Direct purchases abroad by residents 1 097
CIF/FOB reclassification 155
Total 53 984 40 753
2010; millions EURO
Exports of services (P.62) consist of all services rendered by residents to non-residents. Imports of services (P.72) consist of all services rendered by non-residents to residents. (ESA2010, paragraphs 3.171 and 3.172).As statistics based on international payments were lacking up to 1995, statistics on trade in services were traditionally compiled on the basis of the statistics described in part 3 of this report: annual Structural Business Survey;
businesses reports and accounts;
administrative documents and files (banks, insurance and general government).
Data on international payments are collected by the Luxembourg Central Bank and STATEC. The balance of payments is jointly drawn up by STATEC and the Central Bank. The figures from the balance of payments are used to supplement the direct data when estimating exports and imports of services.
1.5.8 Main approaches taken with respect to exhaustiveness
1.6 The balancing or integration procedure, and main approaches to validation
STATEC is balancing the production and expenditure approaches for calculating GDP in a supply-and-use framework (SUT) in line with the methodology of the ESA 2010 Regulation. The SUT has 270 product and 135 industries. Luxembourg’s SUT is structured according to the principles set out in Chapter 9 of ESA 2010.
Production (basic price) SUPPLY at basic prices Imports (c.i.f.) Trade margins Transport margins Taxes on products Subsidies on products
identical to
Intermediate consumption (purchasers’ prices) USES at purchasers’ prices Households final consumption expenditure (purchasers’ prices)
Figure 1.8 : Transactions in the SUT

The rows of the SUT have a breakdown of 270 products. Output and intermediate consumption are also broken down in a matrix matching products with industries (MAKE and USE matrices) with disaggregation into 135 industries × 270 products.The detailed SUT has a large number of subdivisions of the aggregates shown in Figure 1.8. The are: valuation elements: trade and transport margins, taxes on products, subsidies on products;
conversion of purchasers’ prices to basic prices for uses;
elements relating to the valuation of tax evasion without complicity and breakdown into products and the allocation to industries
elements relating to the conversion from the territory to the national concept of households’ final consumption expenditure;
elements relating to the c.i.f./f.o.b. reclassification of imports;
The annual balancing of the SUT is a purely manual exercise in that there are no automatic balancing rules. The SUBs of the various products are all balanced manually by the operators of the MASTER software.Balancing is “manual” in that the national accountant must decide how to eliminate the difference between resources and uses for each product. There is therefore no predefined rule that is automatically applied by an IT tool. There are two reasons for this: Although 270 products is already a fairly high level of detail, at least in comparison with the data
sources available and, in particular, the human resources available for processing, it is still frequently insufficient to match a single use with a single product;
The very small size of the Luxembourg economy means that individual events can have a significant effect on the various SUBs. It is always necessary to analyse whether a particular outlier might not after all correspond to a clearly-defined economic circumstance, for example the importation of an aircraft, the launch of a satellite or simply the start of production by a new company in an industry that can only be occupied by a very small number of other companies, or even none at all, in view of the small size of the country.
The national accountant must take account of the following factors when making reconciliation choices: The constraints imposed by the very nature of the consistent framework of the supply and use
balances (SUB) of the SUT (accounting identity between resources and uses).
Production (basic price) SUPPLY at basic prices Imports (c.i.f.) Trade margins Transport margins Taxes on products Subsidies on products
identical to
Intermediate consumption (purchasers’ prices) USES at purchasers’ prices Households final consumption expenditure (purchasers’ prices)
Figure 1.9: Structure of the SUT matrix

The accountant’s level of experience: alongside the reconciliation module, a documentation database is maintained containing information both on the decisions/discussions arising during previous balancing operations and on important aspects that have recently affected certain industries.
The quality of the sources of basic data: for certain aggregates, the quality of the breakdown into products is ensured by highly detailed survey nomenclatures (e.g. the combined nomenclature (NC8) with 10 000 external trade products). This may not be the case for others (e.g. the breakdown of inventories into products, or the breakdown of GFCF at the level of intermediate consumption). The reconciliation choice will therefore obviously be made in favour of the less statistically “reliable” element.
Information about the past: since reconciliation is carried out by viewing three years (with the option of viewing several versions for the same year), the national accountant may refer to the reconciliation decisions taken for previous years.
The variables providing assistance: for example, since the Luxembourg economy is very open to outside factors, with regard both to exports and imports, the type of externally-traded goods (consumer goods, intermediate goods, capital goods) can provide valuable information for the purpose of assigning any imbalance to a particular use.
1.7 Overview of the allowances for exhaustiveness
1.7.1 Production approachThis chapter provides an overview of main instruments used for assuring exhaustiveness and of the adjustments done in order to guarantee exhaustiveness of the production approach.
1.7.1.1 Statistical register of businesses and legal persons
The statistical register of businesses and legal persons covers all units and serves as the reference framework for determining the exhaustiveness of the production approach. The register serves as the basis for identifying economic entities and industries and for carrying out surveys on businesses: establishment of the survey sample, estimates of the units not covered by the survey sample (grossing up from the results of the survey) and for non-response to the survey.
1.7.1.2 Rectifications on the basis of tax audits (VAT fraud)
The data reported to the statistical register of STATEC by the “Administration de l’Enregistrement” includes information on declared turnover, administrative tax assessments, tax returns audited and rectifications as a result of audits or on-site inspections.On the basis of the rectifications made by “Administration de l’Enregistrement” after audits to the declared turnover by businesses, average rectification rates (over 3 years) were calculated by activity defined by their NACE code while making a distinction between individual business and companies. These rectification rates are applied to the turnover and output of unaudited businesses when compiling the production accounts by industry and sector (for audited businesses, the rectified figures are already included in the basic data used to calculate the accounts).This adjustment covers non-exhaustiveness type N6 in terms of the N1-N7 taxonomy of the tabular approach to exhaustiveness.
1.7.1.3 Tips
For the activities, hotel, restaurant services, taxis and hairdressing services output, value added and compensation of employees are adjusted by an equal amount in order to take into account tips

which are common for these services. Since no reliable statistical sources exist, rates for tips regarded as reasonable by representatives of the sector have been used.

Table 1.10 Rates applied for tips
Activity Rate for tips
Restaurants 3% of the turnover (excluding resales)
Cafés and bars 5% of the turnover (excluding resales)
Hotels with restaurant 2% of the turnover (excluding resales)
Hotels without restaurant 1% of the turnover (excluding resales)
Taxis 5% of turnover
Hairdressing and other beauty treatment
7% of turnover (excluding resales)
This adjustment covers non-exhaustiveness type N7 in terms of the N1-N7 taxonomy of the tabular approach to exhaustiveness.
1.7.1.4 Undeclared work
Undeclared work is explicitly taken into account for estimating paid domestic services, undeclared private teaching courses and for the construction or extensions to dwellings.This adjustment covers non-exhaustiveness types N1 or N7 in terms of the N1-N7 taxonomy of the tabular approach to exhaustiveness.
1.7.1.5 Representatives of foreign companies
The activity of representatives of foreign companies that have no branch as such within the country is estimated on the basis of the salaries paid by these companies (source: social security statistics).This adjustment covers non-exhaustiveness type N7 in terms of the N1-N7 taxonomy of the tabular approach to exhaustiveness.
1.7.1.6 Illegal activities
Trading of drugs and prostitution are considered as relevant illegal activities and therefore adjustment are done for these types of activity. This adjustment covers non-exhaustiveness type N2 in terms of the N1-N7 taxonomy of the tabular approach to exhaustiveness.

Table 1.11 Exhaustiveness adjustments by method
Method Aggregate Exhaustiveness Adjustments
N1 N2 N3 N4 N5 N6 N7 Total
Illegal Economy Output of goods and services (at basic prices)
0.0 86.9 0.0 0.0 0.0 0.0 0.0 86.9
Intermediate consumption (at purchasers' prices )
0.0 0.5 0.0 0.0 0.0 0.0 0.0 0.5
Gross value added (at basic prices)
0.0 86.5 0.0 0.0 0.0 0.0 0.0 86.5
Tips Output of goods and services (at basic prices)
0.0 0.0 0.0 0.0 0.0 0.0 42.1 42.1
Intermediate consumption (at purchasers' prices )
0.0 0.0 0.0 0.0 0.0 0.0 0.0 0.0
Gross value added (at basic prices)
0.0 0.0 0.0 0.0 0.0 0.0 42.1 42.1
Undeclared Work
Output of goods and services (at basic prices)
145.6 0.0 0.0 0.0 0.0 0.0 0.0 145.6
Intermediate consumption (at purchasers' prices )
61.0 0.0 0.0 0.0 0.0 0.0 0.0 61.0
Gross value added (at basic prices)
84.6 0.0 0.0 0.0 0.0 0.0 0.0 84.6
Vat Fraude with complicity
Output of goods and services (at basic prices)
0.0 0.0 0.0 0.0 0.0 215.9 0.0 215.9

Intermediate consumption (at purchasers' prices )
0.0 0.0 0.0 0.0 0.0 0.0 0.0 0.0
Gross value added (at basic prices)
0.0 0.0 0.0 0.0 0.0 215.9 0.0 215.9
Representatives foreign companies
Output of goods and services (at basic prices)
0.0 0.0 0.0 0.0 0.0 0.0 25.5 25.5
Intermediate consumption (at purchasers' prices )
0.0 0.0 0.0 0.0 0.0 0.0 0.0 0.0
Gross value added (at basic prices)
0.0 0.0 0.0 0.0 0.0 0.0 25.5 25.5
Total Output of goods and services (at basic prices)
145.6 86.9 0.0 0.0 0.0 215.9 67.5 516.0
Intermediate consumption (at purchasers' prices )
61.0 0.5 0.0 0.0 0.0 0.0 0.0 61.5
Gross value added (at basic prices)
84.6 86.5 0.0 0.0 0.0 215.9 67.5 454.5
2010; millions EURO
1.8 The transition from GDP to GNI
Whereas GDP is a measure of the total economic activity taking place on an economic territory, GNI (Gross national income) is not a production concept but an income concept. GNI represents total primary income receivable by resident institutional units. Gross national income (at market prices) equals GDP minus primary income payable by resident institutional units to non-resident institutional units plus primary income receivable by resident institutional units from the rest of the world.For a small country like Luxembourg, the difference between GDP and GNI is not only very large (-27%) but it is negative as GNI is lower than GDP. The main reasons are that firstly Luxembourg pays
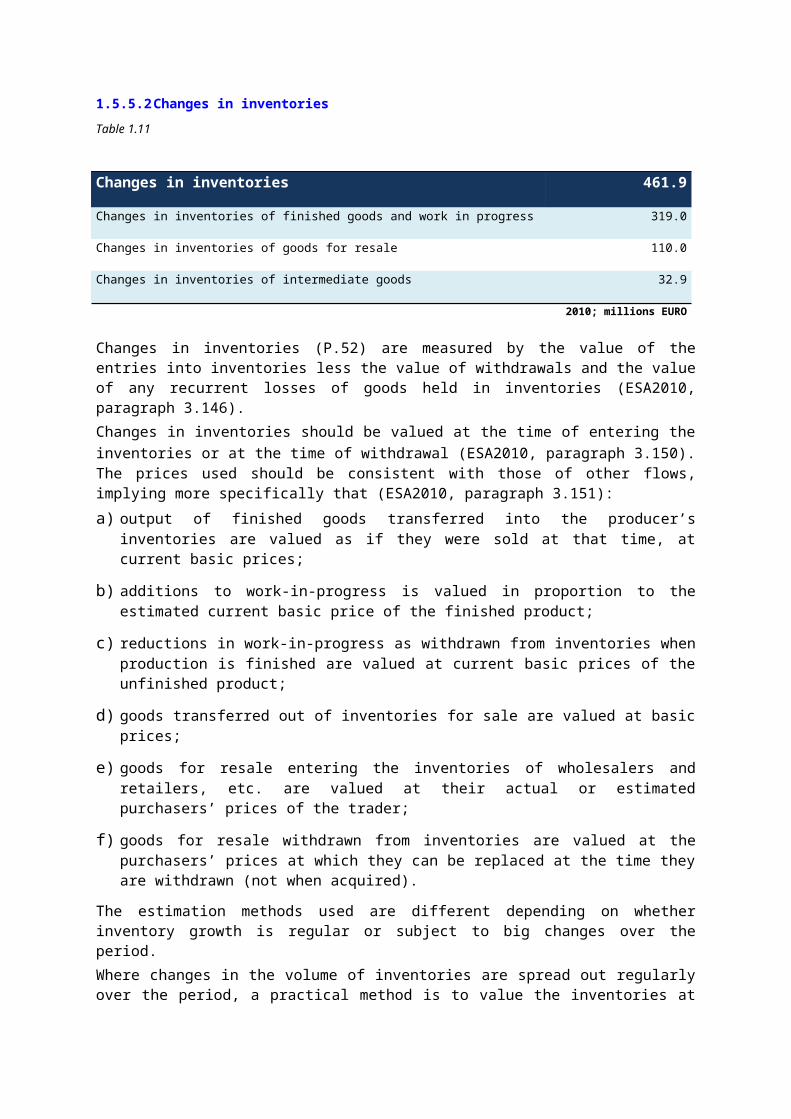
out a substantial amount to cross-border workers living in France, Germany and Belgium and secondly the balance of property income received from and paid to the the rest of the world is negative.
Figure 1.12 Transition from GDP to GNI
Transition from GDP to GNI 2010
Gross domestic product B1*G 39 947
Compensation of employees received from the rest of the world D1 1 212
Compensation of employees paid to the rest of the world D1 7 932
Taxes on production and imports paid to the Institutions of the EU D2 19
Subsidies granted by the Institutions of the EU D3 15
Property income received from the rest of the world D4 86 475
- interest D41 54 721
- distributed income of corporations D42 26 630
- reinvested earnings on FDI D43 18
- other investment income D44+D45 5 107
Property income paid to the rest of the world D4 90 639
- interest D41 15 317
- distributed income of corporations D42 13 739
- reinvested earnings on FDI D43 11 480
- other investment income D44+D45 50 102
Gross national income B5*G 29 059
2010; millions EURO
1.8.1 Compensation of employees (D.1)
Compensation of resident employees is paid by by non-resident employers for employees of the international institutions, of local staff of foreign embassies in Luxembourg and of Luxemburgish cross-border workers working abroad (“frontaliers sortants”).A direct survey is used for the international institutions in Luxembourg (European Investment Bank, European Court of Auditors, European Court of Justice…) and a direct source, the BoP compilers (NCBs) from France, Belgium and Germany, is used for cross-border workers.
Compensation of non-resident employees paid by resident employers includes compensation of non-resident cross-border workers working in Luxembourg, of local staff of Luxembourg embassies

abroad. Compensation is basically valued on the basis of the monthly statistics from the social security institutions’ monthly statistics.The balance between in- and outflows is largely negative (-6.7 million Euro) and reflects the fact that the incoming cross-border (151K) worker largely exceed the outgoing ones (11K).
1.8.2 Taxes on production and imports paid to the Institutions of the EU and subsidies granted
Taxes on production and imports levied by the European Institutions represent import duties, agricultural levies and the co-responsibility tax on milk. The source is the tax administration and the Ministry of Agriculture, “Service d’économie rurale” department.The data on subsidies received from the European Institutions European Agricultural Guarantee Fund are taken from the Institutions’ balance of payments and the accounts for the State budget and accounts.
1.8.3 Property income (D.4)
For the ESA 2010 benchmark revision in 2014, STATEC achieved a long pending project regarding the improvement of the compilation of national accounts aggregates. The ambition was to keep detailed micro data available as long as possible in the production process. For the GDP-GNI transition items, all sources have been made available at micro data level (FDI survey, balance of payments, administrative sources…). The obvious advantage of the new method is that it is now easier to explain the final results as it is possible to go back to the micro data. In a small country like Luxembourg, with an open economy and an important financial centre, the gross property income flows, from and to the rest of the world, are huge when comparing them to GDP (216% resp. 227%).
Interest (D.41)Interest flows to and from the rest of the world are largely valued on the basis of business accounting (Structural Business Surveys, accounts of financial institutions and insurance companies, accounts of mutual funds) using accrual accounting. As a result, no adjustment for the accounting method is needed. Interest flows for general government are taken from the general government accounts.
Dividends (D.421)In principle the same sources of statistics are used to value dividend flows as for interest flows.
Withdrawals from the income of quasi-corporations (D.422)In principle the same sources of statistics are used to value Withdrawals from the income of quasi-corporations as for interest flows. Furthermore, information is available of the activities of branches abroad of resident financial corporations.
Reinvested earnings on foreign direct investment (D.43)Reinvested earnings on foreign direct investment (FDI) from abroad are valued via dedicated annual surveys (banks, insurance companies, non financial corporations). These survey study both stocks and financial flows related to direct investment from and destined for abroad and the related income streams of companies receiving or providing FDI. With regard to profits from foreign direct
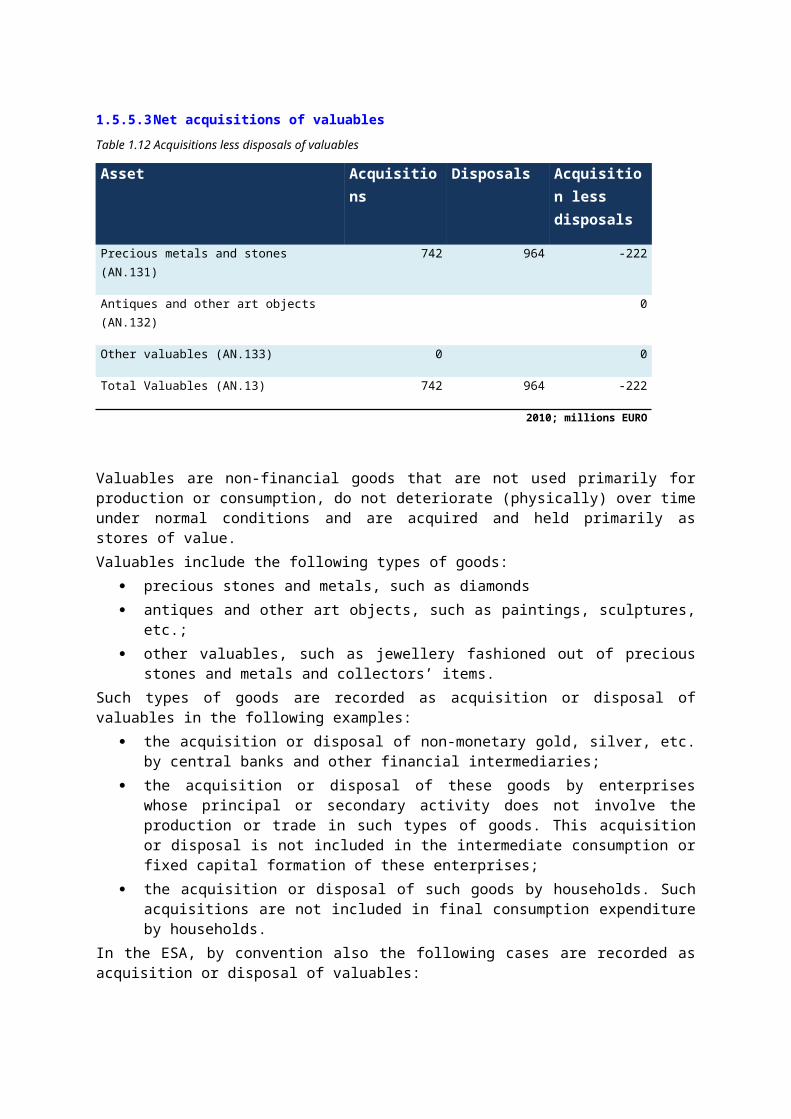
investment due to the rest of the world, data from the direct investment survey are adjusted and supplemented by the annual Structural Business Survey.
Other investment income (D44)The source for ‘Property income attributed to insurance policy holders’ (D.441) is essentially the prudential authority for insurances, the Commissariat aux Assurances (CAA).‘Investment income payable on pension entitlements’ (D442) is taken from the prudential reporting of the CAA and the CSSF depending on the type of pension fund.The sources for ‘Investment income attributable to collective investment fund shareholders’ (D443) are the CSSF and the BCL.
1.9 Main classifications used
Luxembourg’s national accounts use the standard nomenclatures of the European Union: NACE for activites, CPA for products, COICOP for household final consumption and COFOG for government consumption.
1.10 Main data sources used
1.10.1 Production approachStatistical surveys and other data sources used for the production approach are:
STATEC's Statistical Register of businesses and legal persons which serves as the basis for identifying economic units and as sampling base for every statistical business survey.
Data from Structural Business Survey which is the main source for units from industry, construction and distributive trades and services.
Annual VAT declarations collected by the Administration de l’Enregistrement (Eskort) Economic Accounts for Agriculture (EAA) State Accounts and Budget for central government Municipality budgets and accounts for local government Accounts of social security funds Business accounts of units considered to be part of the general government
For financial service activities, the following sources are used: Statistical reporting from credit institutions containing balance sheet and detailed profit and
loss account data on a quarterly basis (CSSF and BCL). Interest rates applied by Luxembourg credit institutions from Banque Centrale du
Luxembourg (Central Bank). International Financial Statistics (ISSN 0020-6725 ) from the International Monetary Fund
(IMF) containing data on money market rates, lending rates, deposit rates, treasury bill rates, Government bond yields.
For mutual funds, the following sources are used: Data collected by the CSSF about net assets, share issues, redemptions, revenue from
undertakings for collective investment (UCI). Annual reporting from mutual funds to CSSF containing data about net assets, data from the
balance sheet and the profit and loss account, data about issuances and redemptions.

Annual reporting from mutual funds to BCL containing data about net assets, data from the balance sheet and the profit and loss account, data about issuances and redemptions
For risk capital investment companies (Société d'investissement en capital à risque (SICAR)), the bi-annual reporting to CSSF contains balance sheet and profit and loss account data.For financial vehicle corporations engaged in securitisation transactions, the annual reporting to CSSF contains balance sheet and profit and loss account data.For management companies of mutual funds, quarterly legal reporting to CSSF contains data about the financial situation, data from the profit and loss account, a table regarding the management of UCIs, data about other activities and staff figures.For Professionals of the financial sector (PFS), the legal reporting of investment firms, specialised PFS and support PFS to CSSF contains data from the balance sheet and the profit and loss account, off-balance sheet data and figures about staff.For insurance companies, the annual reporting by Luxembourgish direct insurers to Commissariat aux Assurances (CAA) contains data from the balance sheet and the profit and loss account (EU directive), data from the restructured profit and loss account (reporting CAA), data from the technical account by class of insurance and by country, data about investment income and expenses and data about overheads.For reinsurance companies, the annual reporting to CAA contains data from balance sheet and profit and loss account, an annex on overheads, figures on the geographical origin of written premiums and ceded premiums.Legal annual reporting of pension funds to CSSF contains data from the balance sheet and profit and loss account, figures about investments broken down into euro and non-euro components.
Further sources for the production approach are: Data on employment and wages from mandatory social security Research & Development survey of the Business Entreprise sector Research & Development survey of the Government sector and the Higher Education Sector
1.10.2 Expenditure approach
Statistical surveys and other data sources used for the expenditure approach are: for Household final consumption expenditure
o Household Budget Surveyo General census of population, housing and buildings in the Grand Duchyo Annual fiscal census providing information about rents for accommodations
for general government final consumption expenditureo State Accounts and Budget for central governmento Municipality budgets and accounts for local governmento Accounts of social security fundso Business accounts of units considered to be part of the general government
for Gross fixed capital formation

o Survey about Investment as part of the yearly structural business statistics survey in non-financial business sector and as an specific survey in the finance and health/social care sectors.
o Statistics on finished buildings for CFCF in dwellings and other buildingso State Accounts and Budget for central governmento Municipality budgets and accounts for local governmento Accounts of social security fundso Business accounts of units considered to be part of the general governmento Research & Development survey of the Business Entreprise sector o Research & Development survey of the Government sector and Higher Education
Sector
for Changes in Inventorieso Structural Business Survey
for exports and Imports of goods and serviceso Intrastat surveyo Customs statisticso Balance of paymentso Structural Business Survey
1.10.3 Statistical surveys and other data sources used for the income approachThe income approach is not an independent evaluation approach. The income approach is directly deducted from the production approach and does not constitute an independent approach for evaluating GDP. It relies therefore on the same sources than the other approaches, even if some data has some specific usage within the income approach, especially the sources about compensation of employees, taxes on production and imports and subsidies on production.
1.10.4 Statistical surveys and other sources used for the transition from GDP to GNIFor the transition of GDP to GNI, STATEC uses data gathered from
The survey of foreign direct investment which provides data about the identity of foreign investors and of affiliated companies and shareholdings, equity, net result for the financial year and paid/received dividends.
The Survey of foreign direct investment of credit institutions, executed by the Banque Centrale du Luxembourg, which provides data about the identity of foreign investors and of affiliated companies and shareholdings, equity, net result for the financial year and paid/received dividends.
Another major source for the transition from GDP to GNI is the Balance of Payments containing data about the relationships between resident units and the rest of the world.