overview of the texas economy - employment and … urrent state economic and demographic trends...
TRANSCRIPT
Employment
Current state economic and demographic trends
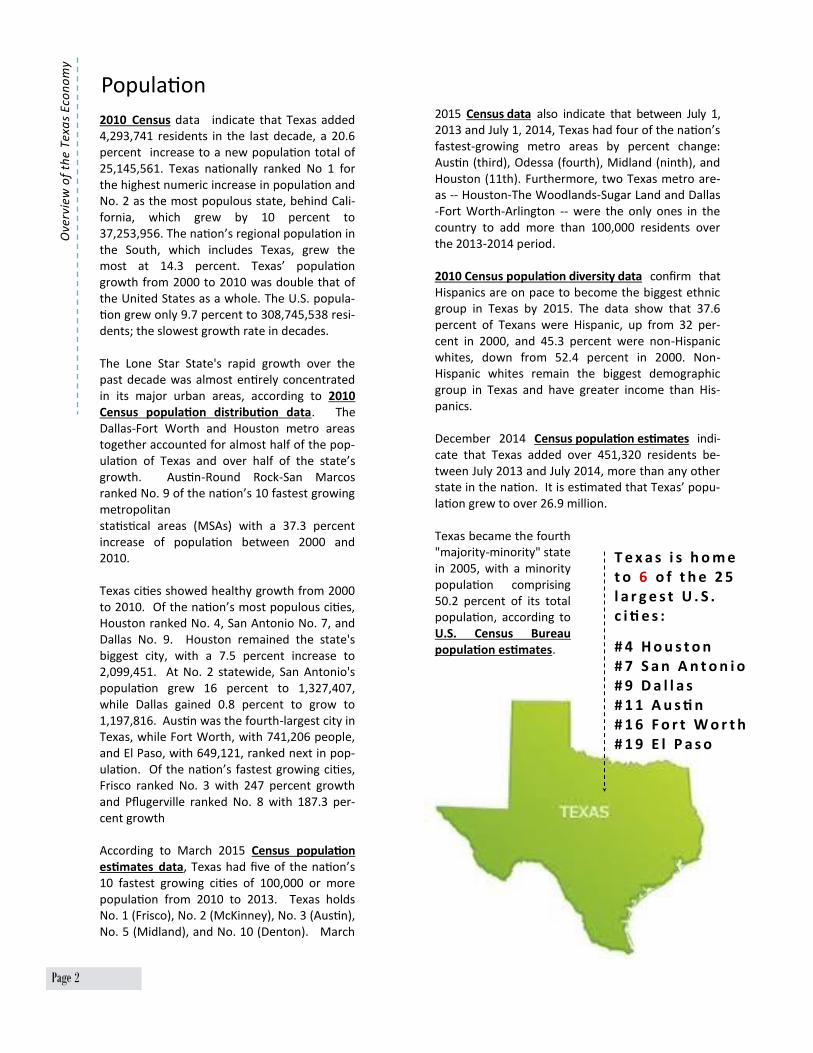
Texas employment increased by 457,900 seasonally adjusted total nonfarm jobs in 2014, representing a 4 percent increase from 2013, according to the Texas Workforce Commission. Furthermore, Texas added more jobs than any other state in 2014, according to data published by the Bu-reau of Labor Statistics (BLS). These employment figures indicate the Lone Star State led the nation in job growth for the fifth consecutive year.
Texas’ unemployment rate remained below the na-tional unemployment rate in 2014, according to the Bureau of Labor Statistics. Both the nation and state of Texas enjoyed unemployment decreases in 2014. For further current employment information, the state’s monthly updates are charted and tracked at the Federal Reserve Bank of Dallas, the Texas Work-force Commission, the Texas Comptroller of Public Accounts, as well as the Bureau of Labor Statistics.
Continued on next page
Texas Job Growth Sets The Pace In 2014, (December 2013—December 2014), Texas employment grew the most of the 10 fastest growing states.
Overview of the Texas Economy
Source: BLS
2010 Census data indicate that Texas added 4,293,741 residents in the last decade, a 20.6 percent increase to a new population total of 25,145,561. Texas nationally ranked No 1 for the highest numeric increase in population and No. 2 as the most populous state, behind Cali-fornia, which grew by 10 percent to 37,253,956. The nation’s regional population in the South, which includes Texas, grew the most at 14.3 percent. Texas’ population growth from 2000 to 2010 was double that of the United States as a whole. The U.S. popula-tion grew only 9.7 percent to 308,745,538 resi-dents; the slowest growth rate in decades. The Lone Star State's rapid growth over the past decade was almost entirely concentrated in its major urban areas, according to 2010 Census population distribution data. The Dallas-Fort Worth and Houston metro areas together accounted for almost half of the pop-ulation of Texas and over half of the state’s growth. Austin-Round Rock-San Marcos ranked No. 9 of the nation’s 10 fastest growing metropolitan statistical areas (MSAs) with a 37.3 percent increase of population between 2000 and 2010. Texas cities showed healthy growth from 2000 to 2010. Of the nation’s most populous cities, Houston ranked No. 4, San Antonio No. 7, and Dallas No. 9. Houston remained the state's biggest city, with a 7.5 percent increase to 2,099,451. At No. 2 statewide, San Antonio's population grew 16 percent to 1,327,407, while Dallas gained 0.8 percent to grow to 1,197,816. Austin was the fourth-largest city in Texas, while Fort Worth, with 741,206 people, and El Paso, with 649,121, ranked next in pop-ulation. Of the nation’s fastest growing cities, Frisco ranked No. 3 with 247 percent growth and Pflugerville ranked No. 8 with 187.3 per-cent growth According to March 2015 Census population estimates data, Texas had five of the nation’s 10 fastest growing cities of 100,000 or more population from 2010 to 2013. Texas holds No. 1 (Frisco), No. 2 (McKinney), No. 3 (Austin), No. 5 (Midland), and No. 10 (Denton). March
2015 Census data also indicate that between July 1, 2013 and July 1, 2014, Texas had four of the nation’s fastest-growing metro areas by percent change: Austin (third), Odessa (fourth), Midland (ninth), and Houston (11th). Furthermore, two Texas metro are-as -- Houston-The Woodlands-Sugar Land and Dallas-Fort Worth-Arlington -- were the only ones in the country to add more than 100,000 residents over the 2013-2014 period. 2010 Census population diversity data confirm that Hispanics are on pace to become the biggest ethnic group in Texas by 2015. The data show that 37.6 percent of Texans were Hispanic, up from 32 per-cent in 2000, and 45.3 percent were non-Hispanic whites, down from 52.4 percent in 2000. Non-Hispanic whites remain the biggest demographic group in Texas and have greater income than His-panics. December 2014 Census population estimates indi-cate that Texas added over 451,320 residents be-tween July 2013 and July 2014, more than any other state in the nation. It is estimated that Texas’ popu-lation grew to over 26.9 million. Texas became the fourth "majority-minority" state in 2005, with a minority population comprising 50.2 percent of its total population, according to U.S. Census Bureau population estimates.
Ove
rvie
w o
f th
e T
exa
s E
con
om
y
Population
Page 2
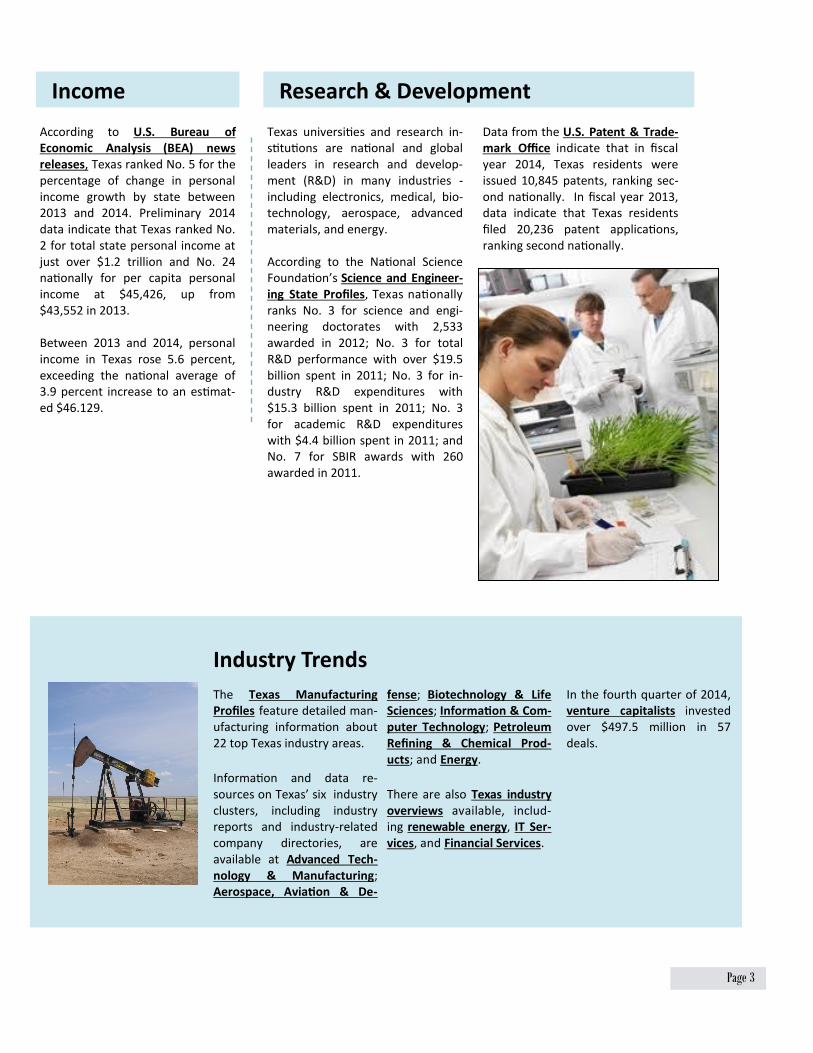
T e x a s i s h o m e t o 6 o f t h e 2 5 l a r g e s t U . S . c i ti e s :
# 4 H o u s t o n # 7 S a n A n t o n i o # 9 D a l l a s # 1 1 A u s ti n # 1 6 F o r t W o r t h # 1 9 E l P a s o
Page 3
fense; Biotechnology & Life Sciences; Information & Com-puter Technology; Petroleum Refining & Chemical Prod-ucts; and Energy.
There are also Texas industry overviews available, includ-ing renewable energy, IT Ser-vices, and Financial Services.
The Texas Manufacturing Profiles feature detailed man-ufacturing information about 22 top Texas industry areas.
Information and data re-sources on Texas’ six industry clusters, including industry reports and industry-related company directories, are available at Advanced Tech-nology & Manufacturing; Aerospace, Aviation & De-
In the fourth quarter of 2014, venture capitalists invested over $497.5 million in 57 deals.
Industry Trends
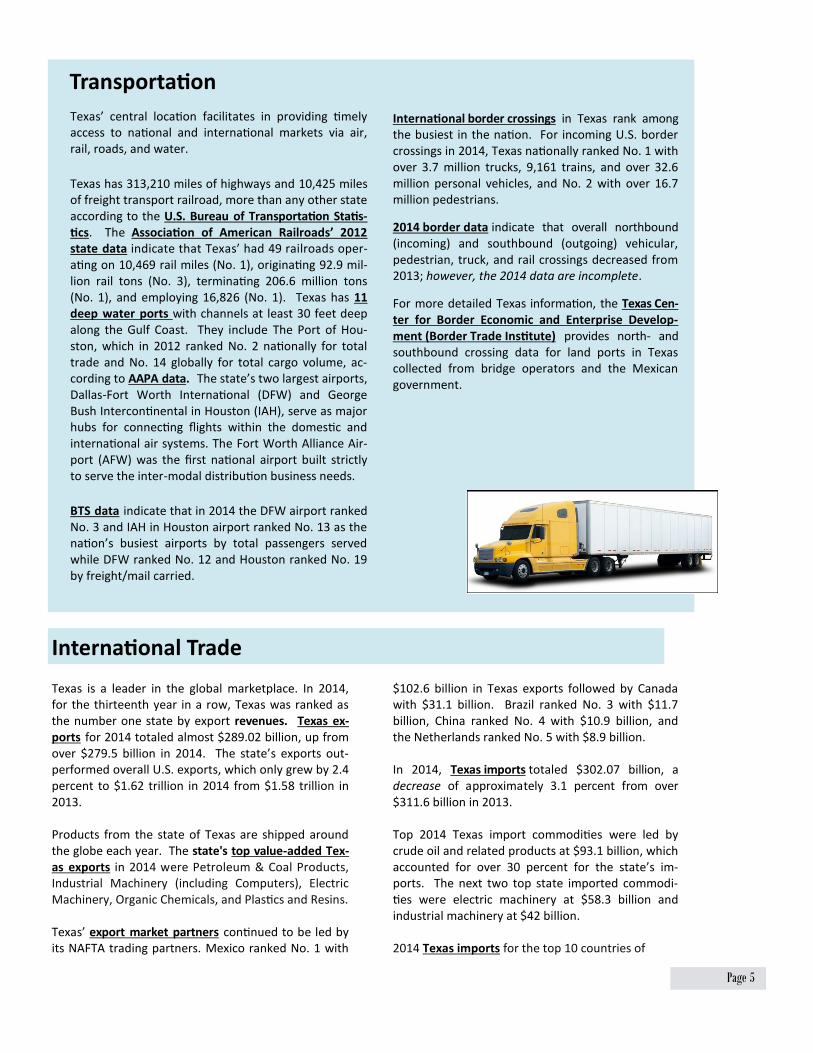
Texas universities and research in-stitutions are national and global leaders in research and develop-ment (R&D) in many industries - including electronics, medical, bio-technology, aerospace, advanced materials, and energy. According to the National Science Foundation’s Science and Engineer-ing State Profiles, Texas nationally ranks No. 3 for science and engi-neering doctorates with 2,533 awarded in 2012; No. 3 for total R&D performance with over $19.5 billion spent in 2011; No. 3 for in-dustry R&D expenditures with $15.3 billion spent in 2011; No. 3 for academic R&D expenditures with $4.4 billion spent in 2011; and No. 7 for SBIR awards with 260 awarded in 2011.
According to U.S. Bureau of Economic Analysis (BEA) news releases, Texas ranked No. 5 for the percentage of change in personal income growth by state between 2013 and 2014. Preliminary 2014 data indicate that Texas ranked No. 2 for total state personal income at just over $1.2 trillion and No. 24 nationally for per capita personal income at $45,426, up from $43,552 in 2013. Between 2013 and 2014, personal income in Texas rose 5.6 percent, exceeding the national average of 3.9 percent increase to an estimat-ed $46.129.
Income Research & Development
Data from the U.S. Patent & Trade-mark Office indicate that in fiscal year 2014, Texas residents were issued 10,845 patents, ranking sec-ond nationally. In fiscal year 2013, data indicate that Texas residents filed 20,236 patent applications, ranking second nationally.

Real Estate
Page 4
Ove
rvie
w o
f th
e T
exa
s E
con
om
y
Travel is an important industry in Texas, and the state is a favorite destination for both domestic and international visitors. Tourism reve-nues provide significant economic benefits for the Texas economy. In 2013, total direct travel spending in Texas was over $67 billion which directly supported 599,000 jobs and generated $4.7 billion in state and local taxes. Texas had an estimated 233.5 million domestic visitors and 8.2 million international visitors at tourism destinations in 2013. The gross domestic prod-uct (GDP) of the Texas travel industry was $26.8 billion in 2012, the latest data available. Only oil and gas production and related manufacturing
has a significantly greater GDP in Texas. Information on the economic impact of travel in Texas, travel facts, hotel reports, international travel reports, and much more are available. Texas tourist information is also accessible online, including free travel guides, state maps, and emailed newsletters; trip planners; podcasts and videos; lodging; activi-ty and events; cities and regions; and even customized itineraries.
The Texas gross state product (GSP) for Calendar Year 2014 was estimated at $1,530.8 billion in cur-rent dollars and continues to show diversification in goods and ser-vices, according to the Texas Comp-troller of Public Accounts (CPA). The CPA table shows forecasts through 2041 and go back to 1990. Also see the CPA’s Key Texas Eco-nomic Indicators for related data. If Texas were a nation, its economy would rank as the 12th largest in the world by Gross Domestic Product (GDP), according to the Texas Comptroller’s 2013 estimates.
Tourism
Texas has weathered the national real estate crunch without signifi-cant damage to property values, while sales and construction activity have slowed. Despite its continuing resiliency, Texas is not immune from the national real estate crunch. The most recent month’s high level Texas housing review with statistics on housing sales, mortgage foreclo-sures, and building permits is availa-ble in the Texas Comptroller’s Eco-nomic Outlook. In 2013, Texas MSAs saw a 11 per-cent gain in home sales, according to the Real Estate Center (REC) at Texas A&M University’s Home Sales Data area. 275,829 homes were sold statewide in 2013, 16 percent more than in 2012. On average,
there were 4 months inventory on Texas homes in 2013, a –29 percent change from 2012. The median price of a Texas home rose 9 percent from 2012 to $172,300 and in 2013. For detailed quarterly updates on the Texas housing market, see the Texas Association of REALTORS. The Texas A&M REC Building Permit Activity website provides detailed infor-mation about Texas county, MSA, single family, and multi-family permits. Texas A&M’s REC Current Trends area provides infor-mation on home sales, listings, inventories, and median and aver-
age prices. The Texas A&M REC’s Texas Housing Activity for Areas Reports provide detailed information about the Texas MSAs, selected counties, Texas as a whole, and other state Multiple Listing Service (MLS) areas.
Gross State Product
Page 5
Transportation
Texas’ central location facilitates in providing timely access to national and international markets via air, rail, roads, and water.
Texas has 313,210 miles of highways and 10,425 miles of freight transport railroad, more than any other state according to the U.S. Bureau of Transportation Statis-tics. The Association of American Railroads’ 2012 state data indicate that Texas’ had 49 railroads oper-ating on 10,469 rail miles (No. 1), originating 92.9 mil-lion rail tons (No. 3), terminating 206.6 million tons (No. 1), and employing 16,826 (No. 1). Texas has 11 deep water ports with channels at least 30 feet deep along the Gulf Coast. They include The Port of Hou-ston, which in 2012 ranked No. 2 nationally for total trade and No. 14 globally for total cargo volume, ac-cording to AAPA data. The state’s two largest airports, Dallas-Fort Worth International (DFW) and George Bush Intercontinental in Houston (IAH), serve as major hubs for connecting flights within the domestic and international air systems. The Fort Worth Alliance Air-port (AFW) was the first national airport built strictly to serve the inter-modal distribution business needs.
BTS data indicate that in 2014 the DFW airport ranked No. 3 and IAH in Houston airport ranked No. 13 as the nation’s busiest airports by total passengers served while DFW ranked No. 12 and Houston ranked No. 19 by freight/mail carried.
International border crossings in Texas rank among the busiest in the nation. For incoming U.S. border crossings in 2014, Texas nationally ranked No. 1 with over 3.7 million trucks, 9,161 trains, and over 32.6 million personal vehicles, and No. 2 with over 16.7 million pedestrians.
2014 border data indicate that overall northbound (incoming) and southbound (outgoing) vehicular, pedestrian, truck, and rail crossings decreased from 2013; however, the 2014 data are incomplete.
For more detailed Texas information, the Texas Cen-ter for Border Economic and Enterprise Develop-ment (Border Trade Institute) provides north- and southbound crossing data for land ports in Texas collected from bridge operators and the Mexican government.
Texas is a leader in the global marketplace. In 2014, for the thirteenth year in a row, Texas was ranked as the number one state by export revenues. Texas ex-ports for 2014 totaled almost $289.02 billion, up from over $279.5 billion in 2014. The state’s exports out-performed overall U.S. exports, which only grew by 2.4 percent to $1.62 trillion in 2014 from $1.58 trillion in 2013. Products from the state of Texas are shipped around the globe each year. The state's top value-added Tex-as exports in 2014 were Petroleum & Coal Products, Industrial Machinery (including Computers), Electric Machinery, Organic Chemicals, and Plastics and Resins. Texas’ export market partners continued to be led by its NAFTA trading partners. Mexico ranked No. 1 with
$102.6 billion in Texas exports followed by Canada with $31.1 billion. Brazil ranked No. 3 with $11.7 billion, China ranked No. 4 with $10.9 billion, and the Netherlands ranked No. 5 with $8.9 billion. In 2014, Texas imports totaled $302.07 billion, a decrease of approximately 3.1 percent from over $311.6 billion in 2013. Top 2014 Texas import commodities were led by crude oil and related products at $93.1 billion, which accounted for over 30 percent for the state’s im-ports. The next two top state imported commodi-ties were electric machinery at $58.3 billion and industrial machinery at $42 billion. 2014 Texas imports for the top 10 countries of
International Trade
Page 6
Overview of the Texas Economy Updated: March 2015
Office of the Governor
Economic Development & Tourism www.TexasWideOpenForBusiness.com
origin accounted for over $226 billion, representing almost 75 percent of the state’s imports. NAFTA trading partner, Mexico, was the top country of origin for Texas imports with over $90.1 billion or over 29 percent of Texas imports. China (Mainland) ranked No. 2 for Texas imports ($45.4 billion), followed by Saudi Arabia ($19 billion). NAFTA trading partner, Canada, ranked as No. 4 for Texas imports at $17.4 billion, representing an almost 19 percent increase from 2013.
Texas ranked No. 1 nationally for export-related jobs in 2013 with over 1.1 million jobs. The na-tion as a whole had 7 million export-related jobs in 2013.
Texas is a top-ranked destination for foreign direct investment (FDI). Texas ranks No. 2 nationally for
the number of jobs at U.S. subsidiaries of global companies and the number of manu-facturing industry jobs at U.S. subsidiaries, according to the Organ-ization for Internation-al Investment. The Texas Trade & FDI Snapshot and Foreign Direct Investment in Texas report provide further information on this area. FDI data are also available from the U.S. Bureau of Economic Analysis.
International Trade continued from Page 5 O
verv
iew
of
the
Te
xas
Eco
no
my
Labor and Management Diversity
2007 Survey of Business Owners data, the latest available, indicate there were 2,164,852 total Texas firms, up from 1,734,648 in 2002. Of these, 723,057 were mi-nority-owned firms, representing 12.6 percent of the nation’s minori-ty-owned firms. The value of sales and receipts of all firms in Texas reached $2.53 trillion in 2007, up from $1.81 trillion in 2002. Texas firms employed 8,712,639 in 2007, up from 8,059,889 in 2002. Major breakouts follow.
In 2007, there were 610,162 Wom-en-owned firms in Texas employ-ing 592,308, up 23.1 percent from 469,049 firms in 2002. Sales and receipts increased from $66.7 bil-lion in 2002 to $97.09 billion in 2007. Women-owned firms ac-counted for 28.2 percent of all Tex-as firms. Texas ranked second na-tionally for the number of firms and sales and receipts of women-owned firms.
In 2007, there were 447,566 His-panic-owned firms in Texas em-ploying 397,900, up 28.6 percent
from 319,340 firms in 2002. Re-ceipts rose from $42.21 billion in 2002 to $61.99 billion in 2007. Tex-as ranked third nationally for the number and receipts of Hispanic-owned firms. Texas had 356,785 Mexican-owned firms (34.4 per-cent), with receipts of $48.98 bil-lion. The Lone Star State ranked second nationally for the number and receipts of Mexican-owned firms. In 2007, there were 154,281 Black-owned firms in Texas employing 73,330, up 42.4 percent from 88,769 firms in 2002. Sales and receipts increased from $6.69 bil-lion in 2002 to $9.28 billion in 2007. Texas ranked fourth national-ly for sales and receipts and for the number of firms of Black-owned firms. In 2007, there were 19,057 Native American- and Alaska Native-owned firms in Texas, up 17.6 per-cent from 16,204 firms in 2002. Sales and receipts rose 17.4 from $3.13 billion in 2002 to $3.68 billion in 2007. Texas ranked third nationally for the number of firms
and receipts of Native American- and Alaska Native-owned owned firms. In 2007, there were 1,197 Native Hawaiian and other Pacific Islander-owned firms in Texas, down 13.9 percent from 1,391 firms in 2002. Sales and receipts increased 382.5 percent from $78.2 million in 2002 to $377.6 million in 2007. Texas ranked sixth nationally for the num-ber of firms and third nationally for sales and receipts of Pacific Islander-owned firms. In 2007, there were 114,593 Asian-owned firms in Texas, up 47.2 per-cent from 77,834 firms in 2002. Sales and receipts rose 104.7 percent from $20.72 billion in 2002 to $42.44 billion in 2007. Texas ranked third nationally for the num-ber of firms and sales and receipts of Asian-owned firms.