overview of the trec 2009 legal track · overview of the trec 2009 legal track bruce hedin,...
TRANSCRIPT

Overview of the TREC 2009 Legal Track
Bruce Hedin, [email protected], 71 Stevenson St., San Francisco, CA 94105, USA
Stephen Tomlinson, [email protected] Text Corporation, Ottawa, Ontario, Canada
Jason R. Baron, [email protected] Archives and Records Administration
Office of the General Counsel, Suite 3110, College Park, MD 20740, USA
Douglas W. Oard, [email protected] of Information Studies and Institute for Advanced Computer Studies
University of Maryland, College Park, MD 20742, USA
Abstract
TREC 2009 was the fourth year of the Legal Track, which focuses on evaluation of search technologyfor “discovery” (i.e., responsive review) of electronically stored information in litigation and regulatorysettings. The track included two tasks: an Interactive task (in which real users could iteratively refinetheir queries and/or engage in multi-pass relevance feedback) and a Batch task (two-pass search in acontrolled setting with some relevant and nonrelevant documents manually marked after the first pass).This paper describes the design of the two tasks and presents the results.
1 Introduction
Until relatively recently, the principal uses of information retrieval techniques in law had focused on pro-viding access to legislation, regulations, and judicial decisions. The goal of the Legal Track at the TextRetrieval Conference (TREC), by contrast, has been to assess the ability of information retrieval methodsand technologies to meet the needs of the legal community for tools and methods capable of helping with theretrieval of electronic business records, an issue of increasing importance given the vast amount of informa-tion stored in electronic form to which access is increasingly desired in the context of current litigation. Inthis context, the problem is often referred to as “e-discovery,” referring not to the broad goal of discoveringnew things, but rather to the task of producing specific records in response to a “discovery request.”
In the first year (2006), 6 teams participated in the Legal Track’s single (Ad Hoc retrieval) task [9]. In2007, participation grew to 13 teams and two additional tasks were introduced (Interactive and RelevanceFeedback) [15]. In 2008, 16 teams participated [13]; this year there were 15 participating teams. A notabletrend has been the increasing number of commercial enterprises fielding teams; rising from 1 in each of thefirst two years to 3 in 2009 and now to 10 in 2009.
The basic design of the track is similar to other TREC tracks, with document collections, topic sets,relevance judgments, and evaluation measures that are shared by participants to create test collections withenduring value, to report results against which future work can be compared, and to foster the developmentof a research community that is well prepared to continue that work. The track is distinguished from others
at TREC by the combination of a focus on business records as documents, representative discovery requestsas topics, relevance judgments by legal professionals and law students, evaluation measures for retrieval ofsets of documents, and (in one task) modeling an interactive search process. The track’s two test collections,built from scanned documents and from email, will also be of interest more generally to researchers interestedin conducting information retrieval experiments with those document types.
This has been a year of transition for the track, completing our work with scanned documents andbeginning the process of developing an email test collection. The 2009 track therefore included two tasks,a Batch task using scanned documents that served to enrich the available relevance judgments for somepreviously developed topics, and an Interactive task that developed an initial set of relevance judgments forthe newly developed email test collection.
The remainder of this paper is organized as follows. Section 2 describes the 2009 Interactive task; Section3 describes the 2009 Batch task; Section 4 provides some follow-up discussion of assessor consistency studiesfrom 2008 and 2007; and Section 5 concludes the paper with a few remarks on our present plans for 2010.
2 Interactive Task
In 2008, the Legal Track, seeking to develop an exercise that modeled more completely and accurately thetask of reviewing documents for responsiveness to a request for production in civil litigation, introduced aredesigned Interactive task (see the 2008 Interactive Task Guidelines [7]). The task saw participation fromfour teams (two academic and two commercial) and produced interesting results, both with regard to theeffectiveness of the approaches evaluated and with regard to the evaluation design itself (see Overview of theTREC 2008 Legal Track [13]).
In 2009, the Legal Track again featured the Interactive task, this time with a new test collection and witha few minor modifications to the task design. The 2009 exercise saw participation from eleven teams (threeacademic and eight commercial). In this section, we summarize the results from the 2009 Interactive task.More specifically, we (i) briefly review the task design; (ii) summarize the specific features that defined the2009 exercise; (iii) present the results obtained by the 2009 participants; (iv) expand on a few points thatmerit further analysis; and (v) summarize key lessons from the 2009 Interactive task.
2.1 Task Design
The Legal Track’s Interactive task models the conditions and objectives of a review for responsiveness; thatis to say, the task models the conditions and objectives of a search for documents that are responsive to arequest for production that has been served during the discovery phase of a civil lawsuit. A full discussion ofthe circumstance modeled and of the general design of the exercise can be found in the 2008 task guidelines [7].For purposes of the current overview, we briefly summarize the key features of the task.
• Complaint and Topics. Context for the Interactive task is provided by a mock complaint that setsforth the legal and factual basis for the hypothetical lawsuit that motivates the discovery requestsat the heart of the exercise. Associated with the complaint are document requests that specify thecategories of documents which must be located and produced. For purposes of the Interactive task,each of these document requests serves as a separate topic. The goal of a team participating in a giventopic is to retrieve all, and only, documents relevant to that topic (as defined by the “Topic Authority;”see below).
• The Topic Authority. A key role in the task is played by the “Topic Authority.” The TopicAuthority plays the role of a senior attorney who is charged with overseeing a client’s response to arequest for production and who, in that capacity, must certify to the court that their client’s responseto the request is complete and correct (commensurate with a reasonable and good-faith effort). Inkeeping with that role, it is the Topic Authority who, taking into account considerations of genuinesubject-matter relevance as well as pragmatic considerations of legal strategy and tactics, holds ultimateresponsibility for deciding what is and is not relevant to a target topic (or, in real-world terms, what
is and is not responsive to a document request). The Topic Authority’s role, then, is to be the sourcefor the authoritative conception of responsiveness that each participating team, in the role of a hiredcohort of manual reviewers or of a vendor of document-retrieval services, will be asked to replicateacross the full document collection. Each topic has a single Topic Authority, and each Topic Authorityhas responsibility for a single topic.
• Interaction with the Topic Authority. If it is the Topic Authority who defines the target (i.e.,who determines what should and should not be considered relevant to a topic), it is essential thatprovision be made for teams to be able to interact with the Topic Authority in order to gain a betterunderstanding of the Topic Authority’s conception of relevance. In the Interactive task, this provisiontakes the following form. Each team can ask, for each topic for which it plans to submit results, for upto 10 hours of a Topic Authority’s time for purposes of clarifying a topic. A team can call upon a TopicAuthority at any point in the exercise, from the kickoff of the task to the deadline for the submissionof results. How a team makes use of the Topic Authority’s time is largely unrestricted: a team can askthe Topic Authority to pass judgment on exemplar documents; a team can submit questions to theTopic Authority by email; a team can arrange for conference calls to discuss aspects of the topic. Oneconstraint that is placed on communication between the teams and their designated Topic Authoritiesis introduced in order to minimize the sharing of information developed by one team with another;while the Topic Authorities are instructed to be free in sharing the information they have about theirtopics, they are asked to avoid volunteering to one team specific information that was developed onlyin the course of interaction with another team.
• Participant submissions. Each team’s final deliverable is a binary classification of the full populationfor relevance to each target topic in which it has chosen to participate.
• Effectiveness Metrics. Given the nature of the submissions (sets of documents identified as relevantto a topic), we look to set-based metrics to gauge effectiveness. In the Interactive task, the metricsused are recall, precision, and, as a summary measure of effectiveness, F1.
• Sampling and Estimation. In order to obtain estimates of effectiveness scores, we use stratifiedsampling and a two-stage sample assessment protocol. Further specifics are as follows.
– Sampling. The sets of documents submitted by the participants in a topic allow for a straight-forward submission-based stratification of the document collection: one stratum contains thedocuments all participants submitted as relevant, another stratum contains the documents noparticipant submitted as relevant, and other strata will be defined for each of the other possiblesubmission combinations. If, for example, there are 5 teams that participated in a topic, the col-lection will be partitioned into 25 = 32 strata. In creating samples, strata are represented largelyin keeping with their full-population proportions. In order to ensure that a sufficient number ofdocuments are drawn from all strata, however, some small strata may be over-represented, andsome large strata under-represented, relative to their full-population proportions. Selection withina stratum is simple random selection without replacement.
– First-Pass Assessment. For purposes of assessment, the contents of each sample is randomlyassigned to “bins” of approximately 500 documents and these bins are then distributed to teamsof manual assessors. Each assessor, equipped with detailed assessment guidelines and providedwith access to the Topic Authority, assesses each document in his or her bin for relevance to hisor her assigned topic.
– Appeal and Adjudication. No matter how rigorous the quality control regimen of the first-passassessment, it is to be expected that some errors will remain in the sets of assessments that are theoutput of the first-pass review. As a corrective measure, the Interactive task features an additionalappeal/adjudication phase, whereby teams are given the opportunity to review the results ofthe first-pass assessment and appeal, to the Topic Authority, any assessments they believe areincorrect. The Topic Authority then renders a final judgment on all appealed assessments.

– Estimation. Once all appeals have been adjudicated, we are in a position to obtain estimatesboth of the full-population yield of relevant documents for each topic and of each participant’seffectiveness scores (recall, precision, F1) for each topic. For further detail on the estimationprocedures followed in the Interactive task, see the appendix to the Overview of the TREC 2008Legal Track [13].
2.2 Task Specifics
Within the general framework just sketched, a few additional features defined the specific landscape of the2009 version of the Interactive task.
2.2.1 Test Collection
For the 2009 Interactive task, a significant departure from the previous year’s exercise was the use of a newdocument collection. Whereas, in 2008, we had used the IIT Complex Document Information ProcessingTest Collection, version 1.0, a collection which is based on documents released under the tobacco “MasterSettlement Agreement” (see the overview of the TREC-2006 Legal Track for additional information on theIIT CDIP 1.0 collection [9]), we turned, in 2009, to a collection of emails that had been produced by Enronin response to requests from the Federal Energy Regulatory Commission (FERC). We turned to the newcollection on the grounds (i) that, in its subject matter, it would support a wide range of new topics and(ii) that, as a collection of emails with attachments, the collection more closely approximated the collectionsthat are the typical domains for real-world discovery searches. In the following, we elaborate further on the2009 test collection, focusing specifically on the provenance and processing of the collection, the state of thefinal collection, and plans for future use of Enron emails.
Provenance and processing. Although others have defined, in various ways, research collections fromthe Enron emails made available by FERC, we decided that it was in the best interest of the Legal Track tobuild a new Enron collection from scratch. We did so for two reasons.
First, the collection used by most researchers (assembled by MIT, SRI and CMU soon after the emailsbecame available from the Federal Energy Regulatory Commission (FERC)) has a fundamental drawback,for the purposes of the Legal Track, in that it lacks email attachments. Discussions at TREC 2008 confirmedthat track participants believed that attachments were an essential element of a test collection modelingcurrent e-discovery practice, and so, if we were to use Enron email for the 2009 exercise, we would have tofind a collection that included attachments.
Second, over the years, FERC has withdrawn some emails from the collection, for various reasons, andhas also released additional emails when the basis for withholding those emails expired. The net effect hasbeen a possible increase in the number of available emails over the past several years, emails that werenot available to the researchers who built the earlier collections. For both of these reasons (attachments,additional data) we elected to build our new test collection using the set currently being distributed byAspen Systems on behalf of FERC.
The steps we took to process the collection are as follows. The collection was obtained from Aspen Systemson March 21, 2005 by Clearwell. The original emails were from the mailboxes of about 150 employees ofEnron Corporation. At the time of collection, these mailboxes contained messages created between 1998 and2002. These emails were originally in Lotus Notes format. They were first converted into Microsoft personalfolder (.pst) format by Clearwell. Clearwell first extracted user names from the .pst collection. They thencleaned up these names, where possible, using various heuristics to discern SMTP, X.400 or other addressformats. After some data integrity checks, recognition of domain names, department names, group aliases,and other situations (e.g., “on behalf of” entries) was performed.
The .pst files were then loaded into a test exchange server and processed there to generate an ElectronicDiscovery Reference Model (EDRM) XML Document Element for each message. Each document elementcontains the original message and attachments in native form (as a .msg file) and text extracted from themessage and from any attachments (as .txt files). The .msg format is a binary encoding of the messageand its attachments, as specified by Microsoft’s Messaging Application Programming Interface (MAPI). All

significant MAPI properties present in the original .pst were maintained in the .msg file. Text extractionwas performed using Oracle Outside-In text extraction software. Message-to-attachment parent-child rela-tionships are indicated using a document numbering convention to facilitate construction of review units forresponsive review, and Parent-Child relationship entries were additionally encoded in the XML.
We performed deduplication in two stages. First, exact duplicates were identified and automaticallyremoved by Clearwell. Duplication detected at this stage resulted in retention of a single master copy,with only the XML metadata being retained for the removed duplicates. A second deduplication pass wasperformed at the University of Maryland using lexical similarity measures (i.e., recognizing messages withidentical senders and recipients and nearly identical subject lines and body text). This pass, performedtoo late to permit regeneration of the EDRM XML, identified a substantial number of messages in which“load two” had been appended to the subject line by an earlier stage of automated processing that wereotherwise duplicates. We therefore designated a single message from each set as being the message to bereturned, and provided a list of detected duplicates to track participants. Near the submission deadline wediscovered that we had inadvertently chosen the version with “load two” in the subject line, but at thatpoint it was too late to change the designation of messages to be returned. We also learned of some casesin which apparently identical messages actually had different attachments (which had not been checked inour second-pass duplicate detection); this resulted in inadvertent removal from the submitted runs of somepotentially unique messages.
The final test set. The resulting collection contained 569,034 unique messages. Together, the 569,034unique messages have 278,757 attachments, bringing the test collection to a total of 847,791 documents(when parent emails and attachments are counted separately). This was the collection used for the 2009Interactive task.
Looking forward. The version of the collection used in the 2009 Interactive task presented a number ofissues; chief among these were (i) the appending of the string “load two” in the subject line, (ii) the failure, insome cases, to take into account attachments in identifying duplicate sets of messages, (iii) the absence, in therelease of the collection, of the .pst files that were created from the Lotus Notes sources (some participantsexpressed interest in working directly from the .pst format), and (iv) the lack of a mapping between thiscollection and other Enron email collections.
We recognize that it is important to address these issues going forward. Our plan, for 2010, is to develop,in collaboration with the EDRM Data Set Project [1] and ZL Technologies (also a participant in the 2009Interactive task) a new version of the Enron collection that will be free of the issues noted above.
2.2.2 Topics & Topic Authorities
The 2009 Interactive task featured an entirely new mock complaint (modeling a securities fraud class action).The complaint provided the foundation for seven document requests, each of which served as a separate topicfor the purpose of the exercise. To each topic, a single Topic Authority was assigned, who, as noted above,served as the source for the authoritative conception of what was and was not relevant to the topic.
The topics and their Topic Authorities were as follows.
• Topic 201. All documents or communications that describe, discuss, refer to, report on, or relate tothe Company’s engagement in structured commodity transactions known as “prepay transactions.”
– Topic Authority: Howard J. C. Nicols (Squire, Sanders, & Dempsey).
• Topic 202. All documents or communications that describe, discuss, refer to, report on, or relate tothe Company’s engagement in transactions that the Company characterized as compliant with FAS140 (or its predecessor FAS 125).
– Topic Authority: Michael Roman Geske (Aphelion Legal Solutions).
• Topic 203. All documents or communications that describe, discuss, refer to, report on, or relateto whether the Company had met, or could, would, or might meet its financial forecasts, models,projections, or plans at any time after January 1, 1999.

– Topic Authority: David Stanton (Pillsbury Winthrop Shaw Pittman).
• Topic 204. All documents or communications that describe, discuss, refer to, report on, or relateto any intentions, plans, efforts, or activities involving the alteration, destruction, retention, lack ofretention, deletion, or shredding of documents or other evidence, whether in hard-copy or electronicform.
– Topic Authority: Maura Grossman (Wachtell, Lipton, Rosen & Katz).
• Topic 205. All documents or communications that describe, discuss, refer to, report on, or relate toenergy schedules and bids, including but not limited to, estimates, forecasts, descriptions, characteriza-tions, analyses, evaluations, projections, plans, and reports on the volume(s) or geographic location(s)of energy loads.
– Topic Authority: Art Bieser (Hunton & Williams).
• Topic 206. All documents or communications that describe, discuss, refer to, report on, or relate toany discussion(s), communication(s), or contact(s) with financial analyst(s), or with the firm(s) thatemploy them, regarding (i) the Company’s financial condition, (ii) analysts’ coverage of the Companyand/or its financial condition, (iii) analysts’ rating of the Company’s stock, or (iv) the impact of ananalyst’s coverage of the Company on the business relationship between the Company and the firmthat employs the analyst.
– Topic Authority: Christopher Boehning (Paul, Weiss, Rifkind, Wharton & Garrison).
• Topic 207. All documents or communications that describe, discuss, refer to, report on, or relateto fantasy football, gambling on football, and related activities, including but not limited to, footballteams, football players, football games, football statistics, and football performance.
– Topic Authority: K. Krasnow Waterman (LawTechIntersect).
Teams were allowed to participate in 1-4 topics, subject to the following constraints. First, in order tobalance the load among Topic Authorities, we sometimes had to ask a team to take a topic other than itsfirst choice. Second, given the subject matter of Topic 207, with which we assumed most participants wouldbe already familiar, we required that any team that participated in that topic also participate in at least oneof the other topics (201–206).
2.2.3 Participating Teams
The 2009 Interactive task saw participation from eleven teams (eight commercial and three academic), who,collectively, submitted a total of 24 single-topic runs. The eleven teams that submitted results for evaluationare as follows (full name followed by two-letter team ID):
• Applied Discovery (AD);• A collaborative effort of Cleary Gottlieb Steen & Hamilton LLP and Backstop LLP (CB);• Clearwell Systems (CS);• Equivio (EQ);• H5 (H5);• Integreon (IN);• Logik (LO);• University at Buffalo, State University of New York (UB);• University of Pittsburgh (UP);• University of Waterloo (UW); and• ZL Technologies (ZL).
It should be noted, with regard to the H5 team, that, as was also the case in the 2008 exercise, BruceHedin, a track coordinator and an employee of H5, did not take part in any way in H5’s efforts; indeed,throughout the exercise, the H5 team observed a policy of having no communications with Bruce Hedin, onTREC-related matters, outside of the channels available to other task participants.
Teams were invited to ask to participate in as many, or as few, topics as they chose. Given constraintson the number of teams for which a Topic Authority could take responsibility (typically, a maximum offour teams, but, in some cases, fewer), we indicated that we might not be able to give all teams all of theirchoices and asked teams to rank their topic selections in order of preference. Topics were assigned largelyon a first-come-first-serve basis; we also endeavored to give each team its top choice, utilizing the lower-ranked selections for balancing the load across topics. Nine of the eleven teams received their first choice oftopics; the two that did not (because the topic had already been fully subscribed) received their immediatelynext-highest selection.
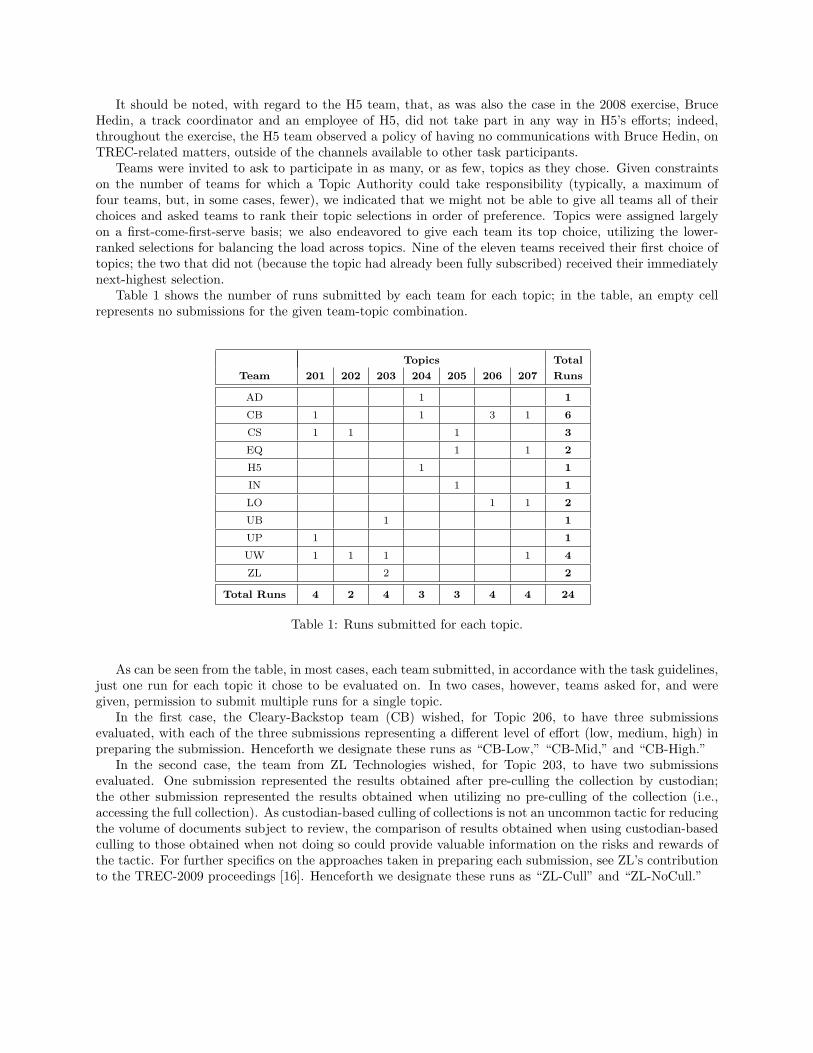
Table 1 shows the number of runs submitted by each team for each topic; in the table, an empty cellrepresents no submissions for the given team-topic combination.
Topics Total
Team 201 202 203 204 205 206 207 Runs
AD 1 1
CB 1 1 3 1 6
CS 1 1 1 3
EQ 1 1 2
H5 1 1
IN 1 1
LO 1 1 2
UB 1 1
UP 1 1
UW 1 1 1 1 4
ZL 2 2
Total Runs 4 2 4 3 3 4 4 24
Table 1: Runs submitted for each topic.
As can be seen from the table, in most cases, each team submitted, in accordance with the task guidelines,just one run for each topic it chose to be evaluated on. In two cases, however, teams asked for, and weregiven, permission to submit multiple runs for a single topic.
In the first case, the Cleary-Backstop team (CB) wished, for Topic 206, to have three submissionsevaluated, with each of the three submissions representing a different level of effort (low, medium, high) inpreparing the submission. Henceforth we designate these runs as “CB-Low,” “CB-Mid,” and “CB-High.”
In the second case, the team from ZL Technologies wished, for Topic 203, to have two submissionsevaluated. One submission represented the results obtained after pre-culling the collection by custodian;the other submission represented the results obtained when utilizing no pre-culling of the collection (i.e.,accessing the full collection). As custodian-based culling of collections is not an uncommon tactic for reducingthe volume of documents subject to review, the comparison of results obtained when using custodian-basedculling to those obtained when not doing so could provide valuable information on the risks and rewards ofthe tactic. For further specifics on the approaches taken in preparing each submission, see ZL’s contributionto the TREC-2009 proceedings [16]. Henceforth we designate these runs as “ZL-Cull” and “ZL-NoCull.”

2.2.4 Assessors
As noted above, once the collection has been stratified for each topic and evaluation samples drawn, thecontents of each sample is randomly divided into bins of approximately 500 documents. Each of these binsis then assigned to a first-pass assessor, who reviews the documents in the bin for relevance to his or herassigned topic.
For the 2009 Interactive task, assessors were drawn from two sources: (i) firms that provide professionalreview services and (ii) individual volunteers. The review of the samples for three of the seven Interactivetopics (203, 204, and 207) was carried out by two firms that include professional document-review servicesamong their offerings. The review of the samples for the remaining four topics (201, 202, 205, and 206)was carried out by individual volunteers (primarily law students, but also practicing attorneys and otherlegal professionals) each of whom reviewed one or, occasionally, two bins; in all, 48 individual volunteersparticipated in the first-pass review of these four topics.1
2.2.5 Unit of Assessment
As noted above, the Enron collection is a collection of emails. In evaluating the effectiveness of approachesto assessing the relevance of email messages, one must decide whether one wants to assess effectiveness atthe message level (i.e., treat the parent email together with all of its attachments as the unit of assessment)or to assess effectiveness at the document level (i.e., treat each of the components of an email message (theparent email and each child attachment) as a distinct unit of assessment. (Sometimes, in past discussions,the term record has been used as a synonym for message).
For the 2009 Interactive task, after much discussion (in which some participants argued in favor ofmessage-level assessment and others in favor of document-level assessment), we opted for an all-of-the-aboveapproach that asked participants to submit their results at the document level (in order to enable document-level analysis) from which we would, by rule, derive message-level values (which would serve as the primarybasis for evaluation).
In terms of submitting document-level assessments, participants were asked to make a separate assessmentof the relevance of the content of each component (the parent email and each attachment) of an email message,while taking into account all components of the message in resolving instances of ambiguous cross-reference.
In terms of deriving message-level values, the rule applied was reasonably straightforward: a messagecounted as having been assessed as relevant if any of its components (parent email or attachment) had beenassessed as relevant.
In measuring the effectiveness of the various approaches, our primary focus has been on effectivenessas measured at the message level; we do, however, supplement this message-level view with document-levelanalysis.
2.3 Task Results
The 2009 Interactive task got under way, with the release of the final task guidelines [8] and of the mockcomplaint and associated topics [3], on June 19, 2009. In this section, we summarize the results of theexercise.
2.3.1 Team-TA Interaction
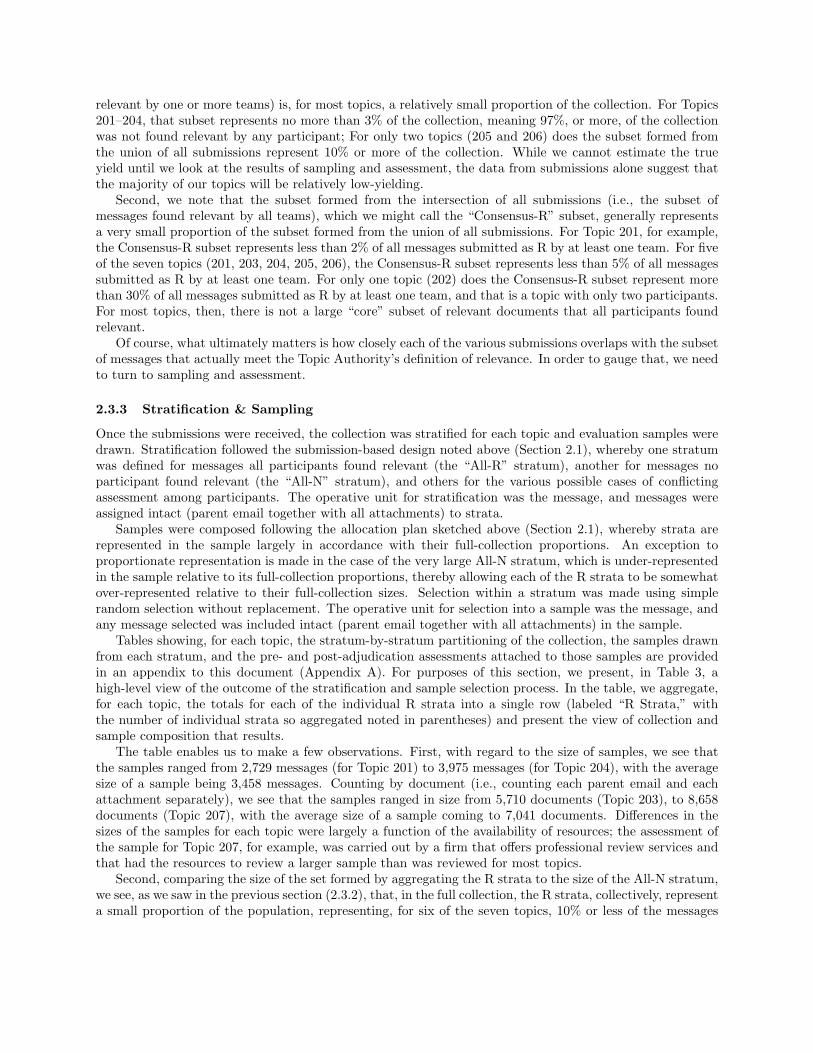
As noted above, the Interactive task permits teams to call on up to 10 hours (600 minutes) of a TopicAuthority’s time for purposes of clarifying the scope and intent of a topic. For the 2009 Interactive task,while the 10-hour limit was maintained for six of the seven topics, an exception to the rule was made in thecase of one topic, Topic 205. For this topic, participants (who had experienced some difficulties in gathering
1Individuals from the following law schools, academic and non-academic institutions participated in the review: CapitalU., Indiana U. Purdue U. Indianapolis, Loyola Law School Los Angeles, Loyola University New Orleans, Northern KentuckyU., Rutgers (SCILS) & Information, U. of Missouri, U. of North Carolina, Equivalent Data, Faegre & Benson, Greensfelder,Hemker & Gale, Hunton & Williams, Inventus, Law Offices of Russell Goodrow, and Mayer Brown.

the information they believed they needed to define the topic) requested, and were given, an additional fourhours of time to consult with the Topic Authority, bringing the total time allowed for Team-TA interactionfor this topic to 14 hours (840 minutes).
Figure 1 summarizes the participants’ use of the Topic Authorities’ time for each topic. In the diagram,each bar represents the total time allowed for team-TA interaction (600 minutes for most topics, 840 minutesfor Topic 205); the gray portion of the bar represents the amount of the permitted time that was actuallyused by a team (with the number of minutes used indicated just above the gray portion).
201 202 203 204
205
206 207
1000
900
500
600
700
800
0
100
200
300
400
CB
CS
UP
UW
UWCS
ZL -
NoC
ull
ZL -
Cul
l
UWUB H5
CB
AD INEQCS
LO
CB
-H
igh
CB
-M
id
CB
-Lo
w
UWLOEQCB
67
152
33
97
432
132
25
85
54 54
105
0
500
600
735
225
75 75 75
20
132
278
0
295
Participants in each Topic
TA T
ime
Use
d (in
min
utes
)
Figure 1: Team-TA interaction time.
As can be seen from the diagram, there is considerable variation in the extent to which teams utilized theirallotted time for interacting with the Topic Authority: some teams used less than an hour of their availabletime, while others used seven hours or more. On the whole, however, teams tended to use considerably lessthan the maximum amount of time that they were allowed. Of the 24 runs submitted, 20 were preparedutilizing less than 50% of the time permitted for interacting with the Topic Authority; only 4 of the runs(202-CS; 204-H5; 205-CS; 205-EQ) were the result of utilizing more than 50% of the time allowed for Team-TA interaction. We consider below (Section 2.4.1) whether there is any correlation between the amount oftime spent interacting with the Topic Authority in the preparation of a run and the effectiveness of the runthat results.
2.3.2 Submissions
Participants submitted their results on or before September 16, 2009 (or, in the case of Topic 205, for thereasons noted above, on or before September 30, 2009). Table 2 summarizes, at the message level, thesubmissions received for each topic. The table shows (for the complement of the union of all submissions;for the union of all submissions; for each submission; and for the intersection of all submissions): (i) thenumber of messages that belong to each designated subset, (ii) the proportion, out of all messages in thefull collection, that each subset represents, and (iii) the proportion, out of the union of all submissions, thateach subset represents. (Recall that the full collection consists of 569,034 messages.)
As can be seen from the table, there is considerable variation among the runs submitted for each topic;and finding which of the runs are most accurate will require examination of the results of our sampling andassessment protocol. Even prior to examining those results, however, we can make two observations simplyon the basis of the participant submissions.
First, we note that the subset formed from the union of all submissions (i.e., the subset of messages found

Proportion of Proportion of
Topic Subset Count Full Collection Submitted as R
201
Submitted as R by No Team 562,971 0.989 n.a.
Submitted as R by at least one Team 6,063 0.011 1.000
Submitted as R by CB 464 0.001 0.077
Submitted as R by CS 3,542 0.006 0.584
Submitted as R by UP 2,204 0.004 0.364
Submitted as R by UW 1,330 0.002 0.219
Submitted as R by All Teams 101 < 0.001 0.017
202
Submitted as R by No Team 564,299 0.992 n.a.
Submitted as R by at least one Team 4,735 0.008 1.000
Submitted as R by CS 3,423 0.006 0.723
Submitted as R by UW 3,002 0.005 0.634
Submitted as R by All Teams 1,690 0.003 0.357
203
Submitted as R by No Team 558,374 0.981 n.a.
Submitted as R by at least one Team 10,660 0.019 1.000
Submitted as R by UB 9,508 0.017 0.892
Submitted as R by UW 2,222 0.004 0.208
Submitted as R by ZL-Cull 84 < 0.001 0.008
Submitted as R by ZL-NoCull 344 < 0.001 0.032
Submitted as R by All Teams 13 < 0.001 0.001
204
Submitted as R by No Team 551,816 0.970 n.a.
Submitted as R by at least one Team 17,218 0.030 1.000
Submitted as R by AD 12,748 0.022 0.740
Submitted as R by CB 3,741 0.007 0.217
Submitted as R by H5 2,919 0.005 0.170
Submitted as R by All Teams 463 < 0.001 0.027
205
Submitted as R by No Team 489,347 0.860 n.a.
Submitted as R by at least one Team 79,687 0.140 1.000
Submitted as R by CS 59,225 0.104 0.743
Submitted as R by EQ 13,736 0.024 0.172
Submitted as R by IN 33,237 0.058 0.417
Submitted as R by All Teams 3,907 0.007 0.049
206
Submitted as R by No Team 511,860 0.900 n.a.
Submitted as R by at least one Team 57,174 0.100 1.000
Submitted as R by CB-Low 241 < 0.001 0.004
Submitted as R by CB-Mid 305 < 0.001 0.005
Submitted as R by CB-High 33,501 0.059 0.586
Submitted as R by LO 26,675 0.047 0.467
Submitted as R by All Teams 7 < 0.001 < 0.001
207
Submitted as R by No Team 537,506 0.945 n.a.
Submitted as R by at least one Team 31,528 0.055 1.000
Submitted as R by CB 7,911 0.014 0.251
Submitted as R by EQ 5,706 0.010 0.181
Submitted as R by LO 25,404 0.045 0.806
Submitted as R by UW 7,116 0.013 0.226
Submitted as R by All Teams 2,660 0.005 0.084
Table 2: Submissions (message-level).
relevant by one or more teams) is, for most topics, a relatively small proportion of the collection. For Topics201–204, that subset represents no more than 3% of the collection, meaning 97%, or more, of the collectionwas not found relevant by any participant; For only two topics (205 and 206) does the subset formed fromthe union of all submissions represent 10% or more of the collection. While we cannot estimate the trueyield until we look at the results of sampling and assessment, the data from submissions alone suggest thatthe majority of our topics will be relatively low-yielding.
Second, we note that the subset formed from the intersection of all submissions (i.e., the subset ofmessages found relevant by all teams), which we might call the “Consensus-R” subset, generally representsa very small proportion of the subset formed from the union of all submissions. For Topic 201, for example,the Consensus-R subset represents less than 2% of all messages submitted as R by at least one team. For fiveof the seven topics (201, 203, 204, 205, 206), the Consensus-R subset represents less than 5% of all messagessubmitted as R by at least one team. For only one topic (202) does the Consensus-R subset represent morethan 30% of all messages submitted as R by at least one team, and that is a topic with only two participants.For most topics, then, there is not a large “core” subset of relevant documents that all participants foundrelevant.
Of course, what ultimately matters is how closely each of the various submissions overlaps with the subsetof messages that actually meet the Topic Authority’s definition of relevance. In order to gauge that, we needto turn to sampling and assessment.
2.3.3 Stratification & Sampling
Once the submissions were received, the collection was stratified for each topic and evaluation samples weredrawn. Stratification followed the submission-based design noted above (Section 2.1), whereby one stratumwas defined for messages all participants found relevant (the “All-R” stratum), another for messages noparticipant found relevant (the “All-N” stratum), and others for the various possible cases of conflictingassessment among participants. The operative unit for stratification was the message, and messages wereassigned intact (parent email together with all attachments) to strata.
Samples were composed following the allocation plan sketched above (Section 2.1), whereby strata arerepresented in the sample largely in accordance with their full-collection proportions. An exception toproportionate representation is made in the case of the very large All-N stratum, which is under-representedin the sample relative to its full-collection proportions, thereby allowing each of the R strata to be somewhatover-represented relative to their full-collection sizes. Selection within a stratum was made using simplerandom selection without replacement. The operative unit for selection into a sample was the message, andany message selected was included intact (parent email together with all attachments) in the sample.
Tables showing, for each topic, the stratum-by-stratum partitioning of the collection, the samples drawnfrom each stratum, and the pre- and post-adjudication assessments attached to those samples are providedin an appendix to this document (Appendix A). For purposes of this section, we present, in Table 3, ahigh-level view of the outcome of the stratification and sample selection process. In the table, we aggregate,for each topic, the totals for each of the individual R strata into a single row (labeled “R Strata,” withthe number of individual strata so aggregated noted in parentheses) and present the view of collection andsample composition that results.
The table enables us to make a few observations. First, with regard to the size of samples, we see thatthe samples ranged from 2,729 messages (for Topic 201) to 3,975 messages (for Topic 204), with the averagesize of a sample being 3,458 messages. Counting by document (i.e., counting each parent email and eachattachment separately), we see that the samples ranged in size from 5,710 documents (Topic 203), to 8,658documents (Topic 207), with the average size of a sample coming to 7,041 documents. Differences in thesizes of the samples for each topic were largely a function of the availability of resources; the assessment ofthe sample for Topic 207, for example, was carried out by a firm that offers professional review services andthat had the resources to review a larger sample than was reviewed for most topics.
Second, comparing the size of the set formed by aggregating the R strata to the size of the All-N stratum,we see, as we saw in the previous section (2.3.2), that, in the full collection, the R strata, collectively, representa small proportion of the population, representing, for six of the seven topics, 10% or less of the messages

Messages Documents
Full Collection Sample Full Collection Sample
Topic Stratum Count Prp Count Prp Count Prp Count Prp
201R Strata (15) 6,063 0.011 802 0.294 29,295 0.035 3,380 0.524
All-N Stratum 562,971 0.989 1,927 0.706 818,496 0.965 3,075 0.476
Total 569,034 1.000 2,729 1.000 847,791 1.000 6,455 1.000
202R Strata (3) 4,735 0.008 1,120 0.301 15,189 0.018 3,579 0.481
All-N Stratum 564,299 0.992 2,600 0.699 832,602 0.982 3,856 0.519
Total 569,034 1.000 3,720 1.000 847,791 1.000 7,435 1.000
203R Strata (15) 10,660 0.019 1,120 0.337 25,856 0.030 2,498 0.437
All-N Stratum 558,374 0.981 2,200 0.663 821,935 0.970 3,212 0.563
Total 569,034 1.000 3,320 1.000 847,791 1.000 5,710 1.000
204R Strata (7) 17,218 0.030 1,265 0.318 48,587 0.057 3,485 0.478
All-N Stratum 551,816 0.970 2,710 0.682 799,204 0.943 3,804 0.522
Total 569,034 1.000 3,975 1.000 847,791 1.000 7,289 1.000
205R Strata (7) 79,687 0.140 2,170 0.664 179,011 0.211 4,901 0.770
All-N Stratum 489,347 0.860 1,100 0.336 668,780 0.789 1,466 0.230
Total 569,034 1.000 3,270 1.000 847,791 1.000 6,367 1.000
206R Strata (15) 57,174 0.100 1,372 0.404 179,030 0.211 4,772 0.647
All-N Stratum 511,860 0.900 2,025 0.596 668,761 0.789 2,599 0.353
Total 569,034 1.000 3,397 1.000 847,791 1.000 7,371 1.000
207R Strata (15) 31,528 0.055 1,255 0.331 141,210 0.167 5,362 0.619
All-N Stratum 537,506 0.945 2,540 0.669 706,581 0.833 3,296 0.381
Total 569,034 1.000 3,795 1.000 847,791 1.000 8,658 1.000
Table 3: Stratification & sampling—high-level view.
in the collection, and, for four of the seven topics, 3% or less of the messages. Looking at representationin the sample, we see that, in accordance with our sampling design, the R strata are represented in higherproportions, and the All-N stratum in lower proportions, than their full-collection proportions would dictate:for most samples, roughly one third of the sample is allocated to the R strata and two thirds to the All-Nstratum. Topic 205, for which the R strata comprise about 14% of the full collection, is an exception to thisgeneral rule: for this topic, roughly two thirds of the sample is allocated to the R strata and one third tothe All-N stratum.
Third, comparing the representation of strata when we count by message to their representation whenwe count by document, we see that, for all topics, the R strata represent a higher proportion, of both thecollection and the sample, when we count by document than they do when we count by message. Perhapsfor reasons having to do with the nature of the messages that are relevant to the target topics, or perhaps forreasons having to do with the nature of the retrieval processes used in the evaluation, or perhaps for reasonshaving to do with both, messages submitted as relevant by at least one participant have, on average, a higherdocument-to-message ratio (i.e., have a greater number of attachments) than do messages not submitted asrelevant by any participant. The doc-to-msg ratio for the full collection is 1.5; the doc-to-msg ratio forthe set formed by aggregating the R strata ranges from 2.2 (Topic 205) to 4.8 (Topic 201), with an averageacross the seven topics of 3.3. Of course, given that the operative unit for stratification and sampling was themessage, the inclusion of a document in an R stratum does not mean that the document itself was assessed

as relevant by any participant; it just means that some component of the message to which the documentbelongs was submitted as relevant by at least one participant.
2.3.4 Assessment & Adjudication
First-pass assessment. Once samples were drawn, the messages in each sample were randomly dividedinto “bins” of approximately 500 documents each. (Some bins had more, some less, than 500 documents, dueto the fact that messages were assigned to bins intact (parent email together with all attachments), makingit impossible to see that every bin had exactly 500 documents.) The bins were then distributed to first-passassessors who, equipped with detailed assessment guidelines (largely compiled from the relevance guidancethat the Topic Authority had provided the teams in the course of the exercise), assessed the documentsin their bins for relevance to their assigned topics. As noted above (Section 2.2.4), the first-pass assessorsincluded both professional document reviewers and individual volunteers. In all (aggregating the samplesfor the seven topics), a total of 100 bins were reviewed; these bins, collectively, contained 49,285 documents,representing a total of 24,206 messages.
In reviewing their bins, assessors were instructed to make a relevance judgment (relevant (R) or notrelevant (N)) for every document in their bins. A small number of documents in each bin were such as notto permit a relevance judgment by the assessor (when, for example, the document image was missing orillegible; when the document was in a language other than English; or when the document exceeded 300pages in length); in these cases, the assessor was instructed to leave the document “unjudged.” (Sometimesthese unjudged documents are referred to as “gray” documents.) Out of the 49,285 documents reviewed,1,980 (about 4% of the total) were found to be not assessable for one of these reasons and so were leftunjudged.
Appeal and adjudication. Once the first-pass assessors had completed their work, we provided eachteam with the full set of first-pass assessments for each topic in which they had participated, and invited themto appeal to the Topic Authority any assessments they believed had been made in error (i.e., out of keepingwith the Topic Authority’s conception of relevance). In order to assist teams in preparing their appeals, wealso provided teams with the (message-level) probability of selection associated with each document in thesample and with preliminary (i.e., pre-adjudication) estimates of the recall, precision, and F1 scores achievedin their submitted runs. In order to assist the Topic Authority in adjudicating appeals, teams were asked toprepare documents detailing the grounds for each appeal they were submitting. The Topic Authority thenrendered a final relevance judgment on all appealed documents; there was no second round of appeal.
Table 4 summarizes, for each of the runs received in the 2009 Interactive task, the rates of agreement anddisagreement with the first-pass assessments, the rate of appeal, and the rate of success of appeals. All datain the table are document-level data, as that is the level at which appeals were submitted and adjudicated,and so it is the level that is most informative when looking at the rates in which we are interested. Thetable contains, more specifically, the following data for each run.
1. Sample size. The number of documents in the evaluation sample for a given run.
2. Union of R assessments. The number of documents in the sample that were either assessed as Rin the given run or assessed as R by the first-pass assessor.
3. Intersection of R assessments. The number of documents in the sample that were both assessedas R in the given run and assessed as R by the first-pass assessor; also expressed as a proportion of (2).
4. Conflicting assessments. The number of conflicting assessments in the sample (i.e., documents thatwere assessed as R in the run but as N by the assessor or were assessed as N in the run but as R bythe assessor); also expressed as a proportion of (2).
5. Appealed assessments. The number of conflicting assessments that were appealed; also expressedas a proportion of (4).

6. Successful appeals. The number of appeals that were successful (i.e., that resulted in a first-passassessment’s being overturned); also expressed as a proportion of (5).
Run-Asr Conflicts Appeals
Docs Run-R Run-R ∩ Asr-R Conflict Appealed Successful
in ∪ Prp Prp Prp Prp
Topic Run Sample Asr-R Docs (of ∪) Docs (of ∪) Docs (Confl) Docs (App)
201
CB 6,455 654 99 0.151 548 0.838 119 0.217 116 0.975
CS 6,455 972 253 0.260 700 0.720 119 0.170 99 0.832
UP 6,455 835 54 0.065 777 0.931 0 0.000 0 n.a.
UW 6,455 736 229 0.311 497 0.675 473 0.952 462 0.977
202CS 7,435 2,207 1,131 0.512 1,035 0.469 129 0.125 124 0.961
UW 7,435 2,415 1,433 0.593 912 0.378 699 0.766 576 0.824
203
UB 5,710 1,076 80 0.074 944 0.877 22 0.023 16 0.727
UW 5,710 381 72 0.189 291 0.764 205 0.704 191 0.932
ZL-Cull 5,710 156 0 0.000 155 0.994 70 0.452 65 0.929
ZL-NoCull 5,710 195 13 0.067 179 0.918 99 0.553 93 0.939
204AD 7,289 1,526 45 0.029 1,455 0.953 0 0.000 0 n.a.
CB 7,289 432 29 0.067 400 0.926 104 0.260 83 0.798
H5 7,289 302 57 0.189 240 0.795 234 0.975 200 0.855
205CS 6,367 2,807 933 0.332 1,794 0.639 174 0.097 146 0.839
EQ 6,367 1,731 355 0.205 1,373 0.793 932 0.679 925 0.992
IN 6,367 3,144 622 0.198 2,296 0.730 0 0.000 0 n.a.
206
CB-Low 7,371 243 15 0.062 228 0.938 52 0.228 50 0.962
CB-Mid 7,371 250 18 0.072 230 0.920 51 0.222 50 0.980
CB-High 7,371 1,161 43 0.037 1,067 0.919 49 0.046 48 0.980
LO 7,371 2,590 30 0.012 2,517 0.972 0 0.000 0 n.a.
207
CB 8,658 1,050 825 0.786 220 0.210 91 0.414 68 0.747
EQ 8,658 1,063 768 0.722 292 0.275 58 0.199 50 0.862
LO 8,658 3,421 704 0.206 2,692 0.787 0 0.000 0 n.a.
UW 8,658 1,060 851 0.803 206 0.194 115 0.558 107 0.930
Table 4: Appeal & adjudication data.
The data in Table 4 provide an interesting view into how the various participants made use of theappeal/adjudication mechanism. For the moment, we make the following observations.
With regard to the intersection of R assessments (cases in which a document was both submitted as R ina given run and judged as R by the first-pass assessor), we see that the rates of overlap are generally low. Forfive of the seven topics, we see no cases of run-assessor positive overlap (the intersection of R assessments outof the union of R assessments) that exceed 0.5; for Topic 202, we do find that, for both runs, overlap valuesare greater than 0.5 but still do not exceed 0.6; it is only with Topic 207 (on football-related gambling) thatwe see overlap rates greater than 0.7. For Topic 207 and, to a lesser extent, for Topic 202, participants andassessors seem to have had a good amount of common ground in judging relevance; for the other topics,however, there is a substantial amount of run-assessor disagreement, disagreement that would have to beresolved via the appeals process.
With regard to the number of conflicting assessments, we do see that, although generally a relativelysmall proportion of the sample as a whole, they typically represent a high proportion of the set of documents

assessed as R either by the participant or by the assessor. (Note that the conflicting assessments and theintersection of R assessments do not necessarily sum to the union of R assessments; this is due to the factthat some documents in the union may have been left unjudged by the assessor (and so are not counted asa conflicting assessment).)
With regard to the rates of appeal, we see that there is considerable variation among participants, withsome participants electing not to appeal any of their conflicts with the first-pass assessor and with othersappealing over 90% of such conflicts. Most participants did, however, choose to submit at least some appeals;for only 5 of the 24 runs were no conflicts appealed. Most topics, moreover, had one or more participantswho made at least moderate use of the appeals mechanism; Topic 206 is the only topic for which there wasno run that had an appeals rate of at least 0.5 (see below (Section 2.3.6) for more discussion of Topic 206).
With regard to the success rates for appeals, we see that these rates are, across the board, high. No setof appeals had a success rate lower than 0.7 and ten had a success rate greater than 0.9. It is evident that,in many cases, the participants, through their prior interaction with the Topic Authority, had a good senseof the operative conception of relevance, and so were effective at identifying, and having corrected, assessorerrors.
We return to these data below (Section 2.4.2), where we consider the effects of appeals on participantscores.
2.3.5 Final Results
With all appeals adjudicated and sample assessments finalized, we were in a position to calculate finalestimates of the overall yield for each topic and of the recall, precision, and F1 achieved in each run submittedby participants. Before turning to those estimates, we add two further notes by way of background to ourcalculations.
The first note concerns the derivation of message-level relevance values. In the discussion that follows,our primary focus is on message-level yields and on message-level scores. We noted above (Section 2.2.5)that derivation of message-level relevance values from document-level values was a fairly straightforwardmatter, with a message counting as relevant if any one of its components (parent email or attachment) wasfound relevant. While the rule so stated suffices for the vast majority of cases, allowance for the possibilitythat a component of a message might be left “unjudged” requires a slightly more elaborate formulation ofthe derivation rule. The full rule is as follows.
• For fully-judged messages (all components judged): R trumps N (i.e., a message is R if any one of itscomponents is R).
• For fully-unjudged messages (no components judged): the message is U (i.e., a message is U (unjudged)if all of its components are U).
• For partially-judged messages (some components judged, some not), the following rules apply.
– In most cases, R trumps N, N trumps U.– The one exception, which occurs in a very small number of cases, is when none of the judged
components have been judged R, but at least one of the unjudged components has been submittedby a participant as R; in this case, the message is U (because the participant’s R was not assessed).
The rule was so formulated in order to make maximum use of the assessments we had obtained, while stillbeing fair to participants whose submitted R’s were left unjudged.
The second note concerns the calculation of confidence intervals. For this report, we calculated confidenceintervals utilizing the formulae detailed in the appendix to the 2008 Overview [13]. We are aware that someadjustments to these formulae are called for. More specifically, we note (i) that reflecting correlation inthe computation of confidence intervals for ratios such as precision and recall would reduce our computedconfidence intervals somewhat2 and (ii) that, if our implicit assumption that every first-pass assessmentof an unappealed document is correct turns out not to be true, that could in some cases place the actual
2William Webber, personal communication.

values outside our computed confidence intervals (which reflect sampling error but not assessment error) [17].For now, however, we believe that the reported confidence intervals are serviceable as rough gauges of thesampling error associated with the estimates.
We can now turn to the estimates themselves. Table 5 reports the estimated full-collection yield ofrelevant messages for each of the seven Interactive topics; yield is reported both as an absolute total and asa proportion of the full collection.
Relevant Messages Prp (of Collection)
Topic Est. 95% C.I. Est. 95% C.I.
201 1,524 (949, 2,099) 0.003 (0.002, 0.004)
202 3,801 (3,060, 4,542) 0.007 (0.005, 0.008)
203 1,685 (1,550, 1,820) 0.003 (0.003, 0.003)
204 3,163 (2,456, 3,869) 0.006 (0.004, 0.007)
205 26,839 (23,751, 29,928) 0.047 (0.042, 0.053)
206 15,695 (12,042, 19,348) 0.028 (0.021, 0.034)
207 8,454 (7,892, 9,016) 0.015 (0.014, 0.016)
Table 5: Estimated yields.
As can be seen from the table, our hypothesis, formed on the basis of the submission data alone (seeSection 2.3.2), that the topics were generally low-yielding has been borne out by the sample data. Notopic represents more than 5% of the collection (the closest being Topic 205, which represents 4.7% of thecollection), and four of the seven topics (201–204) represent, individually, less than 1% of the collection.
Table 6 reports measures of how effective the participants were at retrieving those relevant messages.More specifically, the table reports, for each run submitted, estimates of the message-level recall, precision,and F1 achieved in the run.
As can be seen from the table, with regard to the effectiveness of the approaches evaluated in this year’sexercise, the post-adjudication scores show some encouraging signs. Of the 24 submitted runs, 6 (distributedacross 5 topics: 201-UW, 202-UW, 203-UW, 204-H5, 207-UW, 207-CB) attained an F1 score (point estimate)of 0.7 or greater. In terms of recall, of the 24 submitted runs, 5 (distributed across 4 topics: 201-UW, 203-UW, 204-H5, 207-UW, 207-CB) attained a recall score of 0.7 or greater; of these 5 runs, 4 (distributed across3 topics: 201-UW, 204-H5, 207-UW, 207-CB) simultaneously attained a precision score of 0.7 or greater.Before, however, drawing any further conclusions from the data in Table 6, it is useful to add additionaltopic-specific context to these results.
2.3.6 Topic-Specific Notes
Each topic has a story of its own, and the circumstances specific to each topic must always be kept in mindin evaluating results. In this section, we note some of the topic-specific circumstances that are salient to the2009 results.
Topic 201. Topic 201 presented us with the interesting case of a “rogue” bin. The appeals for Topic201 brought to light the fact that one of our first-pass assessors (who had reviewed a bin of 501 documents,representing 171 messages) must have fundamentally misunderstood his or her assignment. Although thisassessor’s bin would have been more or less of the same composition as the other bins (since messages areassigned to bins randomly once the full evaluation sample has been selected), the results of the first-passassessment of the bin were significantly out of line with results for the other bins, both in terms of theproportion of documents assessed as R (64% vs. an average of 9% for the other bins) and in terms of theproportion of documents appealed (61% vs. an average of 8% for the other bins). The nature of this assessor’s

Recall Precision F1
Topic Run Est. 95% C.I. Est. 95% C.I. Est. 95% C.I.
201
UW 0.778 (0.482, 1.000) 0.912 (0.869, 0.956) 0.840 (0.667, 1.000)
CB 0.204 (0.126, 0.282) 0.690 (0.633, 0.746) 0.315 (0.221, 0.408)
CS 0.489 (0.302, 0.676) 0.215 (0.202, 0.228) 0.299 (0.261, 0.336)
UP 0.167 (0.102, 0.232) 0.117 (0.105, 0.129) 0.137 (0.114, 0.161)
202UW 0.673 (0.540, 0.805) 0.884 (0.859, 0.909) 0.764 (0.678, 0.850)
CS 0.579 (0.465, 0.694) 0.664 (0.640, 0.688) 0.619 (0.553, 0.685)
203
UW 0.865 (0.765, 0.964) 0.692 (0.632, 0.752) 0.769 (0.715, 0.823)
ZL-NoCull 0.175 (0.155, 0.194) 0.895 (0.812, 0.978) 0.292 (0.264, 0.320)
UB 0.592 (0.515, 0.668) 0.111 (0.099, 0.122) 0.186 (0.170, 0.203)
ZL-Cull 0.029 (0.022, 0.036) 0.613 (0.463, 0.762) 0.056 (0.043, 0.068)
204H5 0.762 (0.587, 0.937) 0.844 (0.796, 0.893) 0.801 (0.702, 0.900)
CB 0.198 (0.149, 0.248) 0.169 (0.150, 0.189) 0.183 (0.159, 0.207)
AD 0.305 (0.232, 0.377) 0.077 (0.071, 0.083) 0.123 (0.113, 0.133)
205EQ 0.463 (0.407, 0.518) 0.915 (0.884, 0.946) 0.614 (0.565, 0.664)
CS 0.673 (0.587, 0.759) 0.321 (0.302, 0.339) 0.434 (0.410, 0.459)
IN 0.292 (0.249, 0.334) 0.251 (0.228, 0.273) 0.270 (0.247, 0.292)
206
CB-High 0.076 (0.044, 0.107) 0.038 (0.025, 0.051) 0.051 (0.037, 0.064)
LO 0.042 (0.020, 0.063) 0.026 (0.014, 0.039) 0.032 (0.021, 0.043)
CB-Mid 0.011 (0.007, 0.015) 0.608 (0.412, 0.804) 0.021 (0.013, 0.030)
CB-Low 0.009 (0.006, 0.013) 0.612 (0.407, 0.816) 0.018 (0.011, 0.026)
207
UW 0.761 (0.704, 0.818) 0.907 (0.875, 0.939) 0.828 (0.791, 0.864)
CB 0.768 (0.707, 0.828) 0.834 (0.797, 0.871) 0.799 (0.762, 0.836)
EQ 0.483 (0.445, 0.521) 0.725 (0.693, 0.758) 0.580 (0.551, 0.609)
LO 0.538 (0.493, 0.583) 0.183 (0.174, 0.193) 0.273 (0.261, 0.285)
Table 6: Post-adjudication estimates of recall, precision, and F1.
R assessments was also curious: the assessor counted as R many documents that were not remotely relevantto 201 but may have been pertinent to one of the other topics (e.g., football). One hypothesis for this resultis that the assessor, although given instructions and guidelines specific to 201, believed that he or she wassupposed to review documents for relevance to any of the seven topics listed in the mock complaint.
Given the odd character of the assessments in the bin, we chose, rather than to burden the TopicAuthority with a large number of additional appeals, simply to ignore the bin (both appealed and non-appealed documents) entirely. Since message-to-bin-assignment is random, this amounts to assuming thatcontent of the bin was never selected into the sample. The remainder of the sample (a total of 13 bins)still represents an unbiased sample of the collection and the estimates that are derived from the sample stillvalid.
Topic 205. Topic 205, as noted above, represented a case in which participants experienced somedifficulties in gathering the information they believed they needed to define the topic, and so requested, andwere given, an additional four hours of time to consult with the Topic Authority as well as an additionaltwo weeks, beyond the submission deadline set for the other topics, to submit their results. We believe thatthe allowance of additional time sufficed to address the issue that the participants had raised and that theresults reported for this topic are as reliable as those reported for other topics.
Topic 206. Topic 206 represents the one topic, out of the seven featured in the 2009 exercise, for which

we believe the post-adjudication results are not reliable. Recall that the Interactive task relies heavily onthe appeals mechanism as a corrective on errors made in the first-pass assessment process. For Topic 206,this mechanism was used only very lightly: one of the two participants in the topic submitted no appealsand the other submitted only a small subset of their disagreements with the first-pass assessors. While suchappeals as were made were indeed successful at identifying and correcting errors, it is very likely that, dueto the light use of the appeals mechanism, many more errors remain uncorrected.
We do not believe, therefore, that any valid conclusions can be drawn from the scores recorded for thistopic; those scores are, in essence, still “pre-adjudication” scores and, as such, could vary vary substantiallyfrom the scores that would result if a more thorough vetting of the first-pass assessments was carried out.
The experience of this topic will serve as valuable input to potential modifications to the appeal andadjudication process we are considering for the 2010 exercise.
Topic 207. Topic 207 (on football-related gambling) is the topic for which, given the subject matter ofthe topic, we added the requirement that any team that participated in this topic also participate in at leastone of the other topics (Section 2.2.2).
Having noted these considerations, we summarize the results in the form of a diagram. Figure 2 plotseach of the post-adjudication results for each of the 24 submitted runs on a precision-recall diagram. In thefigure, topics are distinguished by shape as per the legend.
0.2 1.00.80.60.40.0
0.0
1.0
0.8
0.6
0.4
0.2
Recall
Pre
cisi
on
201
205
206
204
203
202
207
Legend
Figure 2: Interactive runs—recall and precision.
2.4 Further Analysis
The 2009 Interactive task produced a set of data that we believe will be a rich domain for further study andanalysis. For purposes of this report, we confine our further analysis to brief observations on a few aspectsof interest.
2.4.1 Team-TA Interaction
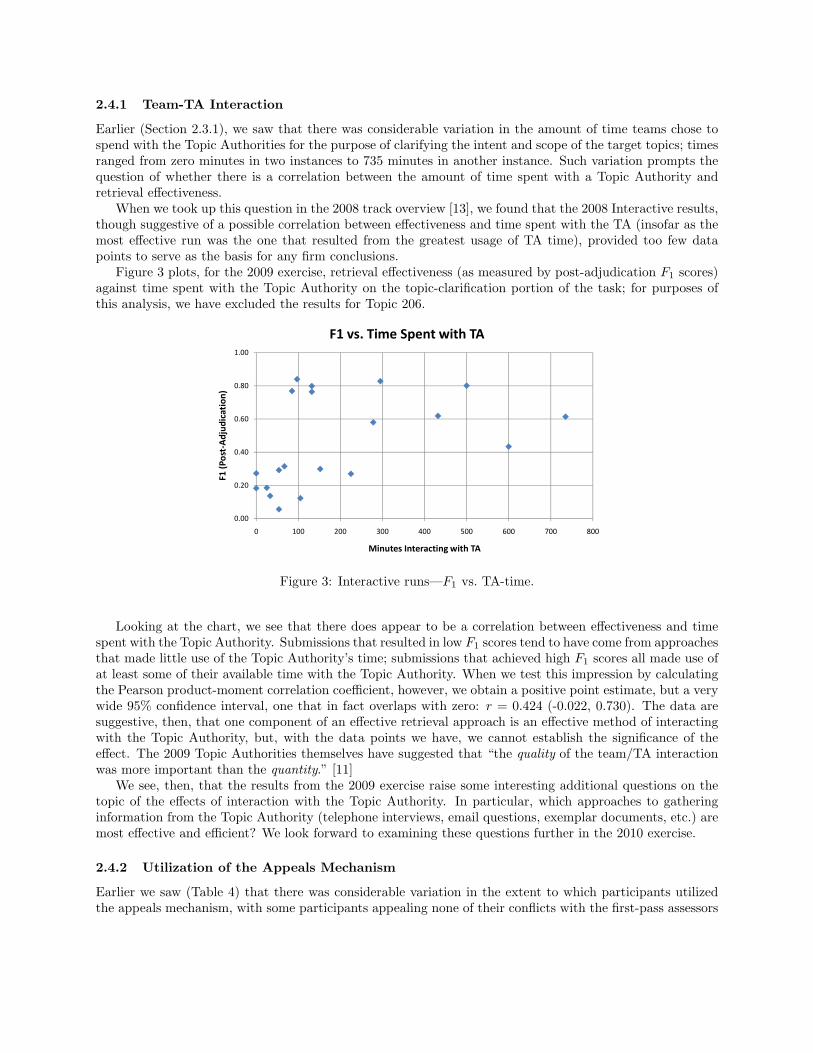
Earlier (Section 2.3.1), we saw that there was considerable variation in the amount of time teams chose tospend with the Topic Authorities for the purpose of clarifying the intent and scope of the target topics; timesranged from zero minutes in two instances to 735 minutes in another instance. Such variation prompts thequestion of whether there is a correlation between the amount of time spent with a Topic Authority andretrieval effectiveness.
When we took up this question in the 2008 track overview [13], we found that the 2008 Interactive results,though suggestive of a possible correlation between effectiveness and time spent with the TA (insofar as themost effective run was the one that resulted from the greatest usage of TA time), provided too few datapoints to serve as the basis for any firm conclusions.
Figure 3 plots, for the 2009 exercise, retrieval effectiveness (as measured by post-adjudication F1 scores)against time spent with the Topic Authority on the topic-clarification portion of the task; for purposes ofthis analysis, we have excluded the results for Topic 206.
0.60
0.80
1.00
dication
)
F1 vs. Time Spent with TA
0.00
0.20
0.40
0.60
0.80
1.00
0 100 200 300 400 500 600 700 800
F1 (P
ost‐Adjud
ication)
Minutes Interacting with TA
F1 vs. Time Spent with TA
Figure 3: Interactive runs—F1 vs. TA-time.
Looking at the chart, we see that there does appear to be a correlation between effectiveness and timespent with the Topic Authority. Submissions that resulted in low F1 scores tend to have come from approachesthat made little use of the Topic Authority’s time; submissions that achieved high F1 scores all made use ofat least some of their available time with the Topic Authority. When we test this impression by calculatingthe Pearson product-moment correlation coefficient, however, we obtain a positive point estimate, but a verywide 95% confidence interval, one that in fact overlaps with zero: r = 0.424 (-0.022, 0.730). The data aresuggestive, then, that one component of an effective retrieval approach is an effective method of interactingwith the Topic Authority, but, with the data points we have, we cannot establish the significance of theeffect. The 2009 Topic Authorities themselves have suggested that “the quality of the team/TA interactionwas more important than the quantity.” [11]
We see, then, that the results from the 2009 exercise raise some interesting additional questions on thetopic of the effects of interaction with the Topic Authority. In particular, which approaches to gatheringinformation from the Topic Authority (telephone interviews, email questions, exemplar documents, etc.) aremost effective and efficient? We look forward to examining these questions further in the 2010 exercise.
2.4.2 Utilization of the Appeals Mechanism
Earlier we saw (Table 4) that there was considerable variation in the extent to which participants utilizedthe appeals mechanism, with some participants appealing none of their conflicts with the first-pass assessors
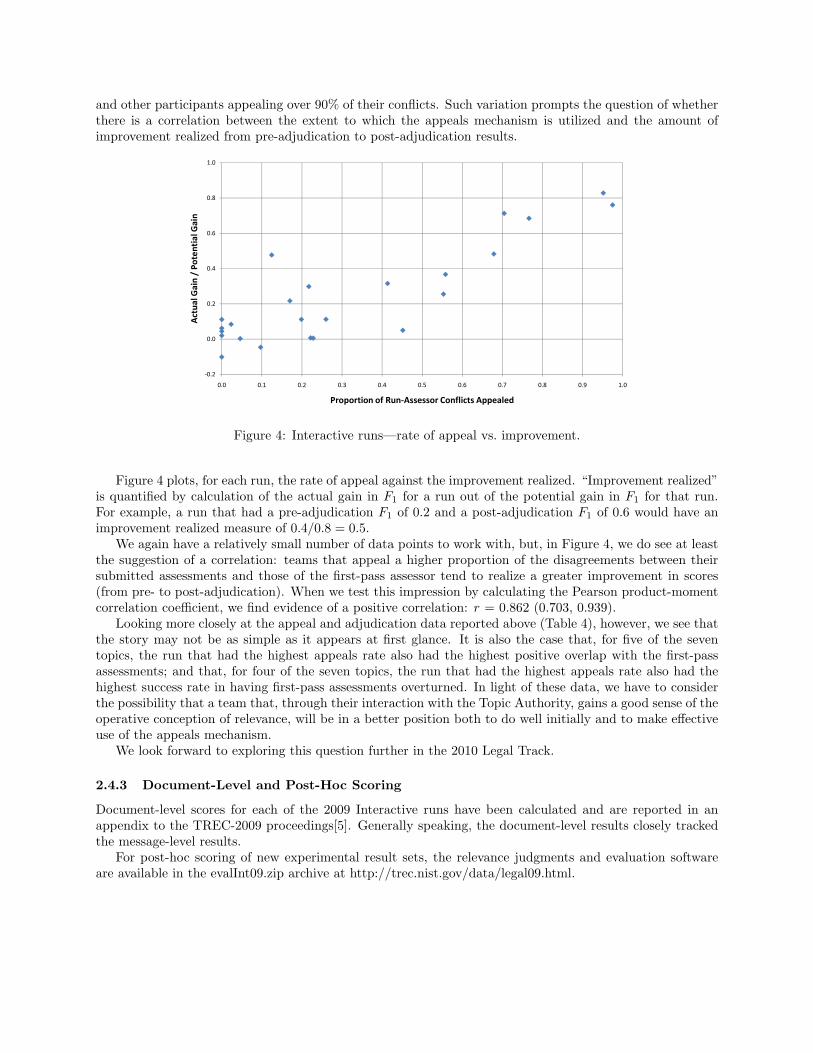
and other participants appealing over 90% of their conflicts. Such variation prompts the question of whetherthere is a correlation between the extent to which the appeals mechanism is utilized and the amount ofimprovement realized from pre-adjudication to post-adjudication results.
0.4
0.6
0.8
1.0
/ Po
tential G
ain
‐0.2
0.0
0.2
0.4
0.6
0.8
1.0
0.0 0.1 0.2 0.3 0.4 0.5 0.6 0.7 0.8 0.9 1.0
Actua
l Gain / Po
tential G
ain
Proportion of Run‐Assessor Conflicts Appealed
Figure 4: Interactive runs—rate of appeal vs. improvement.
Figure 4 plots, for each run, the rate of appeal against the improvement realized. “Improvement realized”is quantified by calculation of the actual gain in F1 for a run out of the potential gain in F1 for that run.For example, a run that had a pre-adjudication F1 of 0.2 and a post-adjudication F1 of 0.6 would have animprovement realized measure of 0.4/0.8 = 0.5.
We again have a relatively small number of data points to work with, but, in Figure 4, we do see at leastthe suggestion of a correlation: teams that appeal a higher proportion of the disagreements between theirsubmitted assessments and those of the first-pass assessor tend to realize a greater improvement in scores(from pre- to post-adjudication). When we test this impression by calculating the Pearson product-momentcorrelation coefficient, we find evidence of a positive correlation: r = 0.862 (0.703, 0.939).
Looking more closely at the appeal and adjudication data reported above (Table 4), however, we see thatthe story may not be as simple as it appears at first glance. It is also the case that, for five of the seventopics, the run that had the highest appeals rate also had the highest positive overlap with the first-passassessments; and that, for four of the seven topics, the run that had the highest appeals rate also had thehighest success rate in having first-pass assessments overturned. In light of these data, we have to considerthe possibility that a team that, through their interaction with the Topic Authority, gains a good sense of theoperative conception of relevance, will be in a better position both to do well initially and to make effectiveuse of the appeals mechanism.
We look forward to exploring this question further in the 2010 Legal Track.
2.4.3 Document-Level and Post-Hoc Scoring
Document-level scores for each of the 2009 Interactive runs have been calculated and are reported in anappendix to the TREC-2009 proceedings[5]. Generally speaking, the document-level results closely trackedthe message-level results.
For post-hoc scoring of new experimental result sets, the relevance judgments and evaluation softwareare available in the evalInt09.zip archive at http://trec.nist.gov/data/legal09.html.
2.5 Lessons from the 2009 Interactive Task
The 2009 Interactive task brought with it a greater number of topics, a greater number of participants, and,it must be admitted, a good amount of growing pains. Most importantly, however, the task has providedthe Legal Track community with a rich set of data that we believe will be the basis for much productiveresearch in the future; the task has also provided us with a number of lessons that we can carry forward tofuture studies. Among the lessons we would highlight are the following.
First, with regard to the methods evaluated, the 2009 Interactive task has shown that more than onemethod can be effective at retrieving responsive documents and that a method can be effective on a rangeof different topics. A subject for further exploration is the identification of those elements that the methodsshown to be effective have in common.
Second with regard to the design of the Interactive task, the 2009 results bring to light some issues thatdeserve attention, including:
• making the adjudication process less dependent on participant initiative;
• making the appeal/adjudication process more efficient;
• addressing the challenge of sampling for very low frequency items (such as relevant documents in the“All-N” stratum); and
• managing the task in such a way that it adheres to its timelines.
We look forward to building on these lessons in 2010.
3 Batch Task
The Batch task of the TREC 2009 Legal Track was a successor to the Ad Hoc and Relevance Feedbacktasks of past years. The Batch task supports researching the effectiveness of the second-pass of two-passsearch approaches to e-discovery (i.e., feedback approaches), and also the effectiveness of single-pass searchapproaches. The “Batch” name comes from “Batch Filtering” in the earlier TREC Filtering Track, in whichall evidence regarding relevance was made available at the outset of the task (in contrast to “AdaptiveFiltering,” which had been designed to simulate active learning as the task progressed).
3.1 Scanned Document Collection
The collection to be searched in the Batch task was the same document collection as the 2006–2008 LegalTracks, the IIT Complex Document Information Processing (CDIP) Test Collection, version 1.0 (referredto here as “IIT CDIP 1.0”) which is based on scanned documents released under the tobacco “MasterSettlement Agreement” (MSA). The University of California San Francisco (UCSF) Library, with supportfrom the American Legacy Foundation, has created a permanent repository, the Legacy Tobacco DocumentsLibrary (LTDL), for tobacco documents [14]. The IIT CDIP 1.0 collection is based on a snapshot, generatedbetween November 2005 and January 2006, of the MSA subcollection of the LTDL. The IIT CDIP 1.0collection consists of 6,910,192 document records in the form of XML elements, that contain both metadataand the results of Optical Character Recognition (OCR). See the 2006 TREC Legal Track overview paperfor additional details about the IIT CDIP 1.0 collection [9]. Although the original scanned documents arealso available (on request), we do not know of any site that has used them.
3.2 Topic Selection
The Batch task re-used 10 of the “production request” topics from previous years. The structure of thetopics was identical to those used in the Interactive task, with the addition of a negotiated Boolean query
(for reference) and some snapshots from the negotiation history (these snapshots were also provided asBoolean queries).
The number of test topics this year (10) was lower than the 40-50 typically used in past query sets inpart to compensate for the footprint of allowing deeper ranked submissions for each topic (up to 1.5 milliondocuments per topic, which was 15 times more than the previous year). Reducing the number of topics alsoallowed denser sampling of the document pools (from assigning multiple assessors to a topic, as was done inthe Interactive task), making possible more accurate estimates of evaluation measures.
Included in the 10 topics were the 3 topics from the Interactive task of 2008 (topics #102 (2008-I-1),#103 (2008-I-2) and #104 (2008-I-3)). These 3 topics had been seeded in the topic set of the 2008 Ad Hoctask in hopes of allowing comparison of that year’s automatic runs to the Interactive runs. However, the AdHoc submission limit of 100,000 documents per topic turned out to be too low to allow a fair comparisonin 2008. (For instance, the top-scoring Interactive system on topic 103 submitted 608,807 documents andachieved an F1 of 0.71. The estimated number of relevant documents for this topic was 786,862. Hence a“perfect” Ad Hoc system could not achieve a recall of more than 13% (100,000/786,862) or an F1 of morethan 0.23 (2*1.0*0.13/(1.0+0.13)) on topic 103 under last year’s guidelines.) This year the submission limitwas increased to 1.5 million documents per topic.
Another reason for including the 3 past Interactive topics was that the submissions in past years of theRelevance Feedback task (2007 and 2008) had generally not achieved the gains anticipated compared tothe baseline (non-feedback) runs. The Interactive topics had more past judgments available for system usethan the other past topics (up to 6,500 judgments for topic 103). Furthermore, the Interactive task hadan adjudication phase which likely further improved the quality of the relevance assessments for feedback.Also, the manual expert searchers participating in the Interactive task may have turned up some relevantdocuments for feedback that automatic runs might have been missed.
For contrast, also included in the 10 topics were 3 topics from the 2008 Ad Hoc task, a task whichgenerally just included submissions from automated runs. One topic was randomly chosen for each of the 3complaints. These were #105 (2008-F-1), #138 (2008-G-9) and #145 (2008-H-4).
Also included in the 10 topics were 2 topics from the 2007 Ad Hoc topic set. For these, the selectionwas from the 7 topics that had been re-used in the 2008 Relevance Feedback task (because more relevanceassessments were available for those than for other 2008 topics). The 2 topics selected were the ones thathad the most consistent estimated numbers of relevant documents between the two tasks (which mightbe indicative of consistent assessing across the two years). These topics were #80 (2007-C-2) and #89(2007-D-1).
Also included in the 10 topics were 2 topics from the 2006 Ad Hoc topic set. These topics were selectedfrom the 3 highest-priority Interactive topics of 2007, which included some manual expert submissions. Also,these topics had additional judgments from deep sampling from being used in the 2007 Relevance Feedbacktask. These topics were #7 (2006-A-2) and #51 (2006-E-10).
The 10 test topics were made available in the same XML format as the previous years (as fullL09.xmland shortL09.xml). They are now posted at http://trec.nist.gov/data/legal09.html.
3.3 Training Judgments
The past judgments (known as “training qrels” or “training judgments”) were available to the participatingsystems in two files, qrelsL09.pass1 and qrelsL09.pass1 probs. (These files are now posted in the Batch-Topics2009.zip file at http://trec.nist.gov/data/legal09.html).
The relevance judgments were from the following sources:For topics 7 and 51, included were the judgments from the 2006 Ad Hoc task and the “residual” judgments
(i.e., judgments omitting those already judged for the 2006 Ad Hoc task) from the 2007 Interactive andRelevance Feedback tasks.
For topics 80 and 89, included were the judgments from the 2007 Ad Hoc task and the residual judgmentsfrom the 2008 Relevance Feedback task.
For topics 102, 103 and 104, included were the post-adjudication judgments from the 2008 Interactivetask.

For topics 105, 138 and 145, included were the judgments from the 2008 Ad Hoc task.For the sampling probabilities (the 5th column in qrelsL09.pass1 probs), when two different years were
combined, the probabilities were set to “1.0” for the judgments from the earlier year and the residual samplingprobabilities were preserved for the judgments from the later (residual) year. Mathematically, this approachsimulated sampling from the later residual pool with the original judgments added back in.
Also, for cases of two years of judgments being used, because just residual judgments were used from thelater year, there hence were no documents with two different judgments for the same topic in qrelsL09.pass1 orqrelsL09.pass1 probs. We note, however, that assessors in different years may have had different conceptionsof relevance, and that no attempt had been made to standardize those conceptions.
The following list shows, for each of the 10 topics, the count of the number of relevance judgments inthe provided training qrels files (including “gray” documents), the number judged relevant, and the numberjudged non-relevant:
Topic 7: count=1269, rel=307, non=951Topic 51: count=1361, rel=88, non=1259Topic 80: count=1879, rel=734, non=1139Topic 89: count=874, rel=201, non=607Topic 102: count=4500, rel=1548, non=2887Topic 103: count=6500, rel=2981, non=3440Topic 104: count=2500, rel=92, non=2391Topic 105: count=701, rel=156, non=540Topic 138: count=600, rel=125, non=472Topic 145: count=499, rel=200, non=297
For 5 of the 10 topics, the past relevant judgments distinguished between highly relevant documents andall other relevant documents (topics #80, 89, 105, 138, 145).
3.4 Evaluation Measures
The goal of the systems was to specify the set of all relevant documents in the collection. The main measurefor evaluating the accuracy of the submitted set was the F1 measure (F1 is 2 * Precision * Recall / (Precision+ Recall), or 0 if both Precision and Recall are zero).
In order to also support evaluation with rank-based measures, the systems were requested to submit aranked list of (up to) 1.5 million documents for each topic, ranking the documents in descending order ofprobability of (or, at the system’s option, degree of) relevance to the topic.
For the set-based evaluation, the systems were required to specify a value K for each topic; that system’stop-ranked K documents for that topic would form the set for evaluation with F1 (hence sometimes thetarget measure is called F1@K).
Furthermore, the systems were required to specify a Kh value for each topic for set-based evaluation withjust Highly Relevant documents.
In contrast with the 2007 and 2008 Relevance Feedback tasks, residual evaluation was not used this year,so participating teams were advised to include previously judged documents in their submitted result sets(if their system considered them possibly relevant). If this year’s sampling happened to draw documentsthat were previously judged, this year’s assessors would re-assess them (with no knowledge of the previousassessment), and just this year’s assessments would be used in this year’s evaluation. Past judgments hencewere not considered to be authoritative, but rather as one opinion of relevance for a sample of documents.This was intended to model the real-world issue that internally generated training data (e.g., generated locallyby an e-discovery service provider) may not perfectly match the final authority’s conception of relevance.
3.5 Submissions
4 research teams submitted a total of 10 runs for this year’s Batch task by the deadline of August 4, 2009.Participating teams could submit as many as 3 runs. The participating groups were EMC - CMA - R&D,

Open Text Corporation, University of Waterloo, and Ursinus College. (The submissions from Open Text werelabelled as “manual” because they were produced by the same individual who was involved in coordinatingthe task.) Please consult the papers from the participating teams for details of their submissions.
3.6 Reference Runs
For set-based measures, the tables include 4 reference runs: fullset09 (the entire set of documents in thecollection), oldnon09 (the set of documents judged non-relevant in previous years), oldrel09 (the set of doc-uments judged relevant in previous years), and refL09B (the set of documents matching the final negotiatedBoolean query).
3.7 Evaluation
Evaluation was done entirely with new judgments (not the training judgments). These new judgments aresometimes referred to as the “test qrels” or “test judgments.” As in previous years, it was not feasible tojudge all 6,910,192 documents for every test topic, so a deep sampling method was used to estimate thescores, as described below.
3.7.1 Pooling
As in the 2008 and 2009 Ad Hoc tasks, we formed a pool of documents for each topic consisting of all ofthe documents submitted by any of the 10 participant runs and the 4 reference runs. The inclusion of thefullset09 reference run meant that in practice all 6,910,192 documents in the collection were actually in thepool for every topic this year. The value-added of the other runs was that they affected the “hiRank” of eachdocument (i.e., its highest rank in any run), which affected the sampling probabilities as described below.
Additionally, the pools included all of the submitted and reference runs from 2006, 2007 and 2008 (exceptfor the random reference runs of 2007 and 2008). Again, the benefit of including these runs is that they wouldimpact the sampling probabilities (“priors”) so that the scoring of the past runs with the new judgmentswould tend to be more accurate (i.e., with narrower error bars) than they otherwise would be.
An issue discovered during pooling was that the training qrels for topics 7 and 51 included some docidsthat were not in the official XML version of the collection. (These are believed to have come from past expertruns that used the interactive Legacy Tobacco Document Library search engine, which was not limited to thesnapshot that we had obtained for the IIT CDIP version 1.0 collection.) These documents were dropped fromthe pools (reducing the number to the expected 6,910,192 for each topic); however, they were not droppeduntil after the “hiRank” was recorded, so they may have had a minor impact on the sampling probabilities.
3.7.2 Sampling
This year, the following formula was used for p(d), the probability of judging each document d in the poolfor a topic:
p(d) = min(1.0, ((1/5000)+(C/hiRank(d))))
where hiRank(d) is the earliest (i.e., best) rank at which any included run retrieved document d, and Cwas chosen so that the sum of all p(d) (for all documents d in the pool) was 2500 (which was the numberof documents that we expected could be judged). It turned out for two topics fewer than 2500 documentswere judged; in these cases the final probabilities were corrected as described below.
For the reference runs, which did not rank the documents, for hiRank purposes each document wasconsidered to be of rank equal to the number of documents in the run for that topic. For example, anydocument in fullset09 that was not in any other run would have been assigned a hiRank of 6,910,192.
For the 8 topics in which all 2500 documents were judged, the floor of 1/5000 in the formula implied thattypically at least 1 in every 5000 documents were judged, which is approximately the same as the coarsest

sampling for topic 104 of the Interactive task of the previous year (which also had 2500 documents judged,sampled from the entire collection).
The function of the C/hiRank(d) in the formula was to provide denser sampling of higher-ranked docu-ments to improve the accuracy of measures at shallow depths, e.g. K < 1000. The median C value turnedout to be about 6 (ranging from 3.9 to 9.5, see the Appendix of these proceedings for the C value for eachtopic). A C value of 6 (when all 2500 documents were judged) would imply that at any depth K ≥ 6 wewould expect to have at least the accuracy of 6 random sample points. But the floor of 1/5000 implied thatwe would have more accuracy for K > 30,000; e.g. for K=100,000, the selection of 1 in 5000 implies theaccuracy of 20 random sample points.
After the draw, the typical distribution of hiRanks in a sample of 2500 documents was found to beapproximately as follows (based on using topic 138 as the most typical example as it had the median C valueof 6.18):
10% were top-10 ranked (hiRank <= 10)10% had 10 < hiRank <= 10010% had 100 < hiRank <= 1,00010% had 1,000 < hiRank <= 20,00010% had 20,000 < hiRank <= 100,00010% had 100,000 < hiRank <= 500,00010% had 500,000 < hiRank <= 1,000,0008% had 1,000,000 < hiRank <= 1,500,000
22% were unsubmitted documents (i.e., hiRank=6,910,192)
3.7.3 Binning
The binning approach this year was a little different than that used in the Ad Hoc tasks of the past coupleyears to allow multiple assessors to contribute judgments for the same topic (a practice that we first triedin the 2008 Interactive task).
This year, the draw of 2500 documents for each topic was randomly divided into 10 bins of 250 documentseach. This approach would cause each bin to have approximately the same distribution of hiRanks as theinitial draw.
Typically 5 volunteer assessors were assigned to each topic, with each assessor asked to complete 2 bins.In a few cases, an assessor completed just 1 bin or contributed extra bins. Only fully completed bins werekept for this year’s official judgments. The result was that all 2500 documents were assessed for 8 of the 10topics; the exceptions were #51 (1500 documents assessed) and #89 (1250 documents assessed). For theselatter 2 topics, the judging probabilities in the official qrels were multiplied by 1500/2500 and 1250/2500respectively to factor in the probability of the drawn document being in a judged bin.
3.8 Relevance Judgments
As in the past couple of years, we primarily sought out second-year and third-year law students who would bewilling to volunteer as assessors. As in 2007 and 2008, the assessors used a Web-based platform developedby Ian Soboroff at NIST and hosted at the University of Maryland to view scanned documents and torecord their relevance judgments. The assessors made their judgments based on the scanned images of thedocuments, not the rendering in XML that the participant systems typically worked with.
New this year was that the assessors were given 10 examples each of documents previously judged highlyrelevant, as relevant but not highly relevant, and as non-relevant in past assessing of the topic (if pastassessing did not distinguish between highly relevant and relevant but not highly relevant, then just 10example relevant documents and 10 example non-relevant documents were given). These examples wereprovided in hopes of improving consistency with past assessments, but the assessors were expected to maketheir own judgment if a previously judged document happened to be selected again by the sampling. The
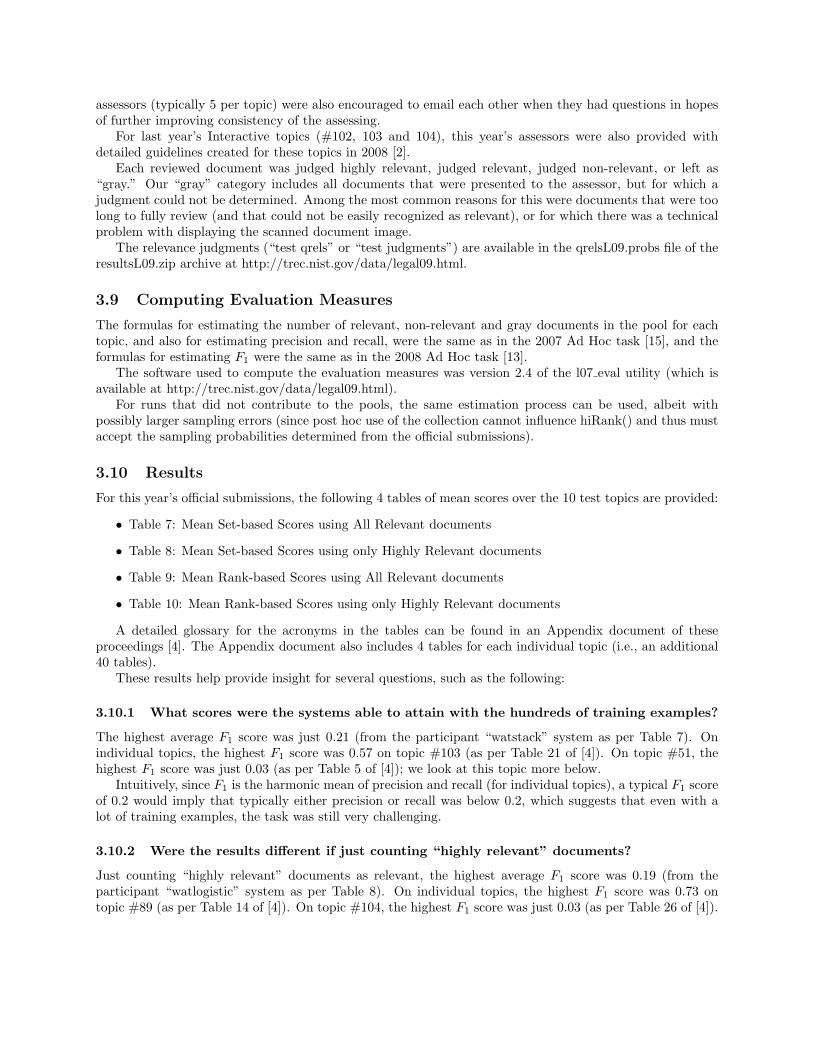
assessors (typically 5 per topic) were also encouraged to email each other when they had questions in hopesof further improving consistency of the assessing.
For last year’s Interactive topics (#102, 103 and 104), this year’s assessors were also provided withdetailed guidelines created for these topics in 2008 [2].
Each reviewed document was judged highly relevant, judged relevant, judged non-relevant, or left as“gray.” Our “gray” category includes all documents that were presented to the assessor, but for which ajudgment could not be determined. Among the most common reasons for this were documents that were toolong to fully review (and that could not be easily recognized as relevant), or for which there was a technicalproblem with displaying the scanned document image.
The relevance judgments (“test qrels” or “test judgments”) are available in the qrelsL09.probs file of theresultsL09.zip archive at http://trec.nist.gov/data/legal09.html.
3.9 Computing Evaluation Measures
The formulas for estimating the number of relevant, non-relevant and gray documents in the pool for eachtopic, and also for estimating precision and recall, were the same as in the 2007 Ad Hoc task [15], and theformulas for estimating F1 were the same as in the 2008 Ad Hoc task [13].
The software used to compute the evaluation measures was version 2.4 of the l07 eval utility (which isavailable at http://trec.nist.gov/data/legal09.html).
For runs that did not contribute to the pools, the same estimation process can be used, albeit withpossibly larger sampling errors (since post hoc use of the collection cannot influence hiRank() and thus mustaccept the sampling probabilities determined from the official submissions).
3.10 Results
For this year’s official submissions, the following 4 tables of mean scores over the 10 test topics are provided:
• Table 7: Mean Set-based Scores using All Relevant documents
• Table 8: Mean Set-based Scores using only Highly Relevant documents
• Table 9: Mean Rank-based Scores using All Relevant documents
• Table 10: Mean Rank-based Scores using only Highly Relevant documents
A detailed glossary for the acronyms in the tables can be found in an Appendix document of theseproceedings [4]. The Appendix document also includes 4 tables for each individual topic (i.e., an additional40 tables).
These results help provide insight for several questions, such as the following:
3.10.1 What scores were the systems able to attain with the hundreds of training examples?
The highest average F1 score was just 0.21 (from the participant “watstack” system as per Table 7). Onindividual topics, the highest F1 score was 0.57 on topic #103 (as per Table 21 of [4]). On topic #51, thehighest F1 score was just 0.03 (as per Table 5 of [4]); we look at this topic more below.
Intuitively, since F1 is the harmonic mean of precision and recall (for individual topics), a typical F1 scoreof 0.2 would imply that typically either precision or recall was below 0.2, which suggests that even with alot of training examples, the task was still very challenging.
3.10.2 Were the results different if just counting “highly relevant” documents?
Just counting “highly relevant” documents as relevant, the highest average F1 score was 0.19 (from theparticipant “watlogistic” system as per Table 8). On individual topics, the highest F1 score was 0.73 ontopic #89 (as per Table 14 of [4]). On topic #104, the highest F1 score was just 0.03 (as per Table 26 of [4]).
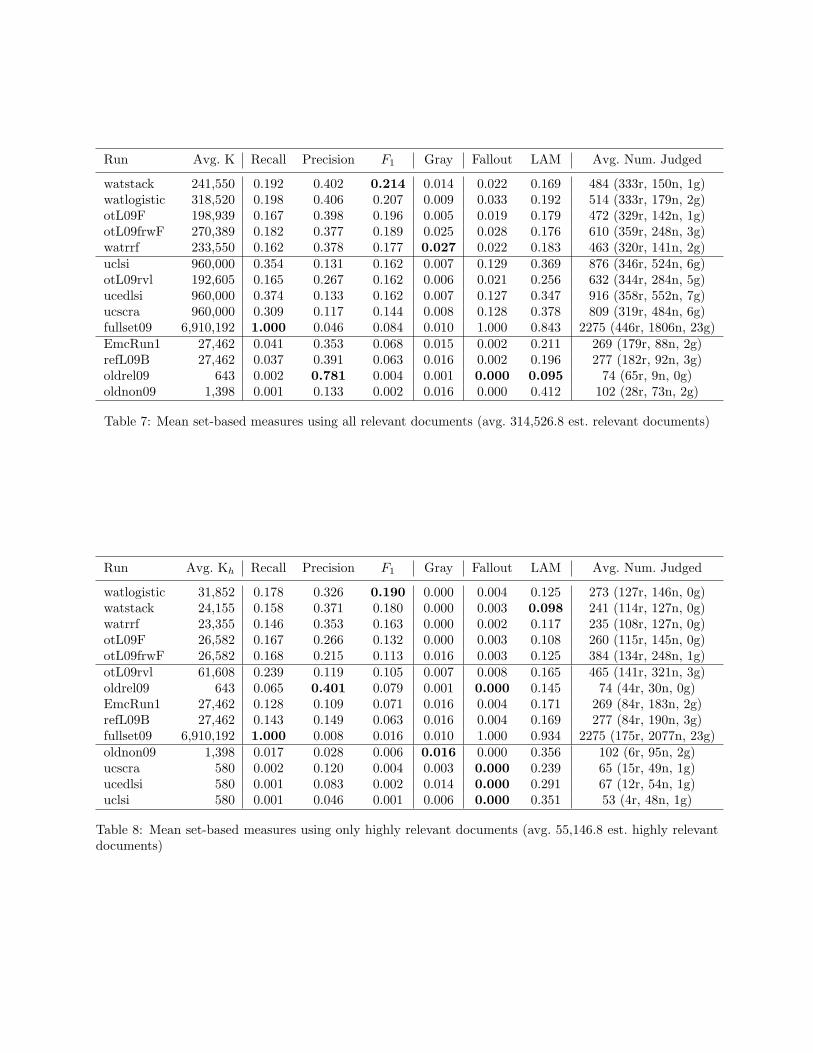
Run Avg. K Recall Precision F1 Gray Fallout LAM Avg. Num. Judged
watstack 241,550 0.192 0.402 0.214 0.014 0.022 0.169 484 (333r, 150n, 1g)watlogistic 318,520 0.198 0.406 0.207 0.009 0.033 0.192 514 (333r, 179n, 2g)otL09F 198,939 0.167 0.398 0.196 0.005 0.019 0.179 472 (329r, 142n, 1g)otL09frwF 270,389 0.182 0.377 0.189 0.025 0.028 0.176 610 (359r, 248n, 3g)watrrf 233,550 0.162 0.378 0.177 0.027 0.022 0.183 463 (320r, 141n, 2g)uclsi 960,000 0.354 0.131 0.162 0.007 0.129 0.369 876 (346r, 524n, 6g)otL09rvl 192,605 0.165 0.267 0.162 0.006 0.021 0.256 632 (344r, 284n, 5g)ucedlsi 960,000 0.374 0.133 0.162 0.007 0.127 0.347 916 (358r, 552n, 7g)ucscra 960,000 0.309 0.117 0.144 0.008 0.128 0.378 809 (319r, 484n, 6g)fullset09 6,910,192 1.000 0.046 0.084 0.010 1.000 0.843 2275 (446r, 1806n, 23g)EmcRun1 27,462 0.041 0.353 0.068 0.015 0.002 0.211 269 (179r, 88n, 2g)refL09B 27,462 0.037 0.391 0.063 0.016 0.002 0.196 277 (182r, 92n, 3g)oldrel09 643 0.002 0.781 0.004 0.001 0.000 0.095 74 (65r, 9n, 0g)oldnon09 1,398 0.001 0.133 0.002 0.016 0.000 0.412 102 (28r, 73n, 2g)
Table 7: Mean set-based measures using all relevant documents (avg. 314,526.8 est. relevant documents)
Run Avg. Kh Recall Precision F1 Gray Fallout LAM Avg. Num. Judged
watlogistic 31,852 0.178 0.326 0.190 0.000 0.004 0.125 273 (127r, 146n, 0g)watstack 24,155 0.158 0.371 0.180 0.000 0.003 0.098 241 (114r, 127n, 0g)watrrf 23,355 0.146 0.353 0.163 0.000 0.002 0.117 235 (108r, 127n, 0g)otL09F 26,582 0.167 0.266 0.132 0.000 0.003 0.108 260 (115r, 145n, 0g)otL09frwF 26,582 0.168 0.215 0.113 0.016 0.003 0.125 384 (134r, 248n, 1g)otL09rvl 61,608 0.239 0.119 0.105 0.007 0.008 0.165 465 (141r, 321n, 3g)oldrel09 643 0.065 0.401 0.079 0.001 0.000 0.145 74 (44r, 30n, 0g)EmcRun1 27,462 0.128 0.109 0.071 0.016 0.004 0.171 269 (84r, 183n, 2g)refL09B 27,462 0.143 0.149 0.063 0.016 0.004 0.169 277 (84r, 190n, 3g)fullset09 6,910,192 1.000 0.008 0.016 0.010 1.000 0.934 2275 (175r, 2077n, 23g)oldnon09 1,398 0.017 0.028 0.006 0.016 0.000 0.356 102 (6r, 95n, 2g)ucscra 580 0.002 0.120 0.004 0.003 0.000 0.239 65 (15r, 49n, 1g)ucedlsi 580 0.001 0.083 0.002 0.014 0.000 0.291 67 (12r, 54n, 1g)uclsi 580 0.001 0.046 0.001 0.006 0.000 0.351 53 (4r, 48n, 1g)
Table 8: Mean set-based measures using only highly relevant documents (avg. 55,146.8 est. highly relevantdocuments)
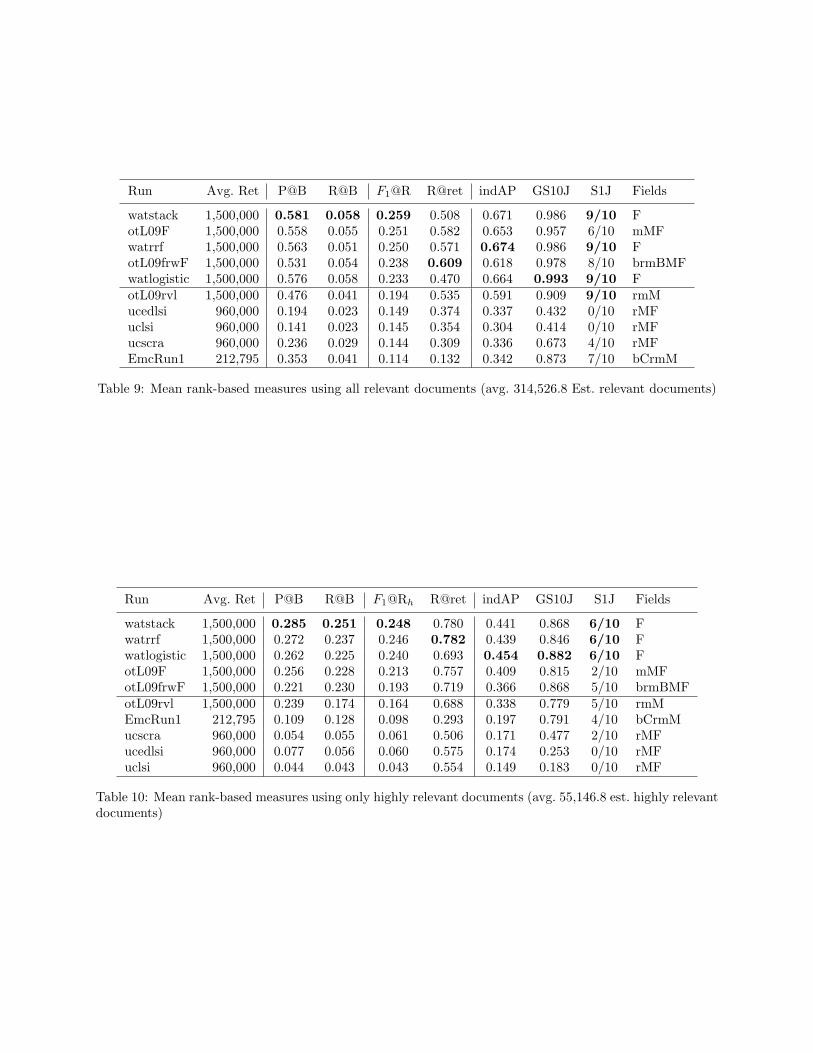
Run Avg. Ret P@B R@B F1@R R@ret indAP GS10J S1J Fields
watstack 1,500,000 0.581 0.058 0.259 0.508 0.671 0.986 9/10 FotL09F 1,500,000 0.558 0.055 0.251 0.582 0.653 0.957 6/10 mMFwatrrf 1,500,000 0.563 0.051 0.250 0.571 0.674 0.986 9/10 FotL09frwF 1,500,000 0.531 0.054 0.238 0.609 0.618 0.978 8/10 brmBMFwatlogistic 1,500,000 0.576 0.058 0.233 0.470 0.664 0.993 9/10 FotL09rvl 1,500,000 0.476 0.041 0.194 0.535 0.591 0.909 9/10 rmMucedlsi 960,000 0.194 0.023 0.149 0.374 0.337 0.432 0/10 rMFuclsi 960,000 0.141 0.023 0.145 0.354 0.304 0.414 0/10 rMFucscra 960,000 0.236 0.029 0.144 0.309 0.336 0.673 4/10 rMFEmcRun1 212,795 0.353 0.041 0.114 0.132 0.342 0.873 7/10 bCrmM
Table 9: Mean rank-based measures using all relevant documents (avg. 314,526.8 Est. relevant documents)
Run Avg. Ret P@B R@B F1@Rh R@ret indAP GS10J S1J Fields
watstack 1,500,000 0.285 0.251 0.248 0.780 0.441 0.868 6/10 Fwatrrf 1,500,000 0.272 0.237 0.246 0.782 0.439 0.846 6/10 Fwatlogistic 1,500,000 0.262 0.225 0.240 0.693 0.454 0.882 6/10 FotL09F 1,500,000 0.256 0.228 0.213 0.757 0.409 0.815 2/10 mMFotL09frwF 1,500,000 0.221 0.230 0.193 0.719 0.366 0.868 5/10 brmBMFotL09rvl 1,500,000 0.239 0.174 0.164 0.688 0.338 0.779 5/10 rmMEmcRun1 212,795 0.109 0.128 0.098 0.293 0.197 0.791 4/10 bCrmMucscra 960,000 0.054 0.055 0.061 0.506 0.171 0.477 2/10 rMFucedlsi 960,000 0.077 0.056 0.060 0.575 0.174 0.253 0/10 rMFuclsi 960,000 0.044 0.043 0.043 0.554 0.149 0.183 0/10 rMF
Table 10: Mean rank-based measures using only highly relevant documents (avg. 55,146.8 est. highly relevantdocuments)

So the picture overall looked similar if just counting highly relevant documents. Below, we just focus on theresults counting “all relevant” documents, particularly as half of the topics did not actually have trainingexamples distinguishing highly relevant from other relevant documents.
3.10.3 Would the scores have been much higher if the systems had thresholded their rankedlists optimally?
For the F1 measure, it typically is best to threshold the ranked list at depth R, where R is the (estimated)number of relevant documents. The highest average F1@R score was still just 0.26 (from the participant“watstack” system as per Table 9). On individual topics, the highest F1@R score was 0.58 on topic #103(as per Table 23 of [4]). On topic #51, the highest F1@R score was just 0.03 (as per Table 7 of [4]) which welook at more below. So, at least for the top-scoring systems, better thresholding would not have dramaticallyincreased the F1 scores.
Note that, at depth R, precision, recall and F1 are all the same. (Put another way, the popular “R-Precision” measure of ranked retrieval is equivalent to “F1@R” and also “Recall@R”.) Hence the F1@Rmeasure is easy to interpret. For example, a typical F1@R of 0.2 indicates that, even if a system’s rankedlist was thresholded optimally for the F1 measure, the resulting set would typically have both precision andrecall of 0.2.
3.10.4 Do we know if the systems did better than just randomly picking documents?
If the entire set of 6,910,192 documents had been retrieved, the average F1 score would have been just0.08 (as per the “fullset09” reference run listed in Table 7). Most of the participant systems substantiallyoutscored the fullset09 reference run.
The fullset09 result represents the highest F1 that one could expect from a random run (because a randomrun would be expected to have approximately the same precision as fullset09 and could not produce higherrecall than fullset09).
3.10.5 How did this year’s Batch systems do compared to last year’s Interactive submissions?
Table 11 shows the set-based scores for topic #103 using all relevant documents. For this topic, severaladditional reference runs are available, including the 5 runs of last year’s Interactive task. (The Interactiveruns are renamed to have an “int08” prefix to emphasize that they were produced under different conditionsthan this year’s runs. Most notably, the previous relevance assessments were not available as an input forlast year’s Interactive runs. More details of these runs and the other additional reference runs are in theglossary of the Appendix [4].) We see that, with the 6500 relevance judgments as an input, some of thisyear’s submissions were able to achieve the same or higher F1 as any of last year’s Interactive submissions.This is an encouraging result for feedback techniques, albeit based on just one topic.
Part of why the Batch systems scored higher in F1 on topic #103 is that they chose a larger K value(e.g., 1 million) than the highest-scoring Interactive submission (608,807 documents), which was beneficial inpart because the estimated numbers of relevant documents was higher with the new judgments (1,046,834)than the training judgments (786,862). (The training judgments used the post-adjudication judgments from2008. In the pre-adjudication judgments of 2008, the estimated number of relevant documents was 914,528,which is closer to the estimate based on the new judgments, which did not go through an appeal process.)
Since the Batch systems ranked their documents, we can calculate what their precision, recall and F1
would have been if they had set K=608,807 (the size of the highest-scoring Interactive submission set). (Thiscalculation is done by re-running the l07 eval utility for the system with K set to 608,807 for topic #103.)For instance, we find for the highest-scoring Batch system of Table 11 (the “watstack” system) that, in itstop-ranked 608,807 documents, it had a precision of 0.71, recall of 0.43 and F1 of 0.54, which are all slightlyhigher than the highest-scoring Interactive submission (which scored, on this year’s judgments, a precisionof 0.69, recall of 0.40 and F1 of 0.51). Hence the higher F1 scores of some of the Batch runs is not just

Run K Recall Precision F1 Gray Fallout LAM Num. Judged
watstack 1,000,000 0.563 0.586 0.574 0.000 0.072 0.198 976 (738r, 238n, 0g)watrrf 1,000,000 0.556 0.569 0.562 0.000 0.077 0.205 1004 (749r, 254n, 1g)watlogistic 1,000,000 0.536 0.583 0.559 0.000 0.070 0.203 910 (702r, 208n, 0g)int08H 608,807 0.399 0.694 0.507 0.000 0.032 0.183 724 (583r, 140n, 1g)otL09frwF 1,118,530 0.513 0.500 0.506 0.000 0.094 0.238 1138 (787r, 350n, 1g)otL09F 865,548 0.431 0.539 0.479 0.000 0.067 0.236 1035 (750r, 285n, 0g)int08A 837,889 0.328 0.416 0.366 0.000 0.084 0.302 1206 (749r, 455n, 2g)otL09rvl 397,145 0.239 0.660 0.351 0.000 0.022 0.213 872 (668r, 204n, 0g)xrefL08P 280,383 0.199 0.745 0.314 0.000 0.012 0.184 780 (616r, 163n, 1g)ucscra 1,500,000 0.385 0.258 0.309 0.009 0.201 0.388 1130 (642r, 482n, 6g)uclsi 1,500,000 0.343 0.244 0.285 0.006 0.194 0.404 1157 (652r, 499n, 6g)ucedlsi 1,500,000 0.324 0.244 0.279 0.007 0.182 0.406 1125 (627r, 492n, 6g)fullset09 6,910,192 1.000 0.154 0.267 0.012 1.000 0.701 2500 (916r, 1564n, 20g)xrefL08C 140,680 0.107 0.782 0.189 0.000 0.005 0.176 637 (514r, 122n, 1g)int08C 175,455 0.108 0.706 0.188 0.000 0.008 0.207 559 (460r, 98n, 1g)EmcRun1 80,225 0.051 0.733 0.095 0.000 0.003 0.201 522 (423r, 98n, 1g)refL09B 80,225 0.049 0.714 0.091 0.000 0.004 0.209 494 (394r, 100n, 0g)int08B 67,334 0.036 0.570 0.068 0.000 0.005 0.267 240 (205r, 35n, 0g)xrefL08D 35,290 0.026 0.673 0.050 0.000 0.002 0.227 329 (266r, 62n, 1g)int08P 25,816 0.018 0.888 0.036 0.000 0.000 0.131 184 (155r, 29n, 0g)oldrel09 2,981 0.001 0.527 0.003 0.000 0.000 0.288 12 (9r, 3n, 0g)oldnon09 3,440 0.000 0.000 0.000 0.000 0.001 0.973 6 (0r, 6n, 0g)
Table 11: Set-based measures for topic 103 using all relevant documents (1,046,833.8 est. relevant documents)
from choosing a larger K value. (Note that we have not checked whether any of these F1 differences arestatistically significant.)
As a tangential remark, the preceding result suggests that the F1 score can actually be fairly stable overa wide range of threshold settings. For example, for the “watstack” system, increasing K from 608,807 to(its actual setting of) 1,000,000 decreases its precision by 12 points (from 0.71 to 0.59), increases its recallby 13 points (from 0.43 to 0.56), but shifts its F1 by only 3 points (from 0.54 to 0.57).
It should be kept in mind that topic #103 was anticipated to be the topic for which feedback had thebest chance of success, since this topic had the most training examples (6500, including 2981 examples ofrelevant documents), and the quality of the training examples was presumably improved by the adjudicationprocess that was part of the 2008 Interactive task.
3.10.6 Why were the F1 scores so low for topic #51?
For topic #51, the systems were given 88 examples of relevant documents (and 1259 examples of non-relevantdocuments). So why did no system attain an F1 score above 0.03?
As mentioned earlier, the main issue was not picking the threshold K, since the highest F1@R score wasstill just 0.03.
One clue is that the training judgments for topic #51 produced an estimate of 95 relevant documents forthe topic, whereas the new judgments produce an estimate of 26,404 relevant documents.
Most of the contribution to the estimate of 26,404 came from just 3 documents which were judgedrelevant: afr23a00 (weight 8295.1, only retrieved by fullset09), azt40e00 (weight 8010.9, hiRank 791,311),and bga62e00 (weight 7983.5, hiRank 726,803). (The most deeply sampled relevant documents for each topicare listed in an Appendix document of these proceedings [6].)

Based on our own look at these documents, it appears that these 3 judgments were “false positives.” Eachcame from a different assessor (there were 3 assessors for this topic). Each assessor contributed 500 judgments(for a total of 1500 judged documents for this topic). Even if the assessing was 99% accurate, misjudging1% of a collection of 7 million documents could lead to the estimated number of relevant documents beingoff by several thousand. For topics with large numbers of relevant documents (e.g., 100,000+), such errorswould likely be just minor noise, but for “low-density” topics (i.e., topics with small true numbers of relevantdocuments, which appears to be the case for topic #51), these errors can be dominant for measures, suchas recall and F1, that are based on the estimated total number of relevant documents in the collection.(Estimates of precision, however, would typically be less affected by a small error rate, though the accuracyof most measures of course is still subject to sampling error.)
We have seen evidence in the past of this kind of issue. For instance, we reported last year [13] thatthe assessing of the “random run” appeared to have a lot of false positives (approximately 1%). In theInteractive task of 2008, almost half of relevant judgments from the “All-N” stratum for Topic 103 wereoverturned on appeal (51 out of 111 as per Table 12 of [13]) and over all the strata the appeals reduced theestimated number of relevant documents from 914,528 to 786,862 (a reduction of 127,666, which is almost2% of the full collection).
Our past Ad Hoc evaluations were less susceptible to this issue because the full collection was not pooled,and the evaluation essentially ignored documents that were not in the pool. (Unlike traditional TRECevaluations, our measures do not assume unpooled documents are non-relevant, but typically behave as ifthey had not been in the set being evaluated.) Of course, one could simulate last year’s approach post-hocby discarding judged documents of hiRank greater than 100,000 and then check the impact on the F1 scores(but such a study is beyond the scope of this paper).
There was discussion at the conference about what to do in the future for this issue. One suggestionwas to reassess high-weight relevant documents before releasing the results when overturning a few of themcould make a dramatic difference.
Note that this issue does not necessarily affect the relative mean scores substantially. Indeed, if the issuedampens the scores for a topic (placing them all in a narrow range such as 0.00 to 0.03), the topic will havelittle impact on the relative mean scores over all the topics.
3.10.7 What scores would have resulted from just submitting the example relevant docu-ments?
If just the relevant documents from the training qrels had been submitted, the average F1 score would havebeen just 0.004 (as per the “oldrel09” reference run listed in Table 7). The average recall of the relevanttraining examples was just 0.2%. This result also suggests that, if we had used “residual” evaluation as insome past years (i.e., discarded the training examples before scoring the runs) it would not have affected thescores much.
3.10.8 Was there any overlap in the training and new judgments?
For all 10 topics, there were some training documents that were in the new judging samples (which isunsurprising because the “oldrel09” and “oldnon09” reference runs were in the pools which influenced the“hiRank” of these documents).
Hence some preliminary indications of assessor consistency can be gleaned from the tables. For example,of documents previously judged relevant (oldrel09 run), Table 7 shows that the estimated precision was just0.78 this year (using all relevant documents). It also shows that, on average, 74 documents per topic thathad previously been judged as relevant were re-assessed, with an average of 65 of them again being judgedas relevant. The tables also contain results for past judged non-relevant documents (oldnon09).
Consistency results for individual topics are available in an Appendix of these proceedings [4], includingseparate results for documents previously judged as highly relevant and as relevant but not as highly relevant(oldHrel09 and oldOrel09 reference runs) for the 5 topics whose past judgments distinguished between highlyrelevant and other relevant documents.
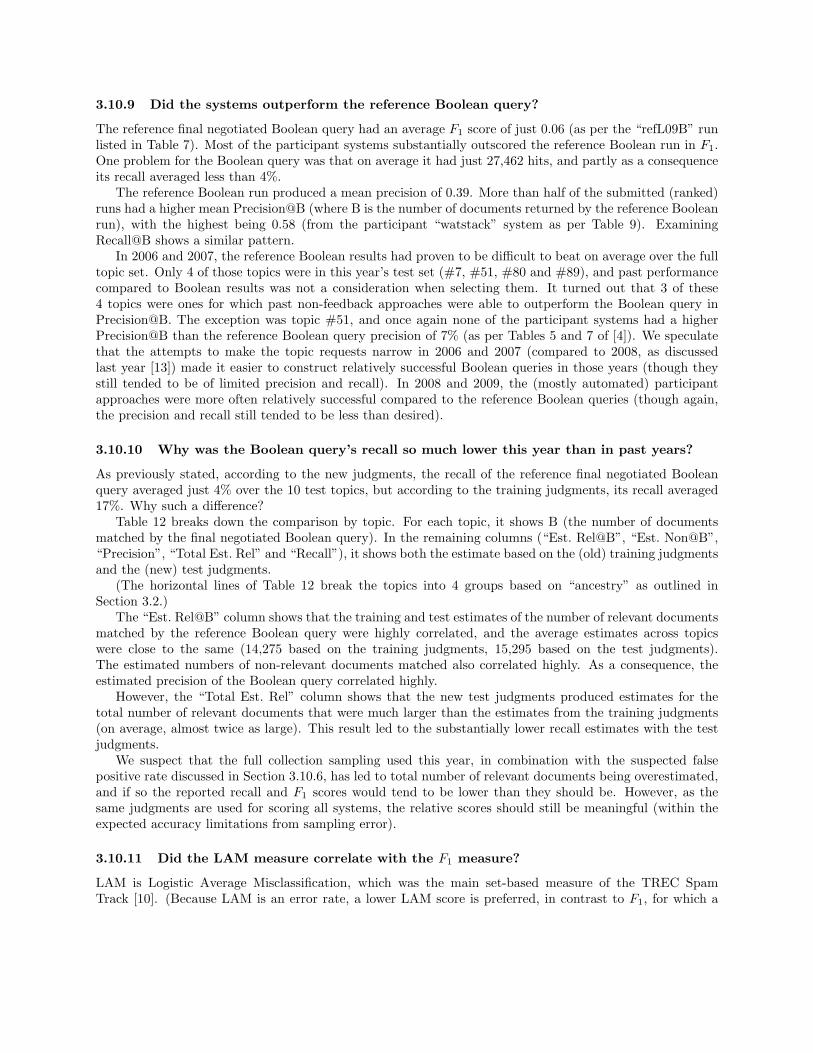
3.10.9 Did the systems outperform the reference Boolean query?
The reference final negotiated Boolean query had an average F1 score of just 0.06 (as per the “refL09B” runlisted in Table 7). Most of the participant systems substantially outscored the reference Boolean run in F1.One problem for the Boolean query was that on average it had just 27,462 hits, and partly as a consequenceits recall averaged less than 4%.
The reference Boolean run produced a mean precision of 0.39. More than half of the submitted (ranked)runs had a higher mean Precision@B (where B is the number of documents returned by the reference Booleanrun), with the highest being 0.58 (from the participant “watstack” system as per Table 9). ExaminingRecall@B shows a similar pattern.
In 2006 and 2007, the reference Boolean results had proven to be difficult to beat on average over the fulltopic set. Only 4 of those topics were in this year’s test set (#7, #51, #80 and #89), and past performancecompared to Boolean results was not a consideration when selecting them. It turned out that 3 of these4 topics were ones for which past non-feedback approaches were able to outperform the Boolean query inPrecision@B. The exception was topic #51, and once again none of the participant systems had a higherPrecision@B than the reference Boolean query precision of 7% (as per Tables 5 and 7 of [4]). We speculatethat the attempts to make the topic requests narrow in 2006 and 2007 (compared to 2008, as discussedlast year [13]) made it easier to construct relatively successful Boolean queries in those years (though theystill tended to be of limited precision and recall). In 2008 and 2009, the (mostly automated) participantapproaches were more often relatively successful compared to the reference Boolean queries (though again,the precision and recall still tended to be less than desired).
3.10.10 Why was the Boolean query’s recall so much lower this year than in past years?
As previously stated, according to the new judgments, the recall of the reference final negotiated Booleanquery averaged just 4% over the 10 test topics, but according to the training judgments, its recall averaged17%. Why such a difference?
Table 12 breaks down the comparison by topic. For each topic, it shows B (the number of documentsmatched by the final negotiated Boolean query). In the remaining columns (“Est. Rel@B”, “Est. Non@B”,“Precision”, “Total Est. Rel” and “Recall”), it shows both the estimate based on the (old) training judgmentsand the (new) test judgments.
(The horizontal lines of Table 12 break the topics into 4 groups based on “ancestry” as outlined inSection 3.2.)
The “Est. Rel@B” column shows that the training and test estimates of the number of relevant documentsmatched by the reference Boolean query were highly correlated, and the average estimates across topicswere close to the same (14,275 based on the training judgments, 15,295 based on the test judgments).The estimated numbers of non-relevant documents matched also correlated highly. As a consequence, theestimated precision of the Boolean query correlated highly.
However, the “Total Est. Rel” column shows that the new test judgments produced estimates for thetotal number of relevant documents that were much larger than the estimates from the training judgments(on average, almost twice as large). This result led to the substantially lower recall estimates with the testjudgments.
We suspect that the full collection sampling used this year, in combination with the suspected falsepositive rate discussed in Section 3.10.6, has led to total number of relevant documents being overestimated,and if so the reported recall and F1 scores would tend to be lower than they should be. However, as thesame judgments are used for scoring all systems, the relative scores should still be meaningful (within theexpected accuracy limitations from sampling error).
3.10.11 Did the LAM measure correlate with the F1 measure?
LAM is Logistic Average Misclassification, which was the main set-based measure of the TREC SpamTrack [10]. (Because LAM is an error rate, a lower LAM score is preferred, in contrast to F1, for which a

Topic B Est. Rel@B Est. Non@B Precision Total Est. Rel Recall
7 648 20.8, 281.7 446.0, 471.4 0.04, 0.37 1445.2, 188571.3 0.01, 0.0051 7216 84.7, 459.0 7138.0, 5876.5 0.01, 0.07 94.7, 26404.4 0.89, 0.0280 331 195.1, 162.1 117.0, 42.6 0.63, 0.79 46485.8, 227596.2 0.00, 0.0089 3636 223.2, 471.2 2495.1, 3592.0 0.08, 0.12 11738.8, 21451.7 0.02, 0.02102 86742 55706.1, 69507.3 24657.7, 28256.3 0.69, 0.71 562402.2, 518643.9 0.10, 0.13103 80225 58259.0, 50804.1 21454.0, 20347.1 0.73, 0.71 786862.0, 1046833.8 0.07, 0.05104 2680 81.5, 230.1 879.4, 2294.8 0.08, 0.09 45613.5, 449829.6 0.00, 0.00105 36549 4568.1, 4701.7 25161.7, 33304.5 0.15, 0.12 34425.0, 105960.3 0.13, 0.04138 16279 4607.6, 5248.3 7718.0, 9026.3 0.37, 0.37 18633.3, 98654.8 0.25, 0.05145 40315 19003.7, 21087.5 16725.1, 17262.6 0.53, 0.55 91790.9, 461322.3 0.21, 0.05Avg. 27462 14275.0, 15295.3 10679.2, 12047.4 0.33, 0.39 159949.1, 314526.8 0.17, 0.04
Table 12: Comparison of the training and test judgment results for the reference Boolean query
higher score is preferred.) LAM is the logit-average of ‘1-Recall’ and ‘Fallout’ (after smoothing these inputswith an “epsilon” of 0.5 to prevent 0 or 1 inputs; e.g., for ‘1-Recall’, instead of 1-(r/R), use 1-((r+ε)/(R+2ε)),and for ‘Fallout’, instead of n/N, use (n+ε)/(N+2ε)). The logit-average tends to emphasize whichever inputis closer to a 0 or a 1 (or equivalently, whichever is further from 0.5).
In our experiments, LAM favored different systems than F1. LAM typically favored the highest-precisionresult, which typically was a small set of low recall and hence low F1. In particular, the best LAM score onaverage was from just submitting the set of example relevant documents, which had a recall of just 0.2% (asper the “oldrel09” listing in Table 7).
For e-Discovery, the F1 measure appears to favor the more desirable results. F1 encourages both recalland precision and severely penalizes a low score in either of these components.
3.10.12 What were the most important results from the Batch task this year?
The biggest contribution from the Batch task would be that 10 new standard test topics are now availablefor systems to gauge their effectiveness at making use of training examples for discovery requests.
Perhaps the most encouraging result was that, by making use of the training examples, some of theautomated systems were able to attain at least the same levels of effectiveness as the Interactive submissionsof the previous year (which did not have the advantage of the training examples). Of course, last yearwas our first year of collecting large-scale interactive results, there were only a handful of submissions, andthese were just on a small subset of the topics. This year’s Interactive task has collected the results ofinteractive approaches for several more topics (on a different collection), which should enable future studiesto investigate whether or not this year’s Batch task result is typical.
An evaluation issue encountered with the full-collection sampling used this year was that a small falsepositive rate in the assessing appears to have substantially dampened the reported recall and F1 scores forlow-density topics. It would be advisable for future studies to anticipate this issue, either by preferring high-density topics, or perhaps by scheduling up front a re-assessment phase for high-weight documents that cansubstantially affect the scoring (perhaps even before releasing pre-adjudication results, if the task includesan appeal process, such as the Interactive task of the most recent two years).
4 Correction to 2008 Assessor Consistency Study
Last year’s track overview paper [13] reported the results of a small assessor consistency study which wasconducted as part of the Relevance Feedback task of the TREC 2008 Legal Track. For the study, a reference“oldrel08” run was created by randomly choosing 10 documents from the relevant documents in the training

Topic Previously Judged Relevant (oldrel08Fixed) Prev. Judged Non-relevant (oldnon08)
14 (2006-A-9) tot=10, hrel=4, orel=1, non=3, gr=2 tot=10, hrel=0, orel=0, non=10, gr=028 (2006-C-4) tot=10, hrel=9, orel=0, non=1, gr=0 tot=10, hrel=3, orel=1, non=6, gr=031 (2006-C-7) tot=10, hrel=6, orel=3, non=1, gr=0 tot=10, hrel=1, orel=1, non=8, gr=036 (2006-D-3) tot=10, hrel=0, orel=7, non=3, gr=0 tot=10, hrel=0, orel=0, non=10, gr=047 (2006-E-6) tot=6, hrel=0, orel=2, non=4, gr=0 tot=10, hrel=0, orel=2, non=8, gr=060 (2007-A-9) tot=4, hrel=2, orel=2, non=0, gr=0 tot=10, hrel=1, orel=2, non=7, gr=073 (2007-B-5) tot=10, hrel=1, orel=0, non=9, gr=0 tot=10, hrel=1, orel=3, non=6, gr=079 (2007-C-1) tot=9, hrel=4, orel=3, non=2, gr=0 tot=10, hrel=1, orel=2, non=7, gr=080 (2007-C-2) tot=10, hrel=0, orel=8, non=2, gr=0 tot=10, hrel=0, orel=2, non=8, gr=083 (2007-C-5) tot=10, hrel=0, orel=4, non=6, gr=0 tot=10, hrel=0, orel=0, non=10, gr=085 (2007-C-7) tot=9, hrel=0, orel=0, non=9, gr=0 tot=10, hrel=0, orel=1, non=9, gr=089 (2007-D-1) tot=8, hrel=2, orel=6, non=0, gr=0 tot=10, hrel=0, orel=1, non=9, gr=0
Totals tot=106, hrel=28, orel=36, non=40, gr=2 tot=120, hrel=7, orel=15, non=98, gr=0
Table 13: Consistency of previous and new judgments for the 12 topics of the TREC 2008 Legal TrackRelevance Feedback task (tot=total, hrel=highly relevant, orel=other relevant, non=non-relevant, gr=gray).
judgments for each topic (or all of the relevant documents for the topic if there were fewer than 10). Similarly,a reference “oldnon08” run was created by randomly choosing 10 documents from the non-relevant documentsin the training judgments for the topic. These (up to 20) documents were then included in the set of (typically400) documents judged by the new assessors in 2008 (who were not told which documents had been judgedbefore). The results of the new assessors’ judgments of the training documents were summarized in Table 7of last year’s track overview paper [13].
A bug was later found in how the “oldrel08” run was produced. The random sample of 10 documentswas taken not just from the past relevant documents for the topic, but also from the past gray documents.This bug caused gray documents to be in “oldrel08” for 4 of the 12 topics (6 gray documents were in oldrel08for topic #60, 1 for #79, 1 for #85, and 2 for #89). The bug in the ‘relsubset’ option of l07 eval.c wasdiscovered while producing the “oldrel09” run for the 2009 Batch task and was fixed on Aug 9, 2009, in timefor the 2009 task.
(The bug was that the ‘relsubset’ option of l07 eval.c identified relevant documents in the input qrelsas any document with a non-zero judgment label. This heuristic was sufficient for correctly producing the“oldrel07” run when the option was first added in 2007, but in 2008 the training qrels started to include“gray” documents which were labeled as -1 or -2. The fix in 2009 was just to consider the labels of 1 or 2 asrelevant.)
The corrected version of last year’s Table 7 is presented herein in Table 13. For this corrected table, theoldrel08 run was replaced with a subset called “oldrel08Fixed” which omits the unintended gray documents.The “Previously Judged Relevant” column shows how the new assessor in 2008 judged the (up to) 10documents that were judged relevant when the topic was used in the 2006 or 2007 Ad Hoc task (as perthe oldrel08Fixed run). The “Prev. Judged Non-relevant” column shows the same information for the 10documents previously judged non-relevant (as per the oldnon08 run). The labels are “tot” for total judged(which was 10 except when less than 10 relevant documents were in oldrel08Fixed for the topic), “hrel” forhighly relevant, “orel” for other relevant, “non” for non-relevant, and “gr” for gray.
Last year’s paper stated that 58% of previously judged relevant documents were judged relevant again in2008; the corrected number is 62% (based on ((28+36)/(106-2))). As stated last year, almost half of these(44%) were judged highly relevant (note that before 2008, the “highly relevant” category was not available).Also, as stated last year, 18% of previously judged non-relevant documents were judged relevant in 2008;note that these non-relevant documents may have been rated highly by past search engines (which would

Topic Previously Judged Relevant (oldrel07) Prev. Judged Non-relevant (oldnon07)
7 (2006-A-2) tot=25, rel=6, non=18, gr=1 tot=25, rel=0, non=25, gr=08 (2006-A-3) tot=25, rel=19, non=6, gr=0 tot=25, rel=8, non=17, gr=013 (2006-A-9) tot=25, rel=9, non=13, gr=3 tot=25, rel=0, non=25, gr=026 (2006-C-2) tot=25, rel=14, non=11, gr=0 tot=25, rel=5, non=18, gr=227 (2006-C-3) tot=25, rel=22, non=3, gr=0 tot=25, rel=0, non=25, gr=030 (2006-C-6) tot=25, rel=17, non=8, gr=0 tot=25, rel=0, non=25, gr=034 (2006-D-1) tot=25, rel=23, non=2, gr=0 tot=25, rel=4, non=21, gr=037 (2006-D-4) tot=25, rel=19, non=6, gr=0 tot=25, rel=6, non=18, gr=145 (2006-E-4) tot=25, rel=12, non=13, gr=0 tot=25, rel=0, non=23, gr=251 (2006-E-10) tot=25, rel=16, non=8, gr=1 tot=25, rel=1, non=23, gr=1
Totals tot=250, rel=157, non=88, gr=5 tot=250, rel=24, non=220, gr=6
Table 14: Consistency of previous and new Judgments for the 10 topics of the TREC 2007 Legal TrackRelevance Feedback task (tot=total, rel=relevant, non=non-relevant, gr=gray).
have boosted their chance of being in the previous judging pool in the first place).In the corrected version of the table, for the previously judged relevant documents, we now see full
agreement for two of the topics (topics #60 and #89). For the previously judged non-relevant documents,there are 3 topics for which both assessors agreed that all 10 documents were non-relevant (topics #14, #36and #83). It is still in the case in the corrected version of the table that there were 2 topics (#73 and#85) for which the assessor in 2008 found that more of the previously judged non-relevant documents wererelevant than of the previously judged relevant documents.
Last year’s paper noted that “Past assessor agreement studies typically have found a lot of assessordisagreements, but generally retrieval systems are rated similarly regardless of which assessor’s judgmentsare used [12]. We have not to date attempted to quantify whether our levels of disagreement are more orless than the norm. Note that none of these double-assessed documents were used in [the 2008] evaluation(as residual evaluation excludes previously judged documents).”
4.1 Additional Data from the 2007 Assessor Consistency Study
An analogous assessor consistency study was also conducted in the Relevance Feedback task of the TREC2007 Legal Track, as per the oldrel07 and oldnon07 runs described in the 2007 track overview paper [15].Although fewer topics were assessed (10 topics instead of 12), the random samples were larger (25 relevantand 25 non-relevant documents per topic instead of just 10 each).
Unfortunately, the 2007 track overview paper only reported the results for 3 of the 10 topics (in Table 3of [15] as part of the Interactive task reporting that year) and it did not remark on the results. Here wereport the data for all 10 topics in Table 14. We find that 64% of the documents judged relevant in 2006were again judged relevant in 2007 (from (157/(250-5))), and just 10% of the documents judged non-relevantwere judged relevant in 2007. These numbers (64% and 10%) are similar to the corresponding numbers fromthe aforementioned 2008 study (62% and 18% respectively). Note that there were differences in the detailsof the studies of the two years; for example, in 2008, the assessors distinguished ‘highly relevant’ and ‘otherrelevant’ judgments, whereas in 2007, only the ‘relevant’ category was used.
4.2 2009 Assessor Consistency Study
More assessor consistency data is available from the 2009 Batch Task described earlier in this paper. Insteadof a fixed size random sample of past judged relevant and non-relevant documents, the 2009 results are justbased on the overlap in documents selected for judging. The 2009 results include not just an oldrel09 and

oldnon09 run, but also oldHrel09 and oldOrel09 runs for some topics. More details are in Section 3.10.8 ofthis paper.
5 Conclusion
Our work with construction of a test collection based on nearly 7 million scanned documents is now complete,with relevance judgments for a total of 109 richly structured topics. Our efforts to construct a new testcollection based on email have, however, only just begin. We now have relevance judgments for sevenrichly structured topics that can be used to support development of future systems, and we plan to judgerelevance for additional topics in 2010. As noted above (Section 2.2.1), our plan for 2010 has been todevelop, in collaboration with the EDRM Data Set Project [1] and ZL Technologies, a new version of theEnron collection that would be free of the known issues with the 2009 collection. We have, at the time of thewriting of this overview, followed through on that plan, and can report that participants in the 2010 LegalTrack are already working with the new collection.
The general design of the 2010 Legal Track has emerged from our discussions at the TREC conferencein 2009. In order to make the best use of available assessment resources, we expect to focus exclusively onthe email collection, using it as a basis for both the Interactive task and, as a successor to the Batch task,a newly designed Learning task. We plan to create new topics for the Interactive task. We continue to beinterested in issues of evaluation measure design and test collection reusability, and we welcome suggestionsfor task designs that would facilitate experiments addressing those issues, and others that are of interest totrack participants.
Acknowledgments
This track would not have been possible without the efforts of a great many people. Our heartfelt thanksagain go to Ian Soboroff for creating and maintaining the relevance assessment system used by both the Batchand Interactive tasks this year for different document collections; to Venkat Rangan for obtaining the Enronemails and converting them into more easily used forms; to the dedicated group of pro bono relevance assessorsand the pro bono coordinators at participating law schools; to Macyl Burke (of ACT Litigation Services)and Brandon M. Mack (of BIA) for coordinating their firms’ contribution to the assessment process; to TomGreiff for coordinating the contributions of the “Jerusalem team” of assessors; to Christopher Boehning, RossGotler and Charlene Jones, from the law firm of Paul, Weiss, Rifkind, Wharton & Garrison, and to MauraGrossman, from Wachtell, Lipton, Rosen & Katz, for their invaluable assistance in complaint drafting andtopic formulation for this year’s Interactive task; to our dedicated topic authorities for this year’s Interactivetask, including Art Bieser (Hunton & Williams), Christopher Boehning, Michael Roman Geske (AphelionLegal Solutions), Maura Grossman, Howard Nicols (Squire, Sanders, & Dempsey), David Stanton (PillsburyWinthrop Shaw Pittman), and K. Krasnow Waterman (LawTechIntersect); and finally, to Richard Braman,Executive Director of The Sedona Conference R©, for his continued support of the TREC Legal Track.

A Sampling & Assessment Tables—Interactive Task
In this appendix, we present tables that summarize, for each of the seven Interactive topics, the results ofthe sampling and assessment process followed in the the 2009 exercise. Each table shows: (i) total messagesin each stratum (in the full collection); (ii) total messages sampled from each stratum; (iii) total sampledmessages observed to be assessable; (iv) total sampled messages observed to be assessable and relevant (pre-adjudication); and (v) total sampled messages observed to be assessable and relevant (post-adjudication).It is on the basis of the data contained in these tables that we arrived at the estimates of the message-levelrecall, precision, and F1 attained in each run.
Each table is structured as follows. The leftmost columns represent the relevance values (R = Relevant;N = Not Relevant) from the participant submissions that define each stratum. The right-hand columns showthe counts of messages in each stratum; more specifically, the columns show the following data:
N = total messages in the stratum;
n = total messages sampled from the stratum;
a = total sampled messages observed to be assessable;
r1 = total sampled messages observed to be assessable and relevant (pre-adjudication);
r2 = total sampled messages observed to be assessable and relevant (post-adjudication).
The tables for the seven Interactive topics follow.
Stratum Counts (Messages)
CB CS UP UW N n a r1 r2
R R R R 101 16 15 12 15R R R N 7 3 3 1 0R R N R 188 29 29 21 27R R N N 74 12 12 4 1
R N R R 4 2 2 1 2R N R N 11 2 2 1 0R N N R 31 4 4 2 4R N N N 48 7 6 3 0
N R R R 108 18 17 15 17N R R N 25 4 4 2 0N R N R 382 59 58 42 53N R N N 2,657 331 324 96 3
N N R R 37 6 6 6 6N N R N 1,911 232 230 17 2N N N R 479 77 75 33 64N N N N 562,971 1,927 1,856 72 1
TOTAL 569,034 2,729 2,643 328 195
Table 15: Sampling & assessment—Topic 201.
Stratum Counts (Messages)
CS UW N n a r1 r2
R R 1,690 397 388 309 378R N 1,733 406 390 160 139N R 1,312 317 300 115 229N N 564,299 2,600 2,522 41 3
TOTAL 569,034 3,720 3,600 625 749
Table 16: Sampling & assessment—Topic 202.
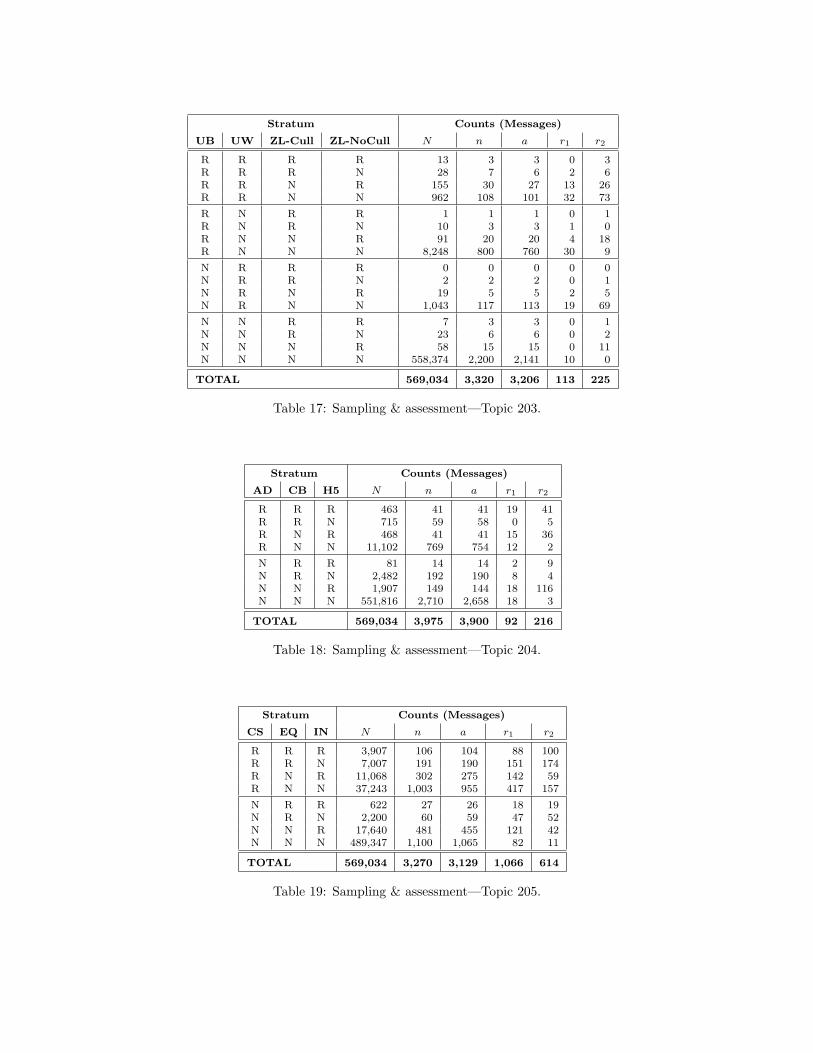
Stratum Counts (Messages)
UB UW ZL-Cull ZL-NoCull N n a r1 r2
R R R R 13 3 3 0 3R R R N 28 7 6 2 6R R N R 155 30 27 13 26R R N N 962 108 101 32 73
R N R R 1 1 1 0 1R N R N 10 3 3 1 0R N N R 91 20 20 4 18R N N N 8,248 800 760 30 9
N R R R 0 0 0 0 0N R R N 2 2 2 0 1N R N R 19 5 5 2 5N R N N 1,043 117 113 19 69
N N R R 7 3 3 0 1N N R N 23 6 6 0 2N N N R 58 15 15 0 11N N N N 558,374 2,200 2,141 10 0
TOTAL 569,034 3,320 3,206 113 225
Table 17: Sampling & assessment—Topic 203.
Stratum Counts (Messages)
AD CB H5 N n a r1 r2
R R R 463 41 41 19 41R R N 715 59 58 0 5R N R 468 41 41 15 36R N N 11,102 769 754 12 2
N R R 81 14 14 2 9N R N 2,482 192 190 8 4N N R 1,907 149 144 18 116N N N 551,816 2,710 2,658 18 3
TOTAL 569,034 3,975 3,900 92 216
Table 18: Sampling & assessment—Topic 204.
Stratum Counts (Messages)
CS EQ IN N n a r1 r2
R R R 3,907 106 104 88 100R R N 7,007 191 190 151 174R N R 11,068 302 275 142 59R N N 37,243 1,003 955 417 157
N R R 622 27 26 18 19N R N 2,200 60 59 47 52N N R 17,640 481 455 121 42N N N 489,347 1,100 1,065 82 11
TOTAL 569,034 3,270 3,129 1,066 614
Table 19: Sampling & assessment—Topic 205.

Stratum Counts (Messages)
CB-Low CB-Mid CB-High LO N n a r1 r2
R R R R 7 3 3 3 3R R R N 234 20 20 12 12R R N R 0 0 0 0 0R R N N 0 0 0 0 0
R N R R 0 0 0 0 0R N R N 0 0 0 0 0R N N R 0 0 0 0 0R N N N 0 0 0 0 0
N R R R 1 1 1 0 0N R R N 63 8 5 3 3N R N R 0 0 0 0 0N R N N 0 0 0 0 0
N N R R 2,994 70 65 2 1N N R N 30,202 680 636 24 22N N N R 23,673 590 552 19 15N N N N 511,860 2,025 1,937 83 55
TOTAL 569,034 3,397 3,219 146 111
Table 20: Sampling & assessment—Topic 206.
Stratum Counts (Messages)
CB EQ LO UW N n a r1 r2
R R R R 2,660 105 105 90 105R R R N 124 5 5 3 4R R N R 704 28 28 22 27R R N N 245 11 11 8 8
R N R R 922 36 36 27 33R N R N 436 17 16 4 6R N N R 1,004 41 41 35 37R N N N 1,816 73 69 27 39
N R R R 129 5 5 4 4N R R N 457 17 16 1 2N R N R 155 5 5 4 5N R N N 1,232 48 46 5 6
N N R R 574 24 24 9 18N N R N 20,102 800 779 15 8N N N R 968 40 39 21 27N N N N 537,506 2,540 2,484 3 1
TOTAL 569,034 3,795 3,709 278 330
Table 21: Sampling & assessment—-Topic 207.

References
[1] EDRM Data Set Project. Available at http://edrm.net/projects/dataset.
[2] TREC-2008 Legal Track—Interactive Task Topic-Specific Guidelines.http://trec.nist.gov/data/legal/08/LegalInteractive TopicGuidelines 2008.pdf.
[3] TREC-2009 Legal Track – Complaint J, 2009.Available at http://trec-legal.umiacs.umd.edu/LT09 Complaint J final.pdf.
[4] Per-Topic Scores: TREC 2009 Legal Track, Batch Task (Appendix Document). In The Eighteenth Text REtrievalConference (TREC 2009) Proceedings, 2010. http://trec.nist.gov.
[5] Per-Topic Scores: TREC 2009 Legal Track, Interactive Task (Appendix Document). In The Eighteenth TextREtrieval Conference (TREC 2009) Proceedings, 2010. http://trec.nist.gov.
[6] Test Topics: TREC 2009 Legal Track, Batch Task (Appendix Document). In The Eighteenth Text REtrievalConference (TREC 2009) Proceedings, 2010. http://trec.nist.gov.
[7] Jason R. Baron, Bruce Hedin, Douglas W. Oard, and Stephen Tomlinson. Interactive Task Guidelines – TREC-2008 Legal Track, 2008. Available at http://trec-legal.umiacs.umd.edu/2008InteractiveGuidelines.pdf.
[8] Jason R. Baron, Bruce Hedin, Douglas W. Oard, and Stephen Tomlinson. Interactive Task Guidelines – TREC-2009 Legal Track, 2009. Available at http://trec-legal.umiacs.umd.edu/LT09 ITG final.pdf.
[9] Jason R. Baron, David D. Lewis, and Douglas W. Oard. TREC-2006 Legal Track Overview. In The FifteenthText REtrieval Conference Proceedings (TREC 2006), pages 79–98, 2007.
[10] Gordon V. Cormack and Thomas R. Lynam. TREC 2005 spam track overview. In Ellen M. Voorhees andLori P. Buckland, editors, The Fourteenth Text Retrieval Conference (TREC 2005), volume Special Publication500-266, pages 91–108. National Institute of Standards and Technology (NIST), 2006.
[11] Maura R. Grossman, Art Bieser, Christopher H. Boehning, Michael Roman Geske, Howard J.C. Nicols, DavidStanton, and K. Krasnow Waterman. Reflections of the Topic Authorities about the 2009 TREC Legal TrackInteractive Task, 2010. Available at http://trec-legal.umiacs.umd.edu/.
[12] Donna K. Harman. The TREC Test Collections. In Ellen M. Voorhees and Donna K. Harman, editors, TREC:Experiment and Evaluation in Information Retrieval, pages 21–52, 2005.
[13] Douglas W. Oard, Bruce Hedin, Stephen Tomlinson, and Jason R. Baron. Overview of the TREC 2008 LegalTrack. In The Seventeenth Text REtrieval Conference (TREC 2008), 2009.
[14] H. Schmidt, K. Butter, and C. Rider. Building digital tobacco document libraries at the University of California,San Francisco Library/Center for Knowledge Management. D-Lib Magazine, 8(2), 2002.
[15] Stephen Tomlinson, Douglas W. Oard, Jason R. Baron, and Paul Thompson. Overview of the TREC 2007 LegalTrack. In The Sixteenth Text Retrieval Conference (TREC 2007) Proceedings, 2008.
[16] John Wang, Cameron Coles, Rob Elliot, and Sofia Andrianakou. Comparing Exclusionary and Investigative Ap-proaches for Electronic Discovery using the TREC Enron Corpus. In The Eighteenth Text REtrieval Conference(TREC 2009) Proceedings, 2010. Available at http://trec.nist.gov/pubs/trec18/papers/zlti.legal.pdf.
[17] William Webber, Douglas W. Oard, Falk Scholer, and Bruce Hedin. Assessor error in stratified evaluation. InProceedings of the 19th ACM International Conference on Information and Knowledge Management (CIKM),2010. to appear.