overview of unicef financial oversight and management · 2 regular resources (rr) resources that...
TRANSCRIPT

Overview of
UNICEF Financial
Oversight and
Management
EB Orientation
January 11, 2018

2
Regular
Resources (RR)
Resources that are
unrestricted, and include
pledges of
voluntary contributions from
governments and private
donors, other governmental
or intergovernmental
contributions, donations from
non-governmental sources,
bank interest and other
investment revenue and
miscellaneous revenue.
Other Regular
Resources (OR-R)Contributions received which
have been earmarked by
donors for specific purposes
and are hence considered
restricted. The earmarking
may be by country,
geographic area, theme,
project, sector etc.
Other Resources (OR-R)
Thematic –OR contribution that can be spent
flexibly within the funded Outcome
or Focus Area.
Other Resources (OR-R)
Non-Thematic –OR contribution that is restricted to
a particular activity.
Other Resources
Emergencies (OR-E)These are contributions
received in response to
emergencies.
Other Resources (OR-E)
Thematic –OR contribution that can be spent
flexibly within the funded Outcome
or Focus Area.
Other Resources (OR-E)
Non-Thematic –OR contribution that is restricted to
a particular activity.
Types of Financial Resources
UNICEF is voluntarily funded with the following funding types:

Oversight by the Executive Board
The Executive Board is the governing body of UNICEF.
• The Board has 36 members, elected for three-year terms with
a regional allocation of seats. They are elected among the
member state representatives by the United Nations Economic
and Social Council (ECOSOC).
• It is responsible for providing inter-governmental support to and
supervision of the activities of UNICEF.
• The Board meets three times each year, in a first regular
session in January/February, an annual session in June and a
second regular session in September.
3

Executive Board Sessions
4
First Session Annual Session
Second Session
Strategic Plan with Integrated Budget
✓ Every 4 years
Mid Term Review ✓ 3rd year of the SP
Updated Financial Estimates
✓ Annual
Country Programme Documents
✓ ✓ ✓
Audited Financial Statements
✓ 14 months following year end
PFP Budget ✓
PFP Financial Report ✓
5
Other Oversight
UNICEF internal and external oversight is conducted by various bodies including:
• ACABQ
• Fifth Committee
• Internal Management Reviews
• Annual External Audit by UNBOA
• Internal Audit and Investigations
• Audit Advisory Committee
• JIU reviews
• Donor Reviews and Assessments
Management
UNICEF is led by an Executive Director:
• Appointed by the Secretary-General in consultation with the
Executive Board.
• The Executive Director is fully responsible and accountable to
the Executive Board for all phases and aspects of UNICEF
activities.
Overall management and administration of the organisation takes
place at headquarters:
• New York, where global policy is defined
• HQ office in Copenhagen - Supply Division
• HQ office in Geneva – Private Fundraising & Partnerships
6
Financial Regulatory Framework
• UNICEF Financial Regulations and Rules
• UNICEF Policies and Procedures
• International Public Sector Accounting Standards (IPSAS)
• Internal Control policy based on COSO Internal Control -
Integrated Framework
7
8
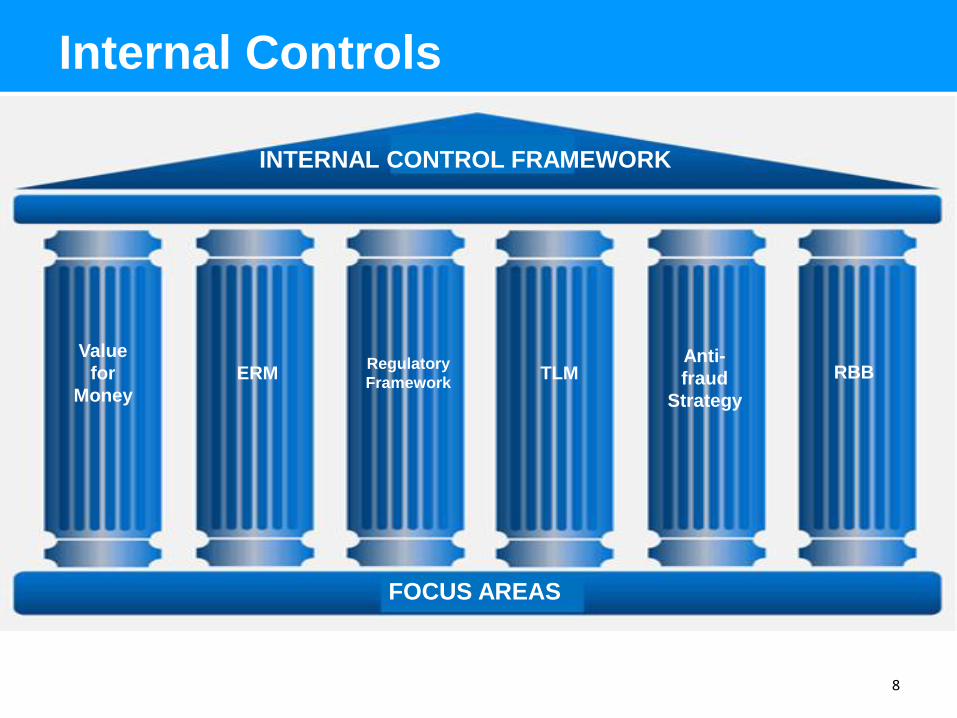
INTERNAL CONTROL FRAMEWORK
Value
for
Money
ERMRegulatory
FrameworkTLM
Anti-
fraud
Strategy
RBB
FOCUS AREAS
Internal Controls

9
UNICEF Culture
• Strong Ethics Office
• Policies and standards– UN Staff Rules, Standards of Conduct for International Civil Servants
and Code of Ethics
– UNICEF Anti -Fraud Policy
– UNICEF Financial Regulations and Rules
– UNICEF HR Manual
– UNICEF Supply Manual
– UN Policy on Gifts, UN Supplier Code of Conduct & related UNICEF
instruction on Acceptance of Awards, Decorations, Gifts, Honours,
Medals, etc.
• Management Reviews and Discussions– Global Management Team (GMT)
– Performance Reviews
– Management committees
• Internal broad access to all policies, dashboards,
audit reports, annual disciplinary report

10
Accountability
• Executive Director is fully responsible and accountable to the
Executive Board
• All officials are accountable to the Executive Director for their
actions. They may be held personally responsible and
financially liable for the consequences of contrary actions.
• Officials may be required to reimburse UNICEF for financial
losses as a result of their negligence or violation of framework.

UNICEF
2018 - 2021 Budget
11
© U
NIC
EF
/NY
HQ
201
1-0
098/N
OO
RA
NI

12
Integrated Budget
• Budget categories
– Programme
– Institutional
– PFP
• Country
• Global and regional
• Development effectiveness
• Management
• Capital investment
• Programme Regular Resources (RR) allocations:- RR allocated according to formula based on three core criteria:
✓ Gross National Income (GNI) per capita
✓ Under-five mortality rate
✓ Child Population
- Minimum allocation: $850k

2018-2021 Revenue by Source
13UNICEF for every child
Public $14,58364%
Private $8,23136%
As a result of sustained investment, the Private Sector will contribute
57% of the Organizations RR revenue for 2018-2021
Public Sector (two-thirds) and Private Sector(one-third)
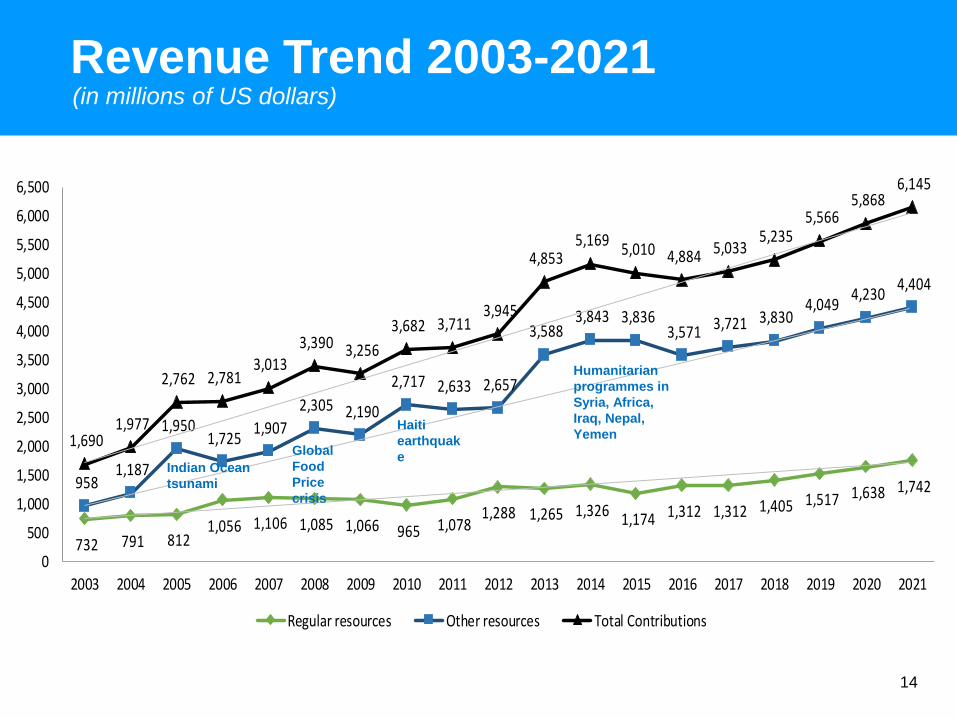
(in millions of US dollars)
14
732 791 812 1,056 1,106 1,085 1,066 965 1,078
1,288 1,265 1,326 1,174 1,312 1,312 1,405 1,517 1,638 1,742 958 1,187
1,950 1,725
1,907
2,305 2,190
2,717 2,633 2,657
3,588 3,843 3,836
3,571 3,721 3,830 4,049
4,230 4,404
1,690 1,977
2,762 2,781 3,013
3,390 3,256
3,682 3,711 3,945
4,853 5,169
5,010 4,884 5,033 5,235
5,566 5,868
6,145
0
500
1,000
1,500
2,000
2,500
3,000
3,500
4,000
4,500
5,000
5,500
6,000
6,500
2003 2004 2005 2006 2007 2008 2009 2010 2011 2012 2013 2014 2015 2016 2017 2018 2019 2020 2021
Regular resources Other resources Total Contributions
Revenue Trend 2003-2021
Humanitarian
programmes in
Syria, Africa,
Iraq, Nepal,
YemenHaiti
earthquak
eGlobal
Food
Price
crisis
Indian Ocean
tsunami
15 Financial Update – UNICEF | for every child
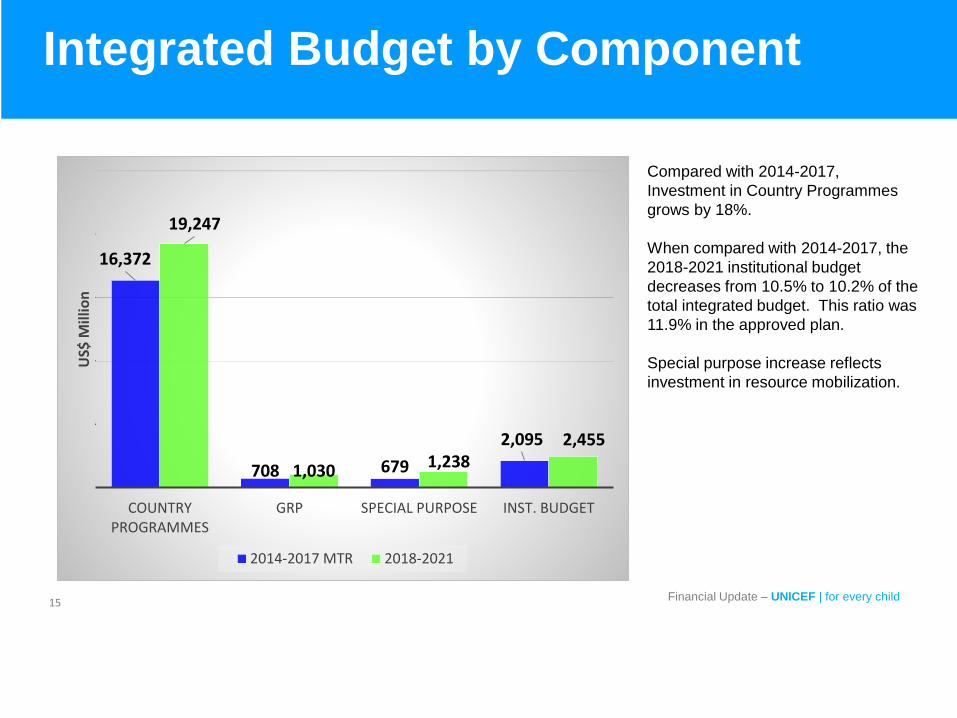
16,372
708 679
2,095
19,247
1,030 1,2382,455
COUNTRY PROGRAMMES
GRP SPECIAL PURPOSE INST. BUDGET
US$
Mill
ion
2014-2017 MTR 2018-2021
Compared with 2014-2017,
Investment in Country Programmes
grows by 18%.
When compared with 2014-2017, the
2018-2021 institutional budget
decreases from 10.5% to 10.2% of the
total integrated budget. This ratio was
11.9% in the approved plan.
Special purpose increase reflects
investment in resource mobilization.
Integrated Budget by Component
16
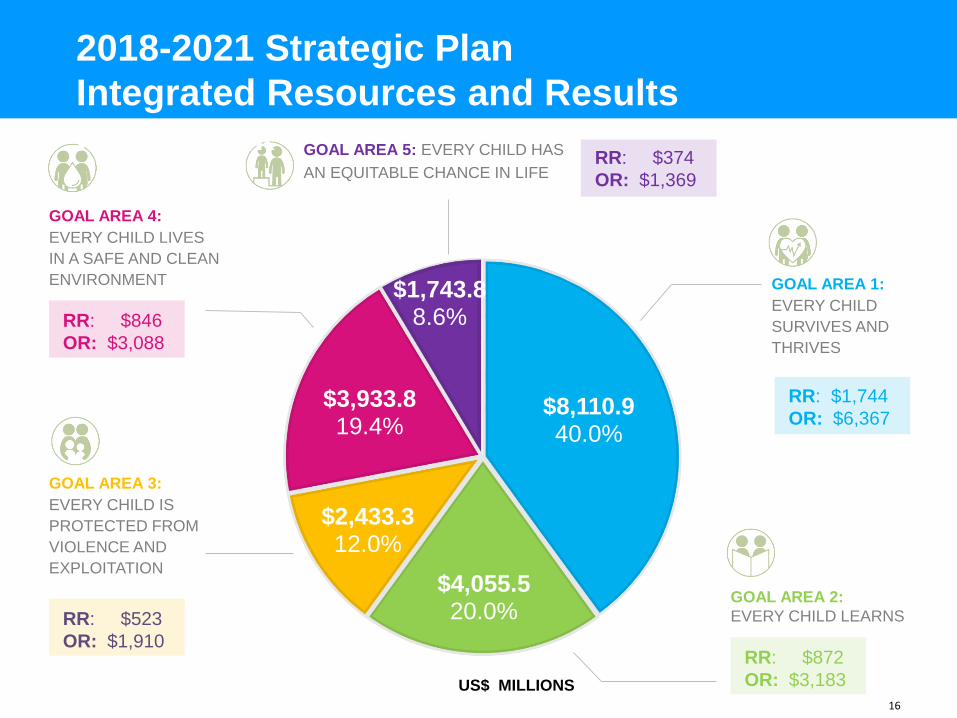
$8,110.940.0%
$4,055.520.0%
$2,433.312.0%
$3,933.819.4%
$1,743.88.6%
GOAL AREA 1:
EVERY CHILD
SURVIVES AND
THRIVES
GOAL AREA 2:
EVERY CHILD LEARNS
GOAL AREA 3:
EVERY CHILD IS
PROTECTED FROM
VIOLENCE AND
EXPLOITATION
GOAL AREA 4:
EVERY CHILD LIVES
IN A SAFE AND CLEAN
ENVIRONMENT
GOAL AREA 5: EVERY CHILD HAS
AN EQUITABLE CHANCE IN LIFE
RR: $846
OR: $3,088
RR: $523
OR: $1,910RR: $872
OR: $3,183
RR: $374
OR: $1,369
RR: $1,744
OR: $6,367
US$ MILLIONS
2018-2021 Strategic Plan
Integrated Resources and Results
Framework
17 Financial Update – UNICEF | for every child
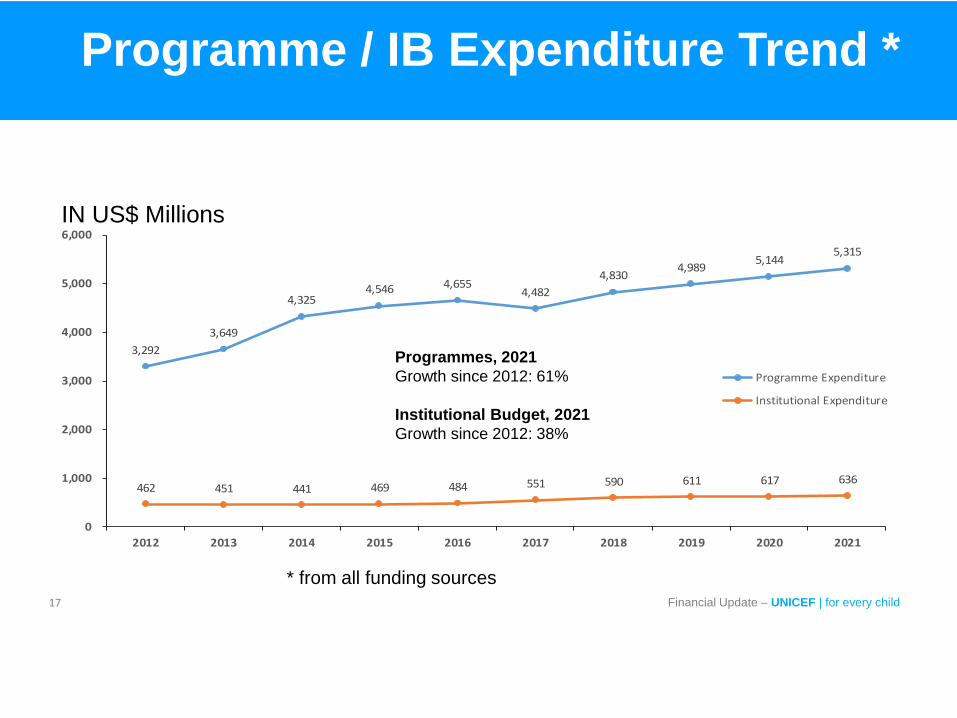
3,292
3,649
4,3254,546 4,655
4,482
4,8304,989
5,1445,315
462 451 441 469 484 551 590 611 617 636
0
1,000
2,000
3,000
4,000
5,000
6,000
2012 2013 2014 2015 2016 2017 2018 2019 2020 2021
Programme Expenditure
Institutional Expenditure
* from all funding sources
IN US$ Millions
Programmes, 2021
Growth since 2012: 61%
Institutional Budget, 2021
Growth since 2012: 38%
Programme / IB Expenditure Trend *
© UNICEF/SUDA2014-XX228/Noorani
Thank You