overview of venture capital …and why it matters ! jerome s. engel september 2005
Post on 21-Dec-2015
215 views
TRANSCRIPT
Overview of Venture Capital …and why it matters !
Jerome S. Engel
September 2005

Jerry Engel UC Berkeley
- Founder and Executive Director of the Lester Center for Entrepreneurship and Innovation
- Chair of the Entrepreneurship Faculty- Teach Entrepreneurship, Venture Capital & Private
Equity, Technology Commercialization in the MBA and Executive Education programs
Outside of Academe:- Monitor Venture Partners, General Partner- Co-founded: Kline Hawkes Capital, AllBusiness.com,
ElectraScan Inc., Maxis, CardioProfile, and more…- Angel Investor, Board member, Advisor
1980s- Ernst&Young, Managing Partner
Entrepreneurial Services Apple, Intel, Genentech, Sun, Autodesk, more..
1970s – KPMG Academic - Wharton


Probing upper thermospheric Probing upper thermospheric neutral densities at Mars using neutral densities at Mars using
electron reflectometryelectron reflectometry

Overview of Venture Capital…and why it Matters!
Entrepreneurship is a key driver of value creation in the 21st century American economy
An approach to that starts with the recognition and pursuit of opportunity
The opportunity must be compelling to enable the entrepreneur to attract the necessary resources
Special mechanisms exist to enable resource alignment with the best opportunities
Venture Capital is such a mechanism Venture Capital is more than money It is a market mechanism It is this subtlety that makes rare
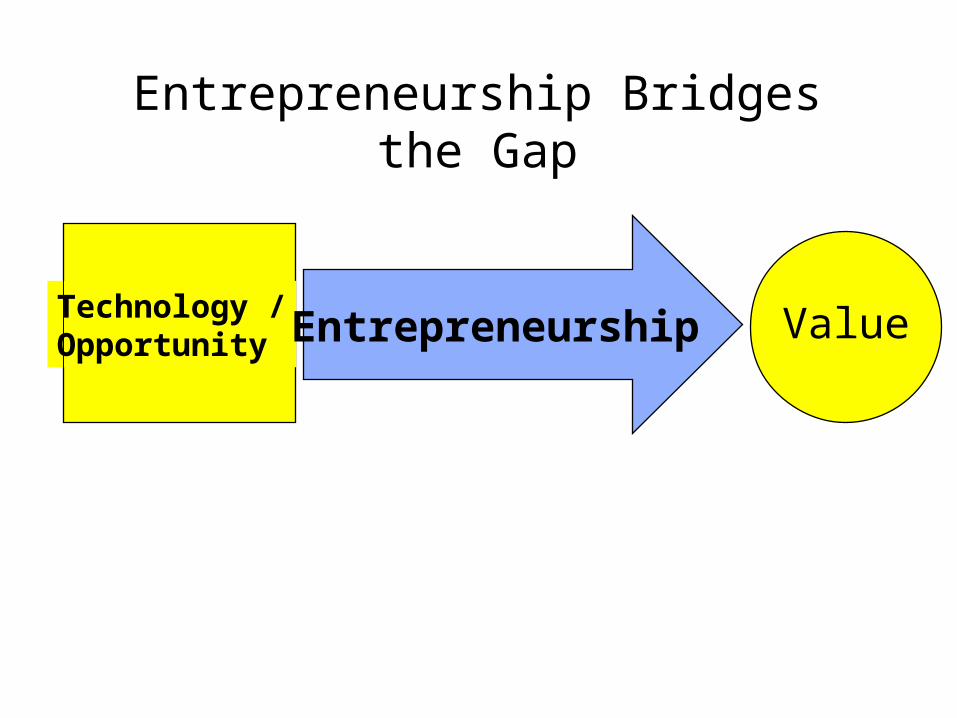
Technology /Opportunity Value
Entrepreneurship Bridges the Gap
Entrepreneurship

Entrepreneurship
The pursuit of Opportunity beyond the Resources you currently control
Harvard Business SchoolWorking Definition
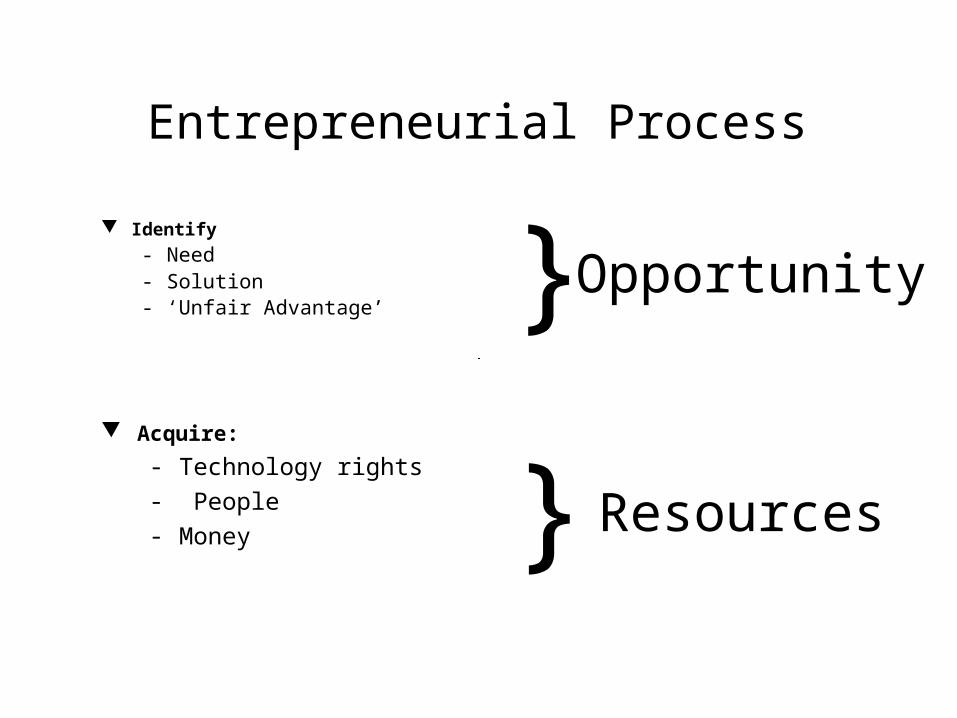
Entrepreneurial Process
Identify - Need- Solution- ‘Unfair Advantage’ }
}
Opportunity
Resources
Acquire:
- Technology rights- People- Money
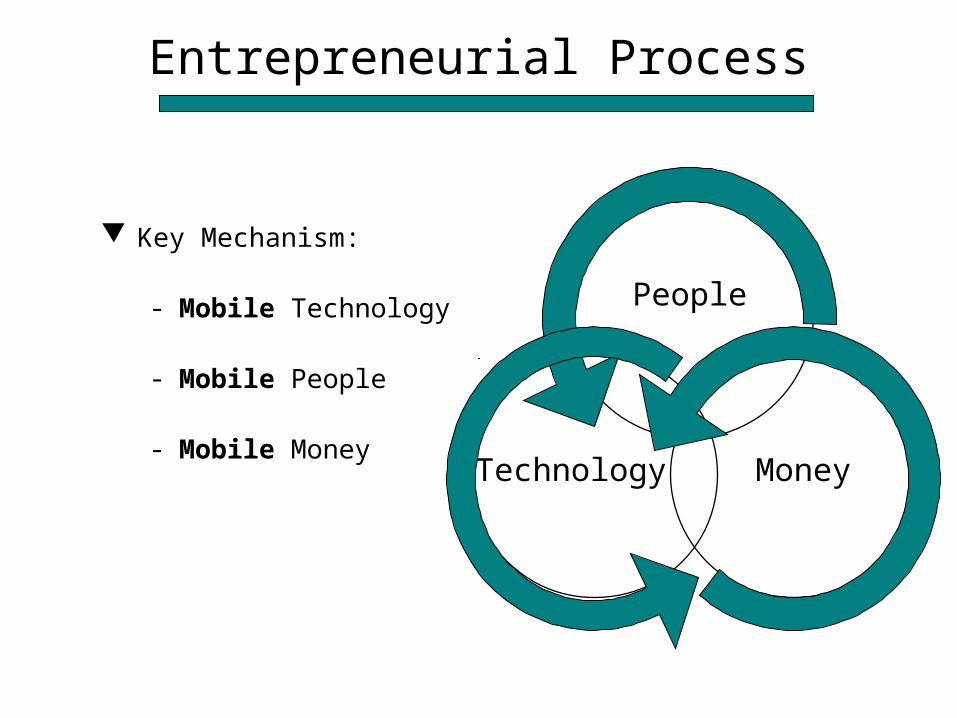
Entrepreneurial Process
Key Mechanism:
- Mobile Technology
- Mobile People
- Mobile Money
People
MoneyTechnology

The Entrepreneurial Venture FOUR PERIODS of DEVELOPMENT
Time
CashFlow
I II III IV

Time
“Pure entrepreneurship”
CashFlow
The Entrepreneurial Venture FOUR PERIODS of DEVELOPMENT

The Entrepreneurial Venture PERIOD I: “Pure Entrepreneurship”
Defining the concept of the business Gathering financial resources Assembling the startup team Identifying customers Analyzing the competition Building the prototype Getting your first ‘customer’
Time
CashFlow
I II III IV

Time
“Strategic focus”
CashFlow
The Entrepreneurial Venture FOUR PERIODS of DEVELOPMENT
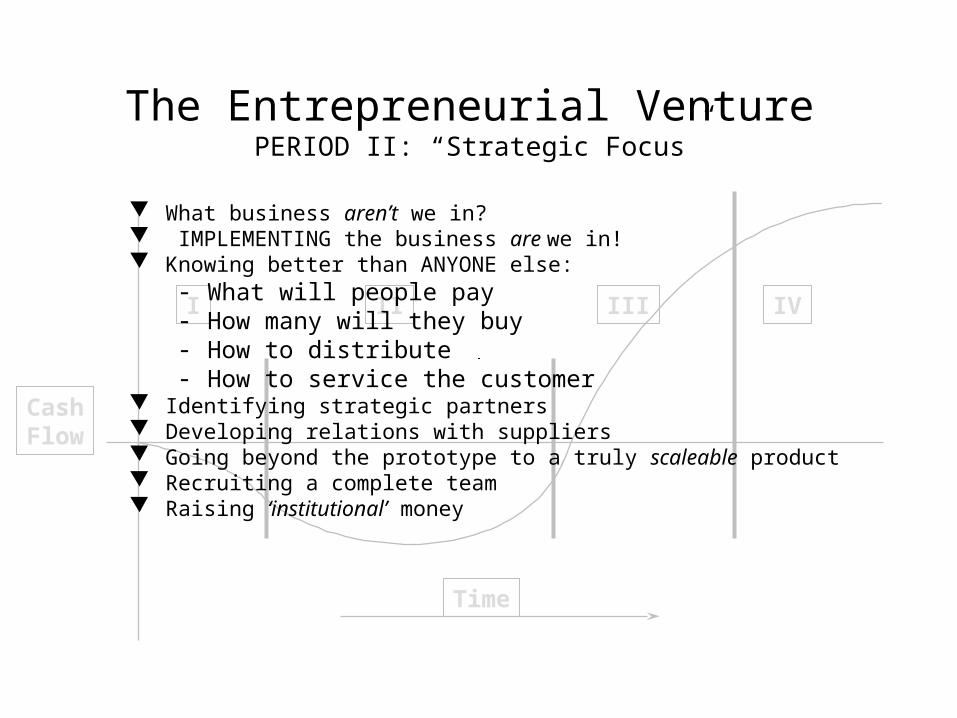
The Entrepreneurial Venture PERIOD II: “Strategic Focus”
Time
CashFlow
I II III IV
What business aren’t we in? IMPLEMENTING the business are we in! Knowing better than ANYONE else:
- What will people pay- How many will they buy- How to distribute- How to service the customer
Identifying strategic partners Developing relations with suppliers Going beyond the prototype to a truly scaleable product Recruiting a complete team Raising ‘institutional’ money

Time
“Systems building”
CashFlow
The Entrepreneurial Venture FOUR PERIODS of DEVELOPMENT

Time
CashFlow
I II III IV
The Entrepreneurial Venture PERIOD III: “Systems Building”
Financial controls Stable division of labor Reporting relationships and authorities Developing systems of internal control Formalizing the terms of a sale Operational systems
- Production, outsoucing- Distribution, sales- Service, warraties

CashFlow
Time
“Corporate management”
The Entrepreneurial Venture FOUR PERIODS of DEVELOPMENT
Time
CashFlow
I II III IV
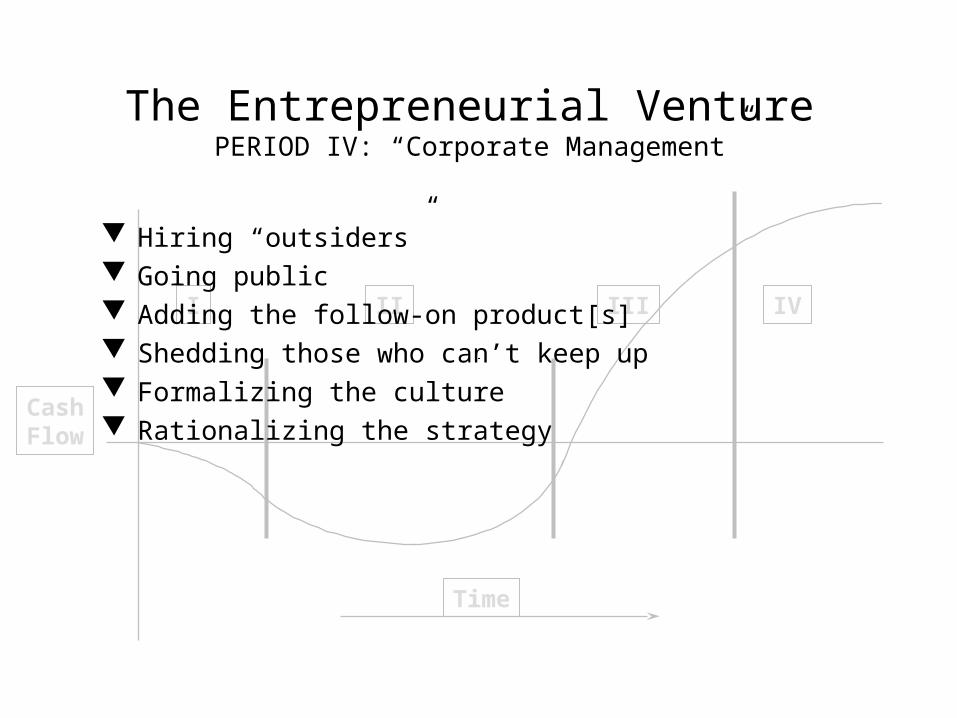
The Entrepreneurial Venture PERIOD IV: “Corporate Management”
Hiring “outsiders” Going public Adding the follow-on product[s] Shedding those who can’t keep up Formalizing the culture Rationalizing the strategy
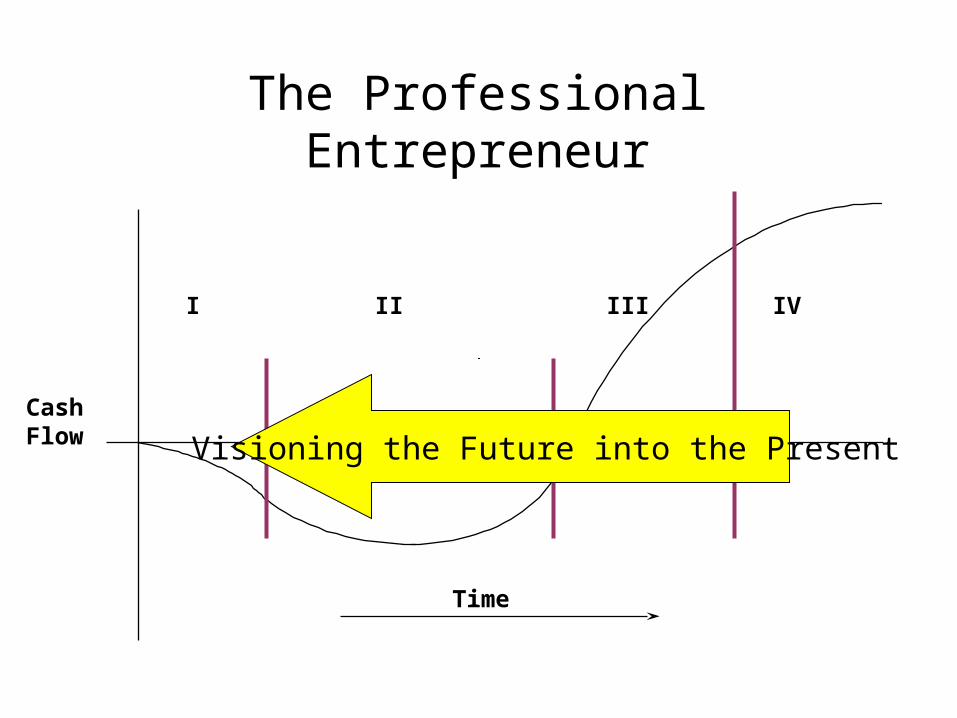
The Professional Entrepreneur
Time
CashFlow
I II III IV
Visioning the Future into the Present

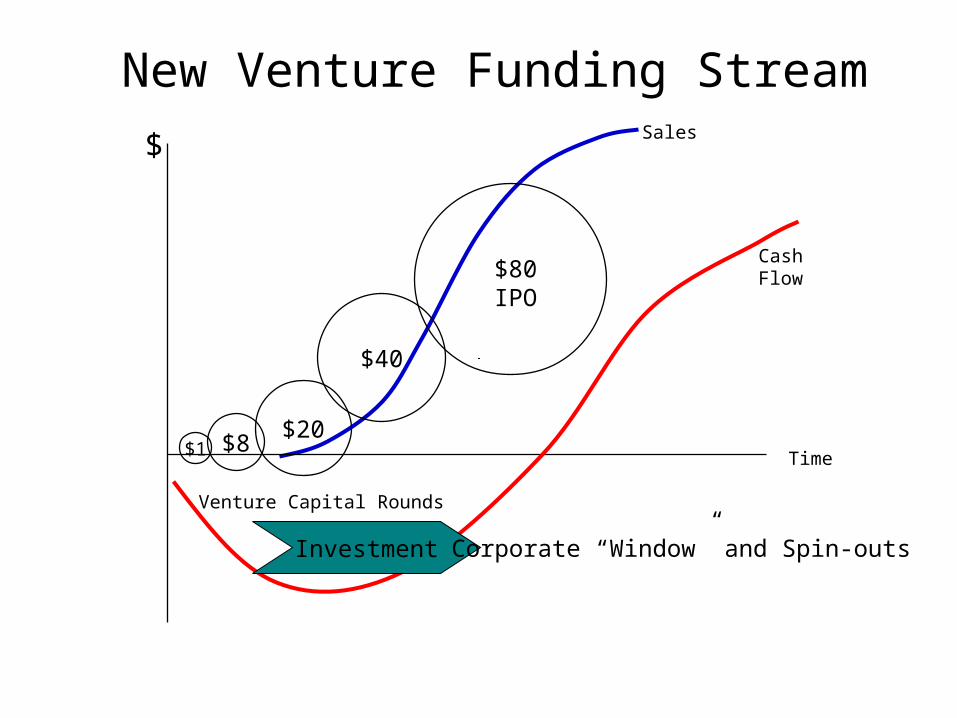
New Venture Funding StreamSales$
Time
Cash Flow
$1 $8
Venture Capital RoundsFinancing to Milestones
$20
$40
$80IPO
New Venture Funding StreamSales$
Time
Cash Flow
$1 $8
Venture Capital Rounds
$20
$40
$80IPO
Investment Corporate “Window” and Spin-outs

New Venture Funding StreamSales$
Time
Cash Flow
$1 $8
Venture Capital Rounds
$20
$40
$80IPO
Acquisition
Investment
Corp Growth
Corporate “Window” and Spin-outs

U.S. Example:
Private R&D Spending Increasing
0
50
100
150
200
250
300
1955 1960 1965 1970 1975 1980 1985 1990 1995 2000
Bill
ions
of 1
996
Dol
lars TOTAL
PRIVATE
FEDERAL
Note: Expenditures are deflated using the GDP implicit price deflator. Source: National Science Board (2000) and Economic Report of the President (2002)

The Proportion of Research Expenditure at
Our Largest Corporations is Decreasing
Company Size 1981 1989 1999 2000
<1000 employees 4.4% 9.2% 22.5% 22.4%1,000 - 4,999 6.1% 7.6% 13.6% 15.4%5,000 - 9,999 5.8% 5.5% 9.0% 8.4%10,000 - 24,999 13.1% 10.0% 13.6% 14.4%25,000+ 70.7% 67.7% 41.3% 39.5%
Original - H. Chesbrough, 2003 Updated J. Engel 2003Source: National Science Foundation, Science Resource Studies, Survey of Industrial Research Development, 1991,1999 and 2000.

The State of the Venture Capital Industry
September 2005
Jerome S. Engel
Venture Capital & Private Equity
Reminder: Entrepreneurs Forum Thursday night

EntrepreneursPerspective
Limited PartnersPerspective
General PartnersPerspective
InvestmentOpportunit
y
Venture Capital and Private Equity…require a convergence of interests
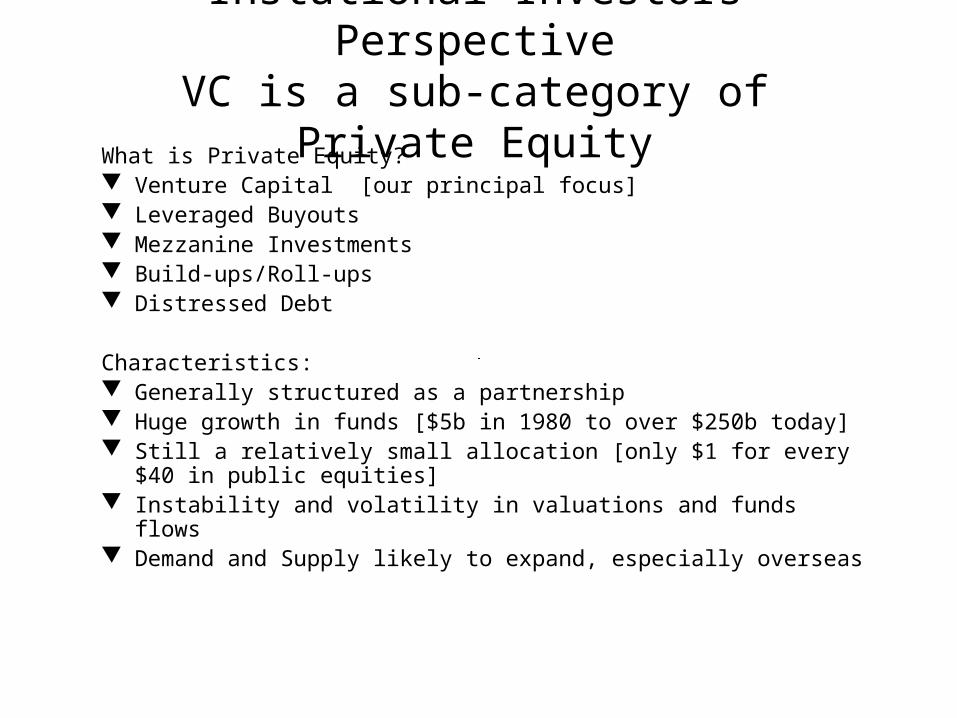
Instutional Investors PerspectiveVC is a sub-category of Private
EquityWhat is Private Equity? Venture Capital [our principal focus] Leveraged Buyouts Mezzanine Investments Build-ups/Roll-ups Distressed Debt
Characteristics: Generally structured as a partnership Huge growth in funds [$5b in 1980 to over $250b today] Still a relatively small allocation [only $1 for every $40 in
public equities] Instability and volatility in valuations and funds flows Demand and Supply likely to expand, especially overseas

20 Years of Venture Capital ?
Nasdaq Composite Index
$0
$20
$40
$60
$80
81 82 83 84 85 86 87 88 89 90 91 92 93 94 95 96 97 98 99 2000
0%
10%
20%
30%
40%
50%
60%
70%
80%
90%
100%
VC Fundraising ($B) VC Median Returns by vintage year
VC Median Returns
279%
Sou
rces:
Asset
Alt
ern
at i
ves,
Cam
br i
dg
e A
ssocia
tes,
CS
I, I
nc.

VC InvestmentVC Investment1980 – The Long View1980 – The Long View
($ in billions)
$41.0
$15.3$8.2
$21.3
$4.2$3.7
$18.7$21.5
$54.7
$105.9
$14.9
$11.5
$3.6$2.2$2.8$3.3$3.4$3.3$3.1$2.8$3.0$3.0$1.6$1.2$0.6$0
$20
$40
$60
$80
$100
$120
'80 '81 '82 '83 '84 '85 '86 '87 '88 '89 '90 '91 '92 '93 '94 '95 '96 '97 '98 '99 '00 '01 '02 '03 Q3'04
Annual Venture Capital Investments 1980 to YTD Q3 2004

U.S. Fundraising

Fundraising Running at ’96-’97 levelsCommitments to Venture Capital Funds
$83.5
$3.0
$17.7
$9.4$13.1
$50.5
$58.8
$26.9
$17.1$12.7
$7.0$5.4
$0
$20
$40
$60
$80
1994 1995 1996 1997 1998 1999 2000 2001 2002 2003 2004 1Q05
Funds
Rai
sed
($B)

Median Fund Size Continues to increase after the shake-out
Median VC Fund Size (for funds greater than $20M)$185
$160
$100
$75
$105$100$110
$97
$76$83
$67$53
$0
$50
$100
$150
$200
1994 1995 1996 1997 1998 1999 2000 2001 2002 2003 2004 1Q05
Med
ian F
und
Size
($M
)

Half of Funds Closed > $100M in Size
Allocation of Fund Size by Number of Funds Raised per Vintage Year
10%16% 25%21%
25%
25%
75% 70%
50%
2%0%
20%
40%
60%
80%
100%
1995 1997 1999 2001 2003 1Q05
Under $100M
$100M-$249M
$250M-$499M
$500M-$999M
$1B+
U.S. Investment: Overall
Am
ou
nt
Investe
d
($B
)N
um
ber o
f Deals
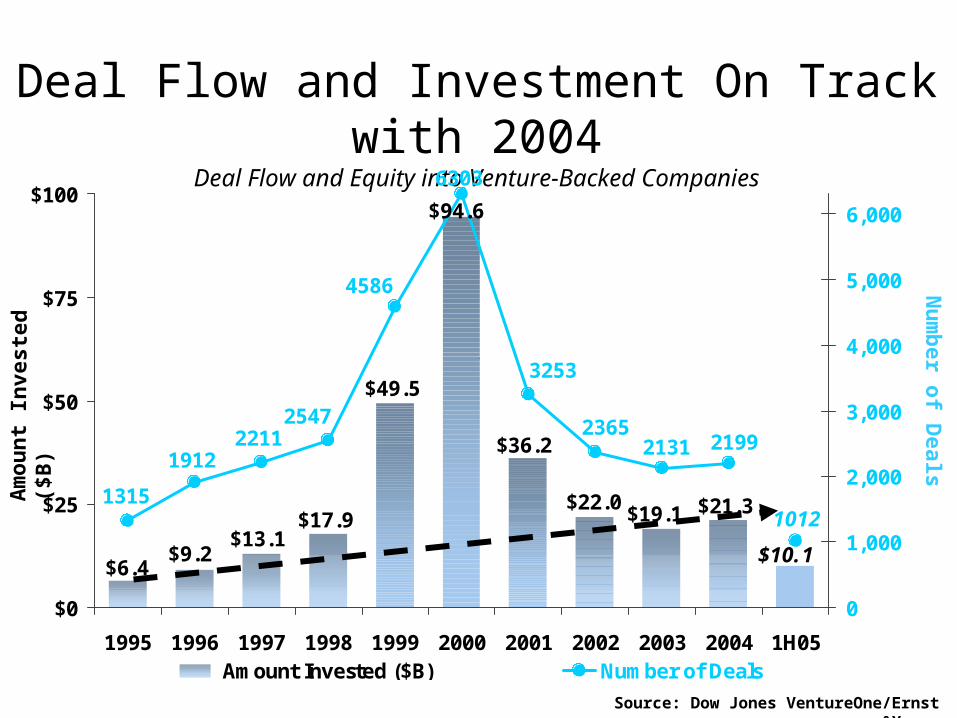
Deal Flow and Investment On Track with 2004
Deal Flow and Equity into Venture-Backed Companies
Source: Dow Jones VentureOne/Ernst &Young
$94.6
$10.1
$21.3$19.1$22.0
$36.2
$49.5
$17.9$13.1
$9.2$6.4
1012
219921312365
3253
6303
4586
25472211
1912
1315
$0
$25
$50
$75
$100
1995 1996 1997 1998 1999 2000 2001 2002 2003 2004 1H05
0
1,000
2,000
3,000
4,000
5,000
6,000
Amount Invested ($B) Number of Deals

IT dominates VC Investing [Health Care
#2] Deal Flow Allocation by Industry Sector
% o
f Tota
l V
C R
ou
nd
s
Source: Dow Jones VentureOne/Ernst &Young
0%
20%
40%
60%
80%
100%
2Q02 4Q02 2Q03 4Q03 2Q04 4Q04 2Q05
Other
Products &Services
IT
Healthcare
27%
53%
17%
26%
17%
23%
57%
15%
64%
5%5%3%
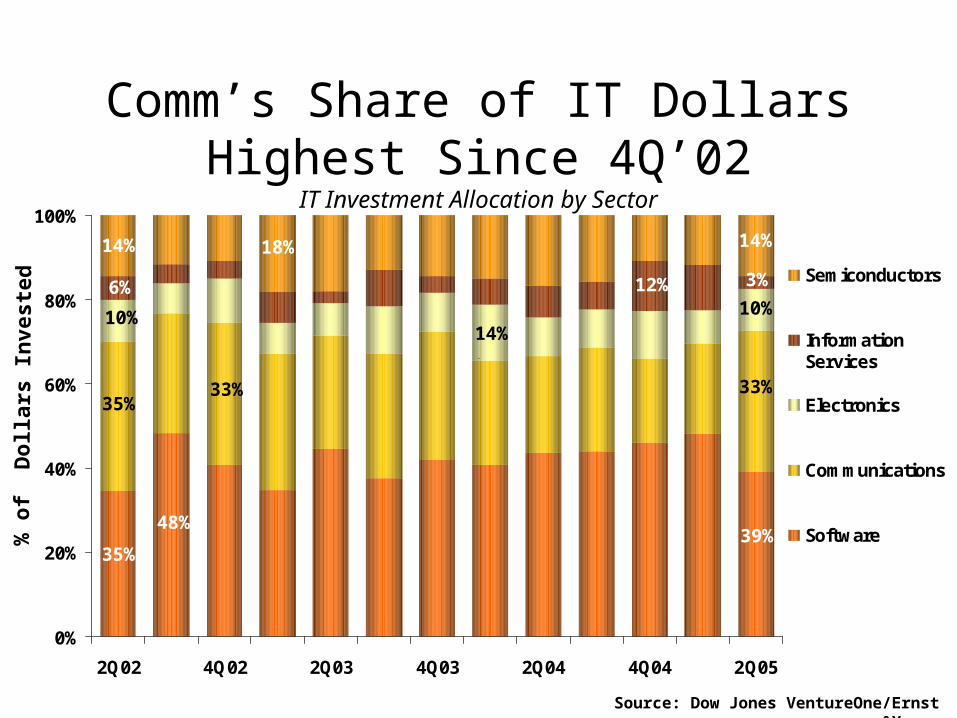
Comm’s Share of IT Dollars Highest Since 4Q’02
IT Investment Allocation by Sector
% o
f D
ollars
In
veste
d
Source: Dow Jones VentureOne/Ernst &Young
0%
20%
40%
60%
80%
100%
2Q02 4Q02 2Q03 4Q03 2Q04 4Q04 2Q05
Semiconductors
InformationServices
Electronics
Communications
Software35%
35%
6%
14%
10%
39%
33%
3%
10%
14%
12%
14%
33%
48%
18%

Healthcare Activity Strong and SteadyEquity into Venture-Backed Healthcare Companies
Am
ou
nt
Investe
d
($B
)N
um
ber o
f Deals
Source: Dow Jones VentureOne/Ernst &Young
$1.4$1.2
$1.6$1.7$1.7$1.9$1.9
$1.8
$1.4
$1.1
$1.5
$1.1
$2.0122
97
136126
141
118
154
125115
106
132
111
174
$0
$1
$2
$3
2Q02 3Q02 4Q02 1Q03 2Q03 3Q03 4Q03 1Q04 2Q04 3Q04 4Q04 1Q05 2Q05
0
25
50
75
100
125
150
175
Amount Invested ($B) Number of Deals

Biopharm & Devices Dominate HC Investment
Healthcare Investment Allocation by Sector
% o
f D
ollars
In
veste
d
Source: Dow Jones VentureOne/Ernst &Young
0%
20%
40%
60%
80%
100%
2Q02 4Q02 2Q03 4Q03 2Q04 4Q04 2Q05
Medical IS
MedicalDevices
HealthcareServices
Biopharm
5%
11%
28%
56%
7%
30%
55%
8%
35%
10%
77%
9%

More than half of VC deals are seed or first round
Deal Flow Allocation by Round Class
% o
f Tota
l V
C
Rou
nd
s
*Seed and First Rounds Combined
Source: Dow Jones VentureOne/Ernst &Young
0%
20%
40%
60%
80%
100%
2Q02 4Q02 2Q03 4Q03 2Q04 4Q04 2Q05
Restart
Later
Second
First
Seed*30%
29%
37%
4%
*31%
42%
21%
*36%
6%
28%
39%
10%

Round Allocation Mirrors Mid-’90s Levels
Deal Flow Allocation by Round Class (Annual)
% o
f Tota
l V
C
Rou
nd
s
*Seed and First Rounds Combined
Source: Dow Jones VentureOne/Ernst &Young
0%
20%
40%
60%
80%
100%
1995 1996 1997 1998 1999 2000 2001 2002 2003 2004 1H05
Restart
Later
Second
First
Seed*32%
*32%
20%
33%
39% 40%
7%
*54%
20%
39%
9% 11%
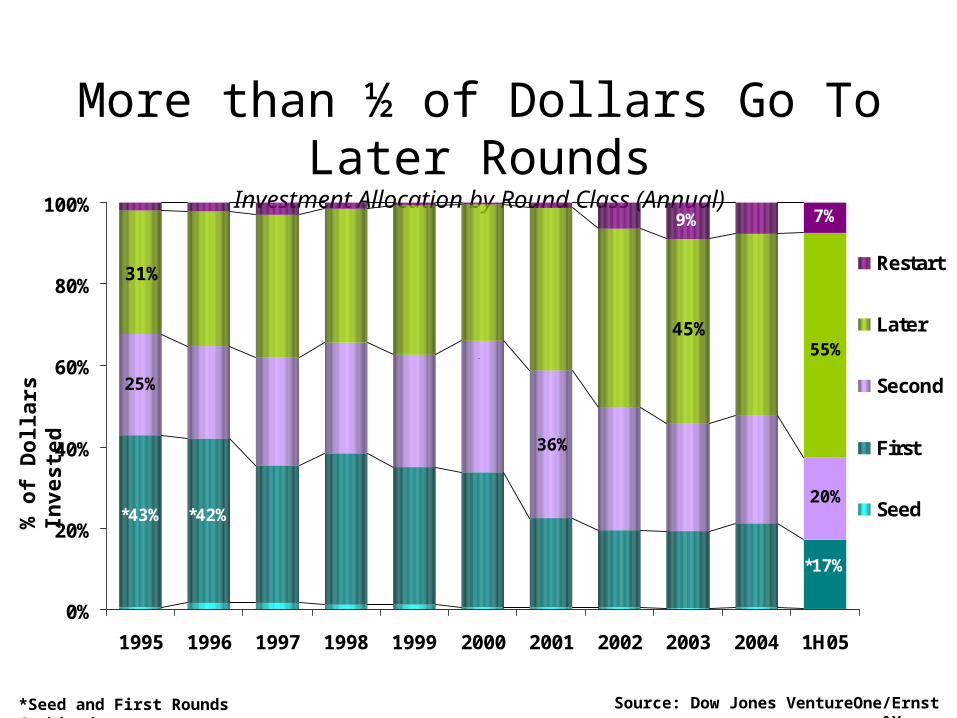
More than ½ of Dollars Go To Later Rounds
Investment Allocation by Round Class (Annual)
% o
f D
ollars
In
veste
d
*Seed and First Rounds Combined
Source: Dow Jones VentureOne/Ernst &Young
0%
20%
40%
60%
80%
100%
1995 1996 1997 1998 1999 2000 2001 2002 2003 2004 1H05
Restart
Later
Second
First
Seed*43%
25%
31%
7%
*17%
55%
20%
9%
45%
36%
*42%

Median Deal Sizes Relatively ConsistentMedian Amount Invested Per Financing Round
Med
ian
Am
ou
nt
Investe
d
($M
)
Source: Dow Jones VentureOne/Ernst &Young
$6.9$7.0
$6.0
$7.0$7.0$7.0
$6.0$6.4
$6.0$5.6
$6.3$6.0$6.0
$0
$2
$4
$6
$8
2Q02 3Q02 4Q02 1Q03 2Q03 3Q03 4Q03 1Q04 2Q04 3Q04 4Q04 1Q05 2Q05

Early Stage Deals are ½ Size of Later Rounds
Median Amount Invested by Round Class , VC Only
Med
ian
Am
ou
nt
Investe
d
($M
)
Source: Dow Jones VentureOne/Ernst &Young
$10.0
$7.5$8.0
$6.8
$5.6
$4.0
$0.9$1.3
$0
$2
$4
$6
$8
$10
$12
$14
2Q02 3Q02 4Q02 1Q03 2Q03 3Q03 4Q03 1Q04 2Q04 3Q04 4Q04 1Q05 2Q05
Later Round Second Round First Round Seed Round

Amount Invested in Rounds at Late 90’s Levels
Median Amount Invested by Round Class (Annual), VC Only
Med
ian
Am
ou
nt
Investe
d
($M
)
Source: Dow Jones VentureOne/Ernst &Young
$5.0
$10.0
$4.0
$8.4
$2.9
$5.0
$1.0 $0.9$0
$5
$10
$15
$20
1995 1996 1997 1998 1999 2000 2001 2002 2003 2004 1H05
Later Round Second Round First Round Seed Round

U.S. Investment: Regions
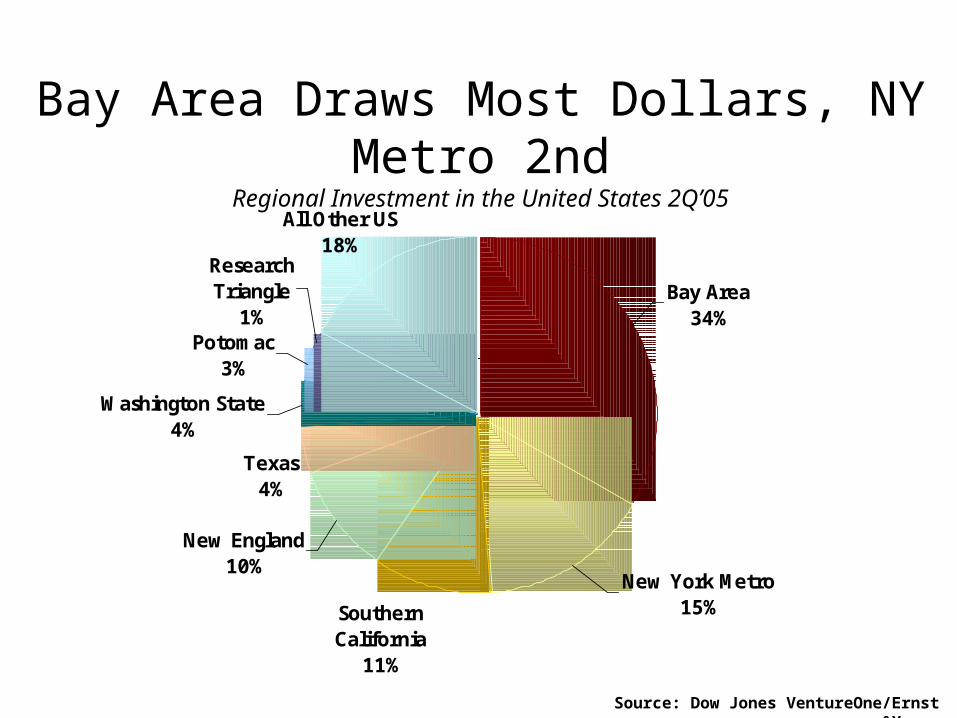
Bay Area Draws Most Dollars, NY Metro 2nd
Regional Investment in the United States 2Q’05
Source: Dow Jones VentureOne/Ernst &Young
All Other US18%
Potomac3%
Research Triangle
1%
Texas4%
Washington State4%
New England10%
Southern California
11%
New York Metro15%
Bay Area 34%

2 Out of 5 Deals in CaliforniaRegional Deal Flow in the United States 2Q’05
Source: Dow Jones VentureOne/Ernst &Young
All Other US25%
Washington State5%
Texas5%
Research Triangle
1%
Potomac5%New York Metro
6%
Southern California
10%
New England13%
Bay Area 30%

Most Deals are SyndicatedNumber of Investors Per Round
Source: Dow Jones VentureOne/Ernst &Young
30% 34%26%
22% 23%21%
16%
19%20%
9%15%
13%
23%30%
21%
0%
20%
40%
60%
80%
100%
1995 1996 1997 1998 1999 2000 2001 2002 2003 2004 1H05
5+ Investors
4 Investors
3 Investors
2 Investors
1 Investor

U.S. Investment: Valuations

Valuations Continue Upward TrendMedian Premoney Valuation by Year
$15.0$13.0
$10.0$10.7
$16.0
$25.5
$21.1
$15.5
$12.9$11.1
$9.3$10.0
$0
$5
$10
$15
$20
$25
1994 1995 1996 1997 1998 1999 2000 2001 2002 2003 2004 1Q05
Med
ian P
rem
oney
Val
uat
ion (
$M
)

Valuation has a strong corellation to round
Median Premoney Valuations by Round Class (All Industries)
$31
$24
$12$12
$7$5
$3$3$0
$10
$20
$30
$40
1Q02 2Q02 3Q02 4Q02 1Q03 2Q03 3Q03 4Q03 1Q04 2Q04 3Q04 4Q04 1Q05
Later Stage Second Round First Round Seed Round
Med
ian P
rem
oney
Val
uat
ion ($M
)

U.S. Liquidity

M&As Remain Primary Exit OptionPercentage Breakdown of Venture Backed Liquidity Events: IPO vs. M&A
0% 20% 40% 60% 80% 100%
1995
1996
1997
1998
1999
2000
2001
2002
2003
2004
1H05
IPOs M&As

IPO Activity slows in 1H’05 after a strong ‘04
Deals and Amount Raised Through IPOs
Am
ou
nt
Rais
ed
($
B)
Ven
ture
-Backed
IP
Os
$0.6
$5.0
$1.4$1.6$1.8
$19.2$19.5
$3.7$4.6
$8.7
$5.0
13
67
222022
202
250
68
120
216
144
$0
$5
$10
$15
$20
$25
$30
1995 1996 1997 1998 1999 2000 2001 2002 2003 2004 1H05
0
50
100
150
200
250
Amount Raised ($B) Venture-Backed IPOs
Fewest Venture-Backed IPOs in 7 Quarters
Deals and Total Amount Raised Through IPOs
Am
ou
nt
Rais
ed
($
B)
Ven
ture
-Backed
IP
Os
$0.2$0.03
$0.4$0.4
$0.7
$0.8
$0.2
$0.4
$1.2$1.4
$1.7
$0.9
5
8
19
14
24
10
14
6
2
6
1
9
$0.0
$0.3
$0.6
$0.9
$1.2
$1.5
$1.8
2Q02 3Q02 4Q02 1Q03 2Q03 3Q03 4Q03 1Q04 2Q04 3Q04 4Q04 1Q05 2Q05
0
5
10
15
20
25
Amount Raised ($B) Venture-Backed IPOs

Half of 2005 IPOs from Vintage Years ’99-’00
Median Time From Initial Equity Funding to IPO
Nu
mb
er
of
Years
5.35.75.7
3.6
4.5
3.12.82.8
3.1
3.5
4.1
0
1
2
3
4
5
6
1995 1996 1997 1998 1999 2000 2001 2002 2003 2004 1H05

IPOs have raised Greater amounts of VCbefore going public
Median Amount Raised Prior to IPO
Med
ian
Am
ou
nt
Rais
ed
Pri
or
to
IPO
($
M)
$61.7
$73.2
$60.2
$49.0$47.8$46.9
$31.3
$22.4
$13.0$15.0$10.3
$0
$25
$50
$75
1995 1996 1997 1998 1999 2000 2001 2002 2003 2004 1H05

European Investment:
Overview

Perspective on European MarketEquity Investment in Venture-Backed Companies, US vs. Europe ($)
Overall Investment
Am
ou
nt
Investe
d
($B
)
Source: Dow Jones VentureOne/Ernst &Young
1Q02 2Q02 3Q02 4Q02 1Q03 2Q03 3Q03 4Q03 1Q04 2Q04 3Q04 4Q04 1Q05$0
$1
$2
$3
$4
$5
$6
$7
European Equity Investment
U.S. Equity Investment

Biopharm & Software Lead 1Q’05 Investing
Equity Investment in European Venture-Backed Companies by Industry, 1Q‘05
Source: Dow Jones VentureOne/Ernst &Young
Retail0.5%
Products1%
Services3%
Software18%
Medical IS0.4%
Communications7%
Electronics3%
Information Services5%
Semiconductors14%
Medical Devices5%
Biopharmaceuticals44%
Info. Tech.49%
Prod. & Serv.6%
Healthcare45%

UK Leads 1Q’05 European Investment
Investment in Europe by Country, 1Q’05
Source: Dow Jones VentureOne/Ernst &Young
Other13%
Ireland5%
Sweden7%
Switzerland8%
Denmark9%
France12%
Germany16%
United Kingdom 30%

Top European Investors, 1Q’05Number of Equity Investments in European Venture-Backed
Companies
3i Group 22SPEF Venture 6CDC Entreprises Innovation 6Atlas Venture 6Societe Generale Asset Management 5Siparex Group 5MTI Partners 5ACE Management 5Life Sciences Partners BV 5I-Source Gestion 5

So What Have We Learned?