overview of voluntary renewable energy markets · renewable energy markets . jenny heeter, nrel ....
TRANSCRIPT

NREL is a national laboratory of the U.S. Department of Energy, Office of Energy Efficiency and Renewable Energy, operated by the Alliance for Sustainable Energy, LLC.
Overview of Voluntary Renewable Energy Markets
Jenny Heeter, NREL
State-Federal RPS Collaborative National Summit on RPS
Washington, D.C.
December 3, 2012

2
Compliance and Voluntary Sectors Comprise Large Portion of Renewable Generation; Compliance Obligations are Increasing
RPS market for new renewables surpassed 60 million MWh in 2011. It will likely grow to over 150 million MWh by 2015.
0
50
100
150
200
250
2007 2008 2009 2010 2011
Annu
al m
illio
n M
Wh
Surplus RECompliance (old)Compliance (new)Voluntary
Sources: LBNL 2012, NREL 2012, EIA 2012
Notes: New renewables defined based on state-specific distinctions between new vs. existing or on the year in which the RPS was enacted . Some compliance renewables may come from small-hydro facilities. Compliance figures assume that RPSs are met using renewables (not through an alternative compliance payment).
Total non-hydro renewable generation

3
Key Components of Voluntary Market
• Three primary ways to purchase voluntary green power: o Utility green pricing program o Competitive market o Unbundled REC market
• Most customers in the voluntary market are residential; most sales are to non-residential
• The voluntary market is separate from the compliance market, though RE generators may participate in both markets.

4
Preventing Double Counting Ensures Market Credibility
• State RPS rules prohibit using a REC for compliance that is also sold or claimed in a voluntary market
• Center for Resource Solutions’ Green-e Energy program prohibits double counting of RECs
• The Federal Trade Commission’s newly released Green Guides clarify that it is deceptive to make a renewable claim without owning the RECs

5
Voluntary Market is Growing, by Many Indicators
Sources: CRS 2012, EIA 2012, EPA 2012, REC Tracking Systems
The overall voluntary market continues to exhibit strong growth.
0
5
10
15
20
25
30
35
40
45
2006 2007 2008 2009 2010 2011
Mill
ions
of M
Wh
Annu
ally
NREL EstimatedTotal VoluntaryMarketGreen-e EnergyRetail Sales
EPA-GPP Sales
Tracking SystemEstimate

6
Data Sources and Limitations
• U.S EPA’s Green Power Partnership o Provided data on magnitude of purchases by its corporate,
institutional, and government partners. More than 1,300 U.S. organizations; most of large purchasers.
• Center for Resource Solutions’ Green-e Energy retail sales o Reports certified sales; represented 65% of total voluntary
market in 2010. • U.S. Energy Information Administration (EIA)
o Collects data from utilities and marketers in two ways: – Annual data (2011 not released yet) – Monthly data (sample of respondents, 2011 data available)
• Regional REC tracking systems o Publically available data on voluntary RECs issued; some tracking
systems report retired RECs as well.

7
Unbundled REC Market is Largest Voluntary Sector
0
5
10
15
20
25
30
35
40
2006 2007 2008 2009 2010
Annu
al g
reen
pow
er sa
les
(m
illio
ns o
f MW
h)
Utility Green Pricing Competitive Markets Unbundled REC Markets

8
Green Pricing Programs are Active in 50 States
Source: EIA, 2012. Note: Incorporates EIA reporting entities only.
Leading states often have multiple utilities actively engaging their customers to participate in green power programs.
> 500,000
200,000 - 500,000
100,000 - 200,000
10,000 - 100,000
1,000 - 10,000
100 - 1,000
< 100
2011 Green Power Sales by State
(MWh)

9
Some Utilities Post Annual Green Power Sales Increases
Source: EIA, 2012. Note: The EIA 826 dataset is not a comprehensive list of utilities, rather a selection of industry respondents.
Within the EIA 826 sample, some programs saw declines between 2010 and 2011, while a number posted minor increases.
Portland General Electric CoPacifiCorp
Sacramento Municipal Util DistPuget Sound Energy Inc
Public Service Co of ColoradoConnecticut Light & Power Co
Northern States Power Co - MinnesotaWisconsin Electric Power Co
Indianapolis Power & Light CoMadison Gas & Electric Co
Virginia Electric & Power CoInterstate Power and Light Co
PECO Energy CoPublic Service Co of NM
Los Angeles Department of Water &…Niagara Mohawk Power Corp.
Avista CorpUnion Electric Co - (MO)
Consumers Energy Co
Annual Green Power Sales (MWh)
2011
2010

10
Sample of Green Power Customers per Utility
Total customer participation for the 20 largest programs grew by 6.5% in 2011, to a total of 487,895 customers.
0 10,000 20,000 30,000 40,000 50,000 60,000 70,000 80,000 90,000
Portland General Electric CoPacifiCorp
Sacramento Municipal Util DistPuget Sound Energy Inc
Public Service Co of ColoradoWisconsin Electric Power Co
Connecticut Light & Power CoPECO Energy Co
Northern States Power Co - MinnesotaLos Angeles Department of Water & Power
New York State Elec & Gas CorpVirginia Electric & Power Co
Consumers Energy CoPublic Service Co of NM
Madison Gas & Electric CoNiagara Mohawk Power Corp.
Wisconsin Power & Light CoInterstate Power and Light Co
Number of Green Power Customers
2011
2010
Source: EIA, 2012. Note: The EIA 826 dataset is not a comprehensive list of utilities, rather a selection of industry respondents.

11
Green Power Customer Penetration Mixed
The average participation rate for the largest 20 programs in terms of green power customers in 2011 was 2.9%, ranging from 0.5% to 9.8%, while the average
participation rate for all programs reported in the 826 in 2011 was 0.9%.
0% 2% 4% 6% 8% 10% 12%
Portland General Electric CoSacramento Municipal Util Dist
Madison Gas & Electric CoLower Valley Energy Inc
PacifiCorpLos Alamos County
Black Hills Electric Coop, IncCity of Eugene - (OR)
Emerald People's Utility DistPuget Sound Energy Inc
Connecticut Light & Power CoPublic Service Co of NM
New York State Elec & Gas CorpCity of Newark - (DE)
Public Service Co of ColoradoCity of Fort Collins - (CO)
Central Vermont Pub Serv CorpPoudre Valley R E A, Inc
2011
2010
Source: EIA, 2012. Note: The EIA 826 dataset is not a comprehensive list of utilities, rather a selection of industry respondents.

12
2011 Saw New Institutions Purchasing and Increased Purchases by Others (1/2011 to 6/2012) New to Top 50 Increased Purchase
13
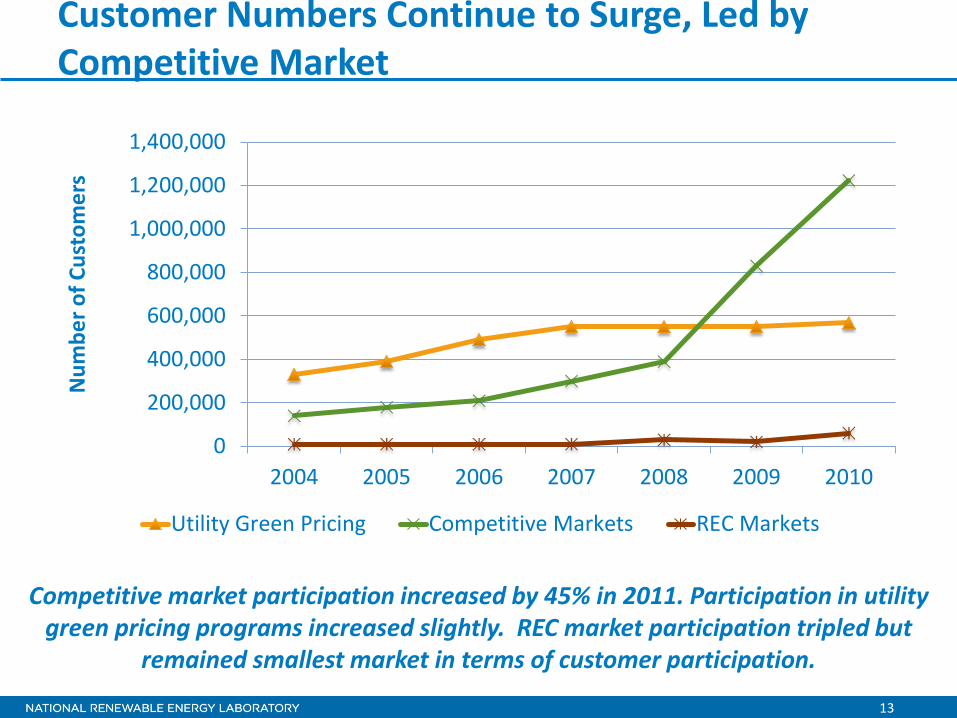
Customer Numbers Continue to Surge, Led by Competitive Market
0
200,000
400,000
600,000
800,000
1,000,000
1,200,000
1,400,000
2004 2005 2006 2007 2008 2009 2010
Num
ber o
f Cus
tom
ers
Utility Green Pricing Competitive Markets REC Markets
Competitive market participation increased by 45% in 2011. Participation in utility green pricing programs increased slightly. REC market participation tripled but
remained smallest market in terms of customer participation.

14
Case Study: Voluntary Retirements Continue to Outpace Compliance Retirements in Texas
Source: ERCOT, 2007-2011.
0
5
10
15
20
25
2007 2008 2009 2010 2011
Mill
ions
of M
Wh
Annu
ally
ERCOT VoluntaryRetirements fromPrevious Years
ERCOT VoluntaryRetirements fromCurrent Year
ERCOT RPSRetirements
ERCOT’s voluntary market has exceeded the compliance market for multiple years.

15
Voluntary REC Prices Continue to Decline
Source: Spectron Group, 2012.
$0$1$2$3$4$5$6$7$8$9
$10
Volu
ntar
y RE
C pr
ice
($/M
Wh)
West Wind
National Wind
National AnyTechnology
Voluntary REC prices continue to decline from previous levels.

16
Compliance REC Prices Mixed; Recent Rise in Northeast Markets
$0
$10
$20
$30
$40
$50
$60
$70
Com
plia
nce
REC
pric
es ($
/MW
h)
CTDCDEIL WindMAMDMENHNJPARITX
Compliance REC spot prices have risen sharply over the past year in New England states.
Source: Spectron Group, 2012.

17
Community Solar Continues to Take Off; Mix of Voluntary and Compliance
Utility/Provider Program Name Program Size (kW)
Program Start Year
UniSource Energy Services (AZ) Bright Arizona Community Solar 1,720 2012
San Miguel Power Association/Clean Energy Collective (CO) SMPA Community Solar 1,000 2012
Colorado Springs (CO) Community Solar Garden Facility Incentive Program 500 2012
Brewster Community Solar Garden Coop. Inc. (MA)
Brewster Community Solar Garden 345 2012
Acorn Energy Coop. (VT) Acorn Energy Solar One 150 2012
Poudre Valley REA/Clean Energy Collective (CO) Community Solar 115 2012
Olympia (WA) Olympia WA, SunSlice Deal 75 2012
United Power (CO) Sol Partners Coop. Solar Farm 10 2012
RECs from community solar projects are often used for compliance mandates.

18
Strong Growth for Community Solar
0
2,000
4,000
6,000
8,000
10,000
12,000
0
2
4
6
8
10
12
2006 2007 2008 2009 2010 2011 2012(as of8/15)
Cum
ulat
ive
Capa
city
(kW
)
Num
ber o
f Pro
gram
s Add
ed
Annu
ally
Number of newprogramsCumulative capacity(kW)
Community solar is a popular niche and appears poised for continued strong growth. It is important to note however that the installed capacity
is still quite small (≈ 10 MW).

19
Voluntary Market Highlights
• 2011 voluntary sales grew on the order of 20% (EPA-GPP 22%, Green-e 19%)
• New large companies undertaking purchases: Microsoft, McDonalds, Coca-Cola
• Dodd-Frank did not consider RECs to be swaps; averting concerns about REC markets
• ERCOT remains largest voluntary market, at ≈20 million MWh, by significant share
• Voluntary REC prices remain low, under $1/MWh • Mixed participation among utility programs, some
losing customers, others showing gains • Community solar a small but bright spot, most new
programs

20
Additional Information
Subscribe to Email
Updates Recent publications

NREL is a national laboratory of the U.S. Department of Energy, Office of Energy Efficiency and Renewable Energy, operated by the Alliance for Sustainable Energy, LLC.
Contact Information:
Jenny Heeter
National Renewable Energy Laboratory
303-275-4366