overview on the energy resources in malaysia - … on the energy resources in malaysia ... the power...
TRANSCRIPT

Overview on the Energy Resources in Malaysia
Forum on “Nuclear energy as an option for Malaysia”, United Nations Association Malaysia,
16 February 2012
ByYBhg Dato’ Sri Che Khalib Mohamad Noh,
President / Chief Executive Officer,Tenaga Nasional Berhad

2
Where Are We Now, Where Are We Going?
• Status and energy Scenario– Current and Future
• Options For the Future– Issues– Challenges
• Why nuclear ?
• Why Not only RE?
• Where Do We Go From Here?
2

3
Planning Today For A Better Tomorrow
To carry out :– Short and long term electricity demand forecast, and
long term planning for generation and transmission network
in order to ensure:– Safe, adequate, secure, reliable and economic
operation
of the country power supply system
3

Electricity demand is on the rise in 2012 4

• The Power System was premised on three pillars:
A. Equilibrium with generation capacity plant-up
• To ensure that power sector has ample capacity and sufficient reserves to
cater for meeting demand as well as planned and forced outages of
generation units.
B. Equilibrium with system security and reliability
• To ensure that the generation reliability criteria Loss-Of-Load-Probability
(LOLP) of not more than one day/year is met.
C. Equilibrium with customer tariffs
• To ensure the sustainability of the industry while ensuring the right balance
between costs of supply and customer tariff.
The Equilibrium of the Power Sector5

Equilibrium with generation capacity plant-up 6
Installed capacity
Peak demand
NEW
(2 X 1000 MW
)
NEW
(1 X 1000 MW
)
NEW
(1 X 1000 MW
)

7
7
The power sector was designed based on gas volume of 1,350 mmscfd which was agreed in 2003. No new capacity of gas fired power plant since 2003. There has been a significant
increase of coal fired power plant since 2003 from 3,670 MW to 7,170 MW in 2011.
Equilibrium with generation capacity plantEquilibrium with generation capacity plant--up up

8
Peak Demand Growth of Around 3% Until 2030
8Slightly higher growth in the near term (~3.4%) and lower growth projection up
until 2030 (~2.5%)
YearPeak Demand, MW
Sep 2011 vs Sep 2011 vs
May 2011 Nov 2010
2012 -421 -421
2013 -341 -341
2014 -290 -290
2015 -221 -291
2020 -243 -380
2025 -389 -692
2030 -550 -1,04715,476 MW
Dec/Sept 2011 forecast
9
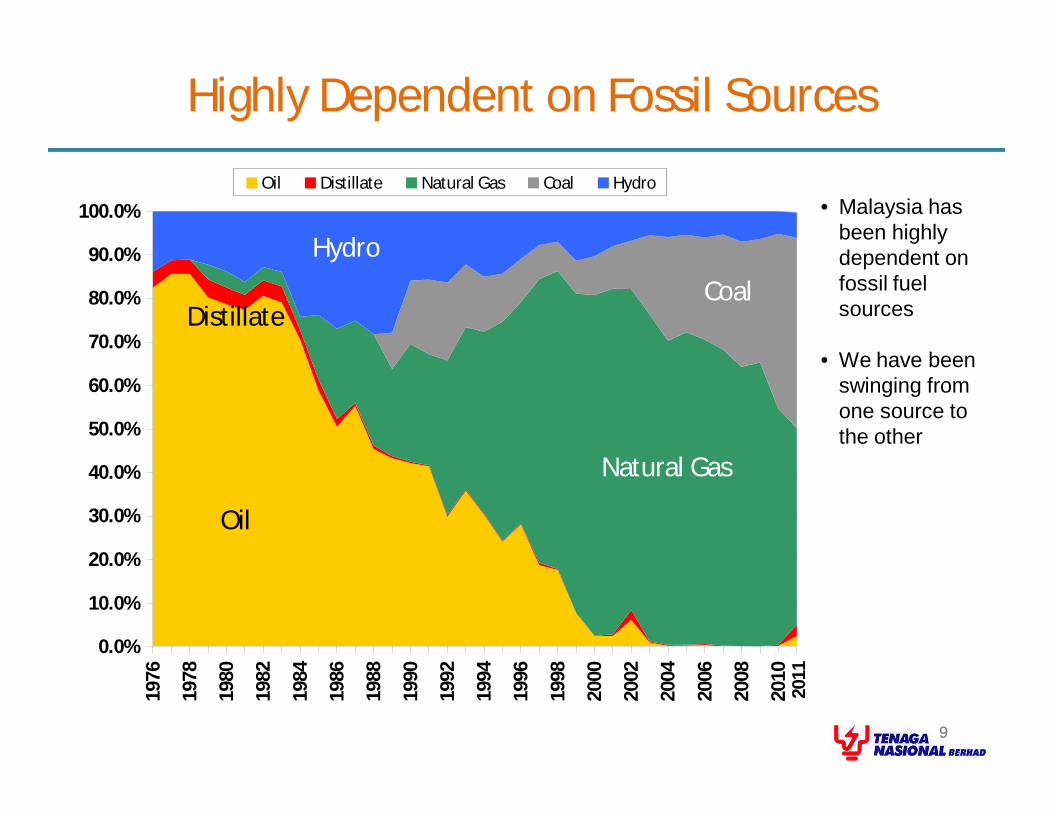
Highly Dependent on Fossil Sources
9
Oil
Distillate
Natural Gas
Coal
Hydro
0.0%
10.0%
20.0%
30.0%
40.0%
50.0%
60.0%
70.0%
80.0%
90.0%
100.0%
1976
1978
1980
1982
1984
1986
1988
1990
1992
1994
1996
1998
2000
2002
2004
2006
2008
2010
Oil Distillate Natural Gas Coal Hydro
2011
• Malaysia has been highly dependent on fossil fuel sources
• We have been swinging from one source to the other

110
• Peninsular Malaysia energy mix in 2011• Fossil fuel dominate 94% of total energy mix• Need more diversification and reduction of fossil fuel
Source: TNB System Planning, December 2011
Generation Mix 2011: Peninsular Malaysia
Distillate2.5%
Oil2.5% Import
0.3%
Gas45%
Coal44%
Hydro5.7%
Total energy generation in 2011 is 103,327 GWh

11
Depleting Local Natural Gas
11
• Power sector needs 1350 mmscfd at least until 2030
• Local gas resources are depleting
• Future gas development will be more challenging: High CO2
Smaller fields Costly
• Future demand cannot be met from indigenous sources. We would need to import, most probably in form of LNG
Source: PETRONAS presentation
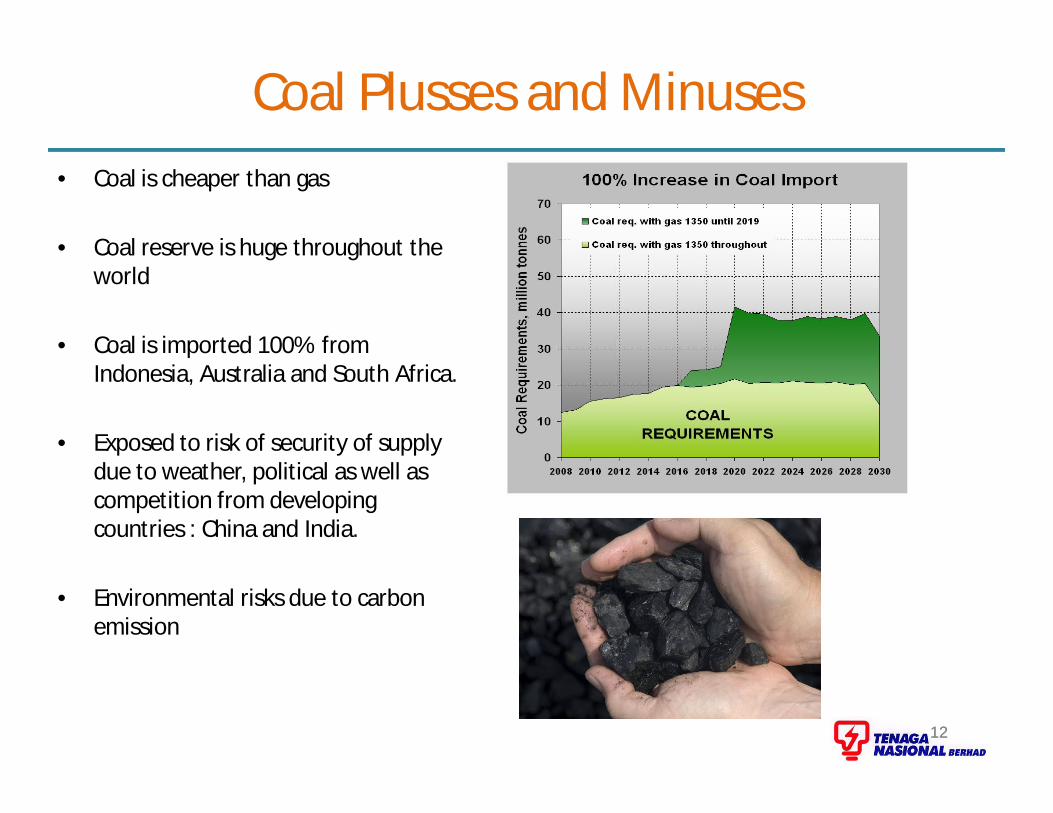
12
• Coal is cheaper than gas
• Coal reserve is huge throughout the world
• Coal is imported 100% from Indonesia, Australia and South Africa.
• Exposed to risk of security of supply due to weather, political as well as competition from developing countries : China and India.
• Environmental risks due to carbon emission
12
Coal Plusses and Minuses

1313
• Remaining hydro resources (1,725MW) are small and mainly for peaking (2 – 3 hours operation a day)
• Developing Hulu Terengganu (250 MW) and Ulu Jelai (372 MW) to commission in 2015 and 2016
REMAINING PENINSULA HYDRO POTENTIAL IS TOO SMALL AND NOT ABLE TO MEET FUTURE DEMAND
Limited Local Hydro Potential

14
• Malaysia signed the Kyoto Protocol in March 1999 and ratified the Protocol in Sept. 2002
• During Copenhagen 2009
PM has indicated that Malaysia is adopting an indicator of a voluntary reduction of up to 40% in terms of carbon missions intensity by the year 2020 compared to 2005 levels subject to assistance by the Annex 1 countries
• Possibility of more stringent environmental regulations –
• Locally – Clean Air Act
• Internationally – carbon emission limit
0.0
0.1
0.2
0.3
0.4
0.5
0.6
0.7
0.8
0.9
1.0
Gas CC Gas GT Coal Nuclear Diesel
Fuel & Plant Type
tCO
2/MW
h
14
Environmental Commitments

15
Huge Potential In Sarawak
15
Source Capacity
Bakun (Hydro) 2400 MW
Murum (Hydro) 1000 MW
Baram (Hydro) 1000+ MW
Baleh (Hydro) 1400 MW
Ng. Merit (Coal) 1200 MW
BAKUN
MURUM
BARAM
BALEH
NG. MERIT
• Large potential in Sarawak
• With competitive price, potential in Sarawak could be connected to the Peninsular
• Bakun will not be connected directly to the Peninsular. The power will be utilized in Sarawak

1616Source: Ministry of Energy, Green Technology and Water, Energy Commission, MBIPV Project
Solar Biomass Biogas Mini-Hydro Solid Waste
Potential•~6,500 MW (for 40% buildings)
•Yearly average irradiance 1,400 –1,900 kWh/m2
Status•1 MW•MBIPV Projects (SURIA 1000, demo/showcase projects etc.)
Potential•~1,340 MW by 2030
Status•39 MW under construction as of July 2009•Biogen Project, palm oil waste (EFB), other waste e.g. woodchips, paddy husks etc.
Potential•~410 MW by 2028
Status•4.45 MW under construction as of July 2009•Palm Oil Mill Effluent (POME), livestock, agro, industrial waste
Potential•~490 MW by 2020
Status•30.3 MW under construction as of July 2009•Run-of-river scheme with minimum impounding
Potential•~360 MW by 2022•~21,000 tonnes of waste collected every day in M’sia
Status•5.5 MW commissioned as of August 2009
RE requires subsidy to move forward. KeTTHA has introduced FiT on Dec 2011
RE Is a Viable But Limited Option

1717
Solar Biomass Biogas Mini-Hydro Solid Waste
Relatively high capital cost (RM 19K/kW)
Low production ratio – 15% CF
Need huge area – 5 football fields/MW
Fuel supply security is questionable
Sparse location of mills
Most of the plantations and mills are far from load centers
Relatively high capital cost (RM 5K/Kw)
Location far from load center
Emission issue due to technology status (Broga)
Renewable Energy Limitations

1818
• Interconnection is also considered as a supply option
• Existing Interconnection
80MW AC & 300MW HVDC Link EGAT / TNB
200MW Link PUB / TNB
• Power Purchase and Economic Exchange may be possible from ASEAN power
THAILANDTHAILAND
M A L A Y S I AM A L A Y S I A
I N D O N E S I AI N D O N E S I A
PHILIPPINESPHILIPPINES
SINGAPORESINGAPORE
BRUNEI BRUNEI DARUSSALAMDARUSSALAM
BakunBakun
JambiJambi
Bt. AssamBt. Assam
K. NgaeK. Ngae
GurunGurun
CAMBODIACAMBODIA
LAOSLAOS
No. PROJECTS1 Peninsular Malaysia - Singapore2 Thailand - Peninsular Malaysia:
Stage 1: HVACStage 2: HVDC
3 Sarawak - Peninsular Malaysia4 Peninsular Malaysia - Sumatra5 Batam - Bintan - Singapore - Johor6 Sarawak - West Kalimantan7 Philippines - Sabah8 Sarawak - Sabah - Brunei Darussalam9 Thailand - Lao PDR10 Lao PDR - Vietnam11 Thailand - Myanmar12 Vietnam - Cambodia13 Lao PDR - Cambodia14 Thailand - Cambodia
Mae MohMae Moh
HongsaHongsa
Nam Nam TheunTheun
Ha TinhHa Tinh
PleikuPleiku
Ban SokBan Sok
UdonUdon
NabongNabong
SavannakhetSavannakhet
Roi EtRoi Et Ubol R. Ubol R.
22
BatamBatam
4411
5566
88
77
1010
99
33
VIETNAMVIETNAM
MYANMARMYANMAR
Mae Mae SotSot
BagoBago
Siem ReapSiem Reap
Phnom Phnom PenhPenh
W. Nakhon W. Nakhon
1111
1212
1414
1313
• Continuous effort and collaboration among ASEAN members is on going. Nevertheless, interconnection issues will be evaluated specifically on case by case basis.
Interconnection With Our Neighbors

19
0.00
0.05
0.10
0.15
0.20
0.25
0.30
Gas CC -NO subsidy
(21.40)
Gas CC -with
subsidy (10.70)
Gas CC LNG
(27.00)
Coal (USD 88/tonne)
Nuclear
Levelized Cost (RM/kWh)
0
0.1
0.2
0.3
0.4
0.5
0.6
0.7
0.8
0.9
1
Gas CC Coal Nuclear
Carbon Emission (tCO2/MWh)
• Energy Security and Diversification– Reduction of fossil sources dependency
– Local sources is limited, longer fuel cycle for nuclear could provide security and allow better planning and execution
– Multiple sources for power generation helps distribute the risk of energy security
• Economic of scale for long term– Longer fuel cycle results to lower fuel cost
– Cushion other fuel price volatility risks
– Nuclear levelized cost is the cheapest compared to gas and coal options
• Environment concern– Relatively very low or non-existence
emission in comparison to other sources
What is Special About Nuclear?

20
What is Special About Nuclear? (cont’d)
(e.g. Finland)
21
What is Special About Nuclear? (cont’d)
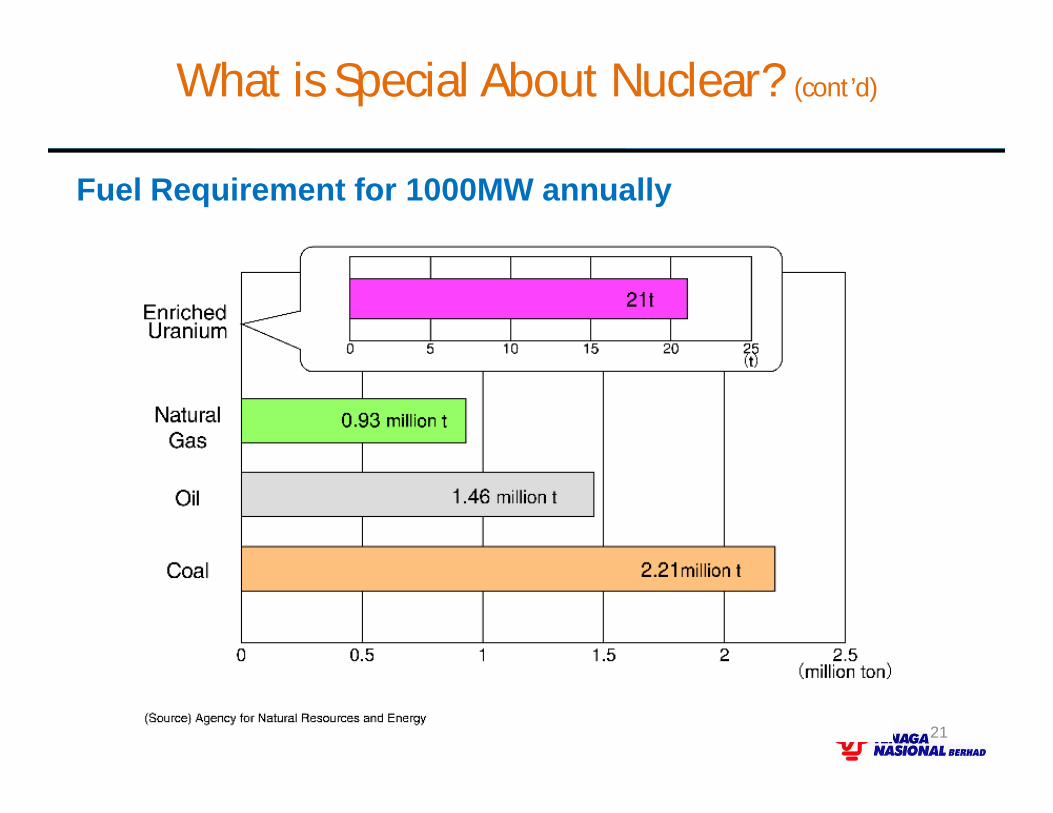
Fuel Requirement for 1000MW annually

22
What is Special About Nuclear? (cont’d)
221 Assumes 1 MW can be generated by 7.4 acres of solar PV cells
Nuclear Power Plant1800 MW
4.5 square km
Solar PV Power Plant1800 MW-equivalent
54 square km1
24 hours a day
Max 20% capacity factor(equivalent to 73 days per year)
90% capacity factor(equivalent to 328 days per year)
Land not including energy storage capability
Maximum 9 hours a day
Land not including geological repository
Source: ENTERGY Arkansas
630 football pitches 7563 football pitches
23
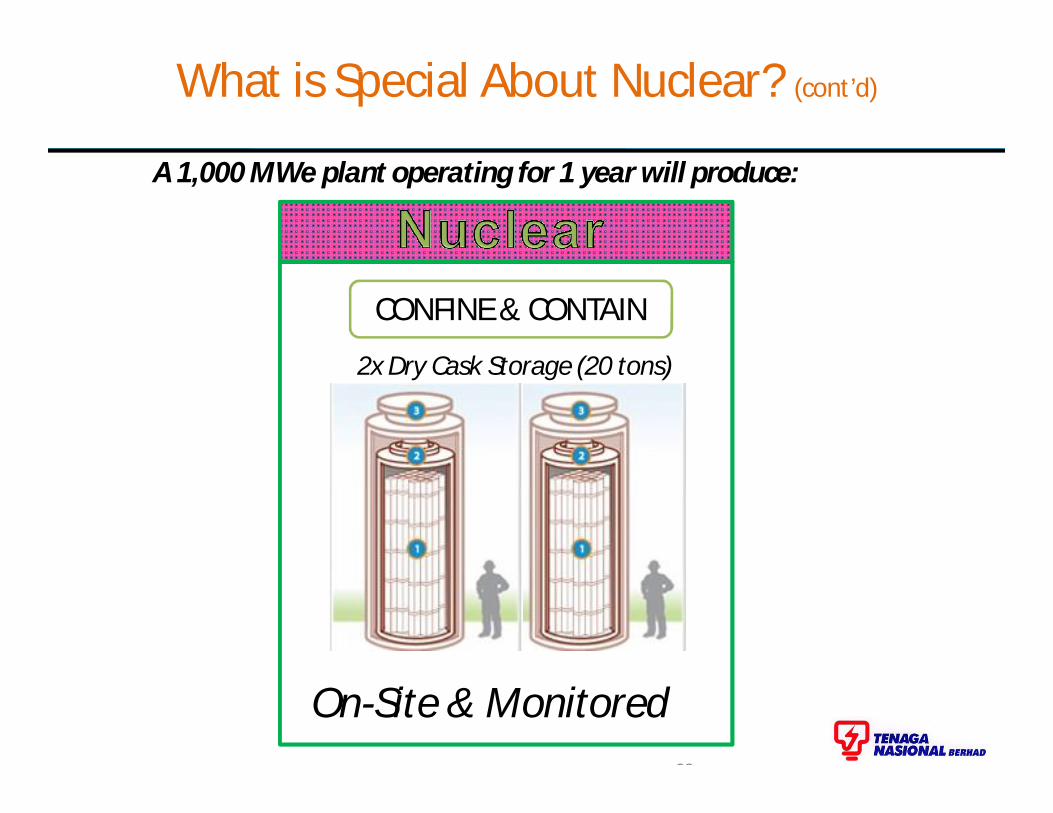
What is Special About Nuclear? (cont’d)
On-Site & Monitored
2x Dry Cask Storage (20 tons)
CONFINE & CONTAIN
A 1,000 MWe plant operating for 1 year will produce:

2424
• Public perception to nuclear – NIMBY syndrome.• Three Mile Island, Chernobyl & Fukushima incidents raised the bar for
nuclear safety globally.• Long lead time, 10 to 15 yrs and high cost of investment.• Extensive preparation - public acceptance, regulatory, site
preparation, manpower development.• Used fuel storage issues• Proliferation and possibility of terrorism• Weapons development
“ Thirty years on, my views have changed, and the rest of the environmental movement needs to update its views, too, because nuclear energy may just be the fuel source that can save our planet from another possible disaster: catastrophic climate change.”- Patrick Moore, co-founder of Greenpeace, in the Washington Post, April 16, 2006.
Public Concerns On Nuclear
25
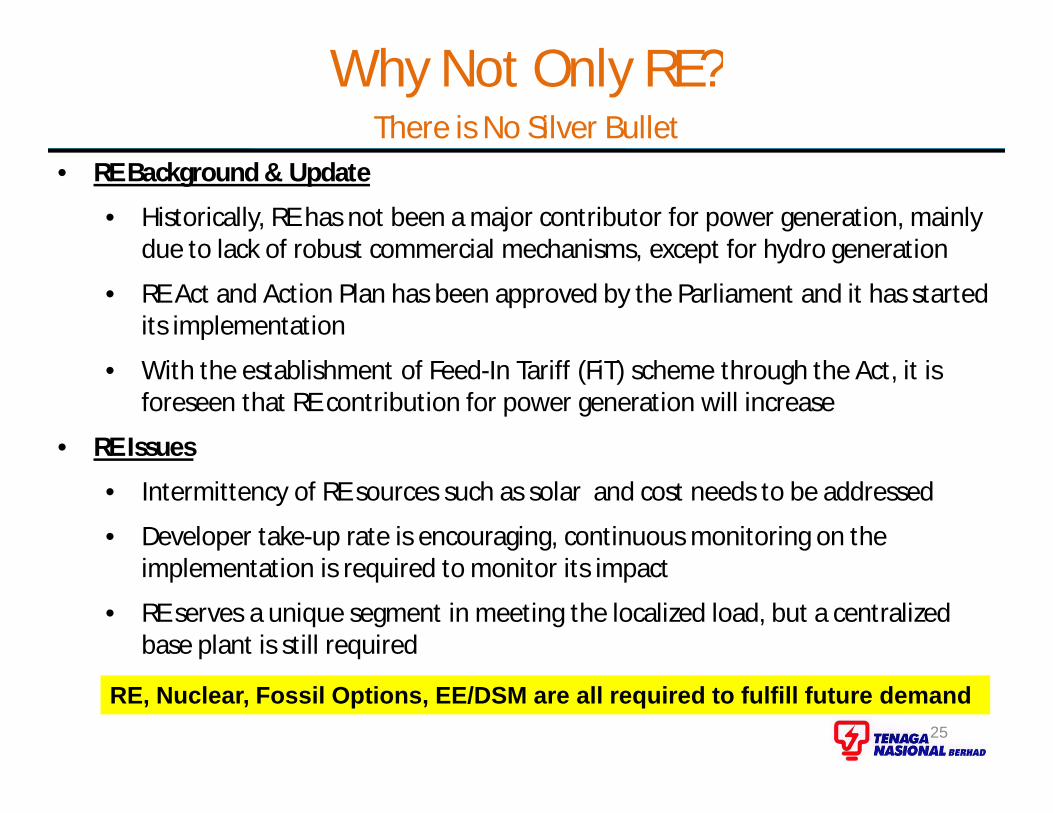
• RE Background & Update
• Historically, RE has not been a major contributor for power generation, mainly due to lack of robust commercial mechanisms, except for hydro generation
• RE Act and Action Plan has been approved by the Parliament and it has started its implementation
• With the establishment of Feed-In Tariff (FiT) scheme through the Act, it is foreseen that RE contribution for power generation will increase
• RE Issues
• Intermittency of RE sources such as solar and cost needs to be addressed
• Developer take-up rate is encouraging, continuous monitoring on the implementation is required to monitor its impact
• RE serves a unique segment in meeting the localized load, but a centralized base plant is still required
Why Not Only RE?There is No Silver Bullet
RE, Nuclear, Fossil Options, EE/DSM are all required to fulfill future demand

26
Please Go Home With These In Mind
26
• We will be facing tougher time in the future
– Local resources are depleting, more dependency on import fuels
– Higher cost due to more import fuel
• We need to be more prudent in managing risks and planning
– Need balanced development to distribute risks
– Need to open our possible supply options to all possible technologies for the future. We need all resources, gas, coal, hydro, renewable, nuclear
– Need to plan carefully for power system development, especially nuclear
– Need for increased contribution from Demand Side Management (DSM) and Energy Efficiency (EE) especially in terms of policy and establishment of commercial mechanisms
– Need to ensure proper development of nuclear for the country

27
Thank You
27
Planning Today For A Better Tomorrow