owner occupancy fraud and mortgage performance owner occupancy fraud and mortgage performance *...
TRANSCRIPT

1
Owner Occupancy Fraud and Mortgage Performance*
Ronel Elul† Federal Reserve Bank of Philadelphia
Sebastian Tilson Federal Reserve Bank of Philadelphia
October 13, 2016
Abstract
We use a matched credit bureau and mortgage dataset to identify occupancy fraud in residential
mortgage originations, that is, borrowers who misrepresented their occupancy status as owner
occupants rather than residential real estate investors. In contrast to previous studies, our dataset
allows us to show that such fraud was broad based, appearing in the government-sponsored
enterprise market and in loans held on bank portfolios as well. Mortgage borrowers who
misrepresented their occupancy status performed worse than otherwise similar owner occupants
and declared investors, defaulting at nearly twice the rate. In addition, these defaults are
significantly more likely to be “strategic” in two senses: first, that their bank card performance is
better and utilization rates lower; in addition, the default decisions of fraudulent investors in
significantly more sensitive to house price changes. Finally, we show that the interest rates paid
by fraudulent investors were only modestly higher for private securitized and GSE-guaranteed
loans, suggesting that they were not able to consistently identify such fraud; by contrast, those
fraudulent investors whose mortgages were held on bank portfolios paid significantly higher
rates.
Keywords: mortgages, mortgage default, consumer credit, household finance, misreporting, fraud
JEL Codes: D12, R3
* The authors thanks Neil Bhutta, Tomasz Piskorski, Stijn Van Nieuwerburgh and James Vickery, and participants at the Eastern Economic Association, AREUEA and IBEFA summer meetings, and the Wharton Finance Macro lunch for helpful comments and discussions. † Elul and Tilson are both from the Federal Reserve Bank of Philadelphia. Corresponding author: Ronel Elul, e-mail: [email protected]; tel: 215-574-3965. The views expressed in this paper are those of the authors and do not necessarily reflect those of the Federal Reserve Bank of Philadelphia or the Federal Reserve System. This paper is available at www.philadelphiafed.org/research-and-data/publications/working-papers.
2
I. Introduction
Policymakers and the popular press have cited anecdotal evidence to suggest that one of the
contributing causes to the housing bubble was pervasive mortgage fraud.1 Recent academic work has also
verified the existence of mortgage fraud along several dimensions. Ben-David (2011) finds evidence of
inflated prices. Griffin and Maturana (2015a) examine three dimensions of fraud among securitized
nonagency loans: unreported second liens, owner occupancy misreporting, and appraisal overstatements.
Piskorski, Seru, and Witkin (2015) study second lien misreporting and occupancy fraud in the nonagency
securized market. Mian and Sufi (2015) argue that borrowers misstated their incomes on mortgage
applications.
In this paper, we use a matched credit bureau and mortgage dataset to identify occupancy fraud in
loans originated between 2005 and 2007. This occurs when mortgage borrowers claim on the mortgage
application that they will be the owner occupants of the property, will not rent the property out to another
individual or family, and do not intend to sell the property quickly. Borrowers may have an incentive to
commit occupancy fraud because the benefits can be substantial: Banks often require declared residential
mortgage investors to offer higher down payments and charge them higher interest rates because of the
elevated default risk of investor loans (which we also document in this paper). In contrast to previous
work, our data allow us to confirm that occupancy fraud was pervasive and did not just affect private-
securitized loans. It appeared in government-sponsored enterprise (GSE)–guaranteed, private securitized,
and portfolio-held loans (by contrast, Federal Housing Administration (FHA) loans exhibited markedly
lower fraud rates). We show that accounting for fraudulent investors more than doubles the size of the
effective investor population, and that these fraudulent investors are concentrated amongst the prime
population.
After we have identified these investors from the matched credit bureau and mortgage data, we
compare the performance of the honest homeowners, the fraudulent investors, and the honest declared
investors. We find that the fraudulent investors, after controlling for available characteristics, performed
substantially worse than otherwise similar honest homeowners and declared investors. We find that they
make up an 18% of the dollar share of defaulted loans for originations during this time period.
1 See the Financial Crisis Inquiry Report, 2011.

3
This is significant, as Adelino, Schoar and Severino (2016), and Foote et al (2016) have argued
that much of the increase in net borrowing in the housing boom, and defaults during the bust, can be
attributed to the prime sector.
Using the credit bureau data, we gain an understanding of the borrowers’ other consumer
liabilities, particularly bank cards. We find that the fraudulent investors who defaulted on their mortgages
had significantly lower bank card utilization rates and were likelier to be current on these accounts
relative to both honest homeowners and declared investors.
Finally, we also interact consider the impact of state laws concerning deficiency judgments on this
strategic behavior. Ghent and Kudlyak (2011) have shown that state laws that limit lenders’ ability to
pursue deficiency judgments are associated with higher default rates. We confirm this for honest
homeowners and fraudulent investors. Conversely, we also show that declared investors’ default behavior
is unaffected by these laws, which reflects the fact that many states restrict the prohibition against
pursuing deficiency judgments to owner-occupied properties (see Pence, 2006).
The remainder of the paper is organized as follows. Section II describes the related literature.
Section III describes the data we have used. Section IV documents our definition of mortgage occupancy
fraud. Section V provides descriptive statistics on occupancy fraud. Section VI covers loan performance.
Section VII presents the results from estimating our econometric models. And Section VIII concludes.
II. Related Literature
This paper is not the first to examine the role of owner occupancy fraud and its impact on loan
performance. Although they do not focus on fraud per se, Haughwout, Lee, Tracy, and van der Klaauw
(2011) were among the first to use credit bureau data to explore the role of real estate investors during the
mortgage boom and to show that the self-reported occupancy status may paint a misleading picture. They
document significant increases in the share of purchase mortgages attributed to borrowers with multiple
first lien mortgages in their credit files, with as many as half of all purchase mortgages attributable to
investors in states that experienced the largest housing booms and busts. They also show that such
investors account for a substantial share of defaults.
Several different strands of mortgage misrepresentation are explored in the literature. Garmaise
(2015) explores the role of borrower misreporting of personal assets just above round number thresholds.

4
He finds that borrowers who reported above-threshold assets were 25 percentage points more likely to
default. Mian and Sufi (2015) explore the role of fraudulent income overstatement on mortgage
applications. They compare the growth in income as implied by mortgage applications with the average
Internal Revenue Service–reported income growth at the zip code level, and they find that there was
substantial divergence between these two series. Income overstatement was higher in zip codes with low
credit scores and low incomes; Mian and Sufi show that borrowers in these zip codes experienced some of
the most significant increases in mortgage credit during the boom.
Piskorski et al. (2015) analyze privately securitized loans and find that second lien
misrepresentation was widespread and occurred late in the intermediation process (e.g., by the
underwriters of the residential mortgage-backed securities). More relevant to our paper, in their Internet
Appendix, they detail additional analysis on the role of owner occupancy misrepresentation in their
sample of privately securitized loans. They infer owner occupancy misrepresentation by comparing the
property zip code reported by the residential mortgage backed securities (RMBS) trustee with 12 months
of credit bureau–reported zip codes for the matched borrower. If none of these zip codes matches, then the
authors conclude that this loan was characterized by owner occupancy fraud.
Note that this method of inference does not allow them to identify within–zip code
misrepresentation, that is, fraudulent investors who misrepresent their owner occupancy status in the zip
code in which they normally live. These “smart money” investors (Li, 2015) are likely aware of local
trends and factors that should affect the value of local real estate, as opposed to distant speculators who
trade on noise and create mispricing in local markets (Chinco and Mayer, 2015). We show, however, that
occupancy fraud affected mortgages originated both to those living in the same zip code as well as those
in different zip codes. In addition, we can identify occupancy fraud not just for loans that were privately
securitized, but also loans insured by the GSEs and those held in bank portfolios. Griffin and Maturana
(2015a) also examine three types of fraud (unreported second liens, owner occupancy misreporting, and
appraisal overstatements) in privately securitized loans by matching to deeds data. They find that nearly
half of the loans examined had at least one form of fraud and that these loans had 51% higher delinquency
rates than otherwise comparable loans. They argue that investors appeared to be unaware of the
incendence of fraud. Finally, they explore the extent to which mortgage fraud and misrepresentation were
responsible for the recent house price boom–bust cycle (2015b).

5
III. Data Description
We use a data set known as CRISM, or Credit Risk Insight Servicing McDash.2 It is a match
between loan-level mortgage data from McDash Analytics (formerly known as LPS) and credit bureau
data from Equifax. Personally identifiable information has been removed. CRISM’s monthly observations
begin in June 2005. We restrict our data to borrowers who
(1) Are listed as the “primary” borrower in CRISM;
(2) Are available and listed as primary borrowers in the Federal Reserve Bank of New York
Consumer Credit Panel (FRBNY CCP); and
(3) Originated a first lien purchase mortgage loan for a single-family unit in the McDash data set
between June 2005 and 2007.
Table 9 gives a comparison of our sample with the loans originated during this time period from
the entire McDash dataset.
Crucial to our occupancy fraud identification process, we further focus on CRISM-matched
borrowers who also appear in the FRBNY CCP, so that we can use information on the borrowers’
scrambled addresses. We also restrict to borrowers who have scrambled address, zip code, and state data
from Equifax one quarter before and four quarters after their matched McDash mortgages originated. Our
definition of occupancy fraud is discussed in detail in Section IV.
We focus on borrowers with self-reported McDash occupancy type as owner occupants, declared
investors and second home buyers. We also exclude the small number of loans with origination loan-to-
value ratios (LTVs) either under 25% or exceeding 120%, loans whose matched borrowers’ bank card
utilization at first mortgage default was greater than 150%, loans whose McDash investor type six
months after origination was a Ginnie Mae buyout loan, local housing authority, federal home loan bank,
and unknown and mortgages with origination amounts exceeding $1 million. We also exclude Equifax
borrowers whose address type is a post office box either one quarter before or two quarters after their
matched McDash first lien originated.. Our final dataset consists of 146,425 loans, matched to 142,775
distinct borrowers.4
2 See Beraja et al (2015) for more detail on the CRISM dataset. 4 We begin with 3,727,623 McDash mortgages meeting criterion (3) who were also matched to consumers in Equifax in CRISM. Among these approximately 3.7 million consumers in CRISM, about 10% (369,541) are also found in the FRBNY

6
Our house price index (HPI) data come from CoreLogic, and we use zip code–level house price indices
for single-family detached homes (including distressed sales) when available and state-level indices
otherwise. Our county-level unemployment rates come from the Bureau of Labor Statistics (BLS)
IV. Defining Occupancy Fraud
A key aspect of our experimental design is the identification of fraudulent investors. We discuss
our definition and compare it with others in the literature. Importantly, the CRISM data enable us to
compare the self-reported occupancy type from the McDash Analytics loan-level data with information
from the borrowers’ Equifax matched credit bureau file. Our goal is to identify and classify borrowers
who self-report owner occupancy on their purchase mortgage applications (judged by the McDash data)
but who appear to be investors judging by their credit history information. In our owner occupancy fraud
classification algorithm, we focus on three pieces of information:
1. The self-reported occupancy type;
2. The count of first-lien mortgages four quarters after their matched McDash mortgage is
originated;
3. The borrowers’ Equifax scrambled address from one quarter before and four quarters after
when the McDash mortgage originated.
Using these data, we identify four types of borrowers:
1. Honest owner occupants: These are reported in the McDash data set as having originated
an owner-occupied home purchase loan and whose Equifax scrambled addresses one
quarter before and four quarters after their matched McDash mortgage originated are
different.
2. Fraudulent investors: These are reported in the McDash data set as having originated an
owner-occupied home purchase loan and whose Equifax scrambled addresses is the same
one quarter before and four quarters after their matched McDash mortgage originated. The
borrower’s credit bureau file also reports more than 1 first lien mortgage four quarters after
the matched lien was originated as well.
CCP. So, we focus on these 366,065 borrowers, matched to 369,541 mortgage loans, and after we apply the additional restrictions described above, our final data set consists of 146,425 loans matched to 142,775 distinct borrowers.

7
3. Declared investors: These are borrowers who are reported in the McDash data set as
taking out a mortgage for the purchase of an investment property.
4. Second home buyers: These are borrowers who are reported in the McDash data set as
taking out a mortgage for the purchase of a second home.
Note that we drop mortgages that do not fit in one of these four criteria. We further restrict our
attention to borrowers in the McDash data with single-family property types to avoid situations in which
our fraud classifier does not pick up an address change because of borrowers moving within a large
multifamily unit. Any concerns concerning the accuracy of the fraud classifier should bias downward the
likelihood of finding that these borrowers behave differently.
In Figures 7a and 7b we show that these criteria lead to a clear distinction between honest
homeowners and investors. The fraudulent investors are much closer to declared investors – both in terms
of their likelihood to change address and their propensity to have multiple first liens – than they are to
honest homeowners. In addition, this fugures also demonstrate that there is little drift in these variables
over time after 4 quarters following origination, which implies that we are unlikely to simply be picking
up slow updating of addresses and liens in the credit bureau files.
Our methodology of identifying owner occupancy misrepresentation differs from other papers that
have address the phenomenon, and we provide evidence that our approach has a number of benefits that
improve on existing work. Both Griffin and Maturana (2015a) and Piskorski, Seru, and Witkin (2015)
confine their analysis to private securitized loans (primarily subprime and jumbo mrotgages). By contrast,
we are able to study the extent of fraud across the entire universe of mortgage and loan types. As we show
below, this substantially increases to total amount of fraud. In particular, we find significant incidence of
fraud amongst prime GSE-guaranteed loans and those held on bank portfolios.
Also recall that Piskorski et al. (2015) classifies a loan as truly owner occupied if — for 12 months
of data after the mortgage originates — one of the borrowers’ zip codes from Equifax matches the
property’s zip code reported to the RMBS trustee. Our method, by contrast, enables us to identify
fraudulent investors who purchase and finance a purportedly owner-occupied property in the same zip
code in which they reside. We show below that this category represents a significant fraction of the
fraudulent investor pool, with distinct default behavior.
8
V. Descriptive Statistics
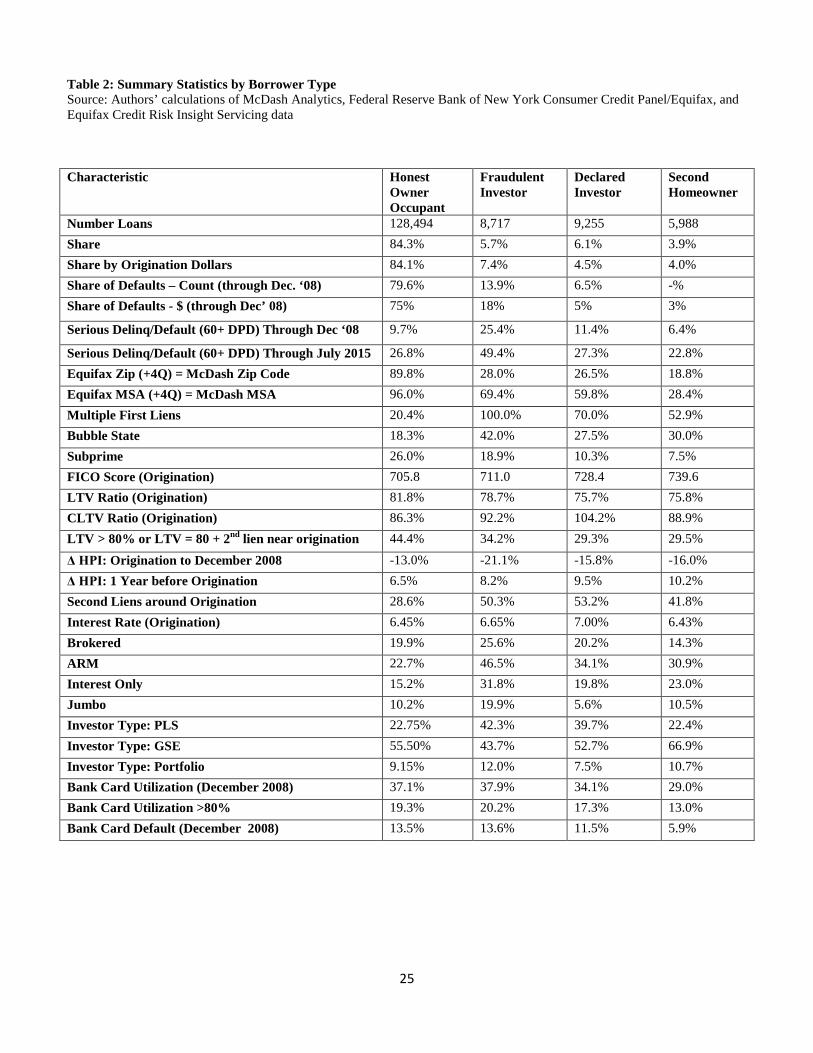
In this section, we compare origination characteristics by borrower type, that is, honest owner
occupants, fraudulent investors, declared investors and second home buyers.
Incidence of Occupancy Fraud
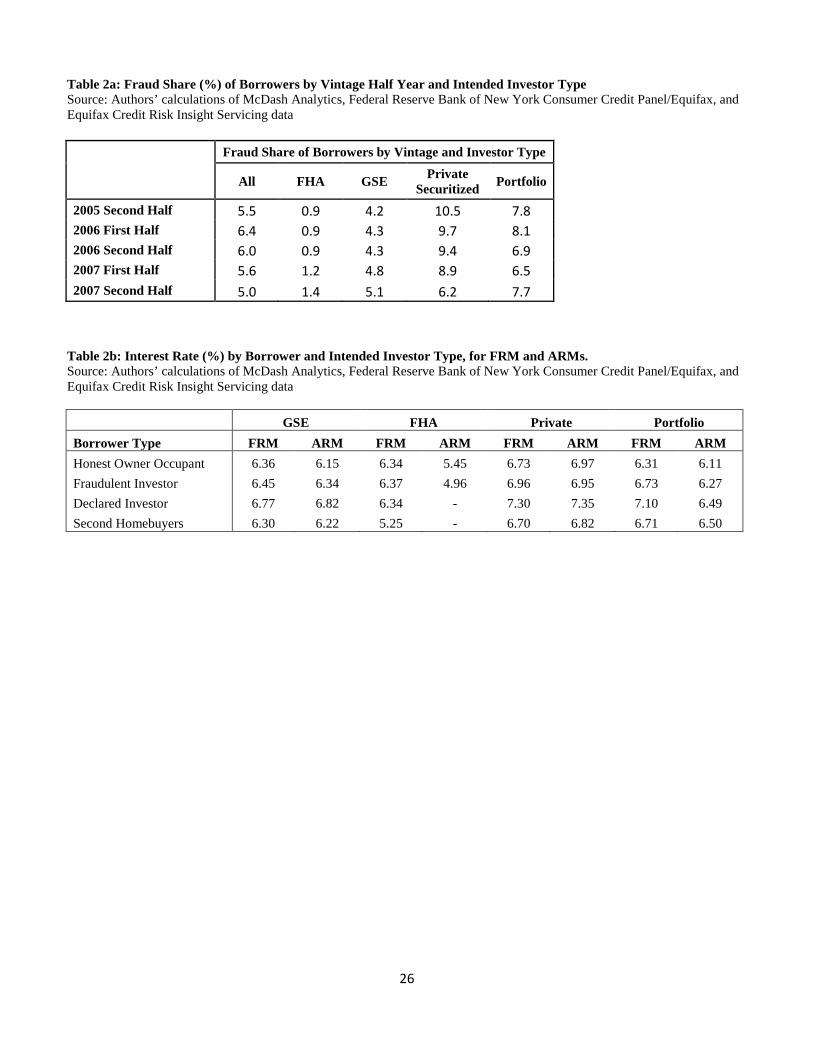
In Table 2a we show the share of borrowers by vintage half years and the intended investor type of
the mortgage who are classified as misrepresenting their occupancy status according to our definition of
occupancy fraud. Similar to Piskorksi (2015) we find a significant drop in the share of owner occupancy
misrepresentation among private-securitized loans from the first half of 2007 to the second half 2007,
consistent with the tighter standards that were reported in this market,5 but at the same time we find slight
increases in the share of owner occupancy misrepresentation among other types of loans, particularly
GSE-guaranteed mortgages, and loans held on the bank’s portfolio. Overall, our estimate of the share of
borrowers misrepresenting their occupancy status peaks in the first half of 2006 at 6.4% while it declines
to 5.2% for the 2007 second half vintage. We also show in Figure 8 that the fraud share continued to drop
further after 2007, leveling off at around 2.5% for originations from 2009-2014.
FICO Scores at Origination
Gao and Li (2012), find that most declared residential real estate investors are prime. We confirm
their results: the subprime share amongst declared investors is only 10%, as compared to 26% for honest
owner occupants (Table 2). We also show that the fraudulent investors we identify are overwhelmingly
prime as well: the subprime share in this group is one third lower than amongst the honest owner-
occupants.
The Geography of Mortgage Occupancy Fraud
Because occupancy fraud may have been undertaken to facilitate property speculation, Figure 1
gives a heat map with the state-level mortgage occupancy fraud rate for self-reported owner-occupied
mortgages for loans that were originated between 2005H2 and 2007. The geographic patterns are
informative: In the continental U.S., it appears that occupancy fraud rates were highest in California
(15.5%), Hawaii (14.1%), Nevada (12.8%), Florida (10.7%), Arizona (10.5%), New York (7.4%), New
Jersey (7.4%) Maryland (7.3%), and Illinois (7.1%). Iowa had the lowest estimated occupancy fraud rate
5 Similarly, there is a sharp drop in the share of private securitized subprime loans in the LPS dataset second half of 2007.

9
at 1.3%. We also show below that occupancy fraud was associated with prior run-ups in house prices in
the originating zip code (see also table 2).
As we next discuss, the origination characteristics also appear to suggest that the fraudulent
investors took on substantially riskier mortgages than declared investors and honest homeowners. We will
see later in this paper how they performed on their debt obligations as the housing boom came to an end
and house prices began their collapse across the country.
Originating Loan-to-Value Ratios
Not surprisingly, based on the reported first-lien origination loan-to-value (LTV) ratio, honest
homeowners put down the lowest down payments, and declared investors put down the highest down
payments on their properties. Fraudulent investors had a mean origination LTV ratio of 78.7%, closer to
honest homeowners’ mean LTV (81.8%) than to the LTV ratio of the declared investors (75.7%). This
higher LTV represented a substantial advantage for borrowers who misrepresented their occupancy type
because originators tend to require higher down payments from declared investors to compensate for the
known additional risk of default associated with real estate investors.
Second Liens and Combined Loan-to-Value Ratios
Our credit bureau data also allow us to check for the incidence of both closed-end and revolving
second liens (HELOCs). We focus on the presence of second liens around the time of origination of their
matched McDash first-lien purchase mortgages; specifically, we wait two quarters to capture the second
liens to allow time for them to appear in the credit bureau data. We find that the fraudulent investors
behaved much more similar to the declared investors than the honest homeowners in terms of the
incidence of second liens. We find that 28.6% of the honest homeowners had second liens around first
lien origination, while 50.3% of fraudulent investors and 53.2% of declared investors had second liens
around origination (see Table 2).
The widespread incidence of second liens around origination implies that the LTV ratios
calculated from the matched McDash first liens are an underestimate of the true overall equity positions of
the borrowers. Because the credit bureau data have not only the count of second liens but also the balance
10
associated with them, we add these balances to the origination amount and divide by the appraisal amount
to get an estimate of the combined LTV ratio for each property. We find that the equity positions were
worse than the first-lien LTV ratios implied, With the fraudulent investors having a mean estimated
CLTV ratio of 92.2% and declared investors having a mean estimated CLTV ratio of 104.2%.
Incidence of Adjustable-Rate, Interest-Only, and Jumbo Mortgages
Among the self-reported owner occupants, 9.7% of those we identify as honestly representing
their owner occupancy financed their homes with an adjustable-rate mortgage (ARM). However, we find
that fraudulent investors were 9.3 percentage points more likely to have entered into an ARM. Fraudulent
investors’ higher preference for ARMs more closely resembled that of declared investors (Table 2), who
financed their properties with ARMs at a rate of 17.3% on average. This is consistent with the possibility
that fraudulent investors were intending to hold these properties for a short period of time, thus making
them less sensitive to changes in interest rates. An alternative explanation is that taking out an ARM is
motivated by a desired by investors to conserve liquidity, given that they also have another mortgage.
Similarly, the share of mortgages that were interest-only at origination was substantially higher for
the fraudulent investors among the self-declared pool of owner occupants across both prime and subprime
borrowers. At its peak, fraudulent investors in the 2006 vintage were more than twice as likely as honest
homeowners to have had an interest-only mortgage. Interestingly, the interest-only share for the 2007
vintage of declared investors was more similar to that of the honest homeowners (Figure 2).
We also find that fraudulent investors identified from the pool of self-declared owner occupants
were more likely to take out a jumbo mortgage, that is, one with an origination amount that exceeded the
GSEs’ (e.g., Fannie Mae, Freddie Mac) conforming loan limit — the maximum value of a mortgage that
they can buy from the originator. In fact, we found that this is true for loans that originated in both the
bubble states where the housing boom and bust was accentuated and in states where the boom and bust
was not as pronounced.
Interest Rates
From Table 2, we see that interest rates on fraudulent mortgages are slightly higher than those taken out
by honest homeowners, but significantly lower than those for declared investors. This is true even when
comparing within intended investor type and fixed-rate versus adjustable-rate mortgages (Table 2b). As
11
discussed earlier, the desire for a lower interest rate than that offered to declared investors is likely one of
the motivations for borrower fraud. The fact that the rate is slightly higher than that for honest
homeowners may reflect the fact that lenders are able to identify some of these borrowers, or it may
simply reflect the fact that the fraudulent investors are also riskier along observable dimensions, as seen in
Table 2. We study this issue further in section VII below. In any case, as will become clear, the slightly
higher interest rate is not sufficient to compensate for the much higher default risk of these fraudulent
loans.
Investor Type
From Table 2a, we see that the fraud share was highest for private securitized loans, peaking at
10.5% for loans originated in the second half of 2005. This is consistent with other evidence indicating
that underwriting standards were laxer in this market during this period. However we show that it was
also high for portfolio loans. While the fraud rate for GSE loans was lower, we note that considering only
private securitized loans (as previous studies do), would have missed more than half of all fraudulent
mortgages.
Finally, both fraudulent and declared investors are much less likely to have FHA-guaranteed
loans. This is likely because of the stricter enforcement of FHA owner occupancy requirements.
Zip Codes in Credit Bureau and Mortgage Datasets
As discussed, our method for identifying fraudulent mortgages allows us to uncover occupancy fraud by
borrowers whose zip codes were the same in both the credit bureau and mortgage data, unlike previous
work. As we show in Table 2, this represents over a quarter of the incidence of fraud.
VI. Loan Performance: Summary Statistics
Cross-Sectional View of Mortgage Payment Performance
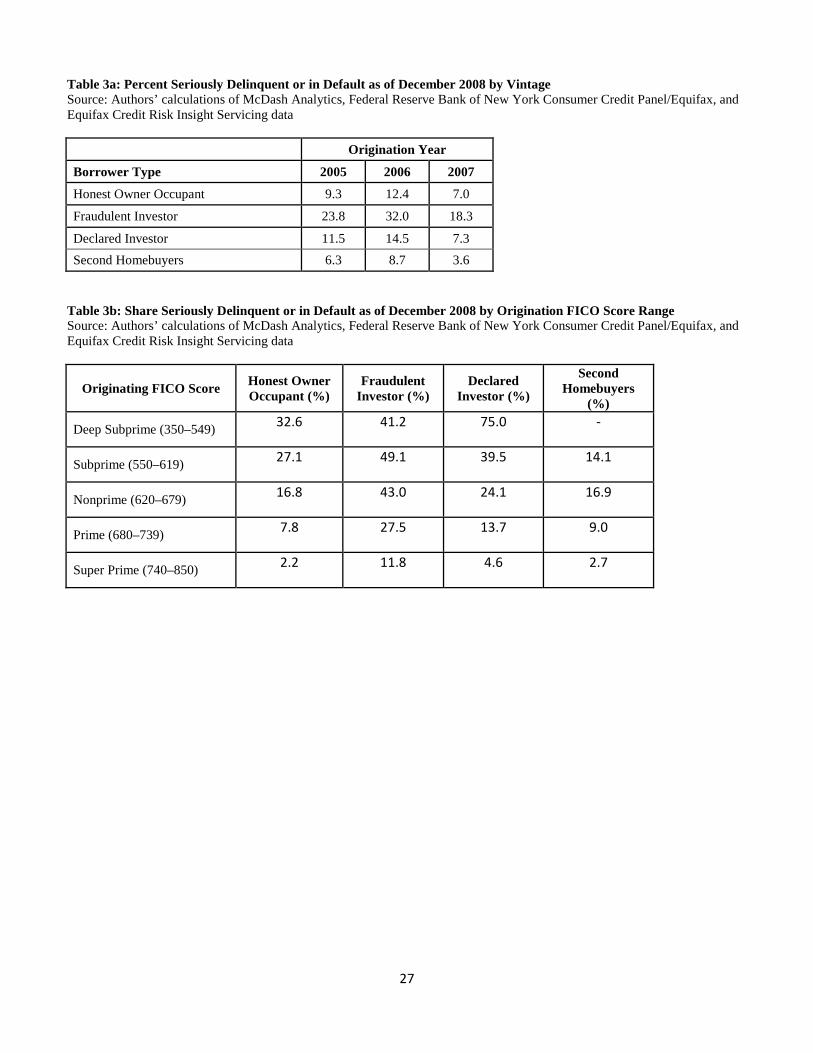
We investigate the delinquency and default behavior of these borrowers by examining the rate at
which borrowers became 60 or more days past due as of December 2008. For loans that originated

12
between June 2005 and December 2007, the fraudulent investors identified from the pool of self-reported
owner occupants became seriously delinquent or defaulted at more than twice the rate of honest
homeowners and declared investors. Table 3a summarizes the delinquency rates by year of origination
and borrower type.
The differences in loan performance between fraudulent and honest buyers are particularly striking
for borrowers in the prime (with FICO scores between 680 and 739) and super prime (with FICO scores
between 740 and 850) credit score categories. As of December 2008, fraudulent investors went into
serious delinquency at more than five times the rate of honest homeowners among the pool of super-prime
honest owner occupants (Figure 4). Among borrowers with originating FICO scores between 680 and 739
as of December 2008, 7.8% of the honest homeowners entered serious delinquency or default, while
27.5% of the fraudulent investors identified from the population of self-declared owner occupants had
gone into serious delinquency or default. The differences are also substantial among the subprime
borrowers (with FICO scores between 620 and 679) and even among the deep subprime (with FICO
scores between 550 and 619) borrowers (Table 3b).
House prices peaked in early 2007 and began to fall until early 2011. In one set of analyses, we
followed our borrowers until December 2008, the first year and a half of the collapse in house prices.
Among loans originated in our June 2005 – Dec 2005 vintage, by December 2008, 32% of honest
homeowners and 40% of fraudulent investors were underwater with their mortgages, that is, the
outstanding value of the mortgage exceeded the estimated value of the property (Figure 5). Not
surprisingly, this is associated with much higher default rates. Among fraudulent investors with updated
LTV ratios as of December 2008 between 100% and 110% (those with slightly negative equity), 26%
were seriously delinquent or in foreclosure. This compares with 11% of honest homeowners who were
seriously delinquent or in default or foreclosure falling in the same LTV range. For borrowers with deeper
negative equity (in excess of 110% updated LTV), serious delinquency or default rates were 21
percentage points higher for fraudulent investors than honest owner occupants in the same category
Strategic Default: Evidence from Other Consumer Liabilities
We now present evidence from the mortgage borrowers’ matched credit bureau data to argue that
these fraudulent owner occupants may have acted strategically in their default decisions. That is, the
borrowers may have defaulted on their mortgages, not because of an inability to pay, but rather an
13
unwillingness to pay, driven by substantial declines in home value that caused many borrowers into
negative equity on their properties. We first capture each borrower’s bank card utilization rate as of
December 2008 as a proxy for the borrowers’ liquidity (Elul et al., 2010) and calculate the utilization rate
along three different dimensions: all national borrowers, borrowers with their mortgaged properties
located in bubble states, and those with properties located in non-bubble states. We also divided those
who became seriously delinquent or defaulted and those who remained current or at most 30 days past
due within each geographic group.
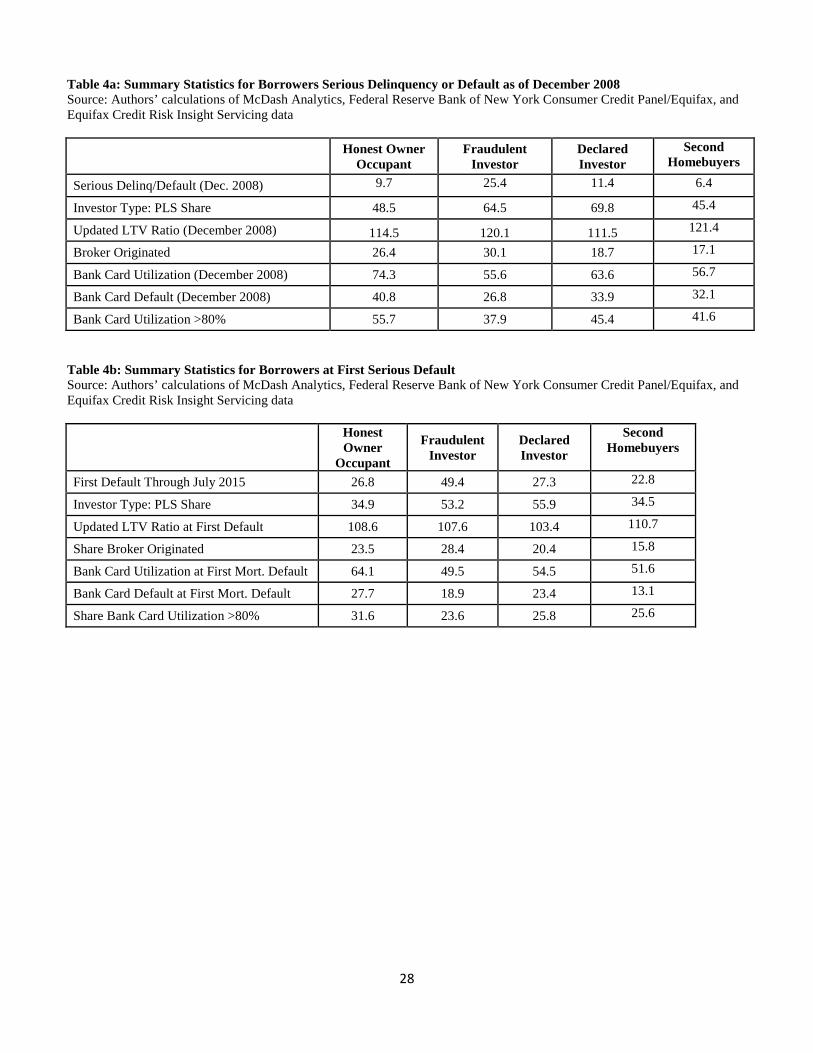
On average, there was very little difference in the bank card utilization or default rates among the
three borrower types (honest homeowners, fraudulent investors, declared investors and second home
buyers) when they remain current on their mortgage (Table 2). But there are significant differences in the
bank card utilization rate across borrower types for those who became seriously delinquent or defaulted as
of December 2008. Fraudulent investors who become seriously delinquent or in default on their
mortgages have significantly lower bankcard utilization rates, and are likelier to be current on their bank
cards (Tables 4a and 4b).
As shown in Figure 5, fraudulent investors were also more likely to have negative equity in their
homes as of December 2008. And those with negative equity were much more likely to be seriously
delinquent or in default as of December 2008. Not only were “underwater” borrowers much more likely
to be in serious delinquency or in default, but the fraudulent investors also had the highest default rates
relative to the honest homeowners and the declared investors. Figures 6a and 6b show the share of
borrowers in serious delinquency or in default stratified by updated LTV ratios exceeding 100%, that is,
borrowers who now owe more on their mortgages than the updated value of their house. . We show below
that, while this explains some of the higher default rate for fraudulent investors, they remain riskier even
after controlling for differences in equity. We also show below that fraudulent investors’ default decisions
are more sensitive to changes in house prices.
Taken together, the evidence on bank card utilization and negative equity at default point to the
possibility that fraudulent investors who we identified from the pool of declared owner occupants acted
more strategically in defaulting, that is, their default decisions are more likely to be driven by
considerations of home equity rather than liquidity.

14
VII. Estimations and Results
Probability of Default
We first estimate a probit model for the probability that a loan defaults as of December 2008. We
include a variety of mortgage origination characteristics, local house price and unemployment dynamics,
and data drawn from other parts of the borrowers’ credit histories as explanatory variables. We cannot
control for lender-specific fixed effects, but Griffin and Maturana (2015a) show that there is very little
variation in owner occupancy misreporting across lenders, suggesting that it is likely that these decisions
were made by the borrowers, perhaps in conjunction with brokers.
In the first specification in Table 5a, we estimate the probability of default by December 2008
with a variety of origination characteristics known to affect the likelihood of default. In addition, we
include fixed effects for the investor type of the loans six months after it was originated (FHA, GSE,
portfolio, or private label securitization); private label securitization is the excluded category. Changes in
zip code–level house price and unemployment dynamics are captured as well from origination to
December 2008. State and origination year fixed effects are also included (2005 is the excluded
origination year). All covariates have the expected signs and are highly statistically and economically
significant. Of particular interest is the occupancy fraud dummy variable, which we note is both highly
statistically significant and economically significant in explaining the probability of mortgage default. It
is also three times the size of the coefficient for declared investors.
In the second column, we include an additional dummy variable for whether the borrower has
multiple first-lien mortgages in his or her credit bureau file four quarters after his or her matched McDash
first-lien mortgage was originated. The coefficient is highly statistically significant in explaining
mortgage default. Recall also from Table 2 that declared investors are very likely to have multiple first
liens, and indeed, accounts for all of the additional risk associated with declared investor. Moreover, we
see that second home buyers, who are also likely to have multiple first liens, are much less risky. On the
other hand, although including this indicator reduces the explanatory power of the fraudulent investor
dummy by approximately half, significant default risk remains.
In column (3) we also add an indicator for having a second lien, obtained from the credit bureau
data; again this is associated with elevated default risk, as is known from other work (e.g., Elul et al,
2010). In column (4) we compute the marginal effects associated with specification (3). We see that,
holding all else constant, a fraudulent investor is still 3.6 percentage points more likely to default than an

15
otherwise similar borrower, relative to an average default rate of 10.6% percent. This is roughly
equivalent to an origination FICO score that is 36 points lower.
In the fifth specification, we estimate the probability of default with a probit model similar to
specification (1) but where we allow for the possibility of interaction between our two types of investors
— fraudulent and declared — and whether the loans was FHA guaranteed, GSE, private securitized, or
held in portfolio. For both declared and fraudulent investors, we find that the interaction effects are either
not statistically significant or very modest in magnitude, that is, they have higher default rates regardless
of investor type. This is not the case for FHA-guaranteed loans, however. The interaction between FHA
and fraud is negative, and the sum of this interaction and the fraud level effect is statistically insignificant:
FHA loans classified as fraudulent are no more likely to default than any other FHA loan.
In the sixth specification, we add an indicator variable for states that prohibit deficiency judgments
to the model of column (4) of Table 4a. Ghent and Kudlyak (2011) have shown that state laws that limit
lenders’ ability to pursue deficiency judgments are associated with higher default rates. We confirm this
for honest homeowners and fraudulent investors; interestingly, we also see that fraudulent investors are no
more likely to be affected by these laws than honest homeowners. By contrast, however, we find negative
interactions for that declared investors and second mortgages, which may reflect the fact that many states
restrict the prohibition against pursuing deficiency coefficients on the judgments to owner-occupied
properties.
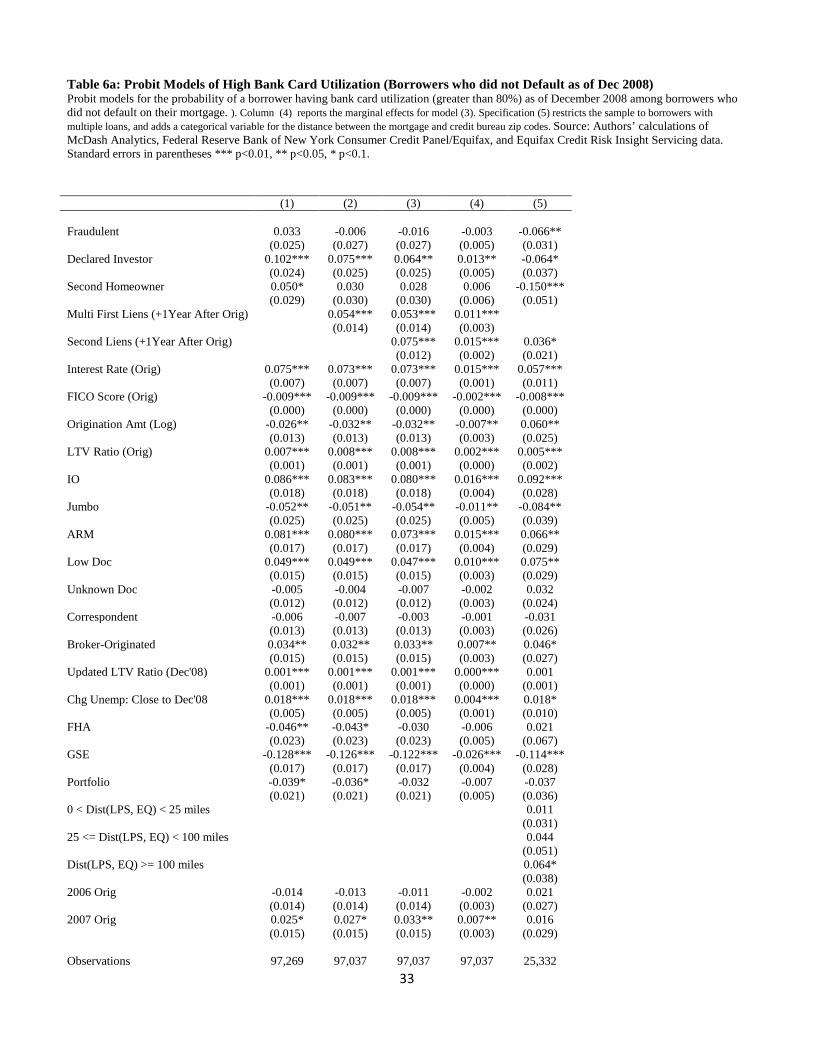
Strategic Default and the Probability of High Bank Card Utilization
In Table 6a, we estimate probit models for the probability — among borrowers with active mortgages
who are not seriously delinquent or default on their first-lien mortgage as of December 2008 — that their
total bank card utilization rate as of December 2008 (reported in their credit bureau files) exceeds 80%. In
column (2) we add an indicator for whether the borrower has multiple first liens, which could represent an
additional source of liquidity shocks (as indeed shown by the positive coefficient), and in column (3) we
account for second liens, which might also be associated with a need for liquidity (again the coefficient is
positive). Column (4) gives the marginal effects associated with model (3). In all of these specifications,
we find that after controlling for other characteristics (e.g., origination FICO score), occupancy fraud is
not statistically significant; that is, for mortgages that are current as of December 2008, there is no
significant difference in bank card utilization rate between honest homeowners and fraudulent investors.
Declared investors and second home buyers are modestly more likely to have higher utilization.
16
As far as the other covariates, higher origination FICO scores are associated with lower utilization,
and higher origination LTV ratios are associated with higher utilization, as expected. Higher
unemployment rates and higher current LTV ratios are associated with higher utilization, likely reflecting
local economic stresses. ARM borrowers have higher utilization; this is consistent with earlier work
showing that those taking out ARMs are likelier to be borrowing-constrained (Johnson and Li, 2014).
In Table 6b, we estimate the same models for the probability of high credit utilization, but we
focus on the group of borrowers who had a seriously delinquency or default as measured by becoming 60
days or more past due on their first-lien mortgages as of December 2008Utilization is measured here as
of December 2008. In comparing the results to those of Table 6a, we notice several striking differences.
First, fraudulent investors are significantly less likely to have high utilization rates at the time of default,
reflecting, as suggested earlier, a more strategic approach to default. In particular, they are 10.1
percentage points less likely to have had high bank card utilization rates, relative to an average for
defaulted borrowers of 52.6 percentage points for the entire sample (column 4). In addition, high current
LTV is associated with lower incidence of high utilization, in contrast to the results for non-defaulters.
This is consistent with the “double-trigger” theory of mortgage default (see, for example, Elul et al.,
2010).
Finally, to further support our argument that the fraudulent investors behave more strategically, we
also rerun the baseline mortgage default model, but add interactions between the borrower type and
changes in house prices and unemployment rates. The results, reported in column (7) of Table 5a, confirm
this: fraudulent investors’ default decisions are significantly more sensitive to declines in house prices
than other borrowers (the converse is true for declared investors), and insensitive to unemployment rates.
Determinants of Fraudulent Investors
In Table 7, we estimate models for the probability of a self-declared owner occupant being a
fraudulent investor. Recall our definition of a fraudulent investor: These are self-reported owner
occupants who did not change their Equifax scrambled addresses within the one quarter before and four
quarters after window around the time their matched McDash mortgages originated and have more than
one first-lien mortgage on their credit files four quarters after origination.

17
These multivariate estimation results generally confirm the summary statistics, reported earlier.
We find that FHA loans are 4.9 percentage points less likely to be fraudulent, relative to an overall rate of
5.95 percent. GSE-guaranteed loans are also modestly less likely to be fraudulent.
Fraudulent investors are also associated with various indicators of housing bubbles such as higher
lagged house price appreciation. Similarly, in the final specification we replace the state fixed effects with
a bubble state dummy and find a significant positive coefficient on the bubble state dummy.
Fraudulent investors are also associated with higher origination amounts, interest-only loans,
ARMs, low or unknown documentation loans, and broker-originated loans (as in the previous literature).
They are also significantly more common in 2007, consistent with Haughwout et al. (2011).
Interest Rates
In Table 8, we present regression models for the interest rate at origination (or when first available). In
order to create more uniform samples, we restrict attention to mortgages with 30-year terms, and, for
ARMs, we further to those with the most common initial fixed-rate periods: 1, 12, 24, 36, 60, 84, and 120
months. Taken together, these account for 70% of all mortgages in our sample. The fact that we do not
have information on fees and points should generally be expected to attenuate our results.
The control variables have the expected signs: higher origination FICO scores are associated with
lower rates, with a discrete jump at 660. Higher LTV ratios are also associated with higher rates. Low-doc
loans, IO’s, and broker-originated mortgages also have higher rates. FHA, GSE and mortgages held on
bank portfolios all have lower rates, relative to the omitted category, private securitized loans. Having
multiple first liens is associated with higher rates.6
Turning now to the primary coefficients of interest, we see that fraudulent pay slightly higher rates
on average, 14bp for FRM (column 1) and 18bp for ARMs (column 3), confirming the results reported in
Table 2b. For declared investors, the effect is much larger: 49bp for FRM and 59bp for ARMs.
When we consider the interactions in columns (2) and (4), we see some striking differences. We
find rates for fraudulent investors that are not significantly higher than those for honest homeowners for
FHA and GSE-guaranteed loans (columns 2 and 4), suggesting that the ultimate investors may not have 6 In these models we measure the number of liens one quarter following origination, in contrast to previous tables.

18
been able to identify the fraudulent loans. By contrast, for private securitized loans (the omitted
category), we find a modest effect, and for loans held on bank portfolios, the rate is over 50 basis points
higher. These results suggest that, particularly for loans that were held by banks, there was some
understanding of the additional risk of these loans (although the higher rate was not sufficient to offset the
elevated default risk, in retrospect). Finally, for declared investors interest rates are higher than for honest
homeowners across all investor types.
Distance and Default (in progress)
Chinco and Mayer (2016) study out-of-town “second home buyers.” They define these as borrowers
whose tax bills were sent to different MSAs than the property address. They show that their purchases
drove price appreciation. They also show that they acted like “uninformed speculators” - their realized
returns (driven by change in HPI) were lower than those of within-MSA second home buyers.
To extend their analysis, we begin with the subsample of borrowers with multiple first mortgages.
We first show (column 9 of Table 5b) that those whose Equifax zip code (4 quarters after origination) is
the same as that of the matched purchase mortgage, are much less likely to default than those whose
property is located in a different zip code. Furthermore, declared investors and second homebuyers are
also less likely to default than other multiple mortgagees.
The increased default risk may be driven by a lower attachment to these distant houses, as column
(5) of Table 6b shows that, conditional on default, those with different zip codes have lower bankcard
utilization rates. By contrast, outside of default we find insignificant effects in column (5) of Table 6a (or
at most very modest, for the most distant group).
We then further restrict attention to those whose credit bureau zip code is not the same as that of
the matched purchase mortgage. By comparing zip codes we can identify those out-of-own buyers, who
have zip codes associated with different MSAs. In Figures 9a and 9b we see that in-town investors are
roughly evenly split between honest homeowners, fraudulent investors and declared investors, whereas
second home buyers are overwhelmingly found in the out-own-town investor category.
In model (10) of Table 5b we verify that the lower returns for out-of-town investors observed by
Chinco and Mayer (2016) are associated, as expected, with elevated default rates. We also see that the
indicator variable for mortgage fraud becomes insignificant. We interpret this as suggesting that we have

19
an additional category of fraudulent investors: those with multiple mortgages and with a different zi code
in their credit bureau data.
Interacting the out-out-town indicator with the borrower type in model (11), we learn that this
additional risk for out-of-town buyers is not found amongst the declared second home buyers, nor
amongst the fraudulent investors, but, as can be confirmed by test statistics, declared investors. In other
words, a share of fraudulent investors are out-of-town, this is not associated with any additional risk for
this group; we interpret this as suggesting that fraudulent investors were more likely to be informal
investors.
Finally, in columns (12) and (13) of Table 5b we further demonstrate that most of this additional
risk remains even after controlling for changes in house prices following origination, which suggests that
differences in information across classes of speculators explains only part of the variation in default rates.
VIII. Conclusion
Using a matched credit bureau and mortgage data set to identify occupancy fraud in residential mortgages
originated between June 2005 and December 2007, we find that such fraud was widespread. In contrast to
previous studies, our data set allows us to show that occupancy fraud was common in the GSE market and
in loans held in portfolio in addition to the private label market. We found that mortgage borrowers who
misrepresented their occupancy status performed worse than otherwise similar owner occupancy
occupants and declared investors, with an incidence of default at nearly twice that of honest owner
occupants or declared investors. Fraudulent investors’ bank card utilization rates and default rates relative
to those of honest owner occupants and declared investors imply that the fraudulent investors’ mortgage
defaults may have been strategic. Our results and estimates are large and economically significant and
demonstrate one important role that occupancy fraud played during U.S. housing boom and bust.
20
References
Adelino, Manual, Antoinette Schoar, and Felipe Severino. “Loan Originations and Defaults in the Mortgage Crisis: The Role of the Middle Class.” Review of Financial Studies, Volume 29, Issue 7, pages 1635-1670, July 2016.
Ben-David, Itzhak. “Financial Constraints and Inflated Home Prices during the Real Estate Boom.” American Economic Journal: Applied Economics, 3(3): 55–87, 2011.
Beraja, Martin, Andreas Fuster, Erik Hurst, and Joseph Vavra. “Regional Heterogeneity and Monetary Policy.” Federal Reserve Bank of New York Staff Report No. 731, June 2015
Chinco, Alex, and Chris Mayer. “Misinformed Speculators and Mispricing in the Housing Market.” Forthcoming. 2015.
Elul, Ronel, Nicholas S. Souleles, Souphala Chomsisengphet, Dennis Glennon, and Robert Hunt. “What ‘Triggers’ Mortgage Default?” American Economic Review, 100(2): 490–494, 2010.
Foote, Christopher, Lara Loewenstein, and Paul Willen, “Cross-Sectional Patterns of Mortgage Debt During the Housing Boom: Stocks and Flows.” Mimeo, March 11, 2016
Gao, Zhenyu, and Wenli Li. “Real Estate Investors and the Boom and the Bust of the U.S. Housing Market.” Working Paper, September 2012.
Garmaise, Mark J. “Borrower Misreporting and Loan Performance.” The Journal of Finance, 70 (1): 449–484, 2015.Ghent, Andra and Marianna Kudlyak, 2011, Recourse and Residential Mortgage Default:Evidence from US States, Review of Financial Studies 24(9), 3139-3186.
Griffin, John M., and Gonzalo Maturana. “Who Facilitated Misreporting in Securitized Loans?” The Journal of Finance, 2015a.
Griffin, John M., and Gonzalo, Maturana. “Did Dubious Mortgage Origination Practices Distort House Prices?” Working Paper, May 2015b.
Haughwout, Andrew, Donghoon Lee, Joseph Tracy, and Wilbert van der Klaauw. “Real Estate Investors, the Leverage Cycle, and the Housing Market Crisis.” Federal Reserve Bank of New York Staff, Report 514, September 2011.
Johnson, Kathleeen W., and Geng Li. “Are Adjustable-Rate Mortgage Borrowers Borrowing Constrained?” Real Estate Economics, 42 (2): 457–471, 2014.
Li, Wenli. “Smart Money or Dumb Money: Investors’ Role in the Housing Bubble.” Federal Reserve Bank of Philadelphia Business Review, 2015Q3.
Mian, Atif, and Amir Sufi. “Fraudulent Income Overstatement on Mortgage Applications During the Credit Expansion of 2002 to 2005.” NBER Working Paper 20947, 2015.

21
Pence, Karen M., 2006, Foreclosing on Opportunity: State Laws and Mortgage Credit, Review of Economics and Statistics 88(1), 177-182.
Piskorski, Tomasz, Amit Seru, and James Witkin. “Asset Quality Misrepresentation by Financial Intermediaries: Evidence from the RBMS Market.” The Journal of Finance, 70 (6): 2635–2678, 2015.
22
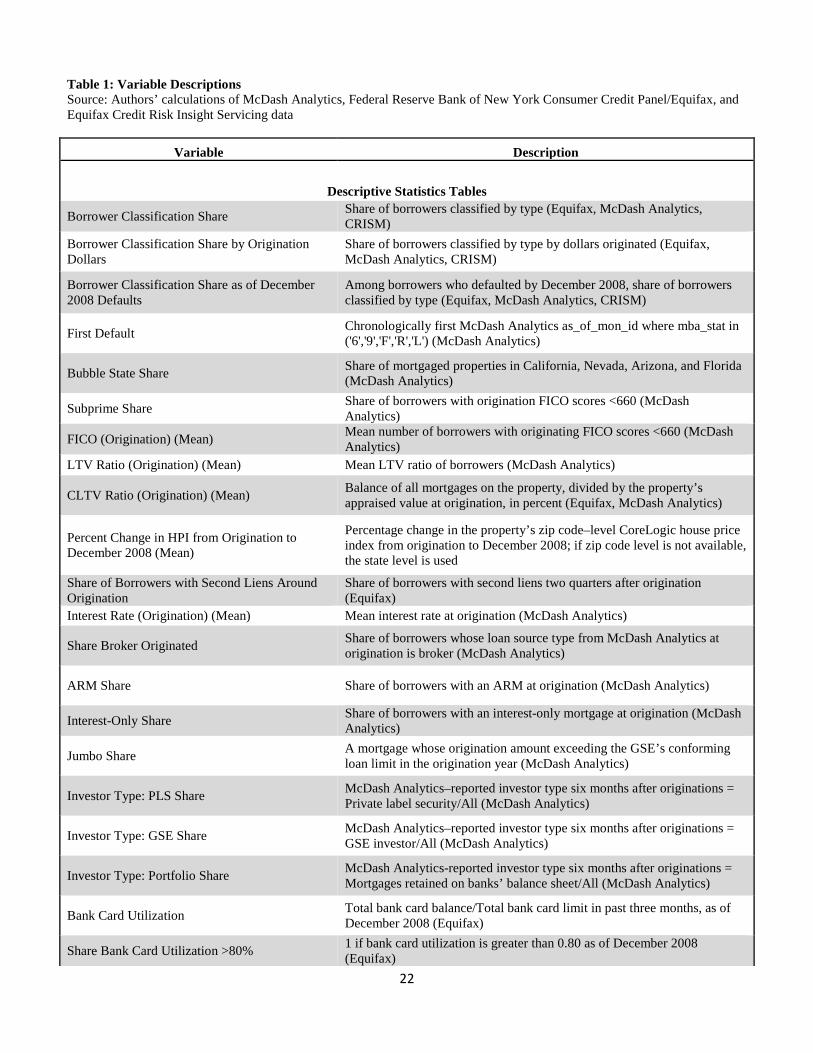
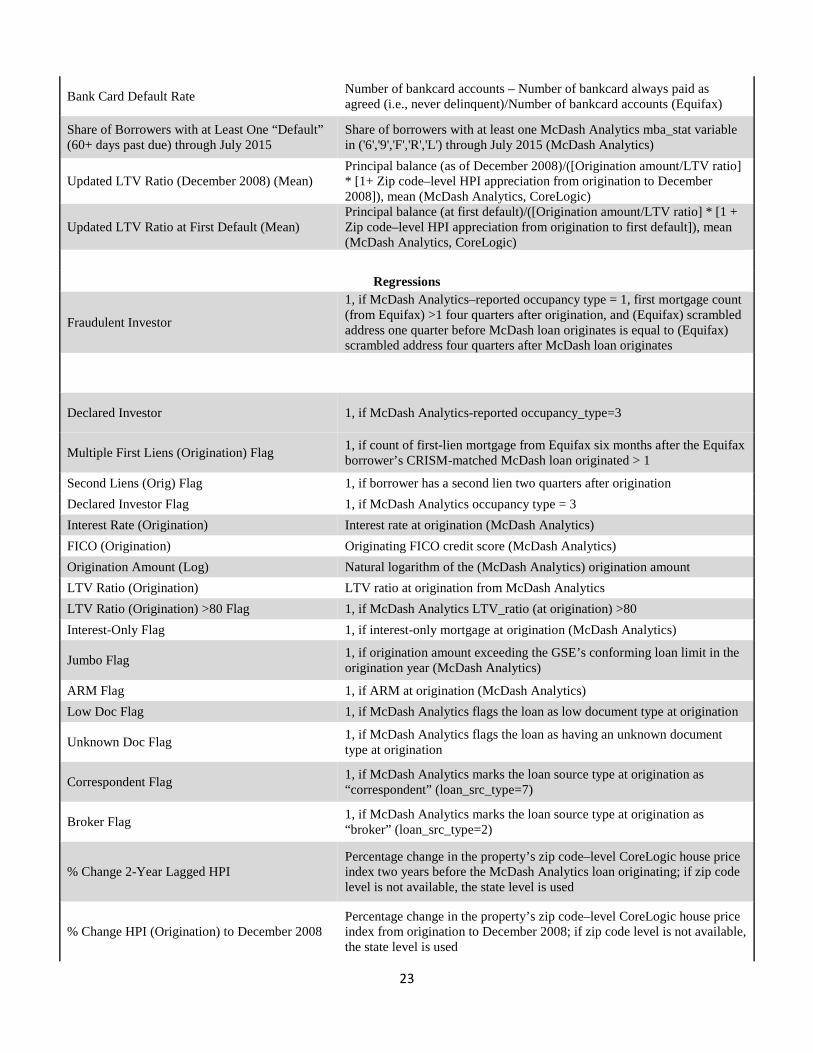
Table 1: Variable Descriptions Source: Authors’ calculations of McDash Analytics, Federal Reserve Bank of New York Consumer Credit Panel/Equifax, and Equifax Credit Risk Insight Servicing data
Variable Description
Descriptive Statistics Tables
Borrower Classification Share Share of borrowers classified by type (Equifax, McDash Analytics, CRISM)
Borrower Classification Share by Origination Dollars
Share of borrowers classified by type by dollars originated (Equifax, McDash Analytics, CRISM)
Borrower Classification Share as of December 2008 Defaults
Among borrowers who defaulted by December 2008, share of borrowers classified by type (Equifax, McDash Analytics, CRISM)
First Default Chronologically first McDash Analytics as_of_mon_id where mba_stat in ('6','9','F','R','L') (McDash Analytics)
Bubble State Share Share of mortgaged properties in California, Nevada, Arizona, and Florida (McDash Analytics)
Subprime Share Share of borrowers with origination FICO scores <660 (McDash Analytics)
FICO (Origination) (Mean) Mean number of borrowers with originating FICO scores <660 (McDash Analytics)
LTV Ratio (Origination) (Mean) Mean LTV ratio of borrowers (McDash Analytics)
CLTV Ratio (Origination) (Mean) Balance of all mortgages on the property, divided by the property’s appraised value at origination, in percent (Equifax, McDash Analytics)
Percent Change in HPI from Origination to December 2008 (Mean)
Percentage change in the property’s zip code–level CoreLogic house price index from origination to December 2008; if zip code level is not available, the state level is used
Share of Borrowers with Second Liens Around Origination
Share of borrowers with second liens two quarters after origination (Equifax)
Interest Rate (Origination) (Mean) Mean interest rate at origination (McDash Analytics)
Share Broker Originated Share of borrowers whose loan source type from McDash Analytics at origination is broker (McDash Analytics)
ARM Share Share of borrowers with an ARM at origination (McDash Analytics)
Interest-Only Share Share of borrowers with an interest-only mortgage at origination (McDash Analytics)
Jumbo Share A mortgage whose origination amount exceeding the GSE’s conforming loan limit in the origination year (McDash Analytics)
Investor Type: PLS Share McDash Analytics–reported investor type six months after originations = Private label security/All (McDash Analytics)
Investor Type: GSE Share McDash Analytics–reported investor type six months after originations = GSE investor/All (McDash Analytics)
Investor Type: Portfolio Share McDash Analytics-reported investor type six months after originations = Mortgages retained on banks’ balance sheet/All (McDash Analytics)
Bank Card Utilization Total bank card balance/Total bank card limit in past three months, as of December 2008 (Equifax)
Share Bank Card Utilization >80% 1 if bank card utilization is greater than 0.80 as of December 2008 (Equifax)
23
Bank Card Default Rate Number of bankcard accounts – Number of bankcard always paid as agreed (i.e., never delinquent)/Number of bankcard accounts (Equifax)
Share of Borrowers with at Least One “Default” (60+ days past due) through July 2015
Share of borrowers with at least one McDash Analytics mba_stat variable in ('6','9','F','R','L') through July 2015 (McDash Analytics)
Updated LTV Ratio (December 2008) (Mean) Principal balance (as of December 2008)/([Origination amount/LTV ratio] * [1+ Zip code–level HPI appreciation from origination to December 2008]), mean (McDash Analytics, CoreLogic)
Updated LTV Ratio at First Default (Mean) Principal balance (at first default)/([Origination amount/LTV ratio] * [1 + Zip code–level HPI appreciation from origination to first default]), mean (McDash Analytics, CoreLogic)
Regressions
Fraudulent Investor
1, if McDash Analytics–reported occupancy type = 1, first mortgage count (from Equifax) >1 four quarters after origination, and (Equifax) scrambled address one quarter before McDash loan originates is equal to (Equifax) scrambled address four quarters after McDash loan originates
Declared Investor 1, if McDash Analytics-reported occupancy_type=3
Multiple First Liens (Origination) Flag 1, if count of first-lien mortgage from Equifax six months after the Equifax borrower’s CRISM-matched McDash loan originated > 1
Second Liens (Orig) Flag 1, if borrower has a second lien two quarters after origination Declared Investor Flag 1, if McDash Analytics occupancy type = 3 Interest Rate (Origination) Interest rate at origination (McDash Analytics) FICO (Origination) Originating FICO credit score (McDash Analytics) Origination Amount (Log) Natural logarithm of the (McDash Analytics) origination amount LTV Ratio (Origination) LTV ratio at origination from McDash Analytics LTV Ratio (Origination) >80 Flag 1, if McDash Analytics LTV_ratio (at origination) >80 Interest-Only Flag 1, if interest-only mortgage at origination (McDash Analytics)
Jumbo Flag 1, if origination amount exceeding the GSE’s conforming loan limit in the origination year (McDash Analytics)
ARM Flag 1, if ARM at origination (McDash Analytics) Low Doc Flag 1, if McDash Analytics flags the loan as low document type at origination
Unknown Doc Flag 1, if McDash Analytics flags the loan as having an unknown document type at origination
Correspondent Flag 1, if McDash Analytics marks the loan source type at origination as “correspondent” (loan_src_type=7)
Broker Flag 1, if McDash Analytics marks the loan source type at origination as “broker” (loan_src_type=2)
% Change 2-Year Lagged HPI Percentage change in the property’s zip code–level CoreLogic house price index two years before the McDash Analytics loan originating; if zip code level is not available, the state level is used
% Change HPI (Origination) to December 2008 Percentage change in the property’s zip code–level CoreLogic house price index from origination to December 2008; if zip code level is not available, the state level is used

24
Unemployment Rate at Close Date Property’s zip code–level unemployment rate in the month it closed (BLS)
% Change Unemployment (Origination) to December 2008
Percentage change in the property’s zip code-level unemployment rate from origination to December 2008 (BLS)
FHA Flag 1, if investor type (six months after origination) is FHA (McDash Analytics)
GSE Flag 1, if investor type (six months after origination) is GSE (McDash Analytics)
Portfolio Flag 1, if investor type (six months after origination) is portfolio (McDash Analytics)
Bubble State Flag 1, if prop_state is California, Nevada, Arizona, and Florida (McDash Analytics)
Updated LTV Ratio (December 2008) Principal balance (as of December 2008)/((Origination amount/LTV ratio) * [1 + Zip code–level HPI appreciation from origination to December 2008]) (McDash Analytics, CoreLogic)
Updated LTV at Default Principal balance (at First Default)/((Origination amount /LTV ratio) * (1 + Zip code–level HPI appreciation from origination to first default) (McDash Analytics, CoreLogic)
% Change Unemployment Until Default Percentage change in the property’s zip code–level unemployment rate from origination to its first default (McDash Analytics, BLS)
Def Prohibited 1, if the state prohibits deficiency judgments against borrower in the event of mortgage default
25
Table 2: Summary Statistics by Borrower Type Source: Authors’ calculations of McDash Analytics, Federal Reserve Bank of New York Consumer Credit Panel/Equifax, and Equifax Credit Risk Insight Servicing data
Characteristic Honest Owner Occupant
Fraudulent Investor
Declared Investor
Second Homeowner
Number Loans 128,494 8,717 9,255 5,988 Share 84.3% 5.7% 6.1% 3.9% Share by Origination Dollars 84.1% 7.4% 4.5% 4.0% Share of Defaults – Count (through Dec. ‘08) 79.6% 13.9% 6.5% -% Share of Defaults - $ (through Dec’ 08) 75% 18% 5% 3%
Serious Delinq/Default (60+ DPD) Through Dec ‘08 9.7% 25.4% 11.4% 6.4%
Serious Delinq/Default (60+ DPD) Through July 2015 26.8% 49.4% 27.3% 22.8% Equifax Zip (+4Q) = McDash Zip Code 89.8% 28.0% 26.5% 18.8% Equifax MSA (+4Q) = McDash MSA 96.0% 69.4% 59.8% 28.4% Multiple First Liens 20.4% 100.0% 70.0% 52.9% Bubble State 18.3% 42.0% 27.5% 30.0% Subprime 26.0% 18.9% 10.3% 7.5% FICO Score (Origination) 705.8 711.0 728.4 739.6 LTV Ratio (Origination) 81.8% 78.7% 75.7% 75.8% CLTV Ratio (Origination) 86.3% 92.2% 104.2% 88.9% LTV > 80% or LTV = 80 + 2nd lien near origination 44.4% 34.2% 29.3% 29.5%
Δ HPI: Origination to December 2008 -13.0% -21.1% -15.8% -16.0% Δ HPI: 1 Year before Origination 6.5% 8.2% 9.5% 10.2% Second Liens around Origination 28.6% 50.3% 53.2% 41.8% Interest Rate (Origination) 6.45% 6.65% 7.00% 6.43% Brokered 19.9% 25.6% 20.2% 14.3% ARM 22.7% 46.5% 34.1% 30.9% Interest Only 15.2% 31.8% 19.8% 23.0% Jumbo 10.2% 19.9% 5.6% 10.5% Investor Type: PLS 22.75% 42.3% 39.7% 22.4% Investor Type: GSE 55.50% 43.7% 52.7% 66.9% Investor Type: Portfolio 9.15% 12.0% 7.5% 10.7% Bank Card Utilization (December 2008) 37.1% 37.9% 34.1% 29.0% Bank Card Utilization >80% 19.3% 20.2% 17.3% 13.0% Bank Card Default (December 2008) 13.5% 13.6% 11.5% 5.9%
26
Table 2a: Fraud Share (%) of Borrowers by Vintage Half Year and Intended Investor Type Source: Authors’ calculations of McDash Analytics, Federal Reserve Bank of New York Consumer Credit Panel/Equifax, and Equifax Credit Risk Insight Servicing data
Fraud Share of Borrowers by Vintage and Investor Type
All FHA GSE Private Securitized Portfolio
2005 Second Half 5.5 0.9 4.2 10.5 7.8 2006 First Half 6.4 0.9 4.3 9.7 8.1 2006 Second Half 6.0 0.9 4.3 9.4 6.9 2007 First Half 5.6 1.2 4.8 8.9 6.5 2007 Second Half 5.0 1.4 5.1 6.2 7.7
Table 2b: Interest Rate (%) by Borrower and Intended Investor Type, for FRM and ARMs. Source: Authors’ calculations of McDash Analytics, Federal Reserve Bank of New York Consumer Credit Panel/Equifax, and Equifax Credit Risk Insight Servicing data GSE FHA Private Portfolio Borrower Type FRM ARM FRM ARM FRM ARM FRM ARM Honest Owner Occupant 6.36 6.15 6.34 5.45 6.73 6.97 6.31 6.11 Fraudulent Investor 6.45 6.34 6.37 4.96 6.96 6.95 6.73 6.27 Declared Investor 6.77 6.82 6.34 - 7.30 7.35 7.10 6.49 Second Homebuyers 6.30 6.22 5.25 - 6.70 6.82 6.71 6.50
27
Table 3a: Percent Seriously Delinquent or in Default as of December 2008 by Vintage Source: Authors’ calculations of McDash Analytics, Federal Reserve Bank of New York Consumer Credit Panel/Equifax, and Equifax Credit Risk Insight Servicing data Origination Year
Borrower Type 2005 2006 2007
Honest Owner Occupant 9.3 12.4 7.0
Fraudulent Investor 23.8 32.0 18.3
Declared Investor 11.5 14.5 7.3 Second Homebuyers 6.3 8.7 3.6
Table 3b: Share Seriously Delinquent or in Default as of December 2008 by Origination FICO Score Range Source: Authors’ calculations of McDash Analytics, Federal Reserve Bank of New York Consumer Credit Panel/Equifax, and Equifax Credit Risk Insight Servicing data
Originating FICO Score Honest Owner Occupant (%)
Fraudulent Investor (%)
Declared Investor (%)
Second Homebuyers
(%)
Deep Subprime (350–549) 32.6 41.2 75.0 -
Subprime (550–619) 27.1 49.1 39.5 14.1
Nonprime (620–679) 16.8 43.0 24.1 16.9
Prime (680–739) 7.8 27.5 13.7 9.0
Super Prime (740–850) 2.2 11.8 4.6 2.7
28
Table 4a: Summary Statistics for Borrowers Serious Delinquency or Default as of December 2008 Source: Authors’ calculations of McDash Analytics, Federal Reserve Bank of New York Consumer Credit Panel/Equifax, and Equifax Credit Risk Insight Servicing data
Honest Owner Occupant
Fraudulent Investor
Declared Investor
Second Homebuyers
Serious Delinq/Default (Dec. 2008) 9.7 25.4 11.4 6.4
Investor Type: PLS Share 48.5 64.5 69.8 45.4
Updated LTV Ratio (December 2008) 114.5 120.1 111.5 121.4
Broker Originated 26.4 30.1 18.7 17.1
Bank Card Utilization (December 2008) 74.3 55.6 63.6 56.7
Bank Card Default (December 2008) 40.8 26.8 33.9 32.1
Bank Card Utilization >80% 55.7 37.9 45.4 41.6
Table 4b: Summary Statistics for Borrowers at First Serious Default Source: Authors’ calculations of McDash Analytics, Federal Reserve Bank of New York Consumer Credit Panel/Equifax, and Equifax Credit Risk Insight Servicing data
Honest Owner
Occupant
Fraudulent Investor
Declared Investor
Second Homebuyers
First Default Through July 2015 26.8 49.4 27.3 22.8
Investor Type: PLS Share 34.9 53.2 55.9 34.5
Updated LTV Ratio at First Default 108.6 107.6 103.4 110.7
Share Broker Originated 23.5 28.4 20.4 15.8
Bank Card Utilization at First Mort. Default 64.1 49.5 54.5 51.6
Bank Card Default at First Mort. Default 27.7 18.9 23.4 13.1
Share Bank Card Utilization >80% 31.6 23.6 25.8 25.6

29
Table 5a: Mortgage Default as of December 2008 Probit models of mortgage default on or before December 2008. Specification (4) reports marginal effects for model (3). All models include state fixed effects. Source: Authors’ calculations of McDash Analytics, Federal Reserve Bank of New York Consumer Credit Panel/Equifax, and Equifax Credit Risk Insight Servicing data. Standard errors in parentheses *** p<0.01, ** p<0.05, * p<0.1.
(1) (2) (3) (4) (5) (6) (7) (8) Fraudulent 0.478*** 0.266*** 0.242*** 0.036*** 0.275*** 0.274*** 0.233*** 0.243*** (0.020) (0.022) (0.022) (0.004) (0.029) (0.028) (0.047) (0.022) Declared Investor 0.131*** -0.017 -0.046* -0.006* -0.041 0.083*** 0.129** -0.040 (0.024) (0.026) (0.026) (0.003) (0.033) (0.030) (0.051) (0.026) Second Homeowner -0.051 -0.135*** -0.151*** -0.019*** -0.250*** -0.052 -0.111 -0.153*** (0.034) (0.035) (0.035) (0.004) (0.055) (0.041) (0.081) (0.035) Interest Rate (Orig) 0.150*** 0.148*** 0.151*** 0.021*** 0.151*** 0.150*** 0.151*** 0.151*** (0.006) (0.006) (0.006) (0.001) (0.006) (0.006) (0.006) (0.006) FICO Score (Orig) -0.007*** -0.007*** -0.007*** -0.001*** -0.007*** -0.007*** -0.007*** -0.007*** (0.000) (0.000) (0.000) (0.000) (0.000) (0.000) (0.000) (0.000) Origination Amt (Log) 0.031** -0.012 -0.007 -0.001 -0.008 0.038*** -0.002 -0.002 (0.014) (0.015) (0.015) (0.002) (0.015) (0.013) (0.015) (0.015) LTV Ratio (Orig) 0.018*** 0.020*** 0.022*** 0.003*** 0.022*** 0.021*** 0.022*** 0.003*** (0.001) (0.001) (0.001) (0.000) (0.001) (0.001) (0.001) (0.001) IO 0.173*** 0.151*** 0.150*** 0.020*** 0.151*** 0.144*** 0.149*** 0.154*** (0.016) (0.016) (0.016) (0.002) (0.016) (0.016) (0.016) (0.016) Jumbo -0.117*** -0.102*** -0.112*** -0.015*** -0.113*** -0.115*** -0.116*** -0.090*** (0.023) (0.023) (0.023) (0.003) (0.023) (0.022) (0.023) (0.023) ARM 0.218*** 0.213*** 0.190*** 0.026*** 0.188*** 0.191*** 0.191*** 0.188*** (0.016) (0.016) (0.016) (0.002) (0.016) (0.016) (0.016) (0.016) Low Doc 0.188*** 0.180*** 0.177*** 0.024*** 0.177*** 0.179*** 0.177*** 0.178*** (0.015) (0.016) (0.016) (0.002) (0.016) (0.015) (0.016) (0.016) Unknown Doc 0.078*** 0.075*** 0.067*** 0.009*** 0.067*** 0.070*** 0.067*** 0.068*** (0.014) (0.014) (0.014) (0.002) (0.014) (0.014) (0.014) (0.014) Correspondent 0.008 0.009 0.016 0.002 0.016 0.012 0.017 0.017 (0.015) (0.015) (0.015) (0.002) (0.015) (0.015) (0.015) (0.015) Broker-Originated 0.147*** 0.143*** 0.139*** 0.019*** 0.139*** 0.146*** 0.139*** 0.141*** (0.015) (0.015) (0.015) (0.002) (0.015) (0.015) (0.015) (0.015) Chg HPI: Close- Dec'08 -2.259*** -2.193*** -2.200*** -0.299*** -2.200*** -2.254*** -2.172*** (0.072) (0.072) (0.072) (0.010) (0.072) (0.052) (0.076) ΔUnemp: Close- Dec'08 0.024*** 0.024*** 0.024*** 0.003*** 0.024*** 0.037*** 0.030*** 0.022*** (0.006) (0.006) (0.006) (0.001) (0.006) (0.004) (0.006) (0.006) FHA -0.425*** -0.389*** -0.365*** -0.052*** -0.356*** -0.353*** -0.362*** -0.355*** (0.024) (0.024) (0.025) (0.003) (0.025) (0.024) (0.025) (0.025) GSE -0.367*** -0.346*** -0.336*** -0.049*** -0.333*** -0.341*** -0.336*** -0.333*** (0.017) (0.017) (0.017) (0.003) (0.018) (0.017) (0.017) (0.017) Portfolio -0.208*** -0.188*** -0.179*** -0.028*** -0.187*** -0.179*** -0.179*** -0.178*** (0.020) (0.020) (0.020) (0.003) (0.023) (0.020) (0.020) (0.020) 2006 Orig 0.038*** 0.026* 0.031** 0.004** 0.030** 0.023 0.030** 0.047*** (0.015) (0.015) (0.015) (0.002) (0.015) (0.015) (0.015) (0.015) 2007 Orig -0.113*** -0.124*** -0.111*** -0.015*** -0.111*** -0.117*** -0.112*** -0.081*** (0.017) (0.017) (0.017) (0.002) (0.017) (0.017) (0.017) (0.017) Multiple First Liens 0.336*** 0.341*** 0.046*** 0.343*** 0.336*** 0.339*** 0.337*** (0.014) (0.014) (0.002) (0.014) (0.014) (0.014) (0.014) Have Second Lien 0.203*** 0.028*** 0.204*** 0.197*** 0.202*** 0.201*** (0.013) (0.002) (0.013) (0.013) (0.013) (0.013) Fraudulent × FHA -0.544*** (0.150) Fraudulent × GSE -0.081* (0.044) Fraudulent × Portfolio 0.019 (0.060) Declared Investor × GSE -0.023 (0.052) Decl. Inv. × Portfolio 0.037 (0.083) 2nd Home × GSE 0.172** (0.073) 2nd Home × Portfolio 0.137 (0.115) Def. Prohibited 0.055*** (0.015) Fraudulent # Def. Prohibited -0.046

30
(0.039) Declared Inv. × Def. Prohib. -0.365*** (0.052) 2nd Home × Def. Prohibited -0.267*** (0.074) Fraud.×ΔUnemp: Close-Dec'08 -0.046*** (0.017) Decl. Invstr×ΔUnemp: Close-Dec'08 -0.022 (0.018) 2nd Home # Unemp: Close -Dec'08 -0.020 (0.024) Fraud.×Chg HPI: Close-Dec'08 -0.624*** (0.175) Decl. Invst×Chg HPI: Close-Dec'08 0.501*** (0.193) 2nd Home×Chg HPI: Close-Dec'08 -0.123 (0.271) Updated LTV Ratio (Dec'08) 0.014*** (0.000) Neg. Equity (Dec. 2008) 0.068*** (0.018) Observations 125201 124874 124874 124874 124864 124874 124874 124874

31
Table 5b: Mortgage Default as of December 2008 – Effect of Distance Probit models of mortgage default on or before December 2008. Specifications are restricted to borrowers with multiple first liens. Specifications (10) thru (13) are further restricted to borrowers whose Equifax-reported zip code (1 year after origination) and LPS-reported zip code are not equal. All models include state fixed effects. Source: Authors’ calculations of McDash Analytics, Federal Reserve Bank of New York Consumer Credit Panel/Equifax, and Equifax Credit Risk Insight Servicing data. Standard errors in parentheses *** p<0.01, ** p<0.05, * p<0.1.
(9) (10) (11) (12) (13) Fraudulent 0.034 -0.006 0.011 -0.021 0.001 (0.026) (0.033) (0.044) (0.033) (0.045) Declared Investor -0.269*** -0.371*** -0.432*** -0.354*** -0.427*** (0.035) (0.050) (0.063) (0.050) (0.064) Second Homeowner -0.524*** -0.647*** -0.321** -0.607*** -0.269* (0.051) (0.060) (0.143) (0.062) (0.148) Second Liens (+1Year After Orig) 0.122*** 0.117*** 0.119*** 0.116*** 0.119*** (0.020) (0.027) (0.027) (0.027) (0.027) Interest Rate (Orig) 0.155*** 0.184*** 0.184*** 0.178*** 0.177*** (0.008) (0.014) (0.014) (0.014) (0.014) FICO Score (Orig) -0.007*** -0.006*** -0.006*** -0.005*** -0.005*** (0.000) (0.000) (0.000) (0.000) (0.000) Origination Amt (Log) 0.149*** 0.213*** 0.214*** 0.193*** 0.195*** (0.026) (0.043) (0.043) (0.040) (0.040) LTV Ratio (Orig) 0.021*** 0.025*** 0.025*** 0.025*** 0.025*** (0.001) (0.002) (0.002) (0.002) (0.002) IO 0.128*** 0.128*** 0.127*** 0.129*** 0.128*** (0.023) (0.030) (0.030) (0.030) (0.030) Jumbo -0.198*** -0.364*** -0.362*** -0.234*** -0.231*** (0.034) (0.059) (0.059) (0.057) (0.057) ARM 0.207*** 0.266*** 0.267*** 0.233*** 0.234*** (0.024) (0.038) (0.038) (0.037) (0.038) Low Doc 0.256*** 0.283*** 0.284*** 0.274*** 0.274*** (0.027) (0.052) (0.052) (0.051) (0.051) Unknown Doc 0.176*** 0.220*** 0.220*** 0.217*** 0.217*** (0.024) (0.037) (0.038) (0.037) (0.038) Correspondent -0.075*** -0.042 -0.039 -0.067 -0.064 (0.026) (0.048) (0.048) (0.050) (0.050) Broker-Originated 0.136*** 0.132*** 0.134*** 0.119*** 0.121*** (0.024) (0.045) (0.046) (0.046) (0.047) %Chg HPI: Close to Dec'08 -2.645*** -2.771*** -2.784*** (0.119) (0.212) (0.210) Chg Unemp: Close to Dec'08 0.015 0.055*** 0.056*** -0.009 -0.009 (0.010) (0.017) (0.017) (0.015) (0.015) FHA -0.636*** -1.037*** -1.039*** -1.006*** -1.010*** (0.075) (0.153) (0.154) (0.153) (0.154) GSE -0.388*** -0.474*** -0.471*** -0.453*** -0.449*** (0.026) (0.043) (0.043) (0.043) (0.043) Portfolio -0.198*** -0.178*** -0.178*** -0.175*** -0.175*** (0.032) (0.049) (0.049) (0.048) (0.048) 2006 Orig 0.087*** 0.084** 0.084** 0.028 0.027 (0.025) (0.042) (0.041) (0.042) (0.042) 2007 Orig -0.043 0.007 0.007 -0.005 -0.006 (0.029) (0.046) (0.047) (0.044) (0.045) 0 < Dist(LPS, EQ) < 25 miles 0.358*** (0.026) 25 <= Dist(LPS, EQ) < 100 miles 0.425*** (0.039) Dist(LPS, EQ) >= 100 miles 0.434***

32
(0.033) Different MSA 0.086** 0.091 0.063* 0.066 (0.034) (0.056) (0.033) (0.052) Different MSA×Fraudulent -0.042 -0.052 (0.067) (0.071) Different MSA×Declared Investor 0.127 0.153* (0.090) (0.089) Different MSA×Second Homeowner -0.369** -0.384** (0.153) (0.160) Observations 34,283 13,443 13,443 13,190 13,190
33
Table 6a: Probit Models of High Bank Card Utilization (Borrowers who did not Default as of Dec 2008) Probit models for the probability of a borrower having bank card utilization (greater than 80%) as of December 2008 among borrowers who did not default on their mortgage. ). Column (4) reports the marginal effects for model (3). Specification (5) restricts the sample to borrowers with multiple loans, and adds a categorical variable for the distance between the mortgage and credit bureau zip codes. Source: Authors’ calculations of McDash Analytics, Federal Reserve Bank of New York Consumer Credit Panel/Equifax, and Equifax Credit Risk Insight Servicing data. Standard errors in parentheses *** p<0.01, ** p<0.05, * p<0.1.
(1) (2) (3) (4) (5) Fraudulent 0.033 -0.006 -0.016 -0.003 -0.066** (0.025) (0.027) (0.027) (0.005) (0.031) Declared Investor 0.102*** 0.075*** 0.064** 0.013** -0.064* (0.024) (0.025) (0.025) (0.005) (0.037) Second Homeowner 0.050* 0.030 0.028 0.006 -0.150*** (0.029) (0.030) (0.030) (0.006) (0.051) Multi First Liens (+1Year After Orig) 0.054*** 0.053*** 0.011*** (0.014) (0.014) (0.003) Second Liens (+1Year After Orig) 0.075*** 0.015*** 0.036* (0.012) (0.002) (0.021) Interest Rate (Orig) 0.075*** 0.073*** 0.073*** 0.015*** 0.057*** (0.007) (0.007) (0.007) (0.001) (0.011) FICO Score (Orig) -0.009*** -0.009*** -0.009*** -0.002*** -0.008*** (0.000) (0.000) (0.000) (0.000) (0.000) Origination Amt (Log) -0.026** -0.032** -0.032** -0.007** 0.060** (0.013) (0.013) (0.013) (0.003) (0.025) LTV Ratio (Orig) 0.007*** 0.008*** 0.008*** 0.002*** 0.005*** (0.001) (0.001) (0.001) (0.000) (0.002) IO 0.086*** 0.083*** 0.080*** 0.016*** 0.092*** (0.018) (0.018) (0.018) (0.004) (0.028) Jumbo -0.052** -0.051** -0.054** -0.011** -0.084** (0.025) (0.025) (0.025) (0.005) (0.039) ARM 0.081*** 0.080*** 0.073*** 0.015*** 0.066** (0.017) (0.017) (0.017) (0.004) (0.029) Low Doc 0.049*** 0.049*** 0.047*** 0.010*** 0.075** (0.015) (0.015) (0.015) (0.003) (0.029) Unknown Doc -0.005 -0.004 -0.007 -0.002 0.032 (0.012) (0.012) (0.012) (0.003) (0.024) Correspondent -0.006 -0.007 -0.003 -0.001 -0.031 (0.013) (0.013) (0.013) (0.003) (0.026) Broker-Originated 0.034** 0.032** 0.033** 0.007** 0.046* (0.015) (0.015) (0.015) (0.003) (0.027) Updated LTV Ratio (Dec'08) 0.001*** 0.001*** 0.001*** 0.000*** 0.001 (0.001) (0.001) (0.001) (0.000) (0.001) Chg Unemp: Close to Dec'08 0.018*** 0.018*** 0.018*** 0.004*** 0.018* (0.005) (0.005) (0.005) (0.001) (0.010) FHA -0.046** -0.043* -0.030 -0.006 0.021 (0.023) (0.023) (0.023) (0.005) (0.067) GSE -0.128*** -0.126*** -0.122*** -0.026*** -0.114*** (0.017) (0.017) (0.017) (0.004) (0.028) Portfolio -0.039* -0.036* -0.032 -0.007 -0.037 (0.021) (0.021) (0.021) (0.005) (0.036) 0 < Dist(LPS, EQ) < 25 miles 0.011 (0.031) 25 <= Dist(LPS, EQ) < 100 miles 0.044 (0.051) Dist(LPS, EQ) >= 100 miles 0.064* (0.038) 2006 Orig -0.014 -0.013 -0.011 -0.002 0.021 (0.014) (0.014) (0.014) (0.003) (0.027) 2007 Orig 0.025* 0.027* 0.033** 0.007** 0.016 (0.015) (0.015) (0.015) (0.003) (0.029) Observations 97,269 97,037 97,037 97,037 25,332

34
Table 6b: Probit Models of High Bank Card Utilization (Borrowers who Defaulted as of Dec 2008) Probit models for the probability of a borrower having high bank card utilization (greater than 80%) among borrowers who were in default (defined as being 60 days or more past due) as of December 2008 (excluding borrowers who had negative termination prior to December 2008). Column (4) reports the marginal effects for model (3). Specification (5) restricts the sample to borrowers with multiple loans, and adds a categorical variable for the distance between the mortgage and credit bureau zip codes. Source: Authors’ calculations of McDash Analytics, Federal Reserve Bank of New York Consumer Credit Panel/Equifax, and Equifax Credit Risk Insight Servicing data. Standard errors in parentheses *** p<0.01, ** p<0.05, * p<0.1.
(1) (2) (3) (4) (5) Fraudulent Investor -0.295*** -0.274*** -0.276*** -0.101*** -0.210*** (0.046) (0.050) (0.050) (0.018) (0.059) Declared Investor -0.086 -0.071 -0.076 -0.028 0.057 (0.068) (0.070) (0.070) (0.026) (0.089) Second Homeowner -0.080 -0.067 -0.070 -0.026 0.057 (0.089) (0.090) (0.090) (0.033) (0.120) Multi First Liens -0.044 -0.042 -0.015 (0.041) (0.041) (0.015) Second Liens 0.025 0.009 -0.005 (0.036) (0.013) (0.048) Interest Rate (Orig) -0.007 -0.007 -0.007 -0.002 -0.030* (0.013) (0.013) (0.013) (0.005) (0.017) FICO Score (Orig) -0.005*** -0.005*** -0.005*** -0.002*** -0.005*** (0.000) (0.000) (0.000) (0.000) (0.001) Origination Amt (Log) -0.013 -0.001 0.000 0.000 0.018 (0.047) (0.048) (0.048) (0.017) (0.072) LTV Ratio (Orig) 0.001 0.001 0.001 0.000 0.002 (0.003) (0.003) (0.003) (0.001) (0.004) IO -0.066* -0.064 -0.064 -0.023 0.000 (0.040) (0.040) (0.040) (0.014) (0.051) Jumbo 0.028 0.022 0.019 0.007 0.045 (0.060) (0.060) (0.060) (0.022) (0.079) ARM -0.045 -0.044 -0.047 -0.017 -0.029 (0.043) (0.043) (0.043) (0.016) (0.057) Low Doc -0.075 -0.074 -0.074 -0.027 -0.084 (0.046) (0.046) (0.046) (0.017) (0.068) Unknown Doc -0.008 -0.008 -0.009 -0.003 -0.015 (0.042) (0.042) (0.042) (0.015) (0.061) Correspondent -0.017 -0.017 -0.017 -0.006 0.058 (0.045) (0.045) (0.045) (0.016) (0.067) Broker-Originated 0.059 0.061 0.060 0.022 0.069 (0.041) (0.041) (0.041) (0.015) (0.056) Updated LTV Ratio (Dec'08) -0.002* -0.002* -0.002* -0.001* -0.001 (0.001) (0.001) (0.001) (0.000) (0.002) Chg Unemp: Close to Dec'08 -0.002 -0.002 -0.002 -0.001 -0.024 (0.016) (0.016) (0.016) (0.006) (0.022) FHA 0.183** 0.178** 0.180** 0.065** 0.274 (0.082) (0.082) (0.083) (0.030) (0.276) GSE -0.021 -0.023 -0.023 -0.008 -0.008 (0.048) (0.048) (0.048) (0.017) (0.066) Portfolio -0.003 -0.007 -0.008 -0.003 -0.021 (0.057) (0.057) (0.057) (0.021) (0.078) 0 < Dist(LPS, EQ) < 25 miles -0.105* (0.062) 25 <= Dist(LPS, EQ) < 100 miles -0.146* (0.083) Dist(LPS, EQ) >= 100 miles -0.140* (0.076) 2006 Orig 0.133*** 0.135*** 0.136*** 0.049*** 0.157** (0.044) (0.044) (0.044) (0.016) (0.062) 2007 Orig 0.191*** 0.192*** 0.194*** 0.070*** 0.099 (0.052) (0.052) (0.052) (0.019) (0.075) Observations 6,512 6,506 6,506 6,506 3,265

35
Table 7: Models for the Determinants of Fraudulent Investors These are probit models for the probability that a self-declared owner occupant is a fraudulent investor. A variety of mortgage origination characteristics are included as controls in addition to other covariates. Column (4) gives the marginal effects for model (3). Specification (5) uses a single bubble state fixed effect instead of state fixed effects. Source: Authors’ calculations of McDash Analytics, Federal Reserve Bank of New York Consumer Credit Panel/Equifax, and Equifax Credit Risk Insight Servicing data. Standard errors in parentheses *** p<0.01, ** p<0.05, * p<0.1. (1) (2) (3) (4) (5) Interest Rate (Orig) 0.1001*** 0.0761*** 0.075*** 0.008*** 0.078*** (0.0061) (0.0063) (0.006) (0.001) (0.006) FICO Score (Orig) 0.0005*** 0.0004*** 0.0005*** 0.0001*** 0.0004*** (0.0001) (0.0001) (0.0001) (0.0000) (0.0001) Origination Amt (Log) 0.0535*** 0.0202 0.067*** 0.008*** 0.148*** (0.0131) (0.0134) (0.016) (0.002) (0.014) LTV Ratio (Orig) 0.0012* 0.0019*** 0.002** 0.000** 0.001 (0.0007) (0.0007) (0.001) (0.000) (0.001) LTV Ratio (Orig) > 80% Flag -0.2277*** -0.1631*** -0.161*** -0.018*** -0.156*** (0.0214) (0.0217) (0.022) (0.002) (0.022) IO 0.0386** 0.0444** 0.046*** 0.005*** 0.059*** (0.0175) (0.0175) (0.017) (0.002) (0.017) Jumbo -0.136*** -0.015*** -0.170*** (0.024) (0.003) (0.023) ARM 0.2468*** 0.1893*** 0.187*** 0.021*** 0.188*** (0.0167) (0.0175) (0.017) (0.002) (0.017) Low Doc 0.1682*** 0.1849*** 0.185*** 0.021*** 0.181*** (0.0173) (0.0175) (0.017) (0.002) (0.017) Unknown Doc 0.0809*** 0.0930*** 0.094*** 0.011*** 0.090*** (0.0145) (0.0147) (0.015) (0.002) (0.015) Correspondent -0.0565*** -0.0301* -0.027* -0.003* -0.035** (0.0158) (0.0161) (0.016) (0.002) (0.016) Broker-Originated 0.1085*** 0.1061*** 0.107*** 0.012*** 0.117*** (0.0158) (0.0158) (0.016) (0.002) (0.016) Lagged 2-year ΔHPI 0.2530*** 0.2419*** 0.226*** 0.025*** 0.305*** (0.0492) (0.0494) (0.049) (0.006) (0.042) Unemp Rate at Orig 0.0318*** 0.0310*** 0.029*** 0.003*** 0.040*** (0.0054) (0.0054) (0.005) (0.001) (0.004) FHA -0.5413*** -0.561*** -0.051*** -0.554*** (0.0376) (0.038) (0.003) (0.038) GSE -0.1244*** -0.159*** -0.019*** -0.167*** (0.0171) (0.018) (0.002) (0.018) Portfolio -0.0097 -0.014 -0.002 -0.020 (0.0213) (0.021) (0.003) (0.021) Bubble State 0.302*** (0.016) 2006 Orig 0.0400** 0.0597*** 0.050*** 0.005*** 0.049*** (0.0164) (0.0165) (0.017) (0.002) (0.016) 2007 Orig 0.1479*** 0.1719*** 0.163*** 0.019*** 0.174*** (0.0211) (0.0214) (0.021) (0.002) (0.020) Observations 115,454 115,454 115,454 115,454 115,454

36
Table 8: OLS regression models for the interest rate at the time of origination (or when first available), for 30-year mortgages originated between June 2005 and December 2007. Column (1) is for borrowers with fixed rate mortgages; column (2) adds the interactions between the borrower type and investor type. Columns (3) is for adjustable-rate mortgages with initial fixed-rate terms of 1, 12, 24, 36, 60, 84, and 120 months; column (4) again adds the interactions between the borrower type and investor type. All specifications include (but do not report) a constant term, state fixed effects, origination month-year fixed effects; the ARM regressions also include dummy variables for the initial fixed term. Source: Authors’ calculations of McDash Analytics, Federal Reserve Bank of New York Consumer Credit Panel/Equifax, and Equifax Credit Risk Insight Servicing data. Standard errors in parentheses *** p<0.01, ** p<0.05, * p<0.1.
(1) (2) (3) (4) VARIABLES FRM FRM ARM ARM Fraudulent Investor 0.137*** 0.164*** 0.178*** 0.114*** (0.010) (0.020) (0.022) (0.029) Declared Investor 0.493*** 0.535*** 0.593*** 0.566*** (0.010) (0.018) (0.026) (0.033) Multiple First Liens (+1Q) 0.051*** 0.051*** 0.013 0.011 (0.005) (0.005) (0.015) (0.015) Second Liens (+6 Months) 0.038*** 0.038*** -0.003 -0.004 (0.005) (0.005) (0.015) (0.015) Dummy for FICO below 660 0.117*** 0.117*** 0.193*** 0.190*** (0.008) (0.008) (0.028) (0.028) FICO -0.002*** -0.002*** -0.004*** -0.004*** (0.000) (0.000) (0.000) (0.000) Dummy for LTV Ratio > 80% 0.153*** 0.153*** 0.629*** 0.629*** (0.007) (0.007) (0.026) (0.026) LTV Ratio 0.003*** 0.003*** 0.006*** 0.006*** (0.000) (0.000) (0.001) (0.001) Origination Amount (Log) -0.224*** -0.225*** -0.417*** -0.416*** (0.005) (0.005) (0.020) (0.020) Option Arm 0.293*** 0.291*** (0.023) (0.023) IO Flag 0.155*** 0.155*** -0.016 -0.017 (0.011) (0.011) (0.018) (0.018) Jumbo 0.027** 0.030** 0.148*** 0.143*** (0.012) (0.012) (0.025) (0.025) Low Doc 0.078*** 0.077*** 0.043** 0.043** (0.006) (0.006) (0.020) (0.020) Unknown Doc 0.040*** 0.038*** 0.435*** 0.434*** (0.005) (0.005) (0.018) (0.018) Correspondent -0.011** -0.011** 0.346*** 0.346*** (0.005) (0.005) (0.021) (0.021) Broker 0.080*** 0.080*** 0.290*** 0.290*** (0.006) (0.006) (0.018) (0.018) Unemployment Rate (at Origination) 0.012*** 0.012*** 0.012* 0.012* (0.002) (0.002) (0.007) (0.007) FHA -0.818*** -0.808*** -2.474*** -2.480*** (0.010) (0.010) (0.092) (0.093) GSE -0.427*** -0.415*** -0.319*** -0.343*** (0.007) (0.008) (0.022) (0.023) Portfolio -0.562*** -0.583*** -0.084*** -0.114*** (0.010) (0.011) (0.020) (0.022) Fraudulent Investor×FHA -0.180*** -0.183 (0.048) (0.679) Fraudulent Investor×GSE -0.061*** 0.081 (0.023) (0.055) Fraudulent Investor×Portfolio 0.324*** 0.226*** (0.041) (0.054) Declared Investor×FHA -0.536** (0.211) Declared Investor×GSE -0.084*** 0.120** (0.020) (0.059) Declared Investor×Portfolio 0.424*** -0.019 (0.047) (0.070) Observations 62,978 62,978 18,999 18,999 R-squared 0.434 0.436 0.564 0.564
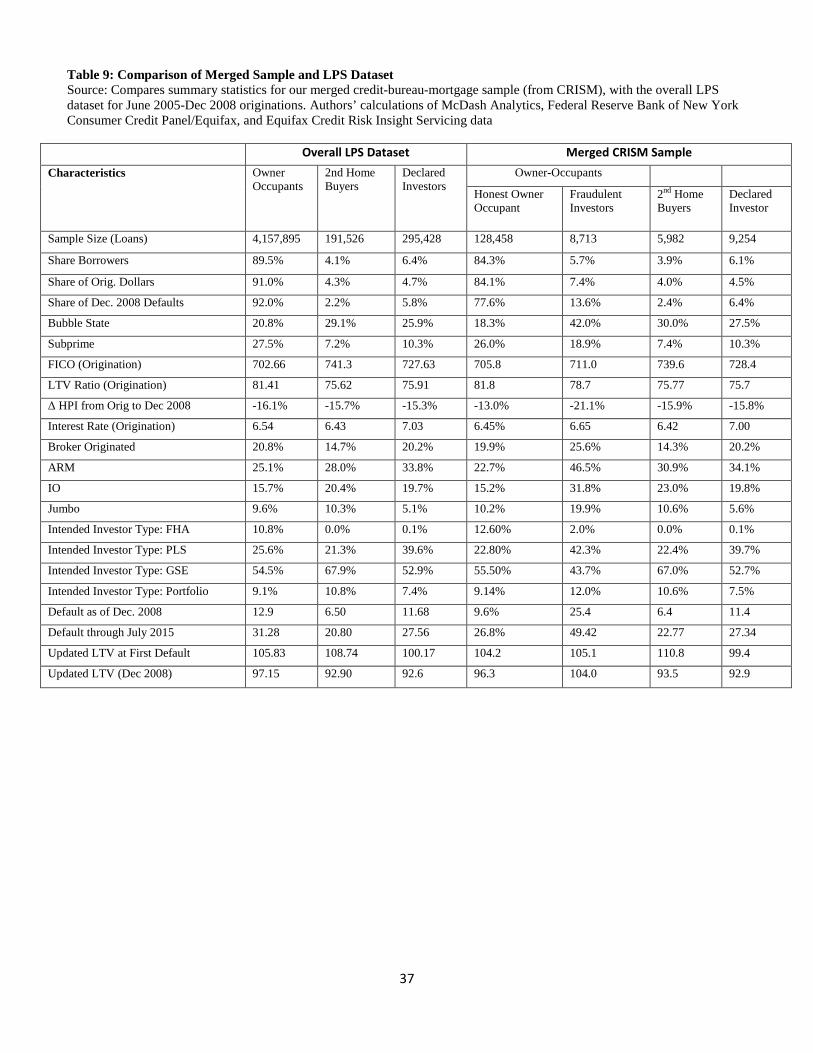
37
Table 9: Comparison of Merged Sample and LPS Dataset Source: Compares summary statistics for our merged credit-bureau-mortgage sample (from CRISM), with the overall LPS dataset for June 2005-Dec 2008 originations. Authors’ calculations of McDash Analytics, Federal Reserve Bank of New York Consumer Credit Panel/Equifax, and Equifax Credit Risk Insight Servicing data
Overall LPS Dataset Merged CRISM Sample Characteristics Owner
Occupants 2nd Home Buyers
Declared Investors
Owner-Occupants
Honest Owner Occupant
Fraudulent Investors
2nd Home Buyers
Declared Investor
Sample Size (Loans) 4,157,895 191,526 295,428 128,458 8,713 5,982 9,254
Share Borrowers 89.5% 4.1% 6.4% 84.3% 5.7% 3.9% 6.1%
Share of Orig. Dollars 91.0% 4.3% 4.7% 84.1% 7.4% 4.0% 4.5%
Share of Dec. 2008 Defaults 92.0% 2.2% 5.8% 77.6% 13.6% 2.4% 6.4%
Bubble State 20.8% 29.1% 25.9% 18.3% 42.0% 30.0% 27.5%
Subprime 27.5% 7.2% 10.3% 26.0% 18.9% 7.4% 10.3%
FICO (Origination) 702.66 741.3 727.63 705.8 711.0 739.6 728.4
LTV Ratio (Origination) 81.41 75.62 75.91 81.8 78.7 75.77 75.7
Δ HPI from Orig to Dec 2008 -16.1% -15.7% -15.3% -13.0% -21.1% -15.9% -15.8%
Interest Rate (Origination) 6.54 6.43 7.03 6.45% 6.65 6.42 7.00
Broker Originated 20.8% 14.7% 20.2% 19.9% 25.6% 14.3% 20.2%
ARM 25.1% 28.0% 33.8% 22.7% 46.5% 30.9% 34.1%
IO 15.7% 20.4% 19.7% 15.2% 31.8% 23.0% 19.8%
Jumbo 9.6% 10.3% 5.1% 10.2% 19.9% 10.6% 5.6%
Intended Investor Type: FHA 10.8% 0.0% 0.1% 12.60% 2.0% 0.0% 0.1%
Intended Investor Type: PLS 25.6% 21.3% 39.6% 22.80% 42.3% 22.4% 39.7%
Intended Investor Type: GSE 54.5% 67.9% 52.9% 55.50% 43.7% 67.0% 52.7%
Intended Investor Type: Portfolio 9.1% 10.8% 7.4% 9.14% 12.0% 10.6% 7.5%
Default as of Dec. 2008 12.9 6.50 11.68 9.6% 25.4 6.4 11.4
Default through July 2015 31.28 20.80 27.56 26.8% 49.42 22.77 27.34
Updated LTV at First Default 105.83 108.74 100.17 104.2 105.1 110.8 99.4
Updated LTV (Dec 2008) 97.15 92.90 92.6 96.3 104.0 93.5 92.9
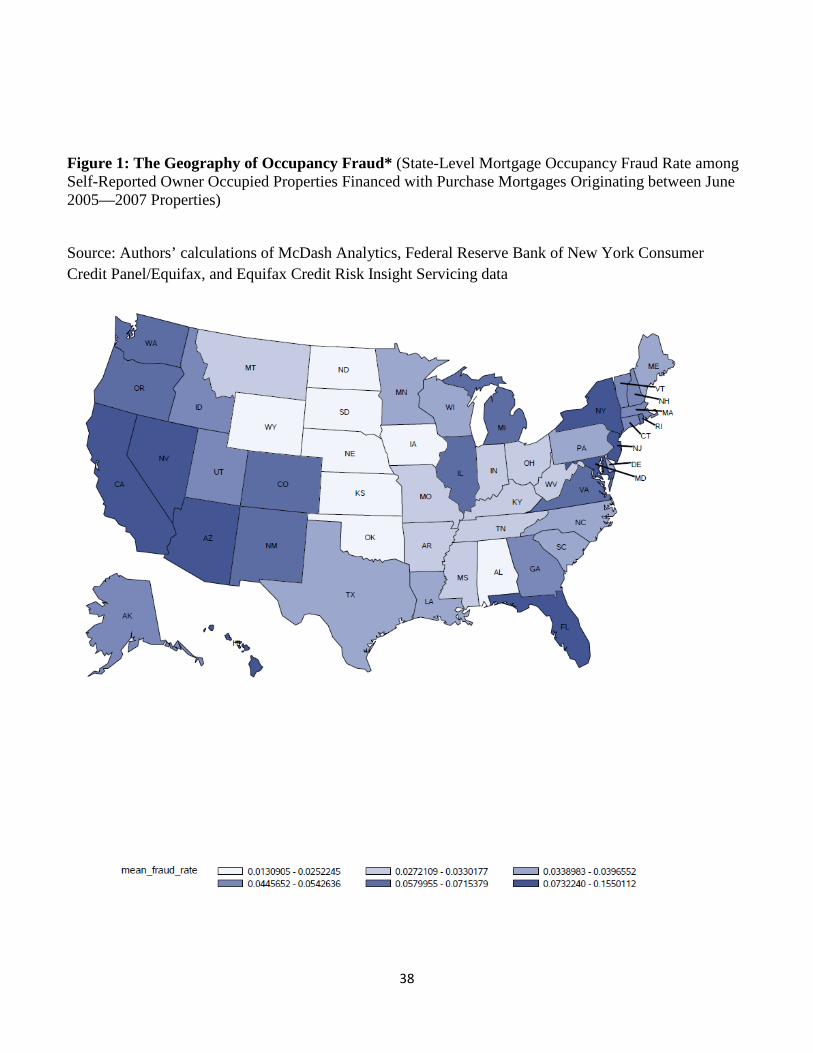
38
Figure 1: The Geography of Occupancy Fraud* (State-Level Mortgage Occupancy Fraud Rate among Self-Reported Owner Occupied Properties Financed with Purchase Mortgages Originating between June 2005—2007 Properties)
Source: Authors’ calculations of McDash Analytics, Federal Reserve Bank of New York Consumer Credit Panel/Equifax, and Equifax Credit Risk Insight Servicing data

39
Figure 2: Interest-Only Mortgage Share by Borrower Type by Year of Origination Source: Authors’ calculations of McDash Analytics, Federal Reserve Bank of New York Consumer Credit Panel/Equifax, and Equifax Credit Risk Insight Servicing data
0.00
0.05
0.10
0.15
0.20
0.25
0.30
0.35
0.40
June 2005 - Dec 2005 2006 2007
Honest Owner Occupant Fraudulent Investor Declared Investor
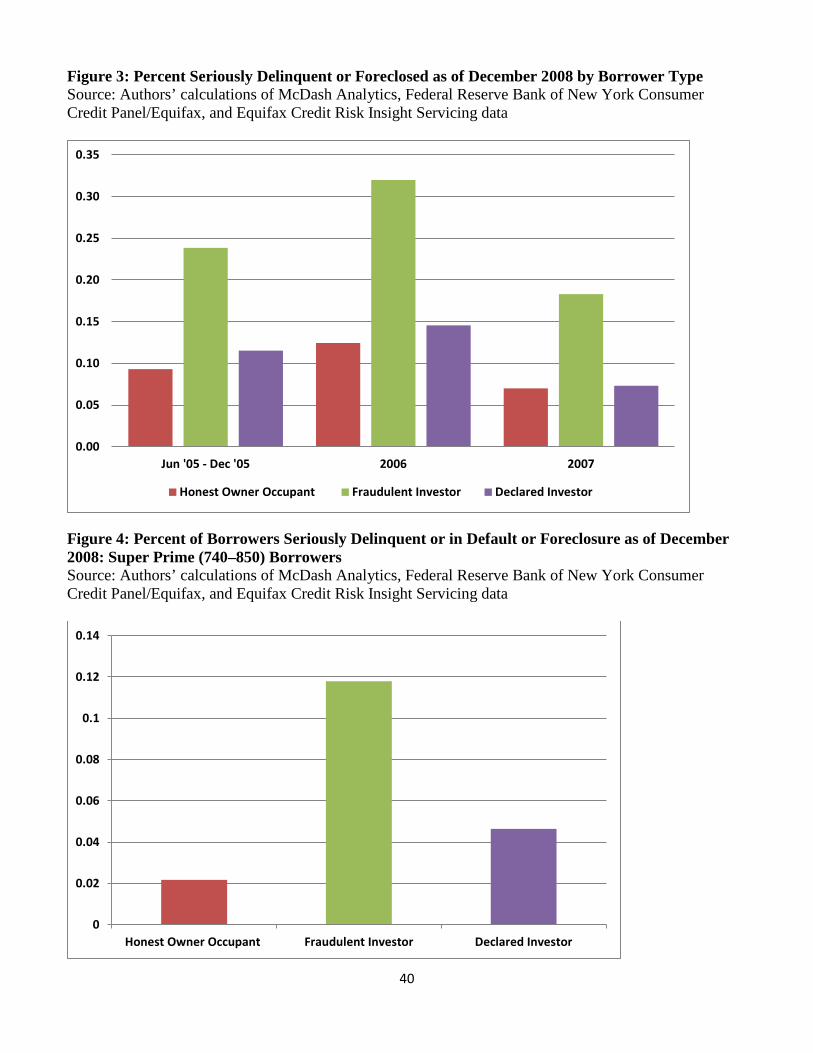
40
Figure 3: Percent Seriously Delinquent or Foreclosed as of December 2008 by Borrower Type Source: Authors’ calculations of McDash Analytics, Federal Reserve Bank of New York Consumer Credit Panel/Equifax, and Equifax Credit Risk Insight Servicing data
Figure 4: Percent of Borrowers Seriously Delinquent or in Default or Foreclosure as of December 2008: Super Prime (740–850) Borrowers Source: Authors’ calculations of McDash Analytics, Federal Reserve Bank of New York Consumer Credit Panel/Equifax, and Equifax Credit Risk Insight Servicing data
0.00
0.05
0.10
0.15
0.20
0.25
0.30
0.35
Jun '05 - Dec '05 2006 2007
Honest Owner Occupant Fraudulent Investor Declared Investor
0
0.02
0.04
0.06
0.08
0.1
0.12
0.14
Honest Owner Occupant Fraudulent Investor Declared Investor
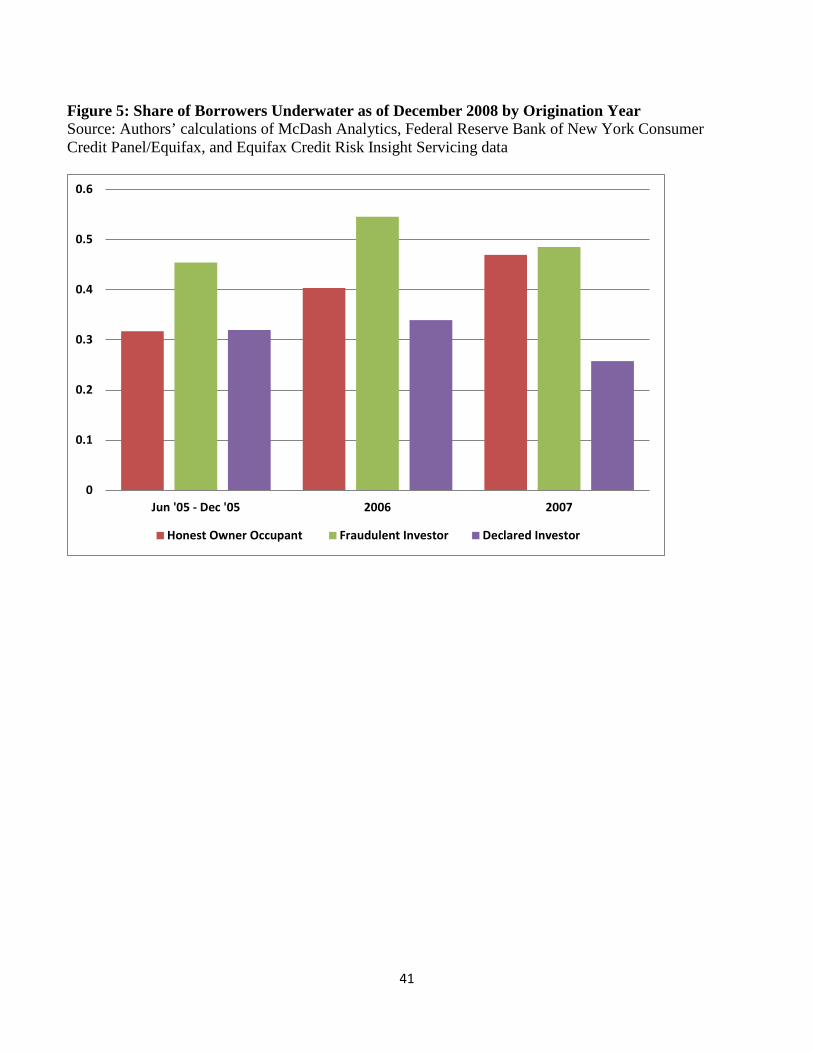
41
Figure 5: Share of Borrowers Underwater as of December 2008 by Origination Year Source: Authors’ calculations of McDash Analytics, Federal Reserve Bank of New York Consumer Credit Panel/Equifax, and Equifax Credit Risk Insight Servicing data
0
0.1
0.2
0.3
0.4
0.5
0.6
Jun '05 - Dec '05 2006 2007
Honest Owner Occupant Fraudulent Investor Declared Investor
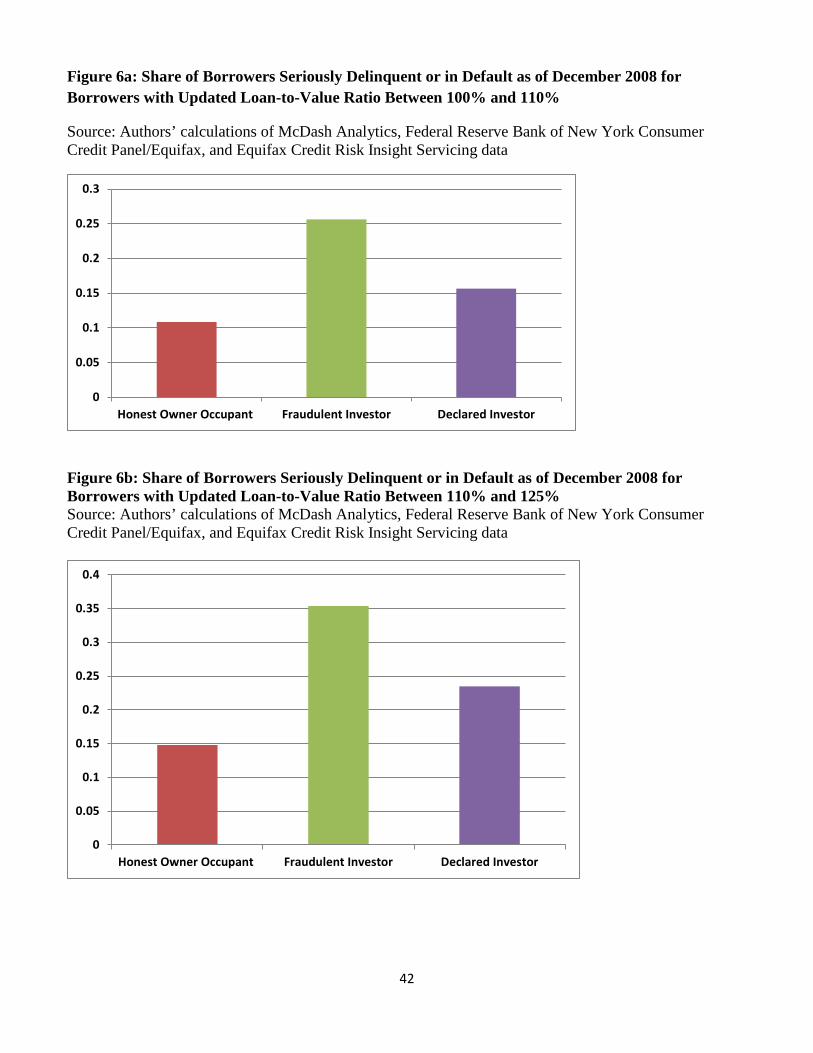
42
Figure 6a: Share of Borrowers Seriously Delinquent or in Default as of December 2008 for Borrowers with Updated Loan-to-Value Ratio Between 100% and 110%
Source: Authors’ calculations of McDash Analytics, Federal Reserve Bank of New York Consumer Credit Panel/Equifax, and Equifax Credit Risk Insight Servicing data
Figure 6b: Share of Borrowers Seriously Delinquent or in Default as of December 2008 for Borrowers with Updated Loan-to-Value Ratio Between 110% and 125% Source: Authors’ calculations of McDash Analytics, Federal Reserve Bank of New York Consumer Credit Panel/Equifax, and Equifax Credit Risk Insight Servicing data
0
0.05
0.1
0.15
0.2
0.25
0.3
Honest Owner Occupant Fraudulent Investor Declared Investor
0
0.05
0.1
0.15
0.2
0.25
0.3
0.35
0.4
Honest Owner Occupant Fraudulent Investor Declared Investor

43
Figure 7a: Share of Loans with Borrowers who have Changed Address by Quarter after Origination
Source: Authors’ calculations of McDash Analytics, Federal Reserve Bank of New York Consumer Credit Panel/Equifax, and Equifax Credit Risk Insight Servicing data
Figure 7b: Mean Number of First Liens in Credit Bureau File by Quarter relative to Date of Origination of Matched First Lien
Source: Authors’ calculations of McDash Analytics, Federal Reserve Bank of New York Consumer Credit Panel/Equifax, and Equifax Credit Risk Insight Servicing data
0.0
0.1
0.2
0.3
0.4
0.5
0.6
0.7
0.8
0.9
1.0
0 1Q 2Q 3Q 4Q 5Q 6Q 7Q 8QQuarter relative to Origination
Honest
Fraud
Declared
0.0
0.5
1.0
1.5
2.0
2.5
3.0
3.5
-1Q 0 1Q 2Q 3Q 4Q 5Q 6Q 7Q 8QQuarters relative to Origination
Honest
Fraud
Declared
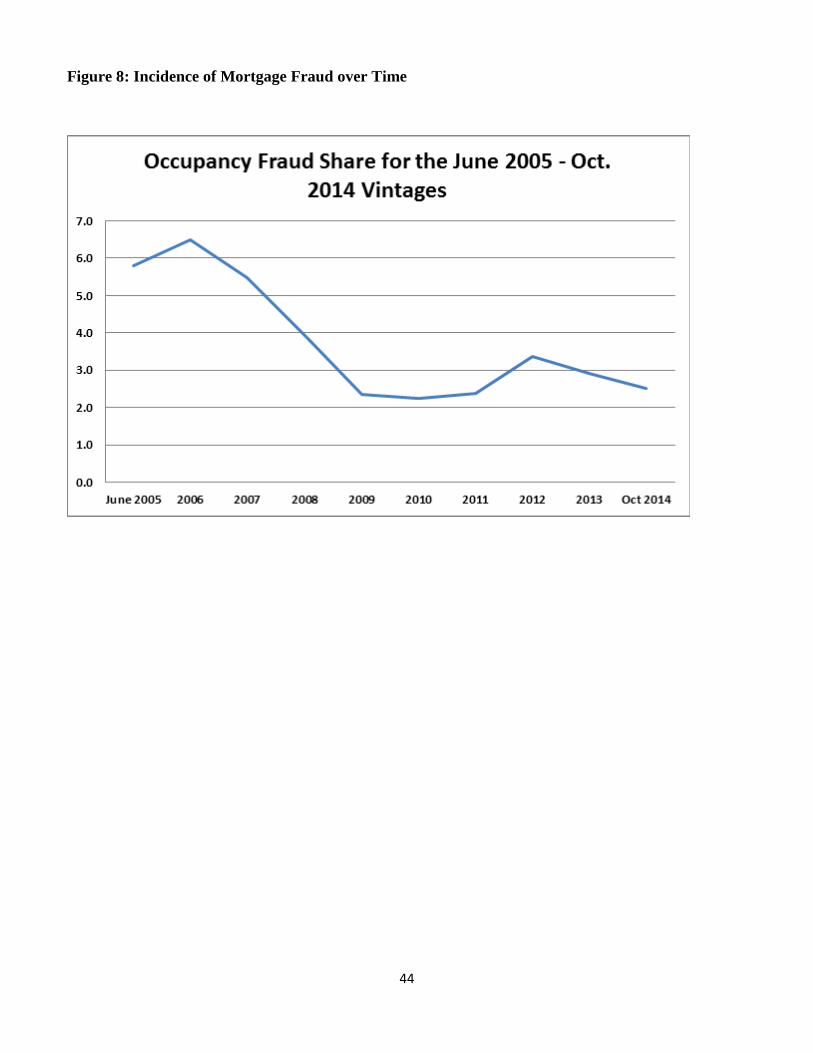
44
Figure 8: Incidence of Mortgage Fraud over Time
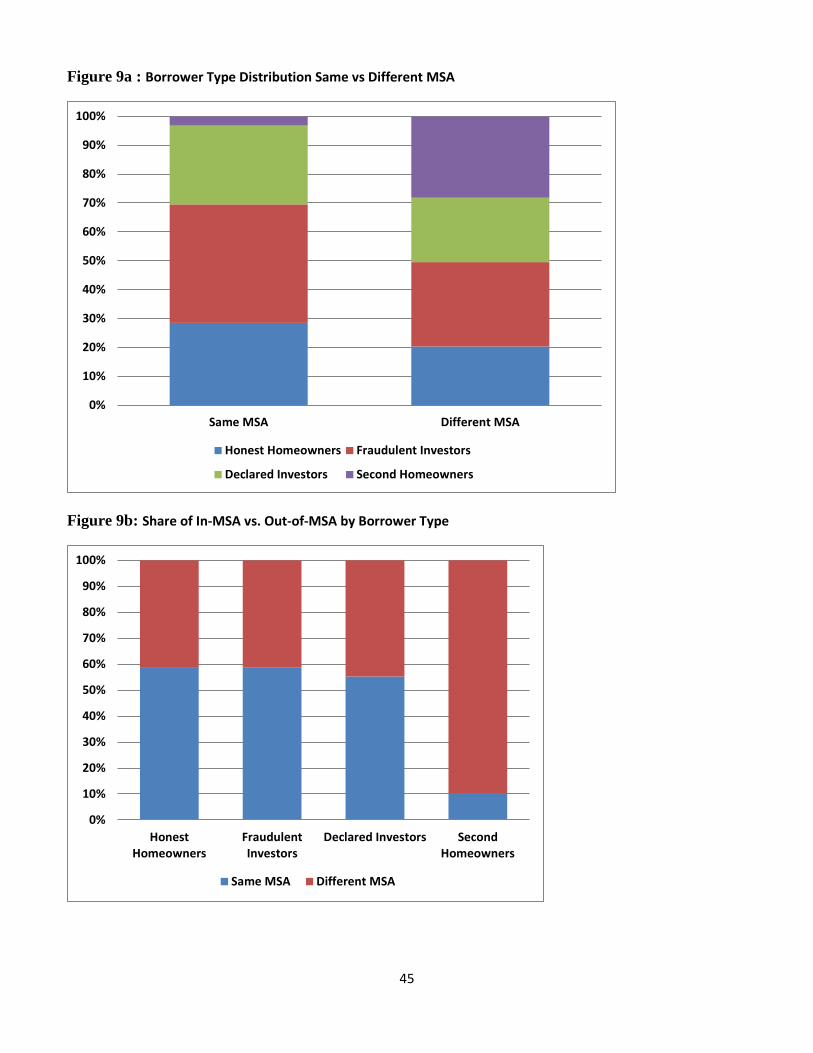
45
Figure 9a : Borrower Type Distribution Same vs Different MSA
Figure 9b: Share of In-MSA vs. Out-of-MSA by Borrower Type
0%
10%
20%
30%
40%
50%
60%
70%
80%
90%
100%
Same MSA Different MSA
Honest Homeowners Fraudulent Investors
Declared Investors Second Homeowners
0%
10%
20%
30%
40%
50%
60%
70%
80%
90%
100%
HonestHomeowners
FraudulentInvestors
Declared Investors SecondHomeowners
Same MSA Different MSA