ownership structure and corporate · pdf filecorporate ownership & control / volume 14,...
TRANSCRIPT

Corporate Ownership & Control / Volume 14, Issue 4, Summer 2017, Continued - 2
413
OWNERSHIP STRUCTURE AND CORPORATE
GOVERNANCE: WHAT DOES THE DATA REVEAL
ABOUT SAUDI LISTED FIRMS?
Mamdouh Abdulaziz Saleh Al-Faryan*, Everton Dockery*
*Department of Economics and Finance, Portsmouth Business School, University of Portsmouth, UK
Abstract
How to cite this paper:
Al-Faryan, M. A. S., & Dockery, E.
(2017).Ownership structure and
corporate governance: What does the
data reveal about Saudi listed firms?
Corporate Ownership & Control, 14(4-2),
413-424.
http://doi.org/10.22495/cocv14i4c2art7
Copyright © 2017 The Authors
This work is licensed under the Creative
Commons Attribution-NonCommercial
4.0 International License (CC BY-NC
4.0).
http://creativecommons.org/licenses/b
y-nc/4.0/
ISSN Online: 1810-3057
ISSN Print: 1727-9232
Received: 16.01.2017
Accepted: 22.06.2017
JEL Classification: G10, G30, G32, L10
DOI: 10.22495/cocv14i4c2art7
In this paper we examine the ownership structure of 169 firms listed on the Saudi Arabian stock market from 2008 to 2014. The analysis uses the testing methodology described by Demsetz and Lehn (1985) to examine the effects of firm and market instability on Saudi ownership structure and additionally, the effect of systematic regulation that imposes constraints on the behaviour of the selected listed firms. We find evidence, for the majority of the ownership structures considered, in favour of the view that firm size, regulation and instability affects ownership structure. The results suggest that the size variable has a positive effect on ownership concentration. Our analysis also shows that instability had some effect on ownership concentration and structure when using the non-linear specification, particularly when using firm specific instability, albeit the effect was stronger when the instability measure was accounting profit returns. Lastly, there is evidence that government-owned firms were mostly affected by regulation while diffused owned firms were affected most by instability than non-government owned firms. Keywords: Ownership Structure, Ownership Concentration, Market Instability, Control Potential. Acknowledgements: We would like to thank the Saudi Arabia Capital Market Authority, Tadawul and Mubasher for their help in providing data for this project.
1. INTRODUCTION The study aims to investigate corporate governance in Saudi Arabia by focusing exclusively on ownership structure and concentration which hopefully will reveal whether the specific corporate governance practices of firms and the system of governance that has emerged in recent times can serve as a magnate of capital flows into an economy seeking to diversify away from oil dependency. Hitherto, the ability of Saudi Arabia to attract foreign capital has been limited and has only received increasing attention following the global financial crisis and the deep economic recession that followed which not only led to a decline in the global demand for oil and, with it, a rapid fall in the price of oil and in oil revenues, culminating in the depletion of foreign currency reserves, but also in the government having to raise funds in international capital markets. At the same time the Saudi stock market has witnessed rapid growth and the challenge has been for the authorities to respond by safeguarding the interest of investors by
addressing deficiencies in corporate governance and by ensuring the proper governance of firms and the stock market by identifying and implementing best practices. It is interesting in this regard that the Saudi authorities implemented improved corporate governance codes and practices designed to increase transparency and the rights of shareholders.
The separation of ownership from control provides the basic cornerstone upon which corporate governance has developed as a way of monitoring agency conflict, aligning the interest of managers and shareholders and in balancing the interest of stakeholders; see Berle and Means (1932), Jensen and Meckling (1976), and Shleifer and Vishny (1997). Of these studies, Shleifer and Vishny (1997) is explicit on the main corporate governance mechanism to limit agency costs in light of their recognition that a firm is nothing but a complex nexus of contracts among the claimants of residual claims and cash flows. Given this particular focus, corporate governance is not only intrinsic for creating stable agency relationships but is also vital for the attraction of foreign direct investment and in
Corporate Ownership & Control / Volume 14, Issue 4, Summer 2017, Continued - 2
414
assuring effective economic growth (i.e. diversification and internationalization), and strong financial performance. The perceived wisdom is that countries with strong governance practices have prosperous economies, while those with weak governance practices tend to adopt poor managerial strategies which only serve to impair the financial positions of firms which, in turn, can leave shareholders much worse off. The influence that certain owners can exert on management is one of the vital areas of corporate governance. Owners with large equity ownership in the firm have a considerable degree of independence and, as such, will, more often than not, use their position to exert pressure on management. In contrast, more diffused ownership is expected to provide managers with considerable discretion and latitude in the devise of corporate strategy, which encourages higher levels of performance. This is a situation that is associated with firms with entrenched managers and a high level of insider ownership.
Empirical studies of governance issues in Saudi Arabia, including ownership structure, are limited to a few areas. Among the recent studies that have investigated governance issues include Eljelly (2009), Al-Hussain and Johnson (2009), Soliman (2013), Al-Sahafi et al. (2015), Al-Ghamadi and Rhodes (2015), Alhumoudi (2016), and Buallay et al. (2017). Of these studies, Al-Ghamadi and Rhodes (2015) examined shareholders holding above 10 per cent equity stake in family and non-family owned Saudi firms and show that while shareholder ownership was positive, its overall effect on firm performance was insignificant. Meanwhile, Alhumoudi (2016) examined Saudi ownership structure focusing, in particular, on managerial and shareholder ownership concentration above five percent and report that managerial ownership had a positive effect on firm performance, while Buallay et al. (2017) in examining the impact of corporate governance on firm performance found a significant and negative effect of the three largest shareholder grouping on firm value. What all these studies impart is that any empirical study covering ownership structures should include a sample that takes the corporate landscape of Saudi Arabia into consideration, which is what the present study seeks to address.
Our interest in Saudi listed firms is due primarily to the economic environment in which they operate which is distinct from the legal and economic environment found in Europe and North America. In fact the data on ownership and control shows that Saudi governance system shares little similarities with European and North American firms. For in these countries private ownership dominate, while in Saudi Arabia government ownership dominates everywhere. However, with the gradual emergence of corporate groupings and the involvement of foreign owners ownership and control are becoming increasingly concentrated, and this therefore have important implications for corporate governance. The present study attempts to provide additional evidence on the development of corporate governance in Saudi Arabia by examining ownership structure and concentration in Saudi listed firms. The contribution of the study written up in the empirical section of this paper is in two areas. First, this paper seeks to identify the
owners of the largest listed firms on the Saudi Stock market and to analyse the determinants of control consistent with the factors at work in most corporate governance systems of the world economy by applying the testing framework of Demsetz and Lehn (1985). Second, the paper analyses the determinants and the effects of concentration by exploring the effects of the potential endogeneity of control.
The rest of the paper proceeds as follows. Section 2 provides an overview of related literature on ownership structure, concentration and performance. Section 3 outlines the testing methodology on which the empirical investigation was undertaken. Section 4 describes the data and discusses the preliminary statistics. Section 5 presents and discusses the results arising from our empirical analysis. Section 5 concludes the paper.
2. LITERATURE REVIEW
Since the work of Jensen and Meckling (1976) which report ownership concentration to have a positive effect on firm performance – if only because it decreased conflicts of interest between managers and owners – issues specific to the relationship between principal –agent conflict as appeared with much frequency in the economics and finance literature. With respect to ownership and control, the role of corporate ownership and the board of directors as governance mechanisms has been subject to considerable empirical investigation. One angle of research use cross-sectional data to interrogate the empirical relationship between ownership structure and firm value; see for example Demsetz and Lehn (1985), Morck et al. (1988), McConnell and Servaes (1990), Cho (1998), Claessens et al. (2000), Ang et al. (2000), and Lemmon and Lins (2003), while Lins (2003), Cronqvist and Nilsson (2003), Villalonga and Amit (2006), and Lin et al. (2011) use panel data. In addition, Claessens et al. (2000), Lemmon and Lins (2003), Lins (2003), La Porta et al. (2002), and Baek et al. (2004) draw on data on listed companies to explain the effect of ownership on firm value, while Classens et al. (2000) in seeking to identify owner-controllers and or non-management blockholders only deliberate a sample of blockholders owning no more than 5 per cent of votes. On the other hand, La Porta et al. (2002) draw on the basic idea of the ‘‘largest blockholder’’ without making the distinction between managerial blockholder and non-managerial one, which is not the case in the present study since we have full knowledge of the owner-controller.
An alternative angle to the studies just referenced is the examined view that ownership structure and board structure are endogenously determined and that the costs and benefits of different ownership and board structures tend vary across firms. Demsetz (1983), for example supports this view when he argued that the ownership structure of a firm is an endogenous outcome of competitive selection in which various cost advantages and disadvantages are balanced to arrive at an equilibrium organization of the firm. In this meaning, corporate governance mechanisms are therefore reflective of a firm’s tradeoffs between costs and benefits. And as a result, the particular

Corporate Ownership & Control / Volume 14, Issue 4, Summer 2017, Continued - 2
415
corporate governance mechanisms in play can be expected to vary systematically across firms. To that end, there is likely to be no statistical association between ownership or board structure and firm value. Studies along this line include Demsetz and Lehn’s (1985) and the study of Hermalin and Weisbach’s (1988) which examined board composition. In particular, Demsetz and Lehn’s (1985) found instability to have a positive significant correlation with ownership concentration. Under non-linear form they found that as instability increases the concentration of ownership diminishes, and that the size of firms displayed a negative effect on ownership concentration. Ownership concentration was found to be much lower in regulated firms than other firms.
Interestingly, La Porta et al. (1999) take the existing ownership structure as an equilibrium response to the domestic legal environments that firms naturally operate in. As a result, ownership variable are endogenous. They also note that most firms around the world have concentrated ownership structure, with large single shareholders who can exercise more power and influence relative to their cash flow rights which can of course lead to an issue of shareholders using their power for their own private personal benefits and not shareholder wealth maximisation. La Porta et al. (1999) report that many of the ownership structure of the large corporations in the 27 developed economies they examined were not widely held; that management ownership was the more dominant form; that widely held firms are more prevalent in countries with good shareholder protection; that many large firms in countries with poor shareholder protection are controlled and managed by families, and that the controlling shareholders enjoy power in excess of their cash flow rights. They also found that ownership is stable over time, which is in sharp contrast with the reported findings of Seyhun’s (1992) who report that over time management shareholding tends to be unstable.
In examining the effect of ownership on firm value, Demsetz and Lehn (1985), Cho (1998), Demsetz and Villalonga (2001), and Lins (2003) greeted the endogeneity of ownership and control measures, while Claessens and Fan (2002), Lins (2003), and Cronqvist and Nilsson (2003) sidestepped the endogeneity problem. Using 2980 firms from 9 East Asian countries, Claessens et al. (2000) separately measure ownership and control and show that separation of ownership and control has negative effect on firm value, while also noting problems encountered in following all the crossholding patterns.
It’s worth noting that Morck et al. (1988) had in fact denounced the findings of Demsetz and Lehn (1985) using a data sample that included managerial ownership, Tobins Q, Leverage, and fixed assets relative to sales, which were all variables not used in Demsetz and Lehn (1985). Both regulated and unregulated firms were included in the overall sample – with two sub-samples of 186 firms that excluded the regulated sector and a sub-sample of 135 firms that included unregulated firms only. Morck et al. (1988) found evidence of a non-linear relationship between ownership concentration and firm performance. Weiss and Hilger (2012) also add to the ownership concentration and performance
debate by accounting for endogeneity using models that build on Demsetz and Lehn (1985) and Demsetz and Villalonga (2001). They report a curvilinear effect of concentration on firm performance, though in controlling for endogeneity the relation becomes insignificant. Sanchez-Ballesta and Garcia-Meca (2007) and Heugens et al. (2009) suggest that one reason for the different results in most studies is that they do not account for endogeneity and non-linearity. However, Denis and McConnell (2003) argued endogenous determination does not always yield value maximisation and therefore, a performance neutral ownership concentration
Lemmon and Lins (2003), using data on 800 firms from 8 East Asian countries report that separation of ownership and control had a negative effect on buy-and-hold returns during the 1997 Asian economic crisis. For Lemmon and Lins (2003) what in fact brings about the negative effect is the combination of three conditions. These are unexpected shocks which reduce investment opportunities; the separation of ownership and control, and the existence of management control. Lins (2003) using 1433 firms from 18 emerging markets where markets for corporate control are underdeveloped found that the control-ownership wedge not only had a negative effect on firm value but also the negative effect was much stronger in countries with low shareholder protection, and that the negative effect was weaker if there is a non-managerial block shareholder. Both Lemmon and Lins (2003) and Claessens and Fan (2002) present evidence in clear support of entrenchments, while Lin et al. (2011) report that the gap between control and ownership increases funding costs. Additionally, we should mention that Nguyen et al. (2015) support the view, in their focus of a well-developed and under-developed market, that concentrated ownership acted as a corporate governance mechanism in countries with weak governance national governance quality.
Pedersen and Thomsen (1997) followed a similar line of investigation to that of Demsetz and Lehn (1985) albeit with an additional variable to measure capital structure. Using a sample of 350 firms from across 12 European countries, they found similar results reported by Demsetz and Lehn. In short, that regulation and firm size had a negative effect on ownership concentration and that instability or volatility in profits had a positive effect on ownership concentration, while the capital structure variable had a negative effect on ownership concentration. The study, however, did not find any relationship between ownership concentration and firm performance. For his part in this line of investigation on the causes of ownership structure in Brazil, Siqueira (1998) found that ownership concentration is affected, to some degree, by national regulations and firm size, while Instability in profits measured via the ROE displayed no effect on the concentration of ownership.
3. DATA COLLECTION
Our objective is to examine empirically the extent to which ownership, family, government, foreign and dispersed ownership has a profound influence in shaping corporate governance in Saudi listed firms. We address these issues by constructing a sample of
Corporate Ownership & Control / Volume 14, Issue 4, Summer 2017, Continued - 2
416
a total of 169 firms with a share listing presence on the Saudi Stock Exchange for the period December 2008 to December 2014. It covers firms which are known to be sensitive to issues of corporate governance in Saudi Arabia. We utilise annual data on ownership concentration which was gathered from Mubasher and the Saudi Capital Market Authority (CMA), while data on firm returns and profit was obtained from Tadawul via Bloomberg from December 2008 to December 2014.
We focus on ownership data based on ownership stakes of 5 per cent or more holdings in any firm, though there are a few firms where no shareholder had more than 5 per cent equity stake. In our classification of firms – family owned, foreign owned, government owned, and dispersed ownership; following Berle and Means (1932) we took a 20 per cent equity ownership stake to be the
level at which an investor would have enough equity in a particular firm to render control and then proceed to classify them as either family, foreign, government, or dispersed ownership firms. In their study, Morck et al. (1988) took the range of 20-30 per cent as being useful for effective meaningful control.
3.1. Research design and description of variables
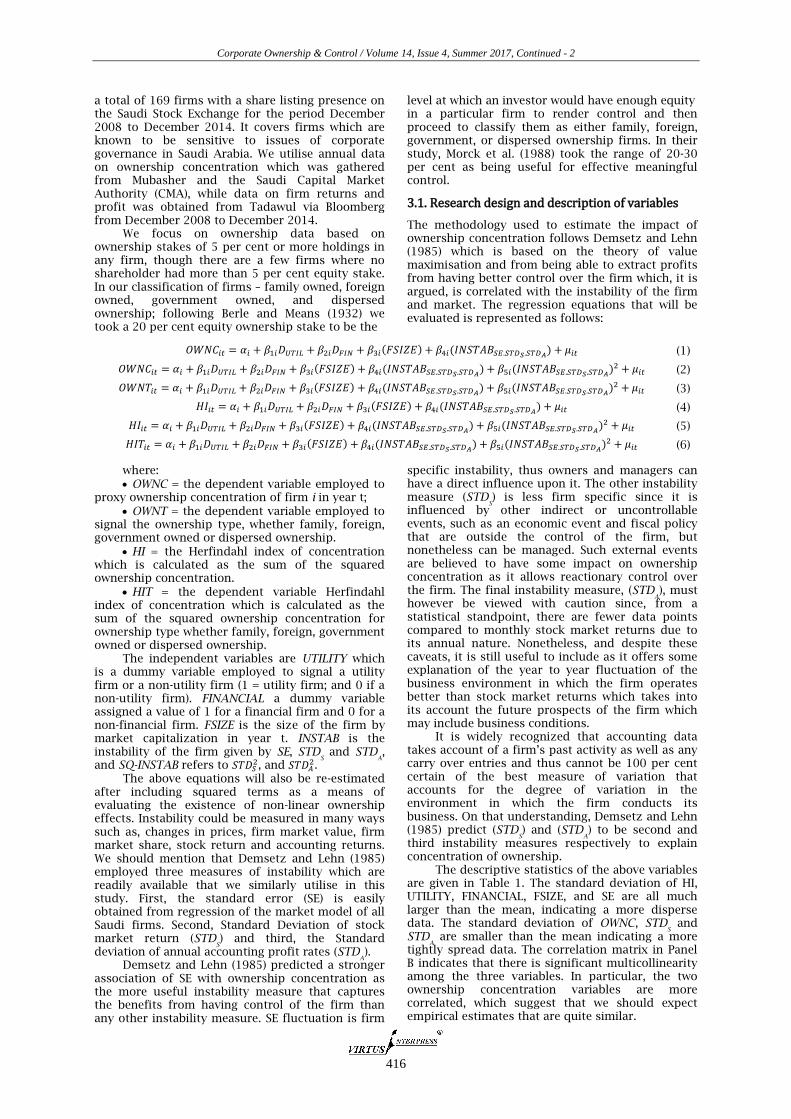
The methodology used to estimate the impact of ownership concentration follows Demsetz and Lehn (1985) which is based on the theory of value maximisation and from being able to extract profits from having better control over the firm which, it is argued, is correlated with the instability of the firm and market. The regression equations that will be evaluated is represented as follows:
𝑂𝑊𝑁𝐶𝑖𝑡 = 𝛼𝑖 + 𝛽1𝑖𝐷𝑈𝑇𝐼𝐿 + 𝛽2𝑖𝐷𝐹𝐼𝑁 + 𝛽3𝑖(𝐹𝑆𝐼𝑍𝐸) + 𝛽4𝑖(𝐼𝑁𝑆𝑇𝐴𝐵𝑆𝐸.𝑆𝑇𝐷𝑆.𝑆𝑇𝐷𝐴) + 𝜇𝑖𝑡 (1)
𝑂𝑊𝑁𝐶𝑖𝑡 = 𝛼𝑖 + 𝛽1𝑖𝐷𝑈𝑇𝐼𝐿 + 𝛽2𝑖𝐷𝐹𝐼𝑁 + 𝛽3𝑖(𝐹𝑆𝐼𝑍𝐸) + 𝛽4𝑖(𝐼𝑁𝑆𝑇𝐴𝐵𝑆𝐸.𝑆𝑇𝐷𝑆.𝑆𝑇𝐷𝐴) + 𝛽5𝑖(𝐼𝑁𝑆𝑇𝐴𝐵𝑆𝐸.𝑆𝑇𝐷𝑆.𝑆𝑇𝐷𝐴
)2 + 𝜇𝑖𝑡 (2)
𝑂𝑊𝑁𝑇𝑖𝑡 = 𝛼𝑖 + 𝛽1𝑖𝐷𝑈𝑇𝐼𝐿 + 𝛽2𝑖𝐷𝐹𝐼𝑁 + 𝛽3𝑖(𝐹𝑆𝐼𝑍𝐸) + 𝛽4𝑖(𝐼𝑁𝑆𝑇𝐴𝐵𝑆𝐸.𝑆𝑇𝐷𝑆.𝑆𝑇𝐷𝐴) + 𝛽5𝑖(𝐼𝑁𝑆𝑇𝐴𝐵𝑆𝐸.𝑆𝑇𝐷𝑆.𝑆𝑇𝐷𝐴
)2 + 𝜇𝑖𝑡 (3)
𝐻𝐼𝑖𝑡 = 𝛼𝑖 + 𝛽1𝑖𝐷𝑈𝑇𝐼𝐿 + 𝛽2𝑖𝐷𝐹𝐼𝑁 + 𝛽3𝑖(𝐹𝑆𝐼𝑍𝐸) + 𝛽4𝑖(𝐼𝑁𝑆𝑇𝐴𝐵𝑆𝐸.𝑆𝑇𝐷𝑆.𝑆𝑇𝐷𝐴) + 𝜇𝑖𝑡 (4)
𝐻𝐼𝑖𝑡 = 𝛼𝑖 + 𝛽1𝑖𝐷𝑈𝑇𝐼𝐿 + 𝛽2𝑖𝐷𝐹𝐼𝑁 + 𝛽3𝑖(𝐹𝑆𝐼𝑍𝐸) + 𝛽4𝑖(𝐼𝑁𝑆𝑇𝐴𝐵𝑆𝐸.𝑆𝑇𝐷𝑆.𝑆𝑇𝐷𝐴) + 𝛽5𝑖(𝐼𝑁𝑆𝑇𝐴𝐵𝑆𝐸.𝑆𝑇𝐷𝑆.𝑆𝑇𝐷𝐴
)2 + 𝜇𝑖𝑡 (5)
𝐻𝐼𝑇𝑖𝑡 = 𝛼𝑖 + 𝛽1𝑖𝐷𝑈𝑇𝐼𝐿 + 𝛽2𝑖𝐷𝐹𝐼𝑁 + 𝛽3𝑖(𝐹𝑆𝐼𝑍𝐸) + 𝛽4𝑖(𝐼𝑁𝑆𝑇𝐴𝐵𝑆𝐸.𝑆𝑇𝐷𝑆.𝑆𝑇𝐷𝐴) + 𝛽5𝑖(𝐼𝑁𝑆𝑇𝐴𝐵𝑆𝐸.𝑆𝑇𝐷𝑆.𝑆𝑇𝐷𝐴
)2 + 𝜇𝑖𝑡 (6)
where: OWNC = the dependent variable employed to
proxy ownership concentration of firm i in year t;
OWNT = the dependent variable employed to signal the ownership type, whether family, foreign, government owned or dispersed ownership.
HI = the Herfindahl index of concentration which is calculated as the sum of the squared ownership concentration.
HIT = the dependent variable Herfindahl index of concentration which is calculated as the sum of the squared ownership concentration for ownership type whether family, foreign, government owned or dispersed ownership.
The independent variables are UTILITY which is a dummy variable employed to signal a utility firm or a non-utility firm (1 = utility firm; and 0 if a non-utility firm). FINANCIAL a dummy variable assigned a value of 1 for a financial firm and 0 for a non-financial firm. FSIZE is the size of the firm by market capitalization in year t. INSTAB is the instability of the firm given by SE, STD
S and STD
A,
and SQ-INSTAB refers to 𝑆𝑇𝐷𝑆2, and 𝑆𝑇𝐷𝐴
2. The above equations will also be re-estimated
after including squared terms as a means of evaluating the existence of non-linear ownership effects. Instability could be measured in many ways such as, changes in prices, firm market value, firm market share, stock return and accounting returns. We should mention that Demsetz and Lehn (1985) employed three measures of instability which are readily available that we similarly utilise in this study. First, the standard error (SE) is easily obtained from regression of the market model of all Saudi firms. Second, Standard Deviation of stock market return (STD
S) and third, the Standard
deviation of annual accounting profit rates (STDA).
Demsetz and Lehn (1985) predicted a stronger association of SE with ownership concentration as the more useful instability measure that captures the benefits from having control of the firm than any other instability measure. SE fluctuation is firm
specific instability, thus owners and managers can have a direct influence upon it. The other instability measure (STD
S) is less firm specific since it is
influenced by other indirect or uncontrollable events, such as an economic event and fiscal policy that are outside the control of the firm, but nonetheless can be managed. Such external events are believed to have some impact on ownership concentration as it allows reactionary control over the firm. The final instability measure, (STD
A), must
however be viewed with caution since, from a statistical standpoint, there are fewer data points compared to monthly stock market returns due to its annual nature. Nonetheless, and despite these caveats, it is still useful to include as it offers some explanation of the year to year fluctuation of the business environment in which the firm operates better than stock market returns which takes into its account the future prospects of the firm which may include business conditions.
It is widely recognized that accounting data takes account of a firm’s past activity as well as any carry over entries and thus cannot be 100 per cent certain of the best measure of variation that accounts for the degree of variation in the environment in which the firm conducts its business. On that understanding, Demsetz and Lehn (1985) predict (STD
S) and (STD
A) to be second and
third instability measures respectively to explain concentration of ownership.
The descriptive statistics of the above variables are given in Table 1. The standard deviation of HI, UTILITY, FINANCIAL, FSIZE, and SE are all much larger than the mean, indicating a more disperse data. The standard deviation of OWNC, STD
S and
STDA are smaller than the mean indicating a more
tightly spread data. The correlation matrix in Panel B indicates that there is significant multicollinearity among the three variables. In particular, the two ownership concentration variables are more correlated, which suggest that we should expect empirical estimates that are quite similar.

Corporate Ownership & Control / Volume 14, Issue 4, Summer 2017, Continued - 2
417
Table 1. Descriptive statistics
Panel A: Descriptive statistics
Variable Observations Mean Std Dev. Minimum Maximum
OWNC 931 41.55 20.89 5 95
HI 931 11.65 13.62 0.25 90.25
UTILITY 1183 0.01 0.11 0 1
FINANCIAL 1183 0.28 0.45 0 1
FSIZE 1037 9320.80 26766.61 133.5 334500
SE 1183 0.30 3.13 -7.06 2.90
STDS 1183 13.64 8.33 6.14 32.00
STDA 1183 10.64 1.07 9.06 12.57
Panel B: Correlation matrix
OWNC HI FSIZE
OWNC 1
HI 0.767*** (0.000)
1
FSIZE 0.309*** (0.000)
0.398*** (0.000)
1
Note: ***, **, and * represent significance at the 1%, 5% and 10% levels respectively. The P-Value are in parentheses.
Table 2 presents the frequency distribution
pertaining to the concentration of ownership stakes held in Saudi listed firms. The statitistics show that 90% of the ownership lies between ownership concentration intervals 9.5%–72.5%, which is further distributed in a range between 102–133 different ownership stakes for each category. Less than 5% of the ownership stakes lie within the <9.5% interval and less than 5% of the ownership stakes lie in the
highest ownership concentration invervals of 72.5% –100%. Notably the frequency distribution for the Herfindahl Index of ownership concentration reveal that the data is skewed, with 58% of ownership stakes within the <9.5 interval, almost 20% of the data in the 9.5–18.5 interval, 13% of the data in the 18.5–27.5 interval, and the remaining 10 % of ownership data in the larger combined interval between 18.5 and 100.
Table 2. Frequency distribution of ownership concentration
Interval % Midpoint Frequency Relative % Cumulative %
5% FSIZE HI 5% FSIZE HI 5% FSIZE HI
<9.5 5 45 541 4.83 58.11 4.83 58.11
9.5 – 18 14 128 181 13.75 19.44 18.58 77.55
18.5 – 27.5 23 105 118 11.28 12.67 29.86 90.23
27.5 – 36.5 32 133 39 14.29 4.19 44.15 94.41
36.5 – 45.5 41 102 17 10.96 1.83 55.10 96.24
45.5 – 54.5 50 127 16 13.64 1.72 68.74 97.96
54.5 – 63.5 59 117 8 12.57 0.86 81.31 98.82
63.5 – 72.5 68 133 2 14.29 0.21 95.60 99.03
72.5 – 81.5 77 21 2 2.26 0.21 97.85 99.25
81.5 – 90.5 86 13 1 1.40 0.11 99.25 99.36
>90.5 95 7 6 0.75 0.64 100 100
Total 931 931
4. EMPIRICAL ANALYSIS
In estimating Equation (1) through to (6), we use data for up to 169 firms for the period 2008–2014. The empirical results of our empirical estimates are reported in Tables 3 and 4. In these tables the estimates are offered for ownership concentration and the categories of ownership present in the Saudi economy, namely family, foreign, government, and dispersed ownership. In relation with these ownership types we discuss the effects of various independent variables measuring instability on two
dependent variables (LOWNC and LHI) using multiple linear regression analysis. In Table 4 the dependent variables used are LOWNC and LHI respectively. The independent variables are SE, STD
S,
STDA, UTILITY, FINANCIAL and FSIZE which captures
the effects of firm size. In the non-linear regression model, additional squared values of instability are included, represented by [SE]2, [STD
S]2 and [STD
A]2.
We first examine ownership concentration and report the regression results of Eq. (1,2,4,5) in Table 3. The major variable of interest for ownership concentration is FSIZE, which as the

Corporate Ownership & Control / Volume 14, Issue 4, Summer 2017, Continued - 2
418
statistics indicate has a small positive coefficients that are significant at the 5% and 1% level, indicating therefore that the size of Saudi firms have a small positive effect on ownership concentration. Based on the existing theory and the empirical literature we expect, a priori, a negative association between ownership concentration and the size variable in accordance with the findings of Demsetz and Lehn (1985), but the opposite results was found. We interpret this to suggest that Saudi investors view firm size to evidence security and are more than willing to increase their shareholdings as a result. This particular observation is not surprising as Siqueira (1998) found a statistically significant zero correlation between the size of Brazilian stocks and ownership concentration which he suggests could be partly due to the financing decision of Brazilian firms, (i.e. owners prefer more debt finance over the issuing of shares thereby maintaining control while keeping their ownership stake in tact). Notably, Pedersen and Thomsen (1997) found a negative effect of size in European stocks similar to the results of Demsetz and Lehn, while Weiss and Hilger (2012) report a significant negative association with market capitalisation (firm size) and ownership concentration. Importantly, systematic regulation, as gauged by UTILITY and FINANCIAL, has a positive effect on ownership concentration, though none are significant in either the linear or non-linear specifications. With respect to this, Siqueira (1998) report a significant positive effect of UTILITY and financial firms on ownership concentration, while Demsetz and Lehn (1985) report a negative effect of systematic regulation on ownership concentration of US firms. On this issue, Pedersen and Thomsen (1997) note that regulation had a negative effect on ownership concentration for a sample of European firms, while Weiss and Hilger (2012) report regulation to have a negative and insignificant association with ownership concentration.
The SE which gauges firm specific instability is not however significant in the linear model, though it should be noted that when the term [SE]2 is included the results show a small positive and significant coefficient of 0.011 at the 10% level and 0.003 at the 5% level for [SE] and [SE]2 respectively. This suggests that non-linear firm ownership concentration may perhaps be better explained by firm specific instability and that with increasing levels of firm specific instability, [SE] and [SE]2, the degree of ownership concentration increases, thereby lending mild support to the theory of control potential that owners increase their stake in the firm in order to benefit from having more effective control over the company (Demsetz and Lehn, 1985). We should also note that the instability coefficients although significantly positive are both close to zero.
In terms of the results from both linear and non-linear models which employ STD
S to capture
stock market instability. Neither variables are significant and their coefficients are close to zero, suggesting that stock market instability, [STD
S] and
[STDS]2, have no effect on ownership concentration
which does rather lend support to the theory of control potential as owners are less likely to be able to control market wide events that occur and affect all firms which evidently is not within the ambit of direct control of owners. Under such circumstances,
all that owners can do is to allow managers to devise appropriate strategies in order to manage the changing conditions. The findings here are not significant as those for the firm specific instability variable, (SE), in which owners can exert more effective control. Likewise the findings from both linear and non-linear models which employ accounting instabilities, STD
A and [STD
A]2, reveal
STDA in the linear model to have no significant
effect on ownership concentration, though when the non-linear model is applied both STD
A and [STD
A]2
becomes significant at the 1% level. We also find evidence of a strong negative effect of STD
A on
ownership concentration which indicate that when there is increasing instability in accounting returns owners view this negatively and reduce their concentration of ownership. This is a spontaneous response on the part of owners which is in accordance with the theory which argues that owners will not invest in companies with volatile accounting earnings.
We find the variable, [STDA]2, to be significant
and positive which is suggestive that at higher values of accounting instability ownership concentration is likely to increase, but only to a degree. The coefficient, although positive, is close to zero. Particularly noteworthy is that there are Saudi listed firms where a single shareholder owns more than 90% of a firm’s equity. Such shareholders would be inclined to take a long term view of the firm – one with greater control and amenity potential.
In Panel A of Table 3, the significance of the coefficients suggests that investors place more emphasis on accounting returns in preference to overall stock market returns. This is for two reasons. First, accounting returns is more firm specific and direct and second, accounting instability is more useful for control purposes. In order of preference, firm specific instability takes second place because control is considered important for increase potential profits. Firm size is also seen to have a positive effect on ownership concentration, while systematic regulation as no effect on ownership concentration. Notably, R2 ranges between 5.5 % and 6.1%.
In Panel B of Table 3, the regression estimates for our ownership variable LHI are overall in line with the reported results in panel A. Systematic regulation, UTILITY and FINANCIAL, have a positive coefficient and insignificant effect on ownership concentration. The effects of Instability on our ownership variable LHI are consistent with the estimates reported in panel A. Here the stand out coefficient is the size variable which is insignificant apart from the last regression in which the variable is mildly positive and significant at the 10% level. Hence there is little evidence here to support the estimate reported in panel A that the FSIZE variable has a positive effect on ownership concentration, as measured via the LHI. Aside from the main differences, the sign of the coefficient is consistent with the reported values in panel A. This is not too surprising, since both ownership concentration variables, LOWNC and LHI, are related. The R2 ranges from 4.6% to 5.7%.
Hitherto, the reported results are in sharp contrast with the findings of Demsetz and Lehn (1985) for we find positive coefficients for all

Corporate Ownership & Control / Volume 14, Issue 4, Summer 2017, Continued - 2
419
systematic regulation variables for both Utility and Financial, though this was not highly significant. Particularly, Demsetz and Lehn (1985) found the systematic regulation variables to be of the opposite sign with significant negative coefficients, while their results indicate a decrease in the concentration of ownership for regulated firms. On account of the reported empirical estimates we are, however, unable to draw any firm deductions about the effects of regulation on Saudi Arabian firms because while the coefficients were all positive they were not altogether significant.
Comparing the overall results obtained on the
impact of INSTAB on ownership concentration, we find the results are in the opposite direction to Demsetz and Lehn (1985) and Pedersen and Thomsen (1997). Further, they were only significant in the non-linear form for instability measures SE and STD
A in this study. Siqueira (1998) investigated
instability using the standard deviation of the return on equity only and found no significant evidence to show volatility in the ROE has any impact on the concentration of ownership. Weiss and Hilger (2012) found their risk variables to have a positive impact on ownership concentration both in the linear and non-linear regression specification.
Table 3. Ownership structure
Panel A: Ownership Structure
LOWNC LOWNC LOWNC LOWNC LOWNC LOWNC
CONSTANT 3.475***
(.059) 3.445***
(.061) 3.485***
(.061) 3.510***
(.073) 3.584***
(.105) 6.690***
(.819)
UTILITY 0.343
(0.451) 0.338
(0.451) 0.344
(0.455) 0.345
(0.451) 0.346
(0.450) 0.324
(0.446)
FINANCIAL 0.146
(0.097) 0.145
(0.097) 0.145
(0.097) 0.145
(0.097) 0.146
(0.097) 0.142
(0.096)
FSIZE 2.26e−06** (1.08e−06)
2.36e−06** (1.08e−06)
2.20e−06** (1.07e−06)
2.15e−06** (1.07e−06)
2.10e−06** (1.07e−06)
2.88e−06*** (1.08e−06)
SE -0.002 (0.003)
0.011* (0.006)
[SE]2 0.003** (0.001)
STDS
-0.001 (0.001)
-0.004 (0.006)
[STDS]2
0.000 (0.000)
STDA
-0.010 (0.008)
-0.593*** (0.153)
[STDA]2
0.027*** (0.007)
R2 5.6% 5.7% 5.6% 5.6% 5.5% 6.1%
Panel B: Herfindahl index
LHI LHI LHI LHI LHI LHI
CONSTANT 1.723***
(.108) 1.682***
(.110) 1.728***
(.111) 1.799***
(.127) 1.914***
(.174) 5.242*** (1.299)
UTILITY 0.766
(0.837) 0.760
(0.839) 0.764
(0.843) 0.768
(0.837) 0.767
(0.834) 0.742
(0.831)
FINANCIAL 0.184
(0.171) 0.183
(0.171) 0.183
(0.171) 0.184
(0.171) 0.184
(0.171) 0.181
(0.170)
FSIZE 2.37e−06
(1.78e−06) 2.51e−06
(1.77e−06) 2.43e−06
(1.76e−06) 2.24e−06
(1.77e−06) 2.32e−06
(1.75e−06) 3.24e−06* (1.78e−06)
SE 0.001 0.005
0.018* (0.009)
[SE]2 0.004** (0.002)
STDS
-0.000 (0.002)
-0.010 (0.009)
[STDS]2
0.000 (0.000)
STDA
-0.018 (0.013)
-0.643*** (0.242)
[STDA]2
0.029*** (0.011)
R2 4.8% 4.9% 4.9% 4.6% 4.8% 5.7%
The FSIZE variable was also in the opposite
direction to that reported by Demsetz and Lehn (1985) and Pedersen and Thomsen (1997). And although the generated estimates yielded positive and significant coefficient with LOWNC, this was not significant in the LHI regression which yielded small positive coefficients. We should add that Demesetz
and Lehn (1985) and Pedersen and Thomsen (1997) also displayed very small negative coefficients on the effects of firm size on ownership concentration, while Siqueira (1998) reported no correlation between ownership concentration and the size of Brazilian firms.

Corporate Ownership & Control / Volume 14, Issue 4, Summer 2017, Continued - 2
420
Table 4. Ownership types
Panel A: Family ownership
LOWNC LOWNC LOWNC LHI LHI LHI
CONSTANT 3.582***
(.074) 3.55*** (.085)
5.606*** (.922)
2.493*** (.181)
2.537*** (.240)
5.599* (3.335)
UTILITY -
- - - - -
FINANCIAL 0.131
(0.413) 0.185
(0.406) 0.097
(0.412) -1.094 (1.024)
-1.164 (1.009)
-1.188 (1.026)
FSIZE 1.49e−06
(1.33e−06) 1.02e−06
(1.35e−06) 1.80e−06
(1.35e−06) 4.55e−06
(4.99e−06) 5.27e−06
(4.98e−06) 5.47e−06
(5.04e−06)
SE 0.001
(0.006)
0.000 (0.024)
[SE]2 0.002 (0.001)
-8.32e−06
(0.005)
STDS
0.006
(0.006)
-0.003 (0.023)
[STDS]2
-0.000 (0.000)
-0.000 (0.001)
STDA
-0.386** (0.172)
-0.562 (0.622)
[STDA]2
0.018** (0.008)
0.025
(0.029)
R2 6.2% 4.9% 6.9% 6.8% 7.6% 7.6%
Panel B: Foreign ownership LOWNC LOWNC LOWNC LHI LHI LHI
CONSTANT 3.478***
(.095) 3.523***
(.102) 4.183***
(.863) 2.252***
(.331) 2.556***
(.374) 8.640** (3.441)
UTILITY - - - - - -
FINANCIAL 0.002
(0.083) -0.005 (0.082)
0.007 (0.083)
0.311 (0.311)
-0.033 (0.313)
0.069 (0.314)
FSIZE -1.22e−06 (2.11e−06)
-1.45e−06 (2.15e−06)
-6.06e−07 (2.09e−06)
-5.21e−07 (8.22e−06)
-2.42e−06 (8.35e−06)
3.02e−06 (8.27e−06)
SE 0.006
(0.006)
0.047* (0.024)
[SE]2 0.001 (0.001)
0.010** (0.005)
STDS
-0.004 (0.006)
-0.022 (0.024)
[STDS]2
0.000 (0.000)
0.001
(0.001)
STDA
-0.127 (0.163)
-1.169* (0.653)
[STDA]2
0.006 (0.008)
0.053* (0.030)
R2 5.6% 7.6% 3.3% 0.51% 0.09% 0.8%
Panel C: Government ownership LOWNC LOWNC LOWNC LHI LHI LHI
CONSTANT 3.699***
(.081) 3.710***
(.089) 3.016***
(.716) 2.722***
(.158) 2.836***
(.184) 3.213* (1.760)
UTILITY 0.663* (0.360)
0.661* (0.360)
0.664* (0.362)
1.215* (0.688)
1.215* (0.704)
1.210* (0.682)
FINANCIAL -0.068 (0.147)
-0.067 (0.147)
-0.068 (0.148)
-0.459 (0.282)
-0.459 (0.289)
-0.461* (0.280)
FSIZE 6.99e−07
(5.48e−07) 7.70e−07
(5.42e−07) 6.57e−07
(5.53e−07) 1.32e−06
(1.32e−06) 1.29e−06
(1.31e−06) 1.50e−06
(1.33e−06)
SE 0.001
(0.005)
0.009 (0.013)
[SE]2 -0.000 (0.001)
0.001
(0.002)
STDS
-0.003 (0.005)
-0.014 (0.012)
[STDS]2
0.000 (0.000)
0.000
(0.000)
STDA
0.132
(0.134)
-0.071 (0.329)
[STDA]2
0.006 (0.006)
0.002
(0.015)
R2 22.7% 23.3% 22.3% 24.2% 24.1% 24.9%
Corporate Ownership & Control / Volume 14, Issue 4, Summer 2017, Continued - 2
421
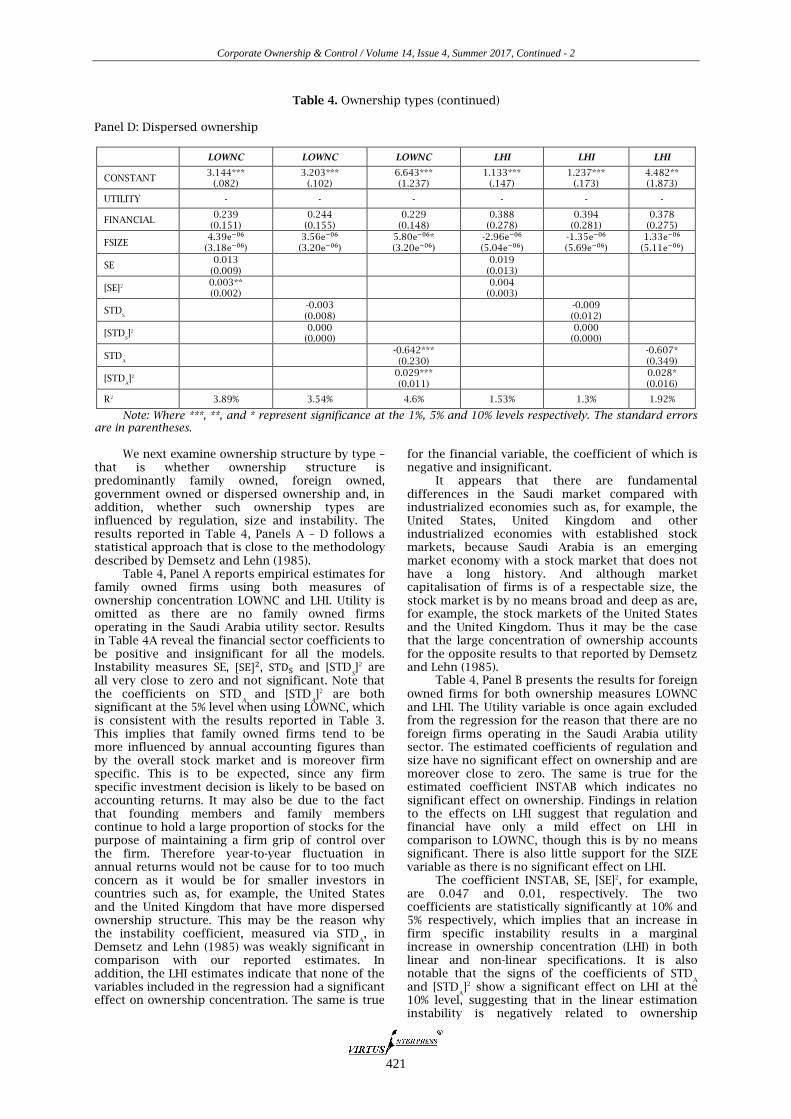
Table 4. Ownership types (continued) Panel D: Dispersed ownership
LOWNC LOWNC LOWNC LHI LHI LHI
CONSTANT 3.144***
(.082) 3.203***
(.102) 6.643*** (1.237)
1.133*** (.147)
1.237*** (.173)
4.482** (1.873)
UTILITY - - - - - -
FINANCIAL 0.239
(0.151) 0.244
(0.155) 0.229
(0.148) 0.388
(0.278) 0.394
(0.281) 0.378
(0.275)
FSIZE 4.39e−06
(3.18e−06) 3.56e−06
(3.20e−06) 5.80e−06* (3.20e−06)
-2.96e−06 (5.04e−06)
-1.35e−06 (5.69e−06)
1.33e−06 (5.11e−06)
SE 0.013
(0.009)
0.019 (0.013)
[SE]2 0.003** (0.002)
0.004
(0.003)
STDS
-0.003 (0.008)
-0.009 (0.012)
[STDS]2
0.000 (0.000)
0.000
(0.000)
STDA
-0.642*** (0.230)
-0.607* (0.349)
[STDA]2
0.029*** (0.011)
0.028* (0.016)
R2 3.89% 3.54% 4.6% 1.53% 1.3% 1.92%
Note: Where ***, **, and * represent significance at the 1%, 5% and 10% levels respectively. The standard errors are in parentheses.
We next examine ownership structure by type –
that is whether ownership structure is predominantly family owned, foreign owned, government owned or dispersed ownership and, in addition, whether such ownership types are influenced by regulation, size and instability. The results reported in Table 4, Panels A – D follows a statistical approach that is close to the methodology described by Demsetz and Lehn (1985).
Table 4, Panel A reports empirical estimates for family owned firms using both measures of ownership concentration LOWNC and LHI. Utility is omitted as there are no family owned firms operating in the Saudi Arabia utility sector. Results in Table 4A reveal the financial sector coefficients to be positive and insignificant for all the models. Instability measures SE, [SE]2, STDS and [STD
S]2 are
all very close to zero and not significant. Note that the coefficients on STD
A and [STD
A]2 are both
significant at the 5% level when using LOWNC, which is consistent with the results reported in Table 3. This implies that family owned firms tend to be more influenced by annual accounting figures than by the overall stock market and is moreover firm specific. This is to be expected, since any firm specific investment decision is likely to be based on accounting returns. It may also be due to the fact that founding members and family members continue to hold a large proportion of stocks for the purpose of maintaining a firm grip of control over the firm. Therefore year-to-year fluctuation in annual returns would not be cause for to too much concern as it would be for smaller investors in countries such as, for example, the United States and the United Kingdom that have more dispersed ownership structure. This may be the reason why the instability coefficient, measured via STD
A, in
Demsetz and Lehn (1985) was weakly significant in comparison with our reported estimates. In addition, the LHI estimates indicate that none of the variables included in the regression had a significant effect on ownership concentration. The same is true
for the financial variable, the coefficient of which is negative and insignificant.
It appears that there are fundamental differences in the Saudi market compared with industrialized economies such as, for example, the United States, United Kingdom and other industrialized economies with established stock markets, because Saudi Arabia is an emerging market economy with a stock market that does not have a long history. And although market capitalisation of firms is of a respectable size, the stock market is by no means broad and deep as are, for example, the stock markets of the United States and the United Kingdom. Thus it may be the case that the large concentration of ownership accounts for the opposite results to that reported by Demsetz and Lehn (1985).
Table 4, Panel B presents the results for foreign owned firms for both ownership measures LOWNC and LHI. The Utility variable is once again excluded from the regression for the reason that there are no foreign firms operating in the Saudi Arabia utility sector. The estimated coefficients of regulation and size have no significant effect on ownership and are moreover close to zero. The same is true for the estimated coefficient INSTAB which indicates no significant effect on ownership. Findings in relation to the effects on LHI suggest that regulation and financial have only a mild effect on LHI in comparison to LOWNC, though this is by no means significant. There is also little support for the SIZE variable as there is no significant effect on LHI.
The coefficient INSTAB, SE, [SE]2, for example, are 0.047 and 0.01, respectively. The two coefficients are statistically significantly at 10% and 5% respectively, which implies that an increase in firm specific instability results in a marginal increase in ownership concentration (LHI) in both linear and non-linear specifications. It is also notable that the signs of the coefficients of STD
A
and [STDA]2 show a significant effect on LHI at the
10% level, suggesting that in the linear estimation instability is negatively related to ownership
Corporate Ownership & Control / Volume 14, Issue 4, Summer 2017, Continued - 2
422
concentration, whereas in the non-linear form there is a positive association with ownership concentration, which suggests that when market instability is heightened ownership concentration increases. The estimated coefficient STD
S and [STD
S]2
indicate no significant effect on LHI. In his study of the degree of ownership concentration of Brazilian quoted firms, Siqueira (1998), for example, included a coefficient dummy “Nation” to ascertain the degree of ownership concentration of foreign firms. The reported findings indicate that subsidiaries of foreign companies displayed a greater degree of ownership concentration than was evidenced for Brazilian firms.
The results for government owned firms are tabulated in Table 4, Panel C. The specific
systematic regulation effects, as represented by the coefficient UTILITY, enter with a positive and significant effect on ownership concentration at the 10% level for both ownership concentration measures. Findings in relation to financial firms indicate a negative insignificant association with concentration, though in the LHI model that incorporates STD
A it is statistically negative and
significant at the 10% level. We should note that the SIZE variable has no significant effect on ownership concentration. In respect of the INSTAB coefficients, these highlight no significant effect on ownership concentration.
The lack of significance in government owned firms in comparison with the other ownership types so far discussed points to other reason why the Saudi government may wish to maintain a large ownership stake and a firm grip of control over those firms. These perhaps might be for strategic reasons, while the RECEIVED wisdom is that government owned companies should function in the interest of Saudi citizens. The latter reason may well explain the significant effect of UTILITY on government ownership concentrations. The R2 here is higher compared to other ownership types and ranges from 22.3% to 24.9%.
Table 4, Panel D displays the results for
dispersed firm ownership – that is, firms with no ownership majority above 20%. Findings in relation to the ownership concentration regression using LOWNC and LHI indicate a positive effect of systematic regulation (FINANCIAL) on the concentration of ownership but is not significant. Additionally, it is worth noting that the SIZE variable has a significant effect on LOWNC in the regression which incorporates STD
A and shows that SIZE can
have a positive, albeit a small effect on the concentration of dispersed ownership.
We find that the coefficient SE in both the LOWNC and LHI regression were insignificant. While in contrast, the coefficient [SE]2 in LOWNC is positive and significant at the 5% level, suggesting that an increase in firm specific instability has only a small but positive effect on ownership concentration. Whereas, the coefficient [SE]2 in LHI is not significant. We should add that the instability coefficients STD
A and [STD
A]2 are also significant.
Turning to the LOWNC regression, the coefficient STD
A has a large and negative effect at the 1% level
in the linear regression suggesting a reduction in ownership concentration. Under the non-linear regression, the coefficient [STD
A]2 is positive and
statistically significant at the 1% level, suggesting
that at higher levels of market instability ownership concentration increases. Similar conclusions are reached for the LHI regression for the coefficients STD
A and [STD
A]2, though only at the 10% level. The
coefficient of STDA is much larger for dispersed
ownership in comparison with the other types of ownerships, followed by family owned firms. We also find that the INSTAB coefficients STD
S and
[STDS]2 are statistically insignificant in both the
LOWNC and LHI regression, which is consistent with the other types of ownership structure. The results here are interpreted as evidence that investors perhaps give more attention not only to firm specific instability, but also to the firm’s annual accounting figures, which is to be expected since investors can exert more pressure on the firm during times of market instability and underperformance. This is in sharp contrast to the findings of Demsetz and Lehn (1985) who report accounting instability to have the least effect on ownership concentration. One reason for our results may be due to the way in which investors in Saudi Arabia view stock market investing which is with much circumspection and thus explain why Saudi investors put more emphasis on accounting figures than on volatile stock market returns.
Finally, we find that the coefficient FINANCIAL is insignificant, for all ownership type which is inconsistent with the findings of Demsetz and Lehn (1985) and would seem to suggest that in the United States markets regulation oversight has the potential effect of limiting control, which is not the case in Saudi Arabia. This is because regulated Saudi firms could benefit from better and improved systems of corporate governance. However, it is also worth noting that dispersed firms are grouped together as there is no single shareholder that holds more than 20% of the equity.
5. CONCLUSION
We study ownership structure by adapting the framework of Demsetz and Lehn (1985) to a sample of firms listed on the Saudi stock market covering the period 2008 to 2014. We are particularly interested in how ownership structure permutated based on the size of the firm, market instability and systematic regulation which hopefully will reveal how far corporate governance structures have permeated the corporate landscape of Saudi Arabia and have created conditions that improved the capabilities inside Saudi listed firms. The results indicate that firm size had a positive effect on Saudi stock market ownership concentration and that instability had the most significant effect on ownership concentration suggesting that volatility in firm returns results in a slight increase in ownership concentration, while under the non-linear regression approach there is an initial negative effect on ownership concentration but at higher levels of instability there is an increase in ownership concentration. This is most apparent when instability is interrogated using accounting profit rates. The results on Instability were obtained using the Herfindahl Index as ownership concentration, though the effect on the SIZE variable was largely insignificant. Systematic regulation, gauged by using FINANCIAL and UTILITY firms as proxies indicate no significant effect on ownership concentration.
Corporate Ownership & Control / Volume 14, Issue 4, Summer 2017, Continued - 2
423
Meanwhile, it was found that the non-linear regression explained ownership concentration much better than the linear specification, while instability in accounting profit rates is found to have greater importance in the ownership held in Saudi listed firms followed by firm specific instability.
Among the main findings of this study are that (a) ownership concentration in Family owned firms were affected only by the instability in annual accounting profit rates; (b) foreign owned firms displayed significant effects of Instability as measured by SE and accounting STD on the HI measure of ownership concentration; (c) dispersed ownership displayed the squared SE and squared accounting STD measures of instability displayed the most significant positive effect on ownership structure. The Accounting STD was significant and showed that measured linearly instability leads to a decrease in ownership concentration. Under non-linearity, higher levels of accounting profit instability led to an increase in ownership concentration. The effect of accounting Instability was greatest for dispersed owned firms than for the other ownership structures included in our sample; (d) firm size was found to affect ownership concentration positively in the regression which analyses the effects of accounting STD; (e) instability measured via stock market STD displayed no significant effect on ownership concentration, as in the remaining results; (f) government owned firms displayed only a significant effect to systematic regulation measured and in the FINANCIAL variable only in the non-linear regression with the accounting STD as the instability, using the HI as the ownership measure. This could be partly influenced by the fact that all utility firms in the sample were government owned firms. The important point here is that no other variables were significant and may suggest that government ownership are beyond the reasons why a normal investor would hold shares – for example wealth maximisation – and that there might be other reasons for the existence of government ownership which may include social, political and national reasons, but not necessarily profit maximisation as their primary goal.
REFERENCES
1. Al-Ghamadi, M., & Rhodes, M. (2005). Family ownership, corporate governance and performance: Evidence from Saudi Arabia, International Journal of Economics and Finance, 7(2), 78-89.
2. Alhumoudi, H. Y. (2016). Corporate governance mechanisms and firms’ performance: An empirical analysis of firms listed on the Saudi stock exchange. International Journal of Accounting and Financial Reporting, 6(2), 101-145. https://doi.org/10.5296/ijafr.v6i2.9192
3. Al-Hussain, A. H., & Johnson, R. L. (2009) Relationship between corporate governance efficiency and Saudi Banks’ performance, The Business Review, Cambridge, 14(1), 111-117.
4. Al-Sahafi, A., Rodrigs, M., & Barnes, L. (2015). Does corporate governance affect financial performance in the banking sector? Evidence from Saudi Arabia. International Journal of Economics, Commerce and Management, 3(3). Retrieved March 8, 2017 from: http://ijecm.co.uk/wp-content/uploads/2015/03/333.pdf
5. Ang, J. S., Cole, R. A., & Wuh Lin, J. (2000). Agency costs and ownership structure. The Journal of Finance, 55(1), 81–106. https://doi.org/10.1111/0022-1082.00201
6. Baek, J., Kang, J., & Park, K. S. (2004). Corporate governance and firm value: evidence from the Korean financial crisis. Journal of Financial Economics, 71(2), 265–313. https://doi.org/10.1016/S0304-405X(03)00167-3
7. Berle, A. A., & Means, G. C. (1932). The Modern Corporation and Private Property. Macmillan: New York.
8. Buallay, A., Hamdan, A., & Zureigat, Q. (2017). Corporate governance and firm performance: evidence from Saudi Arabia. Australasian Accounting, Business and Finance Journal, 11(1), 78-98. https://doi.org/10.14453/aabfj.v11i1.6
9. Cho, M. H. (1998). Ownership structure, investment, and the corporate value: an empirical analysis. Journal of Financial Economics 47, 103-. 121. https://doi.org/10.1016/S0304-405X(97)00039-1
10. Claessens, S., Djankov, S., & Lang, L. (2000). The separation of ownership and control in East Asian corporations. Journal of Financial Economics, 58(1), 81–112. https://doi.org/10.1016/S0304-405X(00)00067-2
11. Claessens, S., & Fan, J. P. H. (2002). Corporate governance in Asia: A survey. International Review of Finance, 3(2), 71-103. https://doi.org/10.1111/1468-2443.00034
12. Cronqvist, H., & Nilsson, M. (2003). Agency cost of controlling minority shareholders. Journal of Financial and Quantitative Analysis, 38(4), 695–719. https://doi.org/10.2307/4126740
13. Demsetz, H. (1983). The structure of ownership and the theory of the firm. Journal of Law and Economics, 26(2), 375-390. https://doi.org/10.1086/467041
14. Demsetz, H., & Lehn, K. (1985). The structure of corporate ownership: Causes and consequences. Journal of Political Economy, 93(6), 1155-1177. https://doi.org/10.1086/261354
15. Demsetz, H., & Villalonga, B. (2001). Ownership structure and corporate performance. Journal of Corporate Finance, 7(3), 209–233. https://doi.org/10.1016/S0929-1199(01)00020-7
16. Denis, D. K., & McConnell, J. J. (2003). International corporate governance. Journal of Financial and Quantitative Analysis, 38(1), 1–36. https://doi.org/10.2307/4126762
17. Eljelly, A. M. A. (2009). Ownership and firm performance: The experience of saudi arabia’s emerging economy. International Business & Economics Research Journal, 8(8), 25-34.
18. Hermalin, B., & Weisbach, M. (1988). The determinants of board composition. RAND Journal of Economics, 19(4), 589-606. https://doi.org/10.2307/2555459
19. Heugens, P. P. M. A. R., Van Essen, M., & Van Oosterhout, J. (2009). Meta-analyzing ownership concentration and firm performance in Asia:
Towards a more fine-grained understanding. Asia
Pacific Journal of Management, 26(3), 481–512. https://doi.org/10.1007/s10490-008-9109-0
20. Jensen, M., & Meckling, W. (1976). Theory of the firm: Managerial behavior, agency costs and ownership structure. Journal of Financial Economics, 3(4), 305–360. https://doi.org/10.1016/0304-405X(76)90026-X
21. La Porta, R., Lopez-de-Silanes, F., & Shleifer, A. (1999). Corporate Ownership around the World. The Journal of Finance, 54(2), 471-517. https://doi.org/10.1111/0022-1082.00115
Corporate Ownership & Control / Volume 14, Issue 4, Summer 2017, Continued - 2
424
22. La Porta, R., Lopez-de-Silanes, F., Shleifer, A., & Vishny, R. (2002). Investor protection and corporate valuation. The Journal of Finance, 57(3), 1147–1170. https://doi.org/10.1111/1540-6261.00457
23. Lemmon, M. L., & Lins, K. V. (2003). Ownership structure, corporate governance, and firm value: Evidence from the East Asian financial crisis. The Journal of Finance, 58(4), 1445-1468. https://doi.org/10.1111/1540-6261.00573
24. Lin, C., Ma, Y., Malatesta, P., & Xuan, Y. (2011). Ownership structure and the cost of corporate borrowing. Journal of Financial Economics, 100(1), 1–23. https://doi.org/10.1016/j.jfineco.2010.10.012
25. Lins, K. V. (2003). Equity ownership and firm value in emerging markets. Journal of Financial and Quantitative Analysis, 38(1), 159–184. https://doi.org/10.2307/4126768
26. McConnell, J. J., & Servaes, H. (1990). Additional evidence on equity ownership and corporate value. Journal of Financial Economics, 27(2), 595-612. https://doi.org/10.1016/0304-405X(90)90069-C
27. Morck, R., Shleifer, A., & Vishny, R. W. (1988), Management ownership and market valuation: An empirical analysis. Journal of Financial Economics, 20, 293–315. https://doi.org/10.1016/0304-405X(88)90048-7
28. Nguyen, T., Locke, S., & Reddy, K. (2015). Ownership concentration and corporate performance from a dynamic perspective: Does national governance quality matter? International Review of Financial Analysis, 41, 148-161. https://doi.org/10.1016/j.irfa.2015.06.005
29. Pedersen, T., & Thomsen, S. (1997). European patterns of corporate ownership; A twelve-country study. Journal of International Business Studies, 28(4), 759-778. https://doi.org/10.1057/palgrave.jibs.8490118
30. Sanchez-Ballesta, J. P., & Garcia-Meca, E. (2007). A meta-analytic vision of the effect of ownership structure on firm performance. Corporate
Governance: An International Review, 15(5), 879–892. https://doi.org/10.1111/j.1467-8683.2007.00604.x
31. Sequeira, T. (1998). Concentration of ownership in Brazilian quoted companies. Revista do BNDES. Rio de Janeiro, 5(10), 37-62. Retrieved December 14, 2016 from: http://www.bndes.gov.br/SiteBNDES/export/sites/default/bndes_en/Galerias/Download/studies/rev103.pdf.
32. Seyhun, N. H. (1992). Why does aggregate insider trading predict future stock return? Quarterly Journal of Economics, 107(4), 1303-1331. https://doi.org/10.2307/2118390
33. Shleifer, A., & Vishny, R. (1997). A survey of corporate governance. The Journal of Finance, 52(2), 737–783. https://doi.org/10.1111/j.1540-6261.1997.tb04820.x
34. Soliman, M. M. (2013). Ownership concentration and firm financial performance. Evidence from Saudi Arabia. Arab Academy for Science Technology and Maritime Transport. Retrieved August 8, 2016 from SSRN: http://ssrn.com/ abstract=2257832.
35. Villalonga, B., & Amit, R. (2006). How do family ownership, control and management affect firm value? Journal of Financial Economics, 80, 385–417. https://doi.org/10.1016/j.jfineco.2004.12.005
36. Weiss, C., & Hilger, S. (2012). Ownership concentration beyond good and evil: is there an effect on corporate performance? Journal of Management & Governance, 16(4), 727-752. Retrieved from Journal of Management & Governance Web Site: http://econpapers.repec. org/article/kapjmgtgv/. https://doi.org/10.1007/s10997-011-9170-9