oxford cambridge and rsa gcse (9–1) combined science a
TRANSCRIPT
Turn over© OCR 2017 Practice paperDC (LEG/CGW) 153152/2
Oxford Cambridge and RSA
GCSE (9–1) Combined Science A(Gateway Science)J250/01/07 BiologyFoundation and Higher Tier
Year 10 TestTime allowed: 1 hour 10 minutes
You must have:• a ruler (cm/mm)
You may use:• a scientific or graphical calculator
OCR is an exempt Charity
INSTRUCTIONS• Use black ink. You may use an HB pencil for graphs and diagrams.• Complete the boxes above with your name, centre number and candidate number.• Answer all the questions.• Write your answer to each question in the space provided.• Additional paper may be used if necessary but you must clearly show your candidate
number, centre number and question number(s).• Do not write in the barcodes.
INFORMATION• The total mark for this paper is 60.• The marks for each question are shown in brackets [ ].• Quality of extended responses will be assessed in the questions marked with an
asterisk (*).• This document consists of 24 pages.
Last name
First name
Candidatenumber
Centrenumber

2
J250/01© OCR 2017 Practice paper
SECTION A – Foundation
Answer all the questions.
1 Which term describes the production of specialised cells?
A cell development
B cell differentiation
C cell division
D cell growth
Your answer [1]
2 A student investigates a factor that affects how well plants make starch.
The diagram shows her apparatus.
blackpaper
Which factor is being investigated?
A carbon dioxide
B chlorophyll
C light
D water
Your answer [1]

3
J250/01 Turn over© OCR 2017 Practice paper
3 The photograph shows a part of a root tip with root hairs.
The table shows information about this root and its root hairs.
Surface area (cm2)
Root only Root with root hairs
6 24
Which statement is true?
A The root hairs increase the surface area by 4 times.
B The total surface area of the root and root hairs is 30 cm2.
C The root hairs increase the surface area by 18 times.
D The total surface area of the root and root hairs is 144 cm2.
Your answer [1]

4
J250/01© OCR 2017 Practice paper
4 A student uses a potometer to estimate the water loss from a leafy shoot.
thin tubecontainingwater
9
8
7
6
5
4
Which change would increase water loss?
A Make the air more humid.
B Make the room colder.
C Point a fan at the plant.
D Turn the lights off.
Your answer [1]

5
J250/01 Turn over© OCR 2017 Practice paper
5 The lock and key hypothesis describes how enzymes work.
Look at the diagram.
enzyme
substrate products
Which row correctly describes the lock and the key hypothesis?
Lock Key
A substrate enzyme
B enzyme substrate
C product substrate
D product enzyme
Your answer [1]

6
J250/01© OCR 2017 Practice paper
SECTION B – Foundation
Answer all the questions.
6 Catalase is an enzyme that breaks down hydrogen peroxide.
The amount of oxygen released can be used to measure how fast the catalase is working.
A student investigates if catalase works faster at 30 °C or 40 °C.
She counts the number of bubbles of oxygen released in one minute.
The diagram shows the apparatus.
bubbles of oxygen
water
hydrogen peroxide and catalase
(a) How can the student keep the flask at a constant temperature?
...................................................................................................................................................
.............................................................................................................................................. [1]

7
J250/01 Turn over© OCR 2017 Practice paper
(b) The student writes down her results for 40 °C in her notebook.
⁄First Countǀ ǀ ǀ ǀ⁄ ǀ ǀ ǀ ǀ⁄ ǀ ǀ ǀ ǀ
Second Countǀ ǀ ǀ ǀ ǀ ǀ⁄——————————————————————
RESULTS AT 40°C
Complete the table to show the results for 40 °C.
Number of bubbles (per minute)
Temperature(°C) First count Second count Mean
30 °C 14 16 15
40 °C .......... .......... .......... [2]
(c) The student takes another reading at both temperatures.
This will improve her investigation.
Explain why.
...................................................................................................................................................
...................................................................................................................................................
.............................................................................................................................................. [2]

8
J250/01© OCR 2017 Practice paper
7 The diagram shows the human circulatory system.
lungs
X
rest of body
ZW
Y
(a) (i) Which type of blood vessel are X and Y?
...................................................................................................................................... [1]
(ii) Y contains blood with the highest pressure.
Explain why this higher pressure is needed.
...........................................................................................................................................
...........................................................................................................................................
...................................................................................................................................... [1]
(b) Compare the role of the structures W and Z.
...................................................................................................................................................
...................................................................................................................................................
.............................................................................................................................................. [2]

9
J250/01 Turn over© OCR 2017 Practice paper
(c) A rugby team travel around South Africa completing training.
All of the places they train at are above sea level.
The team doctor measures the number of red blood cells in the blood of the players after they have trained in each place.
The table shows the results.
Place in South Africa
Height above sea level(m)
Number of red blood cells(per mm3 of blood)
Beaufort West 800 5.4
Durban 10 5.0
Johannesburg 1700 6.1
Pretoria 1300 5.7
(i) Describe the relationship between the height above sea level and the number of red blood cells.
...........................................................................................................................................
...................................................................................................................................... [1]
(ii) As the height above sea level increases, the amount of oxygen in the air decreases.
High altitude training gives the rugby players an advantage when they return and play at lower altitudes.
Use ideas about red blood cells to explain why.
...........................................................................................................................................
...........................................................................................................................................
...........................................................................................................................................
...................................................................................................................................... [2]

10
J250/01© OCR 2017 Practice paper
8 A student sets up an experiment using gelatine blocks.
He cuts out three different sized blocks of gelatine.
10 mm
block A block B block C
10 mm
10 mm
20 mm
20 mm
2.5 mm10 mm
5 mm
20 mm
The gelatine is dyed red.
The dye turns yellow when it reacts with dilute acid.
The student puts the blocks into beakers of dilute hydrochloric acid and times how long it takes each block to turn completely yellow.
(a) Look at the results table.
Block Surface area(mm2)
Volume(mm3)
Time taken for block to turn yellow(minutes)
A .................. ............. 12
B 700 1000 8
C 1000 1000 5
(i) Calculate the surface area and volume for block A.
Write your answers in the table. [2]

11
J250/01 Turn over© OCR 2017 Practice paper
(ii)* Explain the student’s results.
Use ideas about
• how the acid moves into the gelatine block
• surface area to volume ratio
...........................................................................................................................................
...........................................................................................................................................
...........................................................................................................................................
...........................................................................................................................................
...........................................................................................................................................
...........................................................................................................................................
...........................................................................................................................................
...........................................................................................................................................
...........................................................................................................................................
...........................................................................................................................................
...........................................................................................................................................
...................................................................................................................................... [6]
(b) The student must control different variables to get valid results.
Write down one variable that must be controlled and explain the effect of that variable on the experiment.
variable to control ......................................................................................................................
explanation ................................................................................................................................
.............................................................................................................................................. [2]

12
J250/01© OCR 2017 Practice paper
9 Look at the information in the table about different methods of contraception.
It shows how effective they are in preventing pregnancy.
Method of contraception Effectiveness(%)
combined pill >99.0
diaphragm 92.0 – 96.0
male condom 98.0
tying oviducts (fallopian tubes) >99.0
cutting sperm ducts (vasectomy) >99.0
(a) Which method in the table uses hormones?
.............................................................................................................................................. [1]
(b) Which method in the table helps protect against sexually transmitted diseases?
.............................................................................................................................................. [1]
(c) Which is the most effective, easily reversible method of contraception?
Use information from the table.
.............................................................................................................................................. [1]

13
J250/01 Turn over© OCR 2017 Practice paper
SECTION C – Higher
Answer all the questions.
10 Which of these structures can be found in both eukaryotic and prokaryotic cells?
A cell wall
B chloroplast
C mitochondrion
D nucleus
Your answer [1]
11 Look at these stages of the cell cycle.
1. cell divides
2. chromosomes line up at centre of cell
3. chromosomes separate
4. DNA replicates
Which is a correct order of these stages during the cell cycle?
A 1 2 3 4
B 4 2 3 1
C 1 4 3 2
D 4 3 1 2
Your answer [1]

14
J250/01© OCR 2017 Practice paper
12 The diagram shows part of a reflex arc.
X
The part labelled X becomes damaged.
Which other part of the reflex arc would not be able to do its job?
A brain
B motor neurone
C sensory neurone
D sensory receptor
Your answer [1]
13 A farmer uses a pesticide to kill insects on his crops.
The pesticide stops the production of ATP inside the insect’s cells.
This will stop one process inside the cells working.
Which one?
A active transport
B evaporation
C diffusion
D osmosis
Your answer [1]

15
J250/01 Turn over© OCR 2017 Practice paper
14 A light microscope has a resolution of 2 × 10⁻⁷ m.
An electron microscope has a resolution of 1 × 10⁻⁹ m.
The resolution is defined as the smallest distance between two points that can be seen as separate points.
How many times smaller is this distance for the electron microscope compared to the light microscope?
A 1.95 × 10⁻⁷
B 0.025
C 200
D 60
Your answer [1]

16
J250/01© OCR 2017 Practice paper
SECTION D – Higher
Answer all the questions.
15 Look at the images of a muscle cell and a mitochondrion.
P
Qmuscle cell
mitochondrionNot to scale
(a) The width PQ on the muscle cell image is 15 mm.
The actual width of this muscle cell is 0.015 mm.
Calculate the magnification of the image.
answer: ................................................... × [1]

17
J250/01 Turn over© OCR 2017 Practice paper
(b) The table shows features of two types of microscope.
Feature Light microscope Electron microscope
magnification ×1500 ×500 000
resolution 0.2 µm 0.001 µm
sample materials living or dead dead
(i) A scientist wants to observe the contraction of muscle cells using a microscope.
Which microscope from the table would be the best one to use?
Explain your answer.
...........................................................................................................................................
...................................................................................................................................... [1]
(ii) The width of a membrane inside a mitochondrion is 0.007 µm.
A scientist wants to observe the membranes inside a mitochondrion.
Which microscope from the table would be the best one to use?
Explain your answer.
...........................................................................................................................................
...................................................................................................................................... [1]
(c) Muscle cells contain more mitochondria than most other types of cells.
Explain why muscle cells need more mitochondria.
...................................................................................................................................................
...................................................................................................................................................
.............................................................................................................................................. [2]

18
J250/01© OCR 2017 Practice paper
16 This question is about the control of blood glucose levels in the body.
(a) The control of blood glucose levels is an example of homeostasis.
What is homeostasis?
...................................................................................................................................................
.............................................................................................................................................. [1]
(b) Look at the graph.
The graph shows blood glucose levels after eating a meal.
0 15060708090
100110blood glucose
level(mg per 100 ml)
120130140150
2 3
time (hours)
4 5
A
B
D
C
(i) Use the graph to state the normal level of glucose in the blood.
...................................................................................................................................... [1]
(ii) The point labelled A on the graph is when a meal was eaten.
The body uses two hormones to control blood glucose levels.
Write about these two hormones to explain the changes seen at points B, C and D.
...........................................................................................................................................
...........................................................................................................................................
...........................................................................................................................................
...........................................................................................................................................
...................................................................................................................................... [4]
19
J250/01 Turn over© OCR 2017 Practice paper
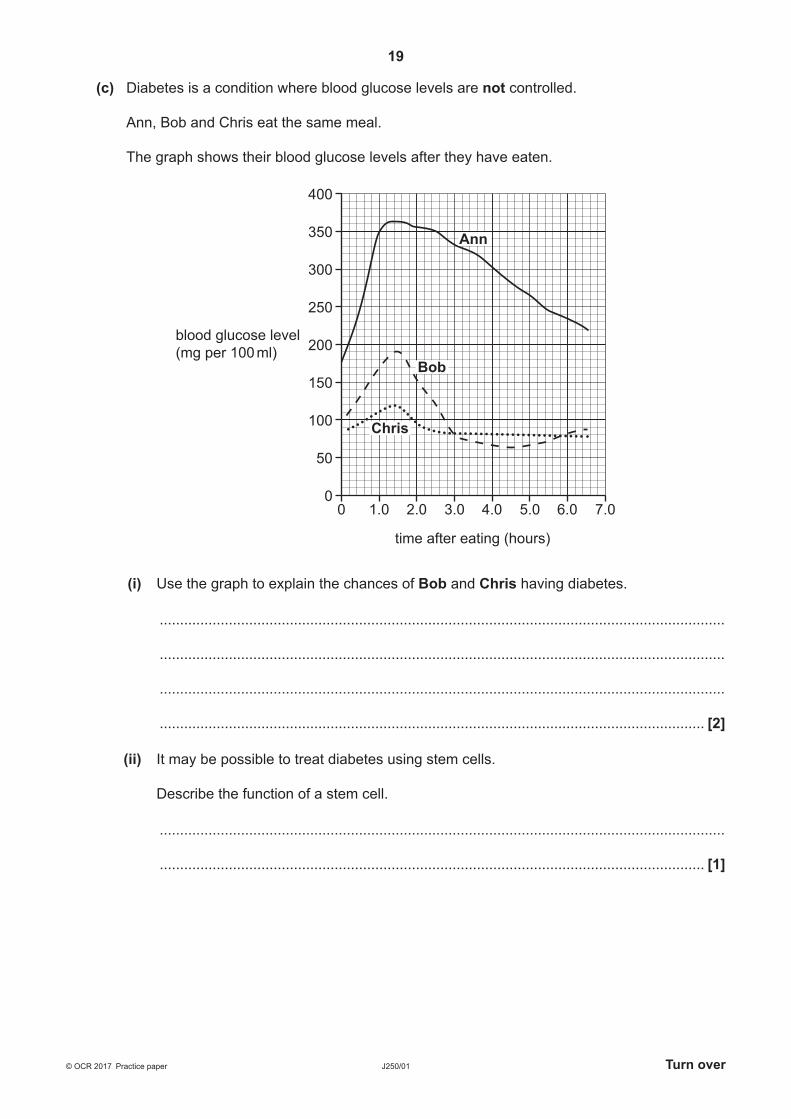
(c) Diabetes is a condition where blood glucose levels are not controlled.
Ann, Bob and Chris eat the same meal.
The graph shows their blood glucose levels after they have eaten.
0 1.0 3.0 5.0 7.02.0
50
0
100
150
200
250
300
350
400
blood glucose level(mg per 100 ml)
4.0 6.0
time after eating (hours)
Ann
Bob
Chris
(i) Use the graph to explain the chances of Bob and Chris having diabetes.
...........................................................................................................................................
...........................................................................................................................................
...........................................................................................................................................
...................................................................................................................................... [2]
(ii) It may be possible to treat diabetes using stem cells.
Describe the function of a stem cell.
...........................................................................................................................................
...................................................................................................................................... [1]

20
J250/01© OCR 2017 Practice paper
17 (a) Ali investigates the effect of light intensity on photosynthesis in plants.
The diagram shows her investigation.
40
50
60
70
80
30
20
10
0
movablelamp
gas collectshere
test-tube
pond plant
syringe
scaleim mm
air bubble in thintube pusheddown as gascollects intest-tube
• Ali puts the pond plant 0.1 m from a bright lamp
• She records the time it takes the bubble to move 10 mm
• Ali repeats her investigation with the lamp at different distances.

21
J250/01 Turn over© OCR 2017 Practice paper
Table 17.1 shows her results.
Table 17.1
Distance of pond plant from light source
(m)
Time for bubble to move 10 mm(seconds)
Trial 1 Trial 2 Trial 3 Mean
0.1 177 175 174 175.3
0.2 182 178 177 179.0
0.3 211 187 208 202.0
0.4 235 243 239 239.0
0.5 274 268 270 270.7
(i) Which distance has an anomalous result for Trial 2?
...................................................................................................................................... [1]
(ii) How should anomalous results be treated when processing data?
...................................................................................................................................... [1]
(iii) Suggest one way Ali could improve her method.
...........................................................................................................................................
...................................................................................................................................... [1]

22
J250/01© OCR 2017 Practice paper
(b) Ali uses her means to calculate the rate of photosynthesis.
Table 17.2 shows Ali’s calculations.
Table 17.2
Distance of pond plant from light source
(m)Relative light
intensityRate of
photosynthesis (s–1)
0.1 100.0 0.0057
0.2 25.0 0.0056
0.3 11.1 0.0050
0.4 ............... 0.0042
0.5 4.0 0.0037
(i) Use the inverse square law to calculate the relative light intensity for 0.4 m.
Show your working.
answer: ........................................... [2]

23
J250/01© OCR 2017 Practice paper
(ii)* Read this statement.
The rate of photosynthesis is proportional to the relative light intensity.
Analyse Ali’s results in Table 17.2. Discuss how well they match this statement and account for any differences.
...........................................................................................................................................
...........................................................................................................................................
...........................................................................................................................................
...........................................................................................................................................
...........................................................................................................................................
...........................................................................................................................................
...........................................................................................................................................
...........................................................................................................................................
...........................................................................................................................................
...........................................................................................................................................
...........................................................................................................................................
...........................................................................................................................................
...........................................................................................................................................
...........................................................................................................................................
...................................................................................................................................... [6]

24
J250/01© OCR 2017 Practice paper
Oxford Cambridge and RSA
Copyright Information
OCR is committed to seeking permission to reproduce all third-party content that it uses in its assessment materials. OCR has attempted to identify and contact all copyright holders whose work is used in this paper. To avoid the issue of disclosure of answer-related information to candidates, all copyright acknowledgements are reproduced in the OCR Copyright Acknowledgements Booklet. This is produced for each series of examinations and is freely available to download from our public website (www.ocr.org.uk) after the live examination series.
If OCR has unwittingly failed to correctly acknowledge or clear any third-party content in this assessment material, OCR will be happy to correct its mistake at the earliest possible opportunity.
For queries or further information please contact the Copyright Team, First Floor, 9 Hills Road, Cambridge CB2 1GE.
OCR is part of the Cambridge Assessment Group; Cambridge Assessment is the brand name of University of Cambridge Local Examinations Syndicate (UCLES), which is itself a department of the University of Cambridge.