oxford cambridge and rsa t a - ocr.org.uk
TRANSCRIPT
Oxford Cambridge and RSA
Thursday 23 May 2019 – AfternoonLEVEL 3 CAMBRIDGE TECHNICAL IN APPLIED SCIENCE05848/05849/05874 Unit 3: Scientific analysis and reporting
Time allowed: 2 hoursC342/1906
You must have:• a ruler
You may use:• a scientific or graphical calculator
Candidate number
First name(s)
Last name
Please write clearly in black ink.
Centre number
Date of Birth
INSTRUCTIONS• Use black ink. • Answer all the questions.• If additional answer space is required, you should use the lined page(s) at the end of this booklet.
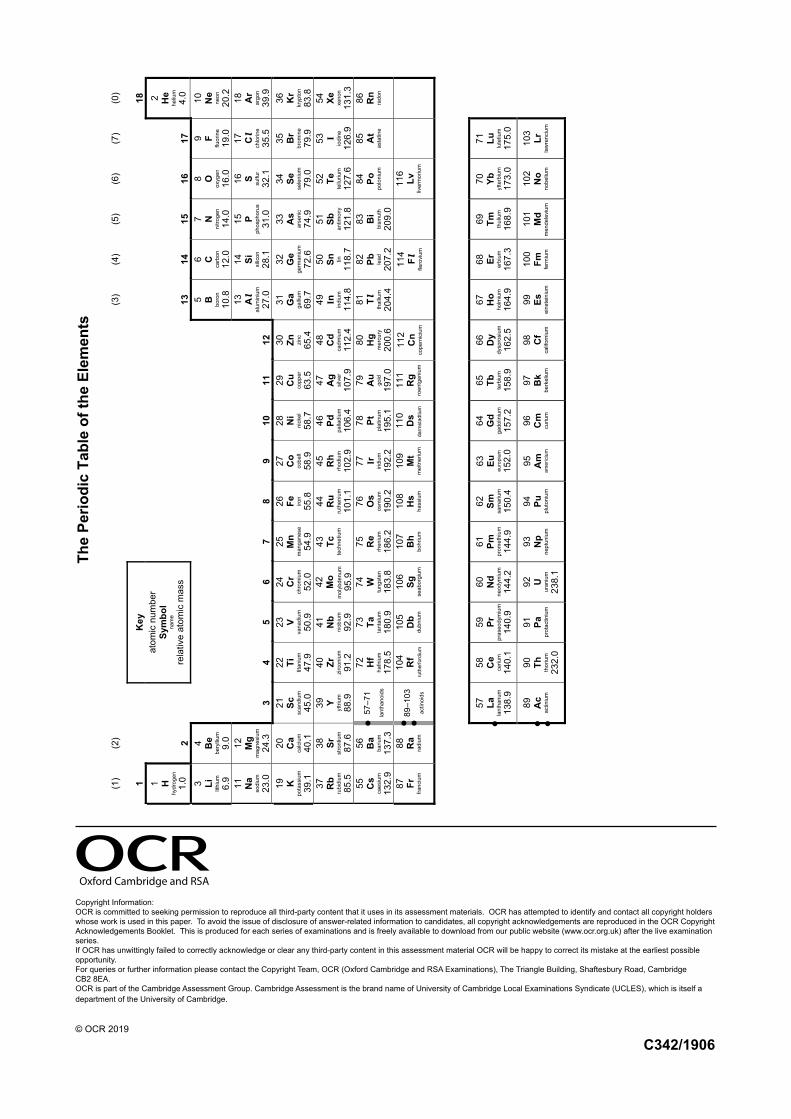
The question number(s) must be clearly shown.• The Periodic Table is printed on the back page.
INFORMATION• The total mark for this paper is 100.• The marks for each question are shown in brackets [ ].• This document consists of 24 pages.
© OCR 2019 [Y/507/6150]
C342/1906/8 OCR is an exempt Charity Turn over
C342--1906
FOR EXAMINER USE ONLY
Question No Mark
1 /162 /123 /164 /155 /136 /107 /18
Total 100
2
© OCR 2019
Answer all the questions.
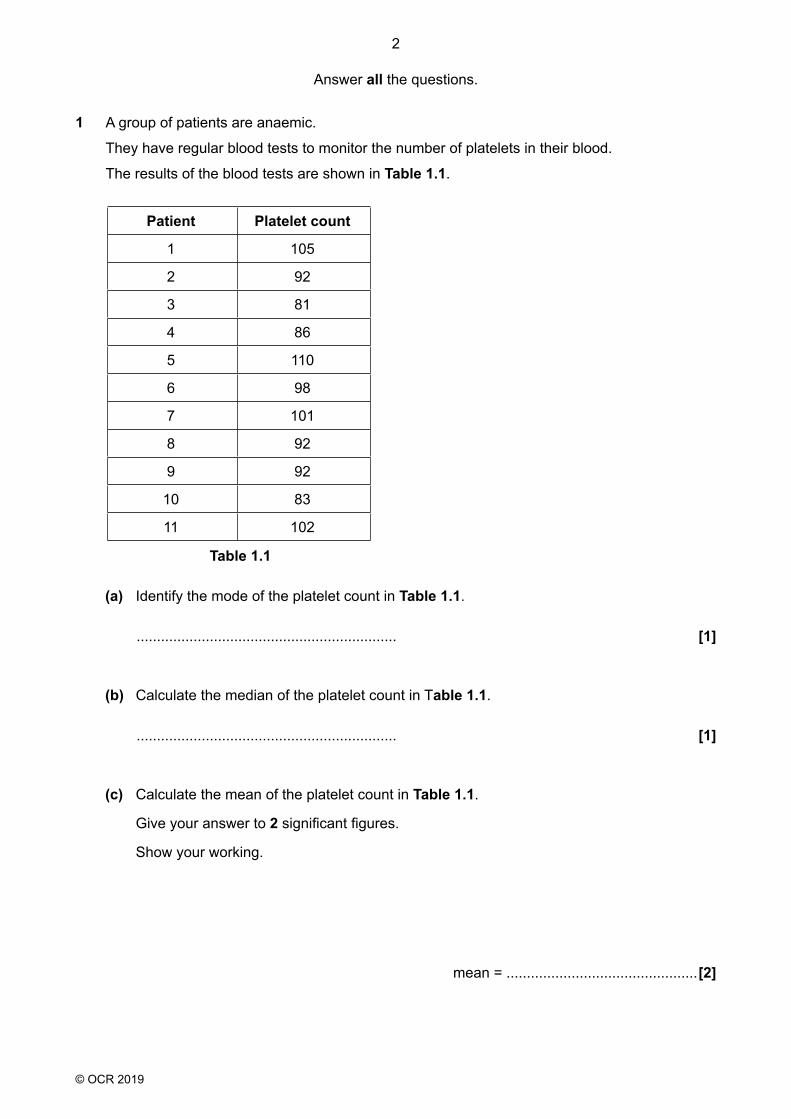
1 A group of patients are anaemic.
They have regular blood tests to monitor the number of platelets in their blood.
The results of the blood tests are shown in Table 1.1.
Patient Platelet count
1 105
2 92
3 81
4 86
5 110
6 98
7 101
8 92
9 92
10 83
11 102
Table 1.1
(a) Identify the mode of the platelet count in Table 1.1.
................................................................ [1]
(b) Calculate the median of the platelet count in Table 1.1.
................................................................ [1]
(c) Calculate the mean of the platelet count in Table 1.1.
Give your answer to 2 significant figures.
Show your working.
mean = ...............................................[2]
© OCR 2019 Turn over
3
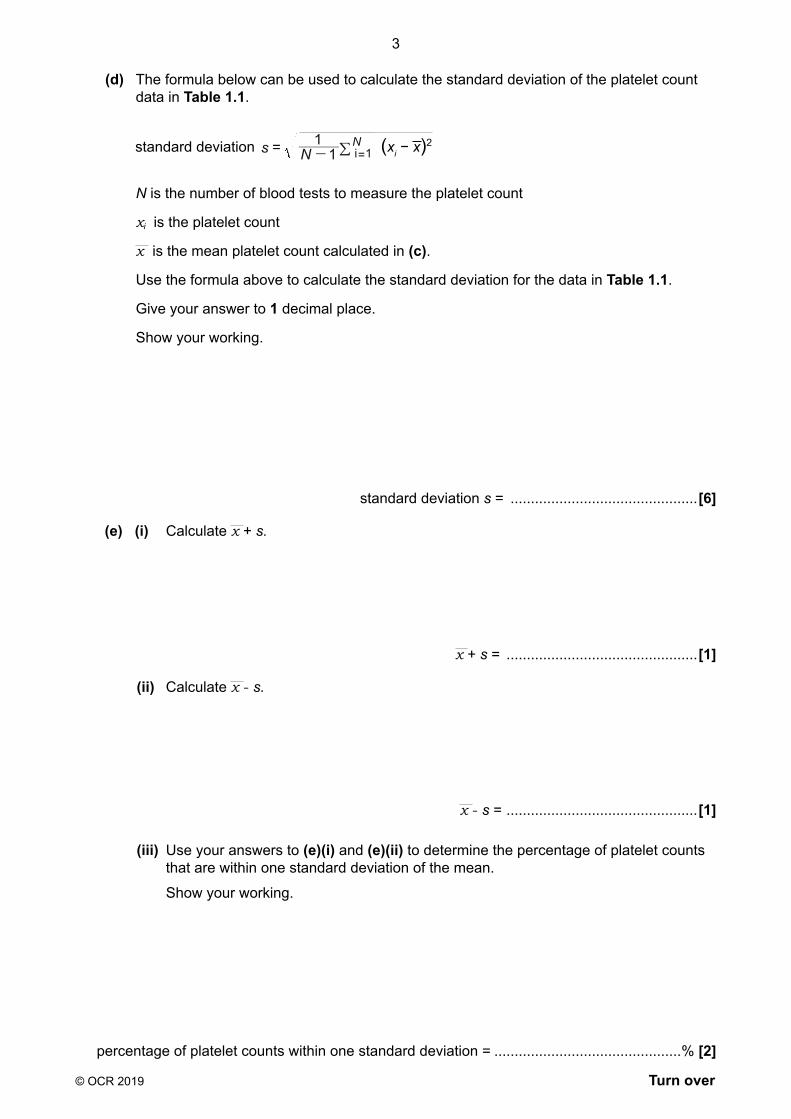
(d) The formula below can be used to calculate the standard deviation of the platelet count data in Table 1.1.
standard deviation /11s N i 1
N= - = (xi − x)2
N is the number of blood tests to measure the platelet count
xi is the platelet count
x is the mean platelet count calculated in (c).
Use the formula above to calculate the standard deviation for the data in Table 1.1.
Give your answer to 1 decimal place.
Show your working.
standard deviation s = ..............................................[6]
(e) (i) Calculate x + s.
x + s = ...............................................[1]
(ii) Calculate x - s.
x - s = ...............................................[1]
(iii) Use your answers to (e)(i) and (e)(ii) to determine the percentage of platelet counts that are within one standard deviation of the mean.
Show your working.
percentage of platelet counts within one standard deviation = ..............................................% [2]
4
© OCR 2019
(f) The platelet count in Table 1.1 is in an abbreviated form.
• A true platelet count is the number of platelets per microlitre of blood.
• A normal platelet count is 300 000 platelets per microlitre of blood.
Calculate the number of platelets in one litre of normal blood.
1 microlitre = 0.000001 litres
Give your answer in standard form.
number of platelets in one litre of normal blood = .......... .....................................[2]

© OCR 2019 Turn over
5
PLEASE DO NOT WRITE ON THIS PAGE
BLANK PAGE
6
© OCR 2019
2 The concentration of sugar in the leaves of cereal plants varies with the time of day.
Table 2.1 shows results from an experiment analysing sugar concentration in leaves.
Time of day (h) 04:00 08:00 12:00 16:00 20:00
Sugar concentration (percentage of dry leaf mass)
0.44 0.70 1.75 2.00 1.40
Table 2.1
(a) Plot a graph of the results in Table 2.1 and draw a curve of best fit.
[4]
© OCR 2019 Turn over
7
(b) Use your graph to estimate the sugar concentration at 10:00.
sugar concentration = ............................................... percentage of dry leaf mass [1]
(c) Use your graph to predict the sugar concentration at 22:00.
sugar concentration = ............................................... percentage of dry leaf mass [1]
(d) (i) Calculate the gradient of the graph at 08:00.
Give the units.
Show your working.
gradient = ....................... units = ........................ [4]
(ii) Describe how the gradient of the graph changes between 04:00 and 10:00.
......................................................................................................................................
..................................................................................................................................[1]
(iii) Describe how the gradient of the graph changes between 12:00 and 16:00.
......................................................................................................................................
..................................................................................................................................[1]
8
© OCR 2019
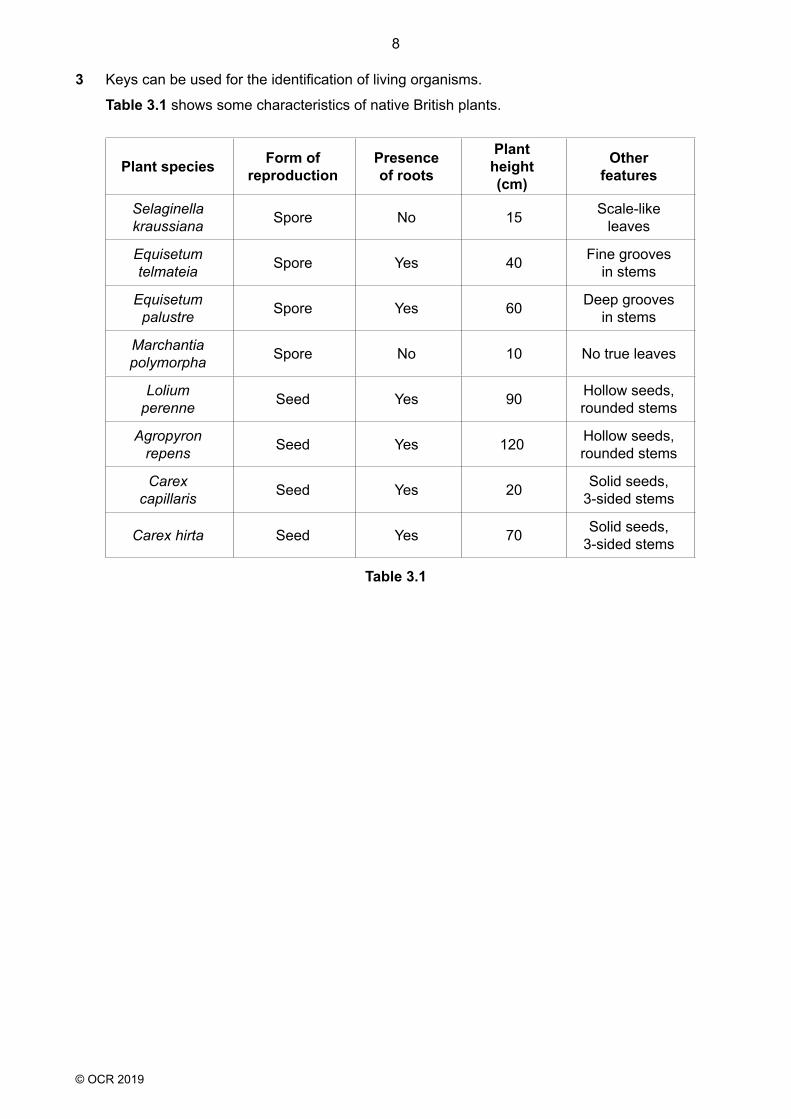
3 Keys can be used for the identification of living organisms.
Table 3.1 shows some characteristics of native British plants.
Plant species Form of reproduction
Presence of roots
Plant height (cm)
Other features
Selaginella kraussiana Spore No 15 Scale-like
leaves
Equisetum telmateia Spore Yes 40 Fine grooves
in stems
Equisetum palustre Spore Yes 60 Deep grooves
in stems
Marchantia polymorpha Spore No 10 No true leaves
Lolium perenne Seed Yes 90 Hollow seeds,
rounded stems
Agropyron repens Seed Yes 120 Hollow seeds,
rounded stems
Carex capillaris Seed Yes 20 Solid seeds,
3-sided stems
Carex hirta Seed Yes 70 Solid seeds, 3-sided stems
Table 3.1
© OCR 2019 Turn over
9
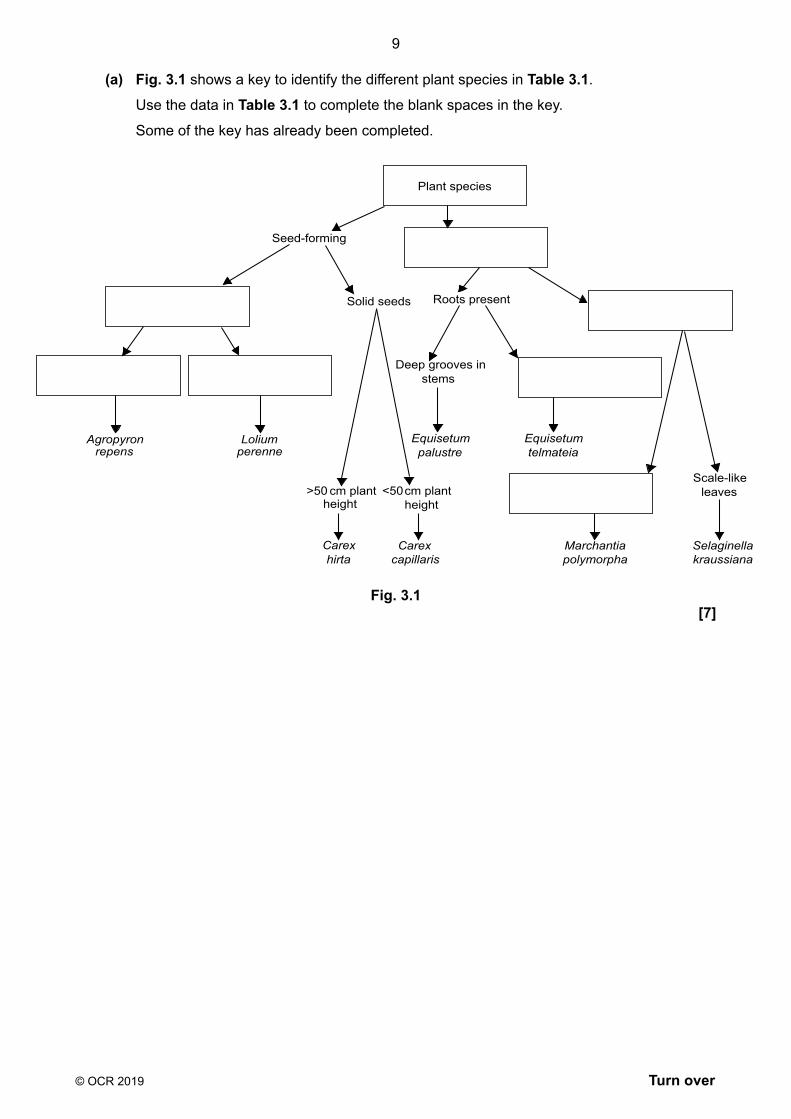
(a) Fig. 3.1 shows a key to identify the different plant species in Table 3.1.
Use the data in Table 3.1 to complete the blank spaces in the key.
Some of the key has already been completed.
Seed-forming
Roots present
Deep grooves in stems
Solid seeds
Plant species
>50 cm plant height
<50 cm plant height
Lolium perenne
Carex hirta
Carex capillaris
Agropyron repens
Scale-like leaves
Equisetum telmateia
Equisetum palustre
Marchantia polymorpha
Selaginella kraussiana
Fig. 3.1[7]
10
© OCR 2019
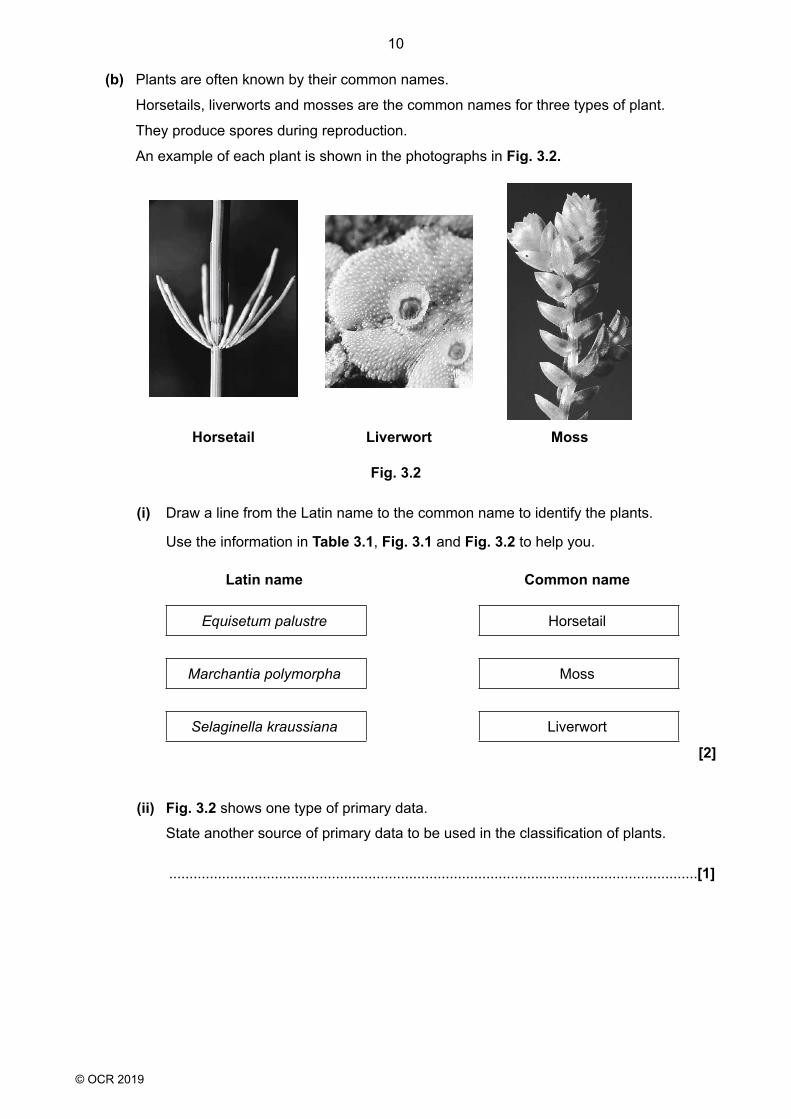
(b) Plants are often known by their common names.
Horsetails, liverworts and mosses are the common names for three types of plant.
They produce spores during reproduction.
An example of each plant is shown in the photographs in Fig. 3.2.
Horsetail Liverwort Moss
Fig. 3.2
(i) Draw a line from the Latin name to the common name to identify the plants.
Use the information in Table 3.1, Fig. 3.1 and Fig. 3.2 to help you.
Latin name Common name
Equisetum palustre Horsetail
Marchantia polymorpha Moss
Selaginella kraussiana Liverwort
[2]
(ii) Fig. 3.2 shows one type of primary data.
State another source of primary data to be used in the classification of plants.
..................................................................................................................................[1]

© OCR 2019 Turn over
11
(c) (i) Define the term binomial nomenclature.
......................................................................................................................................
......................................................................................................................................
..................................................................................................................................[2]
(ii) Suggest why binomial nomenclature is used in the classification of plants.
......................................................................................................................................
......................................................................................................................................
......................................................................................................................................
......................................................................................................................................
......................................................................................................................................
......................................................................................................................................
......................................................................................................................................
..................................................................................................................................[4]

12
© OCR 2019
4 Beth is investigating the time period for a simple pendulum (Fig. 4.1) to swing from left to right.
pendulum bobpendulum stand
Fig. 4.1
She records the time taken for the heavy pendulum bob to swing from a set point.
She repeats the swing four times for each of four experiments, A, B, C and D.
The results of her four experiments are shown in Table 4.1.
Experiment
Time period (s) for a simple pendulum
Repeat
1 2 3 4
A 48.5 53.0 49.5 51.0
B 45.6 47.0 45.0 46.5
C 45.5 46.2 54.5 48.5
D 50.5 51.0 50.0 49.5
Table 4.1
(a) The true value of the period of the pendulum is 50.5 s.
(i) Which experiment, A, B, C or D, is precise and accurate?
.......................................... [1]
(ii) Which experiment, A, B, C or D, is precise but not accurate?
.......................................... [1]
(iii) Which experiment, A, B, C or D, is accurate but not precise?
.......................................... [1]
(iv) Which experiment, A, B, C or D, is not precise or accurate?
.......................................... [1]
© OCR 2019 Turn over
13
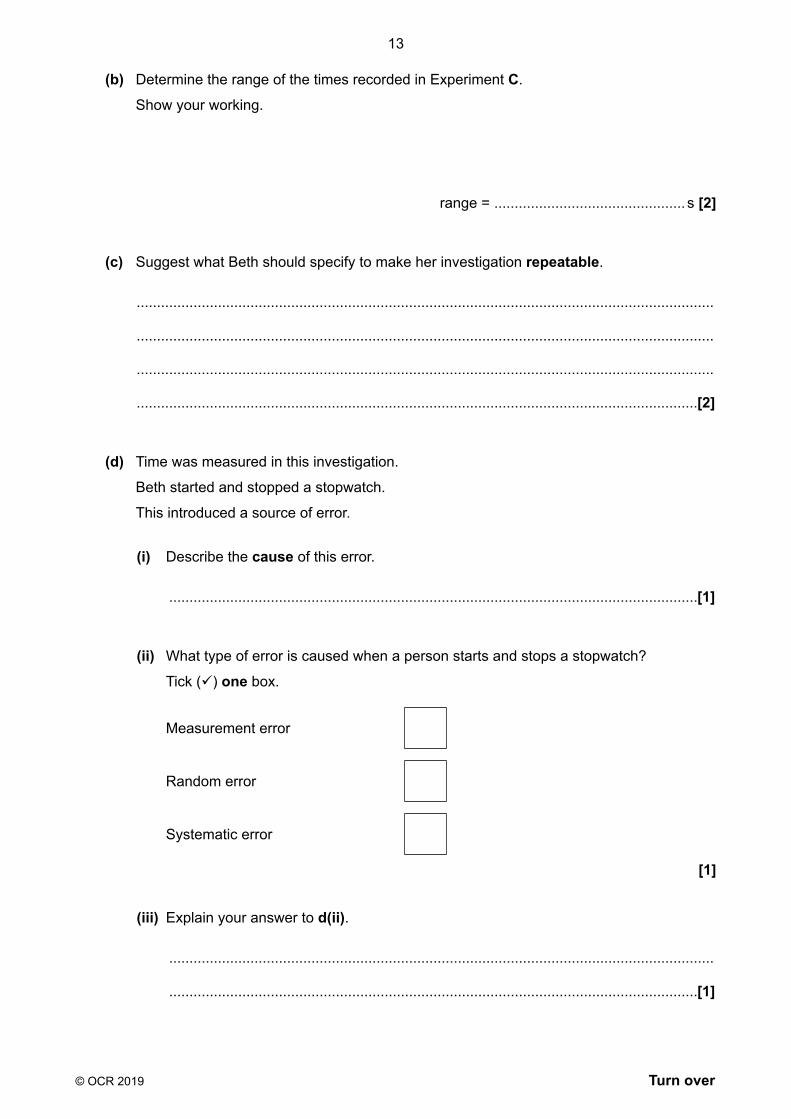
(b) Determine the range of the times recorded in Experiment C.
Show your working.
range = ............................................... s [2]
(c) Suggest what Beth should specify to make her investigation repeatable.
..............................................................................................................................................
..............................................................................................................................................
..............................................................................................................................................
..........................................................................................................................................[2]
(d) Time was measured in this investigation.
Beth started and stopped a stopwatch.
This introduced a source of error.
(i) Describe the cause of this error.
..................................................................................................................................[1]
(ii) What type of error is caused when a person starts and stops a stopwatch?
Tick () one box.
Measurement error
Random error
Systematic error
[1]
(iii) Explain your answer to d(ii).
......................................................................................................................................
..................................................................................................................................[1]
14
© OCR 2019
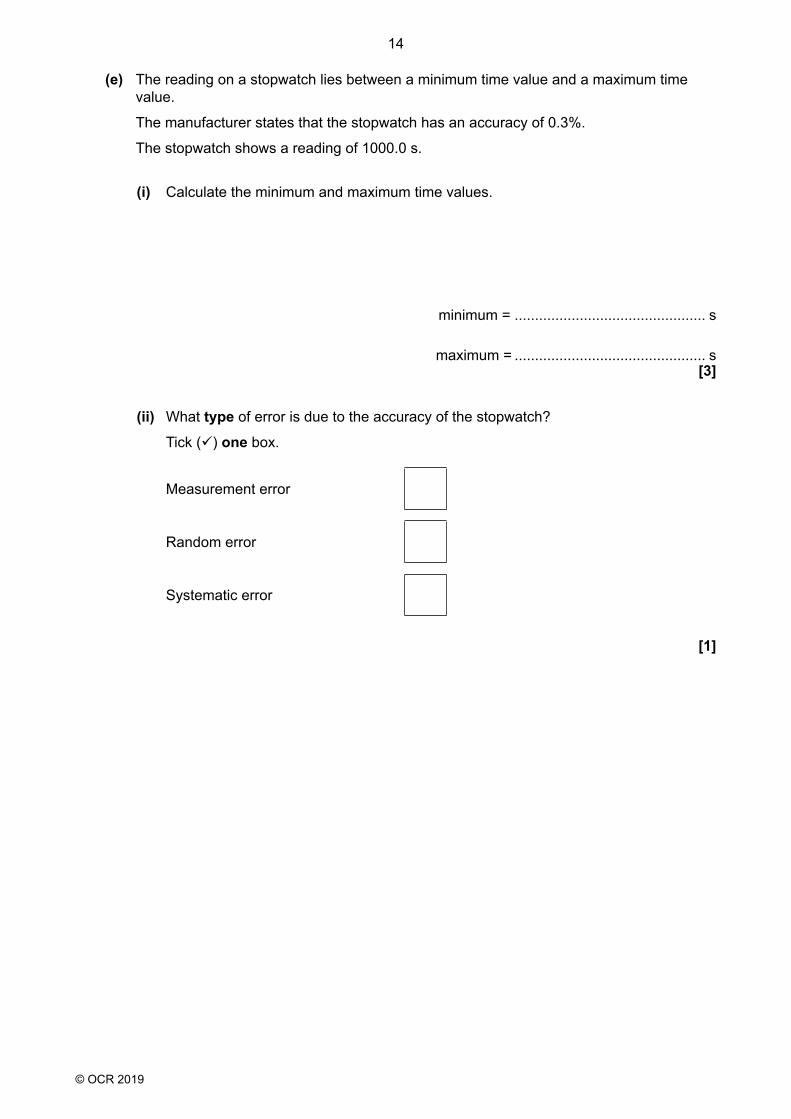
(e) The reading on a stopwatch lies between a minimum time value and a maximum time value.
The manufacturer states that the stopwatch has an accuracy of 0.3%.
The stopwatch shows a reading of 1000.0 s.
(i) Calculate the minimum and maximum time values.
minimum = ............................................... s
maximum = ............................................... s[3]
(ii) What type of error is due to the accuracy of the stopwatch?
Tick () one box.
Measurement error
Random error
Systematic error
[1]
© OCR 2019 Turn over
15
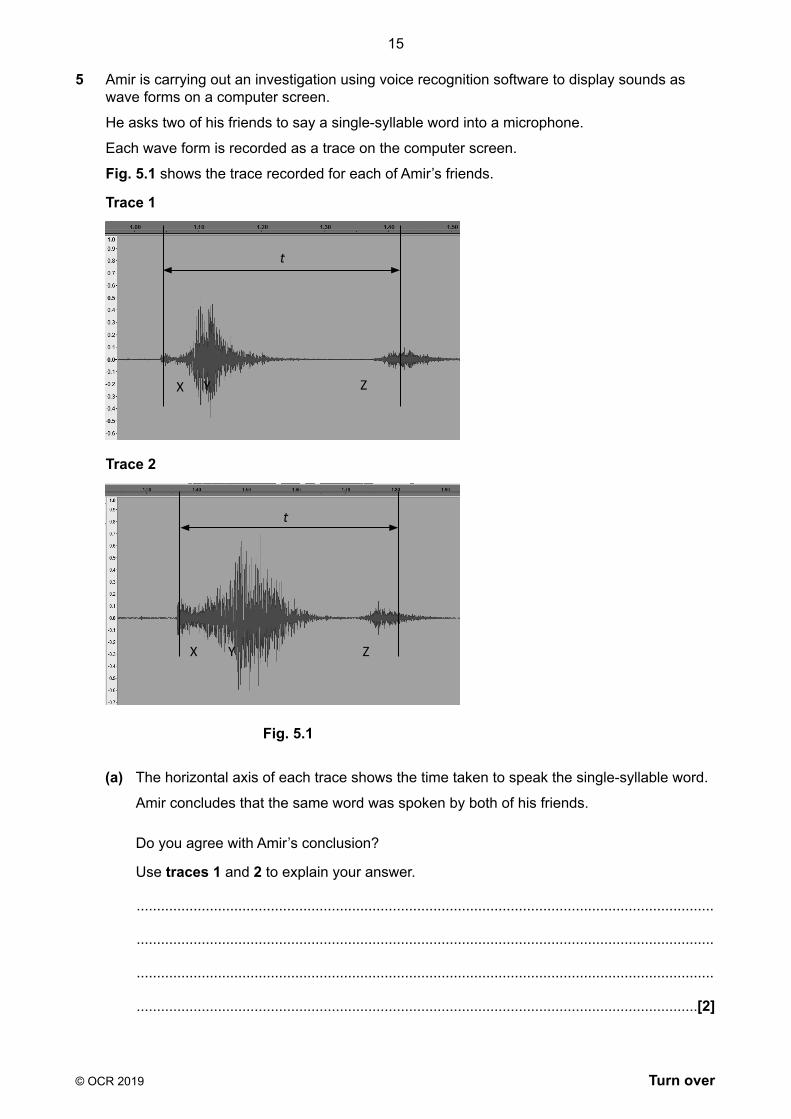
5 Amir is carrying out an investigation using voice recognition software to display sounds as wave forms on a computer screen.
He asks two of his friends to say a single-syllable word into a microphone.
Each wave form is recorded as a trace on the computer screen.
Fig. 5.1 shows the trace recorded for each of Amir’s friends.
Trace 1
Trace 2
Fig. 5.1
(a) The horizontal axis of each trace shows the time taken to speak the single-syllable word.
Amir concludes that the same word was spoken by both of his friends.
Do you agree with Amir’s conclusion?
Use traces 1 and 2 to explain your answer.
..............................................................................................................................................
..............................................................................................................................................
..............................................................................................................................................
..........................................................................................................................................[2]
t
X Y Z
t
X ZY
16
© OCR 2019
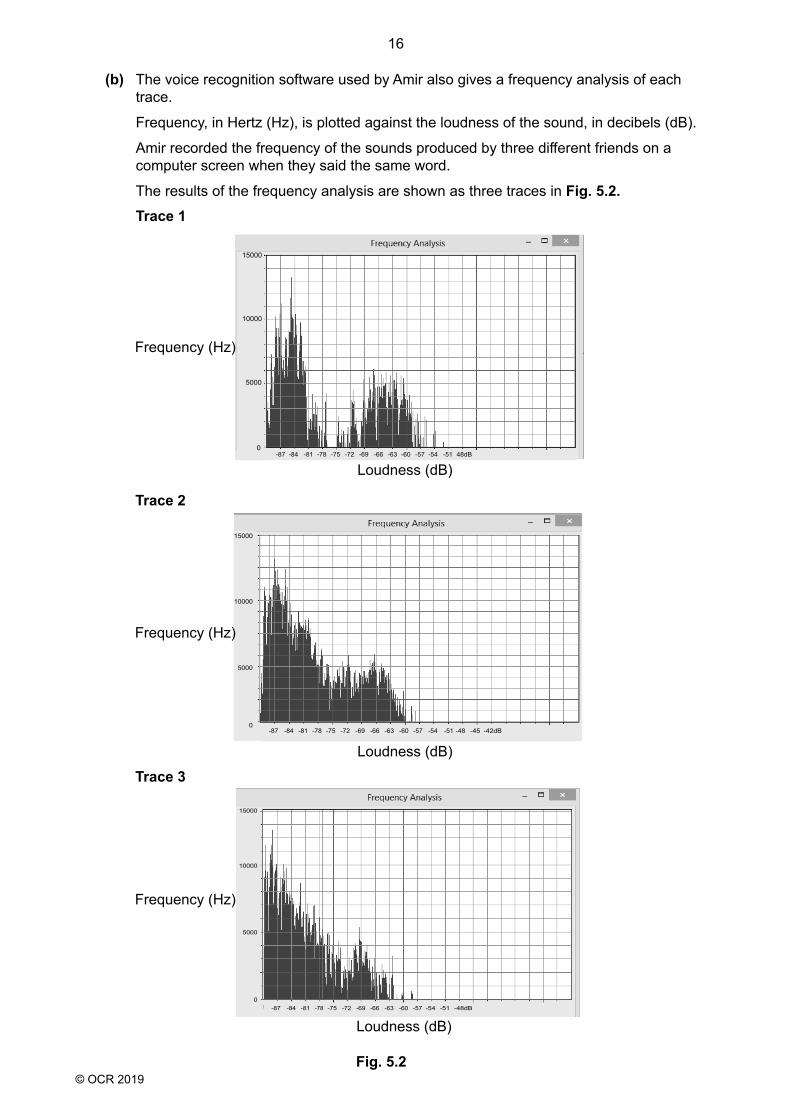
(b) The voice recognition software used by Amir also gives a frequency analysis of each trace.
Frequency, in Hertz (Hz), is plotted against the loudness of the sound, in decibels (dB).
Amir recorded the frequency of the sounds produced by three different friends on a computer screen when they said the same word.
The results of the frequency analysis are shown as three traces in Fig. 5.2.Trace 1
-87 -84 -81 -78 -75 -72 -69 -66 -63 -60 -57 -54 -51 48dB0
5000
10000
15000
Trace 2
0
5000
10000
15000
-87 -84 -81 -78 -75 -72 -69 -66 -63 -60 -57 -54 -51 -48 -45 -42dB
Trace 3
5000
10000
15000
0-87 -84 -81 -75 -72 -69 -66 -63 -60 -57-78 -54 -51 -48dB
Fig. 5.2
Frequency (Hz)
Loudness (dB)
Frequency (Hz)
Loudness (dB)
Frequency (Hz)
Loudness (dB)
© OCR 2019 Turn over
17
Compare the three traces in Fig. 5.2 to describe how they confirm that the same word was spoken and describe why the traces are not identical.
..............................................................................................................................................
..............................................................................................................................................
..............................................................................................................................................
..............................................................................................................................................
..............................................................................................................................................
..............................................................................................................................................
..............................................................................................................................................
..............................................................................................................................................
..............................................................................................................................................
..............................................................................................................................................
..............................................................................................................................................
..........................................................................................................................................[6]
(c) The data shown in Fig. 5.1 and Fig. 5.2 are primary data.
(i) Describe one feature of primary and secondary data.
Primary data .................................................................................................................
......................................................................................................................................
Secondary data ............................................................................................................
..................................................................................................................................[2]
(ii) Suggest three advantages of using secondary data.
1 ...................................................................................................................................
2 ...................................................................................................................................
3 ...................................................................................................................................[3]
18
© OCR 2019
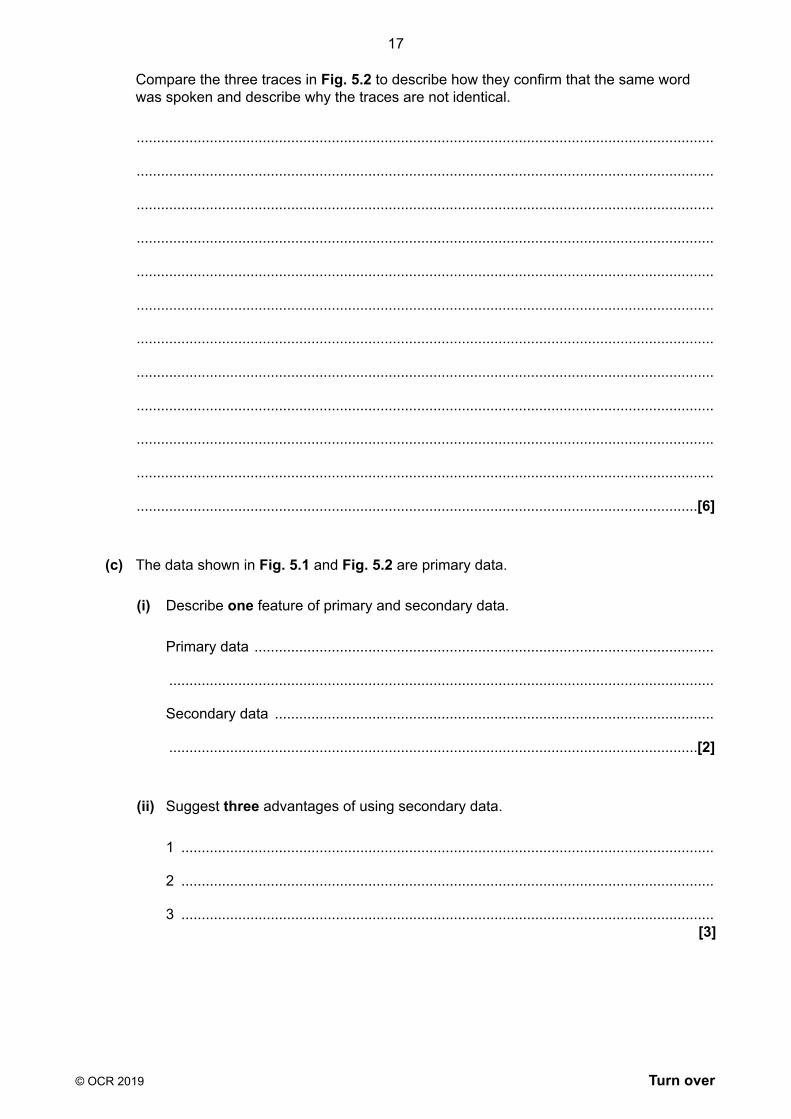
6 Scientific findings are shared with a wide range of people.
Scientific authors can be either public information scientists or scientific journalists.
(a) For each type of author in Table 6.1 put a tick () in the correct box to indicate if they are public information scientists or scientific journalists.
Type of author Public informationscientist Scientific journalist
University scientist
Scientific book authors
Government scientific agencies
Newspaper article authors
Scientific companies
TV programme producers
Blog author
Table 6.1[7]
(b) When writing a scientific report it is important to consider the audience that the report is written for.
Suggest three different audiences that scientific reports can be written for.
1 ............................................................................................................................................
2 ............................................................................................................................................
3 ............................................................................................................................................[3]

© OCR 2019 Turn over
19
PLEASE DO NOT WRITE ON THIS PAGE
BLANK PAGE
20
© OCR 2019
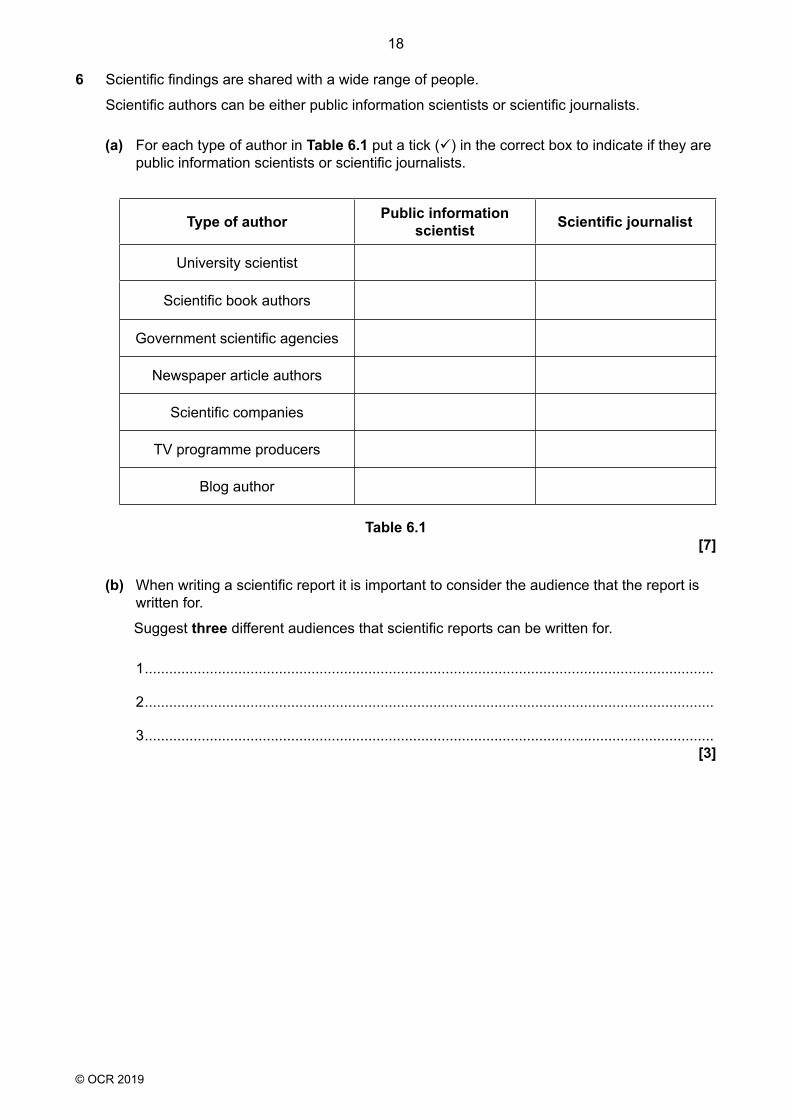
7 Iron tablets are used to treat people with a low level of iron in their blood.
The active ingredient in iron tablets is iron(II) sulfate, FeSO4.
(a) Susan carries out a titration to check the mass of iron in an iron tablet.
She follows three key steps.
Step 1 - The iron tablet is ground to a fine powder using a pestle and mortar and transferred to a conical flask.
Step 2 - 100 cm3 of dilute sulfuric acid is added to the powder, and then the flask is shaken until the iron tablet dissolves.
Step 3 - A few drops of indicator are added and the solution is titrated with 0.010 mol dm–3 potassium dichromate.
Susan records the initial and final burette readings as part of the titration, and calculates the volume needed to reach the end-point.
She obtains the results shown in Table 7.1.
Initial burette reading (cm3) 0.10
Final burette reading (cm3) 19.00
Volume of 0.010 mol dm–3 potassiumdichromate added (cm3) 18.90
Table 7.1
(i) Calculate the number of moles of potassium dichromate required to react with the iron in the tablet.
Use the equation: number of moles = concentration (mol dm–3) × volume (cm3) 1000
number of moles = ............................................... [2]
© OCR 2019 Turn over
21
%
(ii) In the titration, 6 moles of iron(II) ions react with 1 mole of dichromate ions.
Calculate the number of moles of iron in the tablet.
Use your answer from (a)(i).
number of moles = ................................................ [1]
(iii) The relative atomic mass of iron is 55.8.
Calculate the mass, in mg, of iron in the tablet.
Use the equation: mass (g) = number of moles x relative atomic mass
Use your answer from (a)(ii).
Give your answer to 3 significant figures.
mass of iron = mg [4]
(iv) The bottle of iron tablets states that each tablet contains 65 mg.
Calculate the error in Susan’s value from a(iii) as a percentage of the value shown on the bottle.
percentage error = [2]
(v) Susan considers using a spectrophotometer to determine the mass of iron in the tablet.
Suggest one advantage and one disadvantage of using a spectrophotometer rather than completing a titration.
Advantage .....................................................................................................................
.......................................................................................................................................
Disadvantage .................................................................................................................
.......................................................................................................................................[2]
................................................
...................................................
22
© OCR 2019
(b) Chromatography can be used to purify (prepare) a chemical for further use or to quantify the amount of a chemical present.
(i) Complete the sentences below using words from this list.
Each word may be used once, more than once or not at all.
elution protonometry scraping radiology nephrology
Preparative samples can be obtained from column chromatography by
.......................................................... .
Preparative samples from thin layer chromatography (TLC) can be obtained by
.......................................................... or .......................................................... .[3]
(ii) Densitometry can be used to quantify the amount of substance separated on a TLC plate.
Complete the sentences below using words from this list.
Each word may be used once, more than once or not at all.
scanned intensities less protracted cyclons
greater calibration wavelengths similar
A beam of light is …………………......................... across the TLC plate.
Different chemicals absorb specific …………………......................... of light. The more substance present, the …………………......................... the amount of light
absorbed. The amount of substance present can be estimated by comparing the
absorption of the spot with a …………………......................... graph.[4]
END OF QUESTION PAPER

© OCR 2019 Turn over
23
ADDITIONAL ANSWER SPACE
If additional answer space is required, you should use the following lined page(s). The question number(s) must be clearly shown in the margin(s) – for example 1(a) or 2(b).
...........................................................................................................................................................
...........................................................................................................................................................
...........................................................................................................................................................
...........................................................................................................................................................
...........................................................................................................................................................
...........................................................................................................................................................
...........................................................................................................................................................
...........................................................................................................................................................
...........................................................................................................................................................
...........................................................................................................................................................
...........................................................................................................................................................
...........................................................................................................................................................
...........................................................................................................................................................
...........................................................................................................................................................
...........................................................................................................................................................
...........................................................................................................................................................
...........................................................................................................................................................
...........................................................................................................................................................
...........................................................................................................................................................
...........................................................................................................................................................
...........................................................................................................................................................
...........................................................................................................................................................
...........................................................................................................................................................
...........................................................................................................................................................
...........................................................................................................................................................
...........................................................................................................................................................
...........................................................................................................................................................
Oxford Cambridge and RSA
Copyright Information:OCR is committed to seeking permission to reproduce all third-party content that it uses in its assessment materials. OCR has attempted to identify and contact all copyright holders whose work is used in this paper. To avoid the issue of disclosure of answer-related information to candidates, all copyright acknowledgements are reproduced in the OCR Copyright Acknowledgements Booklet. This is produced for each series of examinations and is freely available to download from our public website (www.ocr.org.uk) after the live examination series.If OCR has unwittingly failed to correctly acknowledge or clear any third-party content in this assessment material OCR will be happy to correct its mistake at the earliest possible opportunity.For queries or further information please contact the Copyright Team, OCR (Oxford Cambridge and RSA Examinations), The Triangle Building, Shaftesbury Road, Cambridge CB2 8EA. OCR is part of the Cambridge Assessment Group. Cambridge Assessment is the brand name of University of Cambridge Local Examinations Syndicate (UCLES), which is itself a department of the University of Cambridge.
© OCR 2019
C342/1906