oxfordshire strategic housing market assessment
TRANSCRIPT

Oxfordshire Strategic Housing Market Assessment Final Report
April 2014
Prepared by
GL Hearn Limited
20 Soho Square
London W1D 3QW
T +44 (0)20 7851 4900
F +44 (0)20 7851 4910
glhearn.com

Oxfordshire Strategic Housing Market Assessment: April 2014
GL Hearn Page 2 of 188
J:\Planning\Job Files\J029822 - Oxfordshire SHMA\Reports\Final SHMA Report (11.04.14).docx

Oxfordshire Strategic Housing Market Assessment: April 2014
GL Hearn Page 3 of 188
J:\Planning\Job Files\J029822 - Oxfordshire SHMA\Reports\Final SHMA Report (11.04.14).docx
Contents
Section Page
1 INTRODUCTION 5
2 THE CURRENT HOUSING OFFER 15
3 HOUSING MARKET DYNAMICS & MARKET SIGNALS 27
4 DEMOGRAPHIC & ECONOMIC DRIVERS OF THE HOUSING MARKET 57
5 DEMOGRAPHIC AND ECONOMIC-LED PROJECTIONS 75
6 AFFORDABLE HOUSING NEED 103
7 NEED FOR DIFFERENT SIZES OF HOMES 127
8 HOUSING NEEDS OF SPECIFIC GROUPS IN THE POPULATION 139
9 CONCLUSIONS 171

Oxfordshire Strategic Housing Market Assessment: April 2014
GL Hearn Page 4 of 188
J:\Planning\Job Files\J029822 - Oxfordshire SHMA\Reports\Final SHMA Report (11.04.14).docx
Quality Standards Control
The signatories below verify that this document has been prepared in accordance with our quality control
requirements. These procedures do not affect the content and views expressed by the originator.
This document must only be treated as a draft unless it is has been signed by the Originators and approved
by a Business or Associate Director.
DATE ORIGINATORS APPROVED
April 2014 Emma Powell, Assistant Planner
Justin
Nick Ireland, Planning Director
Justin Gardner, Director, JGC
S
Christine Doel, Director, SQW
Limitations
This document has been prepared for the stated objective and should not be used for any other purpose
without the prior written authority of GL Hearn; we accept no responsibility or liability for the consequences of
this document being used for a purpose other than for which it was commissioned.

Oxfordshire Strategic Housing Market Assessment: April 2014
GL Hearn Page 5 of 188
J:\Planning\Job Files\J029822 - Oxfordshire SHMA\Reports\Final SHMA Report (11.04.14).docx
1 INTRODUCTION
Introduction and Purpose
This report provides a Strategic Housing Market Assessment (SHMA) for the Oxfordshire Sub-1.1
Regional Housing Market. It has been prepared by a consultant team comprising GL Hearn, Justin
Gardner Consulting and SQW on behalf of the local authorities falling mainly within the housing
market area, namely West Oxfordshire District Council, Oxford City Council, South Oxfordshire
District Council, Vale of White Horse District Council and Cherwell District Council.
The SHMA is concerned principally with issues related to housing development, and considers in 1.2
particular questions relating to:
how many homes might need to be developed in the future;
what mix of homes is needed; and
the housing needs of specific groups within the population.
It is intended to inform the future development of planning and housing policies and includes an 1.3
objective assessment of the need for market and affordable housing over the period to 2031. It
considers both need for housing overall, for different types of homes and in different parts of the
County.
The Councils’ brief for the SHMA makes clear the requirement to present a coherent analysis of the 1.4
relationship between jobs and homes in the housing market area. To support this, a set of
economic forecasts have been prepared alongside and to inform the SHMA by Cambridge
Econometrics and SQW1.
The SHMA responds to and is compliant with the requirements of both the National Planning Policy 1.5
Framework2 (the NPPF) and Planning Practice Guidance on Housing and Economic Development
Needs Assessments3 issued by Government in March 2014.
1 SQW and Cambridge Econometrics (2014) Economic Forecasting to inform the Oxfordshire Strategic Economic Plan and Strategic
Housing Market Assessment 2 CLG (March 2012) National Planning Policy Framework
3 CLG (March 2014) Planning Practice Guidance: Housing and Economic Development Needs Assessments

Oxfordshire Strategic Housing Market Assessment: April 2014
GL Hearn Page 6 of 188
J:\Planning\Job Files\J029822 - Oxfordshire SHMA\Reports\Final SHMA Report (11.04.14).docx
National Policy and Practice Guidance
National Planning Policy Framework
National policies for plan-making are set out within the National Planning Policy Framework4.This 1.6
sets out key policies against which development plans will be assessed at examination and to
which they must comply. From April 2013 the weight which can be given to policies within existing
adopted plans which are ‘pre-NPPF’ is influenced by the degree of compliance of these with
policies within the Framework.
The Framework sets a presumption in favour of sustainable development whereby Local Plans 1.7
should meet objectively assessed development needs, with sufficient flexibility to respond to rapid
change, unless the adverse impacts of doing so would significantly or demonstrably outweigh the
benefits or policies within the Framework indicate that development should be restricted5.
The core evidence for housing need is intended to be a Strategic Housing Market Assessment 1.8
(SHMA) for the housing market area. This SHMA seeks to address this requirement. It covers the
Oxfordshire Housing Market Area (HMA).
Paragraph 159 in the Framework outlines that the SHMA should identify the scale and mix of 1.9
housing and the range of tenures which the local population is likely to need over the plan period
which:
Meets household and population projections, taking account of migration and demographic
change;
Addresses the need for all types of housing, including affordable housing and the needs of
different groups in the community; and
Caters for housing demand and the scale of housing supply necessary to meet this demand.
This is reaffirmed in the NPPF in Paragraph 50. The SHMA is intended to be prepared for the 1.10
housing market area, and include work and dialogue with neighbouring authorities where the HMA
crosses administrative boundaries in line with the ‘duty to cooperate’ introduced in the 2011
Localism Act.
Paragraph 158 of the NPPF also emphasises the alignment of the housing and economic evidence 1.11
base and policy, and a key requirement of the Councils’ brief for this SHMA has been to understand
the interaction between the housing market and economy and to examine what level of housing
provision might be required to support economic growth within Oxfordshire.
4 CLG (March 2012) National Planning Policy Framework
5 Examples of these include Green Belt, Areas of Outstanding Natural Beauty and areas at risk of flooding

Oxfordshire Strategic Housing Market Assessment: April 2014
GL Hearn Page 7 of 188
J:\Planning\Job Files\J029822 - Oxfordshire SHMA\Reports\Final SHMA Report (11.04.14).docx
Paragraph 17 in the NPPF is clear that the SHMA also needs to take account of market signals 1.12
such as land prices and housing affordability.
In regard to housing mix, the NPPF sets out that authorities should plan for a mix of housing based 1.13
on current and future demographic trends, market trends and the needs of different groups in the
community. Planning authorities should identify the size, type, tenure and range of housing that is
required in particular locations reflecting local demand. Where a need for affordable housing is
identified, authorities should set policies for meeting this need on site. However in setting affordable
housing targets, the NPPF states that to ensure a plan is deliverable, the sites and the scale of
development identified in the plan should not be subject to a scale of obligations and policy burdens
such that their ability to be developed is threatened and should support development throughout the
economic cycle. The SHMA does not deal with residential development viability, however it is
important to recognise that this is a relevant consideration, and needs to be brought together with
the analysis of affordable housing need herein, in setting policies for affordable housing.
Practice Guidance
New Planning Practice Guidance was issued by Government in March 2014 on ‘Housing and 1.14
Economic Development Needs Assessments.’6 A draft of this Guidance was issued in August 2013
as part of the Government’s review of Planning Practice Guidance (which informed the drafting of
the SHMA). This is relevant to this SHMA in that it provides clarity on how key elements of the
NPPF should be interpreted, including the approach to deriving an objective assessment of the
need for housing.
The Guidance defines “need” as referring to: 1.15
“the scale and mix of housing and the range of tenures that is likely to be needed in the housing
market area over the plan period – and should cater for the housing demand of the area and
identify the scale of housing supply necessary to meet this demand.”
It sets out that the assessment of need should be proportionate and should be based on future 1.16
scenarios that could be reasonably expected to occur. It should not take account of supply-side
factors or development constraints, with the Guidance specifically setting out that:
“Plan makers should not apply constraints to the overall assessment of need, such as
limitations imposed by the supply of land for new development, historic under performance,
viability, infrastructure or environmental constraints. However, these considerations will need
to be addressed when bringing evidence bases together to identify specific policies in
development plans.”
6 CLG (March 2014) Planning Practice Guidance - Housing and Economic Development Needs Assessments
Oxfordshire Strategic Housing Market Assessment: April 2014
GL Hearn Page 8 of 188
J:\Planning\Job Files\J029822 - Oxfordshire SHMA\Reports\Final SHMA Report (11.04.14).docx
The Guidance outlines that whilst estimating future need is not an exact science and that no single 1.17
approach will provide a definitive answer, the starting point for establishing the need for housing
should be the latest household projections published by the Department for Communities and Local
Government (CLG). At the time of preparation of this report these are 2011-based ‘Interim’
Household Projections.7 However it sets out that these only cover a 10 year period up to 2021,
therefore plan makers would need to assess trends after 2021 to align with their development plan
periods.
It sets out that there may be instances where these national projections require adjustment to take 1.18
account of factors affecting local demography or household formation rates which are not captured
in past trends, including where there is evidence that household formation rate have been
supressed historically by under-supply or worsening affordability of housing. It suggests that
proportional adjustments should be made where there market signals point to supply being
constrained relative to long-term trends or other areas in order to improve affordability.
It sets out that plan makers may consider sensitivity testing, specific to their local circumstances, 1.19
based on alternative assumptions in relation to the underlying demographic projections and
household formation rates. It sets out that such local issues may vary, but might include migration
levels that have been affected by changes in employment growth, a large housing development
such as an urban extension in the last five years, or expansion in education or facilities for older
people. Any such local changes would need to be clearly explained and justified on the basis of
established sources of robust evidence.
The associated Guidance on Housing and Economic Land Availability Assessments8 sets out that in 1.20
assessing objectively-assessed need for housing, consideration can be given to evidence that the
council has delivered over and above its housing need in previous years. It sets out that “if a council
has robust evidence that past high delivery rates that informed the projections are no longer
realistic – for example they relied on a particular set of circumstances that could not be expected to
occur again – they can adjust their projections down accordingly.”
In regard to employment trends, the Guidance indicates that job growth trends and/or economic 1.21
forecasts should be considered having regard to the growth in working-age population in the
housing market area. It sets out that where the supply of working age population that is
economically active (labour force supply) is less than the projected job growth, this could result in
unsustainable commuting patterns (depending on public transport accessibility and other
sustainable options such as walking and cycling) and could reduce the resilience of local
7 These are interim projections rather than official statistics
8 CLG (March 2014) Planning Practice Guidance – Housing and Economic Land Availability Assessments

Oxfordshire Strategic Housing Market Assessment: April 2014
GL Hearn Page 9 of 188
J:\Planning\Job Files\J029822 - Oxfordshire SHMA\Reports\Final SHMA Report (11.04.14).docx
businesses. In such circumstances, plan makers will need to consider how the location of new
housing and infrastructure development could help to address these problems.
Evidence of affordable housing needs is also relevant, with the Guidance suggesting that the total 1.22
affordable housing need should be considered in the context of its likely delivery as a proportion of
mixed market and affordable housing. In some instances it suggests this may provide a case for
increasing the level of overall housing provision.
The Guidance indicates that the assessment should consider the need for different types of housing 1.23
and the needs of different groups, including family housing, housing for older people, and
households with specific needs and those looking to build their own home. It sets out that the need
for older persons housing should be broken down by tenure and type, and should include an
assessment of need for residential institutions.
The Oxfordshire Housing Market Area
Practice Guidance on undertaking studies such as this identifies that housing market areas reflect 1.24
the relationships between where people live and work, patterns of movement between homes, and
differences in housing costs and trends in these.
An Oxford-focused sub-regional housing market extending across much of Oxfordshire has 1.25
previously been identified by research at both a national and regional level. This SHMA has sought
to critically review the definition of the market area based on the interrogation of house prices,
migration and commuting flows and discussions with stakeholders. This is considered in detail in
Appendix 1.
The analysis concludes that there is an Oxford-focused Housing Market Area which extends across 1.26
much of the County, reflecting the economic influence of the City. The county still remains the most
appropriate geography for analysis of housing markets in terms of the ‘best fit’ of local authority
boundaries to a functional housing market area. It is thus the appropriate geographical scale to take
forward sub-regional joint working on an SHMA.

Oxfordshire Strategic Housing Market Assessment: April 2014
GL Hearn Page 10 of 188
J:\Planning\Job Files\J029822 - Oxfordshire SHMA\Reports\Final SHMA Report (11.04.14).docx
The Oxfordshire Housing Market Area Figure 1:
However there are links, in housing market and economic terms, between parts of Oxfordshire and 1.27
surrounding areas, including major employment centres close to the county’s boundaries,
particularly Reading (the influence of which tends into South Oxfordshire including Henley-on-
Thames) and Swindon (the influence of which extends into the Vale of White Horse). In the north of
the county, the economic and housing market influence of Banbury and Bicester extend into South
Northamptonshire and Aylesbury Vale respectively.
Within Oxfordshire we can identify a number of more localised housing market which reflect more 1.28
closely similarities in the housing mix and pricing across different parts of the County. Our analysis
points to the operation of three overlapping housing markets:
Banbury and North Oxfordshire;
Oxford; and
South Oxfordshire.
This geography reflects the unique characteristics of the City in terms of its housing mix, but also its 1.29
economic strengths and presence of two universities. It also reflects the subtle differences between
the housing mix and pricing between the north and south of the County, with the latter
Oxfordshire Strategic Housing Market Assessment: April 2014
GL Hearn Page 11 of 188
J:\Planning\Job Files\J029822 - Oxfordshire SHMA\Reports\Final SHMA Report (11.04.14).docx
demonstrating (in relative terms) higher housing costs and demand for larger housing within the
market sector. We would include West Oxfordshire within a ‘north Oxfordshire’ focused market.
A review of planning policies for housing provision (current or emerging) in areas which adjoin the 1.30
Oxfordshire HMA is set out in Appendix 3.
Within these broad areas there are differences between the housing mix and quality of place at a 1.31
more local level. Whilst the focus of this report is on considering strategic issues related to housing
across the sub-regional housing market, the report profiles housing mix and market dynamics within
sub-markets more locally – seeking principally to draw out key relevant distinctions which are of
relevant to considering how the future mix of housing provision might be adjusted to meet local
need.
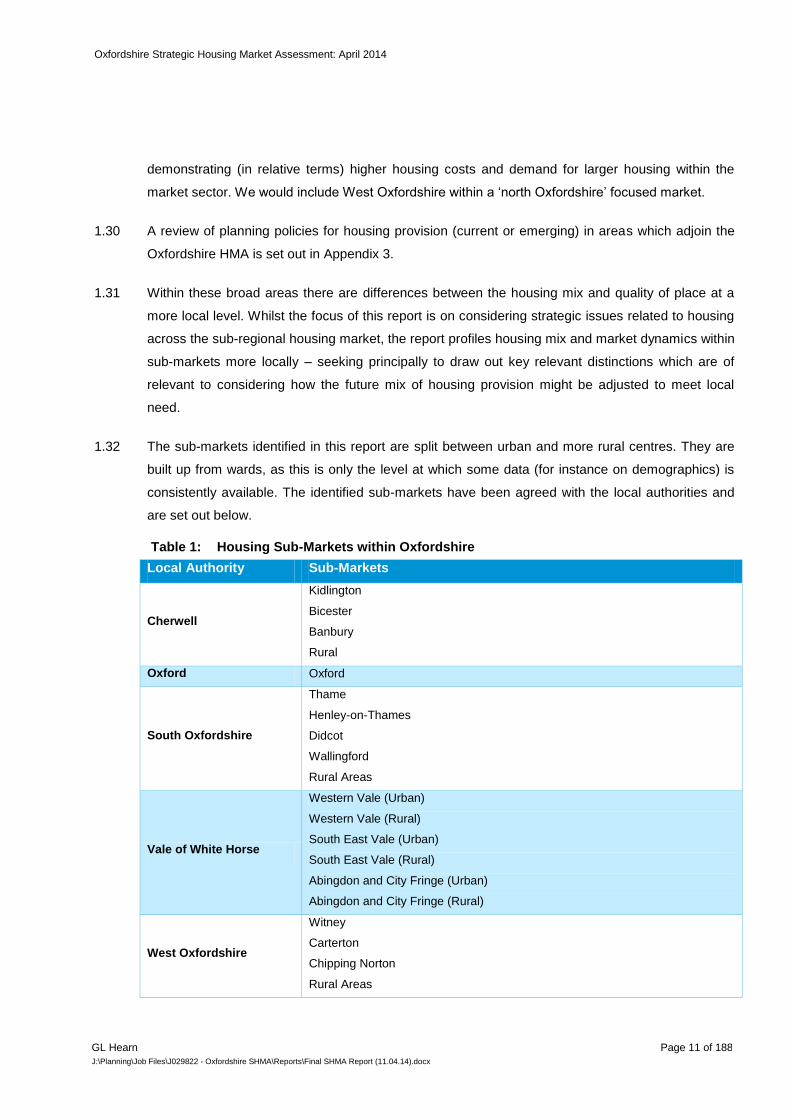
The sub-markets identified in this report are split between urban and more rural centres. They are 1.32
built up from wards, as this is only the level at which some data (for instance on demographics) is
consistently available. The identified sub-markets have been agreed with the local authorities and
are set out below.
Housing Sub-Markets within Oxfordshire Table 1:
Local Authority Sub-Markets
Cherwell
Kidlington
Bicester
Banbury
Rural
Oxford Oxford
South Oxfordshire
Thame
Henley-on-Thames
Didcot
Wallingford
Rural Areas
Vale of White Horse
Western Vale (Urban)
Western Vale (Rural)
South East Vale (Urban)
South East Vale (Rural)
Abingdon and City Fringe (Urban)
Abingdon and City Fringe (Rural)
West Oxfordshire
Witney
Carterton
Chipping Norton
Rural Areas

Oxfordshire Strategic Housing Market Assessment: April 2014
GL Hearn Page 12 of 188
J:\Planning\Job Files\J029822 - Oxfordshire SHMA\Reports\Final SHMA Report (11.04.14).docx
Overview of Approach
The SHMA has been prepared taking account of both the 2007 SHMA Guidance and the 2014 1.33
Planning Practice Guidance on Housing and Economic Assessments.9 The final version of Planning
Practice Guidance was issued at a late stage of the project, but has been taken into account in
finalising the SHMA Report. It considers issues relating to overall housing need, the mix of housing
needed and the housing needs of specific groups within the population.
The assessment of future need for market and affordable housing does not take account of supply-1.34
side factors such as the availability of land for development, physical or policy constraints, the
sustainability of accommodating different levels of housing provision or the views of local
communities. These are all relevant considerations in determining future policies for housing
provision, but it is the role of the relevant planning authorities in developing new plans to draw these
together. The SHMA is intended to assist in this process by providing an independent, objective
assessment of need for housing.
The SHMA itself has been informed by a detailed process of stakeholder consultation and 1.35
engagement. This has included:
One-to-one discussions with estate and letting agents and new-build sales staff to understand
housing market dynamics ‘on the ground;’
A programme of consultation with officers in both housing and planning teams from the local
authorities across Oxfordshire as well as elected members;
A workshop in September 2013 to discuss and explore economic growth potential and how this
relates to the housing market;
A stakeholder workshop held to consider the emerging findings of the SHMA and to discuss key
methodological issues held in Oxford Town Hall on 1st November 2013. This was attended by a
range of stakeholders including developers and their agents, representatives from adjoining
authorities, as well as representatives of neighbourhood forums which are involved in preparing
neighbourhood plans within Oxfordshire.
The preparation of the SHMA has been coordinated by a Steering Group comprising members of 1.36
the Oxfordshire councils. The Oxfordshire Spatial Planning and Infrastructure Partnership (SPIP)
has overseen the project and has discussed emerging findings. The SPIP has supported joint
working at both senior officer and member levels.
9 CLG (March 2014) Planning Practice Guidance: Housing and Economic Development Needs Assessments

Oxfordshire Strategic Housing Market Assessment: April 2014
GL Hearn Page 13 of 188
J:\Planning\Job Files\J029822 - Oxfordshire SHMA\Reports\Final SHMA Report (11.04.14).docx
Report Structure
The remainder of the report is structured as follows: 1.37
Section 2: The Current Housing Offer;
Section 3: Housing Market Dynamics and Market Signals;
Section 4: Demographic and Economic Drivers of the Housing Market;
Section 5: Demographic and Economic-Led Projections;
Section 6: Affordable Housing Need;
Section 7: Need for Different Sizes of Homes;
Section 8: Housing Needs of Specific Groups in the Population;
Section 9: Conclusions.
The report is accompanied by the following appendices which provide detailed contextual 1.38
information. These comprise:
Appendix 1: Defining the Housing Market Area;
Appendix 2: Review of Key Housing and Planning Policies;
Appendix 3: Review of Policies for Housing Provision in Adjoining Authorities;
Appendix 4: Affordable Housing Definitions;
Appendix 5: Survey of Local Prices and Rents.

Oxfordshire Strategic Housing Market Assessment: April 2014
GL Hearn Page 14 of 188
J:\Planning\Job Files\J029822 - Oxfordshire SHMA\Reports\Final SHMA Report (11.04.14).docx
Oxfordshire Strategic Housing Market Assessment: April 2014
GL Hearn Page 15 of 188
J:\Planning\Job Files\J029822 - Oxfordshire SHMA\Reports\Final SHMA Report (11.04.14).docx
2 THE CURRENT HOUSING OFFER
We have defined Oxfordshire as a sub-regional housing market, and identified a number of local 2.1
housing markets and sub-markets within this. In this section we move forward to profile the housing
offer, considering differences in the housing mix, as firstly this influences the characteristics of the
market; and secondly it is important to understand what housing is in different areas now in
considering what mix of housing should be provided in the future.
We define the Oxfordshire HMA as comprising the local authorities of Cherwell, Oxford, South 2.2
Oxfordshire, the Vale of White Horse and West Oxfordshire. It aligns to the County boundary.
Housing Offer
Much of the housing stock in 2031 exists now; and it is thus important to understand the current 2.3
‘housing offer’ and how this has been changing, to consider what gaps in the offer new-build
development might fill. In this section we profile the current housing offer, considering the profile of
stock of different types, sizes and tenures of homes, how this has been changing and how it varies
across the HMA.
Tenure Profile
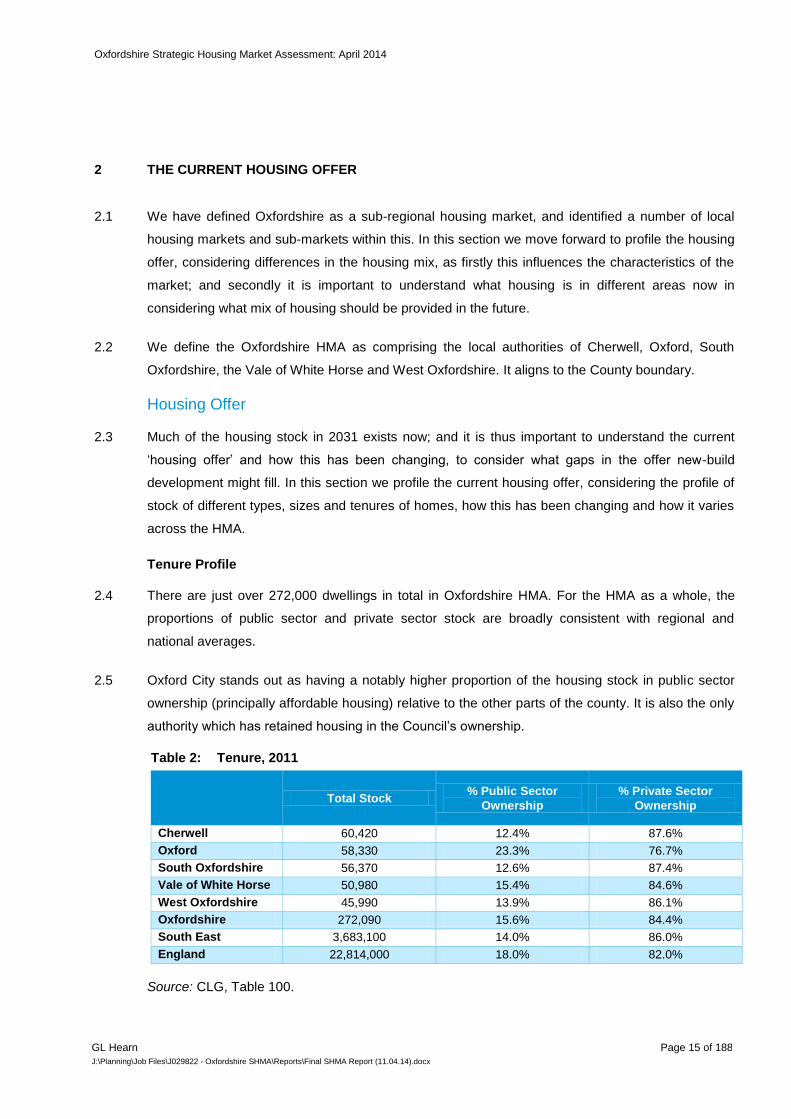
There are just over 272,000 dwellings in total in Oxfordshire HMA. For the HMA as a whole, the 2.4
proportions of public sector and private sector stock are broadly consistent with regional and
national averages.
Oxford City stands out as having a notably higher proportion of the housing stock in public sector 2.5
ownership (principally affordable housing) relative to the other parts of the county. It is also the only
authority which has retained housing in the Council’s ownership.
Tenure, 2011 Table 2:
Total Stock
% Public Sector
Ownership
% Private Sector
Ownership
Cherwell 60,420 12.4% 87.6%
Oxford 58,330 23.3% 76.7%
South Oxfordshire 56,370 12.6% 87.4%
Vale of White Horse 50,980 15.4% 84.6%
West Oxfordshire 45,990 13.9% 86.1%
Oxfordshire 272,090 15.6% 84.4%
South East 3,683,100 14.0% 86.0%
England 22,814,000 18.0% 82.0%
Source: CLG, Table 100.

Oxfordshire Strategic Housing Market Assessment: April 2014
GL Hearn Page 16 of 188
J:\Planning\Job Files\J029822 - Oxfordshire SHMA\Reports\Final SHMA Report (11.04.14).docx
The majority of stock in public sector ownership is owned by Councils or Registered Providers. 2.6
However there is some stock which is owned by other public sector bodies, such as the Police,
Ambulance Service and Armed Forces. This is set out in Table 3. This is likely to include housing
owned by the MOD such as at RAF Brize Norton.
Profile of Other Public Sector Housing Table 3:
Other Public Sector Housing
Cherwell 325
Oxford 924
South Oxfordshire 720
Vale of White Horse 1,315
West Oxfordshire 998
Oxfordshire 4,282
Source: CLG, Table 100.
2011 Census data can be used to provide a more detailed breakdown of the housing stock by 2.7
tenure. Like much of the South East, owner occupation is by far the most prominent housing tenure
across the Oxfordshire HMA. Outside of Oxford itself, owner occupation dominates – accounting
69% or more of all households in each local authority.
Oxford City’s tenure profile is markedly different and somewhat skews the profile of the HMA. 2.8
Almost half of households in the City rent, with the level of households living in private rented
accommodation (28%) and social rented accommodation (21%) both falling notably above average.
Whilst we might expect the City to have a higher proportion of renting (consistent with other UK
cities) the level of renting is very significant. This partly reflects the size of the student rental market,
the City accommodating two universities: the University of Oxford and Oxford Brookes University;
as well as other households seeking to rent (including young working households and those
studying at other colleges in the City).
Detailed Tenure Profile, 2011 Table 4:
% Households Total
Households Owned
Shared
Ownership
Social
Rented
Private
Rented Other
Cherwell 56,728 69.3 0.8 12.1 16.2 1.6
Oxford 55,375 46.7 1.7 21.4 28.2 2.0
South Oxfordshire 54,104 72.9 0.8 11.4 13.3 1.5
Vale of White Horse 49,407 70.3 1.0 13.3 13.6 1.7
West Oxfordshire 43,241 69.7 1.3 12.5 14.9 1.7
Oxfordshire 258,855 65.5 1.1 14.2 17.5 1.7
South East 3,555,463 67.6 1.1 13.7 16.3 1.3
England 22,063,368 63.3 0.8 17.7 16.8 1.3
Source: Census (2011)

Oxfordshire Strategic Housing Market Assessment: April 2014
GL Hearn Page 17 of 188
J:\Planning\Job Files\J029822 - Oxfordshire SHMA\Reports\Final SHMA Report (11.04.14).docx
Owner occupation has increased in the west of the county, in both West Oxfordshire and Vale of 2.9
White Horse, over the 2001-11 decade. However it has fallen (in both absolute and relative terms)
in Cherwell, Oxford and South Oxfordshire.
The private rented sector was a key growth sector in the housing market across England during the 2.10
2001-11 decade. The number of households living in the Private Rented Sector between 2001-11
has increased by 37% across the Oxfordshire HMA compared to a 57% increase across the South
East region and 63% nationally. The strongest growth has been in Cherwell (56% growth) with the
lowest in the South Oxfordshire (28%).
Table 5 tracks changes in the tenure profile between 2001-11. The proportion of households 2.11
owning a home has fallen in Cherwell, Oxford and South Oxfordshire over this decade. Private
renting has increased in all areas. The proportion of households in the social rented sector has
increased modestly in Oxford and the Vale of White Horse, but has fallen in Cherwell and West
Oxfordshire.
Changes in Tenure Profile (% Households by Tenure), 2001-11 Table 5:
Ch
erw
ell
Oxfo
rd
So
uth
O
xfo
rdsh
ire
Vale
of W
hite
H
ors
e
West
Oxfo
rdsh
ire
Oxfo
rdsh
ire
So
uth
Ea
st
En
gla
nd
Owned - 2001 70.2% 51.3% 73.8% 68.9% 65.0% 65.8% 68.4% 63.7%
Owned 2011 69.3% 46.7% 72.9% 70.3% 69.7% 65.5% 67.6% 63.3%
Social Rented - 2001 13.0% 21.2% 11.4% 12.9% 13.1% 14.4% 14.0% 19.3%
Social Rented - 2011 12.1% 21.4% 11.4% 13.3% 12.5% 14.2% 13.7% 17.7%
Private Rented - 2001 12.2% 23.9% 12.0% 12.8% 13.7% 15.0% 12.1% 12.0%
Private Rented - 2011 17.8% 30.2% 14.8% 15.3% 16.6% 19.2% 17.6% 18.2%
Source: Census 2001, Census 2011
Figure 2 looks at tenure changes in terms of the absolute number of households in the different 2.12
tenure categories. Owner occupation has increased in West Oxfordshire and the Vale of White
Horse in absolute and proportional terms. The strongest growth in private renting has been in
Oxford, followed by Cherwell.
The growth in private renting has been a trend at a national and regional level over the 2001-11 2.13
decade, linked to a range of factors including the availability of mortgage finance and buy-to-let
mortgages; and the attractiveness of housing as an investment.

Oxfordshire Strategic Housing Market Assessment: April 2014
GL Hearn Page 18 of 188
J:\Planning\Job Files\J029822 - Oxfordshire SHMA\Reports\Final SHMA Report (11.04.14).docx
Changes in Tenure Profile 2001 - 2011 Figure 2:
Source: Census (2011 and 2001)
House Types
The Oxfordshire HMA has an above average proportion of (typically larger) detached and semi-2.14
detached homes relative to the South East as a whole. These account for 61% of the housing stock
in 2011.
The proportion of terraced housing (22%) is in line with the South East average whereas the 2.15
proportion of flats (16%) is below both regional (21%) and national averages (22%). This principally
reflects the relatively rural nature of the county.
The proportion of detached housing is particularly high in South Oxfordshire, the Vale of White 2.16
Horse and West Oxfordshire, in all cases representing over a third of the housing stock. Cherwell in
contrast has a higher proportion of semi-detached stock.
The housing mix in Oxford differs markedly from other areas: it is focused towards higher density 2.17
development and typically smaller homes. Just under a third of the City’s housing stock was made
up of flats (32.8%) in 2011. The proportion of terraced housing is also greater than in the other
authorities, accounting for 28.2% of the dwelling stock.
-4,000 -2,000 2,000 4,000 6,000
Cherwell
Oxford
South Oxfordshire
Vale of White Horse
West Oxfordshire
Other
Private Rented
Socially Rented
Shared ownership (part ownedand part rented)
Owned

Oxfordshire Strategic Housing Market Assessment: April 2014
GL Hearn Page 19 of 188
J:\Planning\Job Files\J029822 - Oxfordshire SHMA\Reports\Final SHMA Report (11.04.14).docx
House Types: % Dwellings in 2011 Figure 3:
Source: Census, 2011
Housing Size
The profile of housing sizes across the Oxfordshire HMA is biased moderately towards larger 2.18
dwellings relative to the regional and national profile (consistent with above average house prices);
but a clear distinction is evident between the City and the other districts. Across the HMA:
10% of properties have 1 bedroom;
24% have 2 bedrooms;
40% have 3 bedrooms;
19% have 4 bedrooms; and
7% of dwellings have 5 or more bedrooms.
Oxfordshire as a whole (the HMA) has a higher proportion of properties with three or more 2.19
bedrooms relative to regional or national benchmarks, with properties with three or more
bedrooms accounting for two-thirds of the housing stock (66.1%). This is significant, as is one
of a number of factors which is likely to contribute to affordability pressures for younger households.
This said it is a reflection (to some degree) of market demand for housing and the attractiveness of
Oxfordshire as a place to live (even within the region).
30.2
9.0
35.8 36.4 34.3 28.7 28.0
22.3
35.2
29.7
32.3 30.3 32.3 32.0
27.6 30.7
23.1
28.2
19.0 18.8 22.5 22.4
22.4 24.5
11.2
32.8
11.2 13.4 10.2 16.0
21.2 22.1
0%
10%
20%
30%
40%
50%
60%
70%
80%
90%
100%
Ch
erw
ell
Oxfo
rd
South
Oxfo
rdshire
Vale
of W
hite
Hors
e
West O
xfo
rdshire
Oxfo
rdshire
South
East
Engla
nd
Other
Flat / Maisoneete
Terraced
Semi-detached
Detached

Oxfordshire Strategic Housing Market Assessment: April 2014
GL Hearn Page 20 of 188
J:\Planning\Job Files\J029822 - Oxfordshire SHMA\Reports\Final SHMA Report (11.04.14).docx
Oxford City again demonstrates a different stock profile to the rest of the HMA. It has an above 2.20
average level of 1 and 2 bed properties at 43% (compared to 34% across the HMA generally and
38% across the South East).
Cherwell has a high proportion of 3 bed properties (44%) when compared to the regional average 2.21
and a greater focus (taking account of the range of data on housing mix) towards ‘mid market’
housing.
Vale of White Horse, South Oxfordshire and West Oxfordshire all have a high proportion of 4 + bed 2.22
dwellings, in all cases accounting for over a quarter of dwellings for each of the three authorities
compared with 23% in the South East and 19% nationally. These areas clearly have a stock geared
towards larger (and higher value) family homes.
Size of Homes: % Dwellings in 2011 Figure 4:
Source: Census (2011)
Council Tax Bands
For the local authorities in south and west Oxfordshire less than 15% of the housing stock falls 2.23
within Council Tax Bands A and B. This is significantly below the regional (15%) and national profile.
Over a third of dwellings are Council Tax Bands E and above in South Oxfordshire (38%) and Vale
of White Horse (35%) compared with 29% regionally and 19% nationally.
9.0 16.0
7.7 7.9 7.3 9.7 11.6 11.8
22.9
27.1
23.7 21.1 24.9 23.9 26.2 27.9
44.0 36.1
39.9 39.9 40.8 40.1
38.9 41.2
18.3 14.1 20.7 23.1 20.0 19.1 17.0 14.4
5.6 6.5 7.9 7.8 6.8 6.9 6.0 4.6
0%
10%
20%
30%
40%
50%
60%
70%
80%
90%
100%
Ch
erw
ell
Oxfo
rd
South
Oxfo
rdshire
Vale
of W
hite
Hors
e
West O
xfo
rdshire
Oxfo
rdshire
South
East
Engla
nd
1 bedroom 2 bedrooms 3 bedrooms 4 bedrooms 5 or more bedrooms

Oxfordshire Strategic Housing Market Assessment: April 2014
GL Hearn Page 21 of 188
J:\Planning\Job Files\J029822 - Oxfordshire SHMA\Reports\Final SHMA Report (11.04.14).docx
Oxford City has a higher proportion of homes falling within Bands C and D, despite the focus of the 2.24
City’s housing offer more towards smaller properties as market values are comparatively higher.
Cherwell District has a higher proportion of properties in Bands A and B relative to other parts of the
Oxfordshire HMA – a reflection of the slight differences in housing mix and values relative to other
parts of the County.
Dwellings by Council Tax Band, 2011 Figure 5:
Source: ONS/ VOA
Local Differences in the Housing Offer
In this section we seek to draw out more local differences in the housing offer. In interpreting this it 2.25
is important to remember that different parts of a sub-regional housing market are likely to play a
different role and function which, to some degree, complement one another. Thus across the
country we find greater levels of larger, detached homes in owner occupation in rural areas; and
more smaller homes with a younger population and higher renting in urban (and particularly larger
urban) areas. This broad picture is borne out in Oxfordshire.
The rural areas generally have larger dwellings. In each of the rural sub-markets, more than 32% of 2.26
households live in homes with 4 or more bedrooms (with the highest levels in the Western Vale at
42%, and other areas ranging from 32-35%). 1-bed stock is very limited (generally below 5%). With
Cherwell OxfordSouth
Oxfordshire
Vale ofWhiteHorse
WestOxfordsh
ire
SouthEast
England
Band G+ 4.2 6.4 11.1 8.2 6.0 7.3 4.1
Band F 5.4 4.7 10.3 9.4 8.0 8.0 5.0
Band E 12.0 11.5 16.4 17.0 14.9 13.2 9.4
Band D 17.2 26.5 22.9 22.4 22.0 20.1 15.3
Band C 27.4 31.8 26.6 29.7 34.3 25.9 21.8
Band B 25.1 15.3 8.8 10.4 11.4 16.7 19.6
Band A 8.8 3.7 3.9 3.0 3.4 8.8 24.8
0%
10%
20%
30%
40%
50%
60%
70%
80%
90%
100%

Oxfordshire Strategic Housing Market Assessment: April 2014
GL Hearn Page 22 of 188
J:\Planning\Job Files\J029822 - Oxfordshire SHMA\Reports\Final SHMA Report (11.04.14).docx
the exception of the southern and western rural parts of the Vale of White Horse (where levels of
renting are higher), 74% of households are owner occupiers.
The urban areas generally have a greater concentration of smaller dwellings, in part reflecting 2.27
development densities. Over 40% of households in Oxford, Henley-on-Thames and Didcot live in 1
and 2 bed properties. In Chipping Norton, Carterton, Banbury, Wallingford and the urban areas in
the Western Vale the level of 1 and 2 bed dwellings accounts for between 37-39% of the housing
stock (albeit that 1-bed volumes are below 13% outside of Oxford). However in all of these areas
the most common housing size is 3-bed properties.
Looking at the tenure profile, the level of renting (social and private together) outside of Oxford 2.28
(where it accommodates half of all households) is strongest in Chipping Norton, Banbury and the
Urban Western Vale (accommodating over 35% of households). Private renting is above 20% in
some smaller settlements (Banbury and Carterton). Social renting is notably (20.3%) in the Urban
Western Vale.
Tenure Profile by Sub Market Area Figure 6:
Source: Census, 2011
0% 20% 40% 60% 80% 100%
Kidlington
Bicester
Banbury
Rural
N / A
Thame
Henley
Didcot
Wallingford
Rural (all other areas)
Abingdon and City Fringe (Urban)
Abingdon and City Fringe (Rural)
South East Vale (Urban)
South East Vale (Rural)
Western Vale (Urban)
Western Vale (Rural)
Witney
Carterton
Chipping Norton
Rural (All other areas)
Ch
erw
ell
Oxfo
rd
South
Oxfo
rdshire
Vale
of
Wh
ite
Hors
eW
est
Oxfo
rdshire
Owned
Shared ownership(part owned andpart rented)Social rented
Private rented
Living rent free

Oxfordshire Strategic Housing Market Assessment: April 2014
GL Hearn Page 23 of 188
J:\Planning\Job Files\J029822 - Oxfordshire SHMA\Reports\Final SHMA Report (11.04.14).docx
Generally, there is a slightly higher proportion of detached housing in the southern part of the 2.29
county (36%) compared with north (32%) with greater terraced housing in the north.
In the Kidlington, Cherwell Rural, South Oxfordshire Rural and Abingdon and City Fringe Rural Sub-2.30
Market Areas more than 75% of households are owner occupiers.
House Types by Submarket Area Figure 7:
Source: Census, 2011
The profile of housing sizes in the northern and southern part of the HMA is similar although the 2.31
southern part of the HMA has a slightly higher proportion of larger properties (30% of properties
have 4 or more bedrooms compared to 25% in the northern part of the HMA and 20% in Oxford).
The southern part of the HMA has 30% of properties over 4 bedrooms compared with 25% in the
northern part of the HMA (and 20% in Oxford). There are few 1 bed dwellings in the rural submarket
areas with most rural areas having 3 dwellings or above.
0% 50% 100%
Kidlington
Bicester
Banbury
Rural
N / A
Thame
Henley
Didcot
Wallingford
Rural (all other areas)
Abingdon and City Fringe (Urban)
Abingdon and City Fringe (Rural)
South East Vale (Urban)
South East Vale (Rural)
Western Vale (Urban)
Western Vale (Rural)
Witney
Carterton
Chipping Norton
Rural
Ch
erw
ell
Oxfo
rd
South
Oxfo
rdshire
Vale
of
Wh
ite
Hors
eW
est
Oxfo
rdshire
Detached
Semi detached
Terraced
Flat / Maisonette / Other

Oxfordshire Strategic Housing Market Assessment: April 2014
GL Hearn Page 24 of 188
J:\Planning\Job Files\J029822 - Oxfordshire SHMA\Reports\Final SHMA Report (11.04.14).docx
Size of Homes by Sub Area Figure 8:
Source: Census (2011)
Specialist Housing Provision for Older People
Across Oxfordshire there is a supply of over 6,600 homes focused towards meeting the needs of 2.32
older households. In addition to this there are almost 4,400 bedspaces in nursing and care homes.
This is focused on meeting the needs of older persons.
This housing offer can be broken down as follows: 2.33
Sheltered Housing: c. 6,000 properties;
Enhanced Sheltered Housing: 285 properties;
Extra Care Housing: 322 properties.
Table 6 sets out how this is broken down by tenure and local authority. 2.34
It should be noted that not all existing specialist housing for older people is fit-for-purpose. It is likely 2.35
that some may require replacement or remodelling over the period to 2031. Replacement provision
for accommodation which is not fit-for-purpose would be additional to that needed to support the
growing population of older persons.
0% 20% 40% 60% 80%100%
Kidlington
Bicester
Banbury
Rural
N / A
Thame
Henley
Didcot
Wallingford
Rural (all other areas)
Abingdon and City Fringe…
Abingdon and City Fringe (Rural)
South East Vale (Urban)
South East Vale (Rural)
Western Vale (Urban)
Western Vale (Rural)
Witney
Carterton
Chipping Norton
RuralC
herw
ell
Oxfo
rdS
outh
Oxfo
rdshire
Vale
of
Wh
ite
Ho
rse
West
Oxfo
rdshir
e
1 bedroom
2 bedrooms
3 bedrooms
4 bedrooms
5 or more bedrooms

Oxfordshire Strategic Housing Market Assessment: April 2014
GL Hearn Page 25 of 188
J:\Planning\Job Files\J029822 - Oxfordshire SHMA\Reports\Final SHMA Report (11.04.14).docx
Stock of Specialist Housing for Older People, 2012 Table 6:
Cherwell Oxford South
Oxon VoWH
West
Oxon County
Sheltered Housing: Rent 1,244 1,034 983 467 91 3,819
Sheltered Housing: Lease 526 349 454 375 503 2,207
Enhanced Sheltered: Rent 0 0 0 64 0 64
Enhanced Sheltered: Lease 61 0 35 105 20 221
All Sheltered 1,831 1,383 1,472 1,011 614 6,311
Extra Care: Rent 130 152 40 0 0 322
Extra Care: Lease 0 0 0 0 0 0
All Extra Care 130 152 40 0 0 322
Residential Care 236 264 288 243 275 1,306
Nursing Care 642 409 653 558 808 3,070
All Registered Care 878 673 941 801 1083 4,376
Source: Housing LIN
Key Messages
The housing offer in Oxfordshire as a whole is moderately biased towards larger, higher value 2.36
homes relative to the South East as a whole. A key feature is the above average proportion owner
occupation compared to both regional and national averages.
However the housing offer differs geographically within the HMA. The offer in most areas is 2.37
dominated by largely private, family-sized stock with above average representation of 3+ bedroom
and semi-detached/detached properties.
Oxford is however the exception. The City stands out as a having a particularly distinct housing 2.38
offer focused more towards smaller properties (with 43% 1 and 2 bed and a third flats) and with
much greater renting (both private and social renting) and therefore lower owner occupation (50%).
In contrast the rural parts of the county have a housing offer which is focused much more towards
larger, higher value properties which are privately owned.
Outside of Oxford, the north of the county generally has a housing offer focused slightly more 2.39
towards ‘mid market’ housing (with larger levels of 3-bed properties); whilst the south of the County
has more larger homes of with 4+ bedrooms.

Oxfordshire Strategic Housing Market Assessment: April 2014
GL Hearn Page 26 of 188
J:\Planning\Job Files\J029822 - Oxfordshire SHMA\Reports\Final SHMA Report (11.04.14).docx

Oxfordshire Strategic Housing Market Assessment: April 2014
GL Hearn Page 27 of 188
J:\Planning\Job Files\J029822 - Oxfordshire SHMA\Reports\Final SHMA Report (11.04.14).docx
3 HOUSING MARKET DYNAMICS & MARKET SIGNALS
This section seeks to analyse housing market dynamics using a combination of quantitative and 3.1
qualitative research and to consider market signals relating to the supply-demand balance for
housing. It considers market signals relating to housing costs, land prices and affordability which
are relevant in considering whether there is evidence that household formation has been
constrained. The analysis also reviews market signals relating to housing demand in different areas
and for different types of homes.
Our research has highlighted that the housing market is significantly influenced by macro-economic 3.2
drivers and thus this is a suitable starting point for considering housing market dynamics.
Overview of the UK Housing Market and Economy
Conceptual Framework
It is important to understand that the housing market is influenced by macro-economic factors, as 3.3
well as the housing market conditions at a regional and local level. There are a number of key
influences on housing demand, which are set out in the chart below (Figure 9).
Understanding Housing Demand Figure 9:
Source: GL Hearn
Demand Influences
Existing Stock & Market
Quality of Place
Employment & Earnings
Access to Finance
Demographic Changes
Accessibility to
Employment Centres

Oxfordshire Strategic Housing Market Assessment: April 2014
GL Hearn Page 28 of 188
J:\Planning\Job Files\J029822 - Oxfordshire SHMA\Reports\Final SHMA Report (11.04.14).docx
The housing market is complex. It is influenced by the economy at both a macro-economic level, in 3.4
terms of interest rates and mortgage availability, as well as market sentiment (which is influenced
by economic performance and prospects at the macro-level).
It is also influenced by the economy at both regional and local levels, recognising that employment 3.5
trends will influence migration patterns (as people move to and from areas to access jobs), and that
the nature of employment growth and labour demand will influence changes in earnings (which
influences affordability).
Critically for strategic planning purposes, housing demand over the longer-term is particularly 3.6
influenced by population and economic trends. Changes in the size and structure of the population
directly influence housing need and demand, and the nature of demand for different housing
products. Economic performance influences migration between different areas and household
wealth.
There are then a number of factors which play out at a more local level, within a functional housing 3.7
market and influence demand in different locations. These include:
quality of place and neighbourhood character;
school performance and the catchments of good schools;
the accessibility of areas including to employment centres (with transport links being an
important component of this); and
the existing housing market and local market conditions.
These factors influence the demand profile and pricing within the local housing markets and sub-3.8
areas identified, against a context in which households compete within the market for housing.
Local housing markets or sub-markets are though also influenced by dynamics in surrounding 3.9
areas, in regard to the relative balance between supply and demand in different markets; and the
relative pricing of housing within them. Understanding relative pricing and price trends is thus
important.
Understanding the Macro-Level Dynamics
Much has been written over the last few years about economic performance and outlook. The UK 3.10
economy, as well as a number of the major global economies, experienced an economic recession
which lasted six quarters from Q3 2008 until the end of 2009. The economy began to recover in
2010.
Economic recovery since 2010 has been relatively weak. As Figure 10 indicates during the course 3.11
of 2012 there was minimal growth in the UK economy. However, the outlook in 2013 looks to be

Oxfordshire Strategic Housing Market Assessment: April 2014
GL Hearn Page 29 of 188
J:\Planning\Job Files\J029822 - Oxfordshire SHMA\Reports\Final SHMA Report (11.04.14).docx
more positive and emerging evidence is pointing both towards improved economic confidence and
performance.
UK Economic Growth, 2007-2013 Figure 10:
Source: ONS
One of the key triggers to the recent economic difficulties on an international level was the ‘credit 3.12
crunch.’ The downturn in the world economy was led by the sub-prime lending crisis in the United
States. This resulted in a fundamental shift in the way banks lend money between themselves,
through wholesale money markets, and to their customers (including home purchasers, landlords
and developers).
From the second half of 2007, banks begun to increase the inter-bank lending rate (LIBOR) and 3.13
sought to adjust their exposure to risk by adopting much more cautious lending practices. The net
effect of this was to reduce liquidity in the financial markets and credit available (resulting in a ‘credit
crunch’) and in tightening lending criteria for current and prospective homeowners. This tightening
of lending criteria increased ‘barriers’ to entry for marginal mortgage applicants by reducing loan to
value ratios (LTVs), increasing costs associated with obtaining mortgages and reducing the income
multiples accepted.
The tight lending criteria initiated by the credit crunch has continued to have an impact on mortgage 3.14
lending over the last four years, with households’ ability to obtain mortgage finance functioning as a
notable constraint on effective demand for market homes. The impact has been notable on first-
time buyers in particular.
During the course of 2013 the housing market has however begun to improve. Loans for home 3.15
purchase in November 2013 were 15% higher than a year previously across the UK.
-6.0
-4.0
-2.0
0.0
2.0
4.0
6.0
8.0
2001 Q
1
2001 Q
3
2002 Q
1
2002 Q
3
2003 Q
1
2003 Q
3
2004 Q
1
2004 Q
3
2005 Q
1
2005 Q
3
2006 Q
1
2006 Q
3
2007 Q
1
2007 Q
3
2008 Q
1
2008 Q
3
2009 Q
1
2009 Q
3
2010 Q
1
2010 Q
3
2011 Q
1
2011 Q
3
2012 Q
1
2012 Q
3
2013 Q
1Perc
enta
ge c
hange
Change on previous quarter (%) Change on corresponding quarter previous year (%)

Oxfordshire Strategic Housing Market Assessment: April 2014
GL Hearn Page 30 of 188
J:\Planning\Job Files\J029822 - Oxfordshire SHMA\Reports\Final SHMA Report (11.04.14).docx
The average loan-to-value ratio for first-time buyers remains at 80% (at November 2013) - notably 3.16
higher than levels pre-2008 but an improvement on the last few years. There has however been a
gradual increase in the proportion of first-time buyers with a deposit of 10% or less. In total lending
to first-time buyers nationally in November 2013 was 37% up on the previous year. The average
income multiple was 3.35, with households spending on average 19.1% of gross income to cover
capital and interest payments. The typical income of a first-time buyer nationally was £36,000.
Gross mortgage lending remains below levels pre-2007, but improved in 2013 on the previous year. 3.17
Trends in Gross Mortgage Lending, UK Figure 11:
Source: Council for Mortgage Lenders
Key issues affecting the ability of households and investors to secure mortgage finance are: 3.18
Savings and Capital: the ability to raise a deposit;
Earnings and Interest Rates: affecting the ability to afford repayments;
Lending Criteria: key criteria which have to be met to secure finance.
For those with a sufficient deposit, housing has become relatively more affordable given the 3.19
reductions in the value of homes since the peak of the market in 2007 in many areas and low
interest rates in many areas in the UK. Interest rates over most of this period have been low by
historical standards. Figure 12 tracks interest rates over the period since 2007.
Indeed, since March 2009, the Bank of England Base Rate has been just 0.5% - as low as it has 3.20
even been. This compares for instance to a Base Rate of between 10.4% - 13.4% in 1991. The
Bank of England has also indicated that it will not raise the base rate until employment falls below
7%.
0
50,000
100,000
150,000
200,000
250,000
300,000
350,000
400,000
2002 2003 2004 2005 2006 2007 2008 2009 2010 2011 2012 2013e
Gro
ss M
ort
gage L
endin
g (
£m
)

Oxfordshire Strategic Housing Market Assessment: April 2014
GL Hearn Page 31 of 188
J:\Planning\Job Files\J029822 - Oxfordshire SHMA\Reports\Final SHMA Report (11.04.14).docx
Interest Rates, 1997-2013 Figure 12:
Source: Bank of England Statistics
Figure 13 assesses long-term trends in the balance between housing costs and incomes as an 3.21
indicator of the affordability of market housing. It considers the cost of mortgage payments as a
percentage of monthly income.
With reductions in house prices and low interest rates, market housing is now as affordable as it 3.22
was in the late 1990s on this measure. Mortgage repayments are on average 35.0% of (gross)
household income in the South East (and 27.8% across the UK) as at Q1 2013. This is significantly
down on the peak of the market in Q3 2008 when mortgage repayments were on average 53.6% of
gross income across the region. Indeed affordability on this measure is similar to levels in the
region in 1998.
0
1
2
3
4
5
6
7
8
9
1001
-Jan
-97
01
-Sep
-97
01
-May-9
8
01
-Jan
-99
01
-Sep
-99
01
-May-0
0
01
-Jan
-01
01
-Sep
-01
01
-May-0
2
01
-Jan
-03
01
-Sep
-03
01
-May-0
4
01
-Jan
-05
01
-Sep
-05
01
-May-0
6
01
-Jan
-07
01
-Sep
-07
01
-May-0
8
01
-Jan
-09
01
-Sep
-09
01
-May-1
0
01
-Jan
-11
01
-Sep
-11
01
-May-1
2
01
-Jan
-13
01
-Sep
-13
Inte
rest
Rate
(%
)
Tracker Mortgage Variable Rate Tracker

Oxfordshire Strategic Housing Market Assessment: April 2014
GL Hearn Page 32 of 188
J:\Planning\Job Files\J029822 - Oxfordshire SHMA\Reports\Final SHMA Report (11.04.14).docx
Mortgage Payments as a % of Monthly Income Figure 13:
Source: Halifax House Price Index
Thus the key constraint on the market is not the affordability of housing (in terms of the ability of 3.23
households to cover mortgage repayments10
), but the ability of households to raise a sufficient
deposit and to meet lending criteria to secure mortgage finance.
Sales of homes are however not just influenced by first-time buyers and those trading up or down 3.24
within the housing market. They are influenced by investment activity – properties bought to be
rented privately.
The buy-to-let sector continues to grow, with the Council for Mortgage Lenders indicating that by 3.25
the end of March 2013 buy-to-let lending accounted for 13.4% of total outstanding mortgage lending
in the UK - up from 13% the previous quarter and 12.9% at the end of the first quarter of 2012. This
is partly related by improved access to finance. The latest data from November 2013 indicates that
buy-to-let mortgage advances have increased month-on-month since May 2013.
With growth in rents over the last few years and lower capital costs for house purchases, housing 3.26
represents an improved investment proposition. There is evidently occupier demand from a
combination of demographics, limited new-build and restrictions on home purchases.
Despite wider economic conditions, mortgage possessions have been falling (no doubt supported 3.27
by low interest rates). The Council of Mortgage Lenders in February 2013 stated that the number of
10
Notwithstanding that there are likely to be some repossessions associated with high unemployment
0.0
20.0
40.0
60.0
80.0
100.0
120.0
19
83
Q1
19
84
Q2
19
85
Q3
19
86
Q4
19
88
Q1
19
89
Q2
19
90
Q3
19
91
Q4
19
93
Q1
19
94
Q2
19
95
Q3
19
96
Q4
19
98
Q1
19
99
Q2
20
00
Q3
20
01
Q4
20
03
Q1
20
04
Q2
20
05
Q3
20
06
Q4
20
08
Q1
20
09
Q2
20
10
Q3
20
11
Q4
20
13
Q1
Mo
rtga
ge P
aym
ents
as
% o
f In
com
e
South East UK

Oxfordshire Strategic Housing Market Assessment: April 2014
GL Hearn Page 33 of 188
J:\Planning\Job Files\J029822 - Oxfordshire SHMA\Reports\Final SHMA Report (11.04.14).docx
possessions, held by lenders in 2012, was at the lowest level for 5 years. 11
The trend in mortgage
arrears is also downwards.
Housing Demand Indicators in Oxfordshire
House Prices
Table 7 profiles median house prices in Q3 2012. The average house price in Oxfordshire was 3.28
almost a third (32%) above the national average indicating strong relative housing demand. Within
the County, the highest median house prices are in Oxford (at £40,000 above the County average
despite a stock mix focused more towards smaller homes). House prices are below the county
average in West Oxfordshire and particularly Cherwell.
Median House Prices, Q3 2012 Table 7:
Median House Price Differential to Oxfordshire Average
Cherwell £216,500 -£33,500
Oxford £290,000 £40,000
South Oxfordshire £286,975 £36,975
Vale of White Horse £270,000 £20,000
West Oxfordshire £245,000 -£5,000
Oxfordshire £250,000 £0
England £190,000 -£60,000
Source: HM Land Registry/ CLG Table 582
Figure 14 below profiles the house prices in the pre-recession decade. The median house price 3.29
increased by an average of 184% across Oxfordshire over this period (from an already above
average starting point). This compares to the 188% growth in prices recorded in the South East and
186% in England.
Within Oxfordshire, median house prices increased more than 200% in South Oxfordshire (222%) 3.30
and Cherwell (200%). House prices increased to a lesser extent in Oxford (184%), the Vale of
White Horse (169%) and West Oxfordshire (157%).
Strong house price growth over the pre-recession decade suggests that supply fell notably short of 3.31
demand over this period. In effect market conditions supported strong demand, and growth in
supply could not keep pace. Low interest rates, macro-economic stability and availability of
mortgage finance supported this.
11
https://www.cml.org.uk/cml/media/press/3422

Oxfordshire Strategic Housing Market Assessment: April 2014
GL Hearn Page 34 of 188
J:\Planning\Job Files\J029822 - Oxfordshire SHMA\Reports\Final SHMA Report (11.04.14).docx
Median House Price Trends, 1998 – 2007 Figure 14:
Source: HM Land Registry / CLG.
Since 2007, trends in median house prices have been quite different, as Figure 15 demonstrates. 3.32
Across Oxfordshire we have seen median house prices grow by 3.0%, compared to 8.6% growth
across England. This is however likely to have been influenced by changes in the mix of homes
sold over this period; with a greater emphasis on family properties being bought by older buyers
with equity in their existing homes. The lower end of the market is likely to have been more
significantly affected by changes to the availability of mortgage finance since the credit crunch.
Median House Price Trends, 2008-2012 Figure 15:
Source: HM Land Registry / CLG.
0
50,000
100,000
150,000
200,000
250,000
300,000
350,000
Q1
Q3
Q1
Q3
Q1
Q3
Q1
Q3
Q1
Q3
Q1
Q3
Q1
Q3
Q1
Q3
Q1
Q3
Q1
Q3
1998 1999 2000 2001 2002 2003 2004 2005 2006 2007
Media
n H
ouse P
rice,
£
Oxfordshire
Cherwell
Oxford
South Oxfordshire
Vale of White Horse
West Oxfordshire
South East
England
0
50,000
100,000
150,000
200,000
250,000
300,000
350,000
Q1
Q2
Q3
Q4
Q1
Q2
Q3
Q4
Q1
Q2
Q3
Q4
Q1
Q2
Q36
Q4
Q1
Q2
Q3
2008 2009 2010 2011 2012
Oxfordshire
Cherwell
Oxford
South Oxfordshire
Vale of White Horse
West Oxfordshire
South East
England

Oxfordshire Strategic Housing Market Assessment: April 2014
GL Hearn Page 35 of 188
J:\Planning\Job Files\J029822 - Oxfordshire SHMA\Reports\Final SHMA Report (11.04.14).docx
Over the 2008-12 period in absolute terms the strongest growth has been in Vale of White Horse 3.33
(with median prices increasing by £25,000) followed by West Oxfordshire (a £20,000 increase).
Prices in Cherwell have though also grown, increasing by £16,500. In all of these areas price
growth has exceeded that nationally.
Median House Price Trends, 2008 – 2012 Table 8:
Q3 2008 Q3 2012 % Change
Cherwell £200,000 £216,500 8.3%
Oxford £280,000 £290,000 3.6%
South Oxfordshire £273,000 £286,975 5.1%
Vale of White Horse £250,000 £270,000 8.0%
West Oxfordshire £220,000 £245,000 11.4%
Oxfordshire £242,750 £250,000 3.0%
England £175,000 £190,000 8.6%
Source: HM Land Registry
House prices are however influenced by the mixture of homes sold. House prices are notably 3.34
higher for detached houses across all authorities relative to other property types.
Relative prices are also higher in Oxford than in the other authorities within the HMA. There is a 3.35
particular premium for detached stock (for which the supply is low, as set out in Section 2) in the
City. Market signals thus suggest proportionally stronger demand for detached homes in the City.
In relative terms, house prices (and thus relative demand for market housing) is more modest in 3.36
Cherwell District.
The analysis also points to relatively weaker prices for flatted accommodation in Cherwell and West 3.37
Oxfordshire, suggesting a more limited flatted market in these areas. In these authorities, Banbury
and Chipping Norton are the only areas where more than 15% of the housing stock is flatted.

Oxfordshire Strategic Housing Market Assessment: April 2014
GL Hearn Page 36 of 188
J:\Planning\Job Files\J029822 - Oxfordshire SHMA\Reports\Final SHMA Report (11.04.14).docx
House Prices by Type Figure 16:
Source: HM Land Registry October 2012 – March 2013
Sales Volumes
Sales volumes provide an indication of changes in effective demand for market housing over time. 3.38
Figure 17 benchmarks annual sales across the Oxfordshire and wider geographies over the 1998-
2011 period. 2011 is the latest data currently available consistently at a local authority level. It uses
an index where 1 is the average annual sales over the 1998-2007 decade (prior to the credit
crunch).
The chart shows that the credit crunch resulted in a substantial reduction in effective demand, with 3.39
sales broadly halving. Between 2009-2011 we saw only a modest recovery. In 2011 sales across
the HMA were 40% down on the pre-2007 annual average. This compares with a 44% reduction
across England, suggesting that the market in the Oxfordshire has out-performed wider areas.
The trend in sales/ effective demand across the five authorities making up the HMA has been 3.40
similar – highlighting the influence of macro-economic factors on housing demand.
The market in Oxford, South Oxfordshire and Vale of White Horse appears to have recovered more 3.41
strongly relative to other parts of the HMA and the market nationally since 2009.
£-
£100,000
£200,000
£300,000
£400,000
£500,000
£600,000
£700,000
£800,000
£900,000
Detached SemiDetached
Terraced Flats
Av
era
ge H
ou
se P
rice
Cherwell
Oxford
South Oxfordshire
Vale of White Horse
West Oxfordshire

Oxfordshire Strategic Housing Market Assessment: April 2014
GL Hearn Page 37 of 188
J:\Planning\Job Files\J029822 - Oxfordshire SHMA\Reports\Final SHMA Report (11.04.14).docx
Quarterly Sales Index, 1998 – 2011 Figure 17:
Source: HM Land Registry / CLG
Whilst local authority-level data is not available, we can use the Land Registry’s House Price Index 3.42
to track more recent trends in sales for the HMA as a whole. This highlights the upturn in effective
demand for housing during the course of 2013; but indicates that sales volumes remain below pre-
credit crunch levels.
0.00
0.20
0.40
0.60
0.80
1.00
1.20
1.40
19
98
19
99
20
00
20
01
20
02
20
03
20
04
20
05
20
06
20
07
20
08
20
09
20
10
20
11
Index (
1 =
Avera
ge A
nnual S
ale
s 1
998
-2007)
Oxfordshire
Cherwell
Oxford
South Oxfordshire
Vale of White Horse
West Oxfordshire
South East
England

Oxfordshire Strategic Housing Market Assessment: April 2014
GL Hearn Page 38 of 188
J:\Planning\Job Files\J029822 - Oxfordshire SHMA\Reports\Final SHMA Report (11.04.14).docx
Sales Trends, Oxfordshire 2003-13 Figure 18:
Source: HM Land Registry House Price Index/ GL Hearn
The make-up of housing sales in terms of the type of unit varies between authorities, in part 3.43
reflecting the stock profile. Sales of detached and semi-detached housing accounts for
approximately a third of sales in all authorities except Oxford where detached housing makes up a
low proportion of stock (9%).
The proportion of terraced sales varies from 27–-39% with Oxford accounting for the highest 3.44
proportion of terraced housing sales. Flatted sales are the smallest contributor to overall sales
across the Oxfordshire HMA; however, there is some variation between authorities. In Cherwell, flat
sales account for less than 10% whilst in Oxford they account for over a quarter. This is again likely
to be a function of the stock profile and the turnover of stock in these areas.
The recession and market downturn appears to have impacted disproportionately on the sale of 3.45
flats across much of the country, particularly owing to the reliance of these types of developments
on young and first time buyers and to some extent the investment market.
0
200
400
600
800
1000
1200
1400
1600
01
/10
/200
3
01
/03
/200
4
01
/08
/200
4
01
/01
/200
5
01
/06
/200
5
01
/11
/200
5
01
/04
/200
6
01
/09
/200
6
01
/02
/200
7
01
/07
/200
7
01
/12
/200
7
01
/05
/200
8
01
/10
/200
8
01
/03
/200
9
01
/08
/200
9
01
/01
/201
0
01
/06
/201
0
01
/11
/201
0
01
/04
/201
1
01
/09
/201
1
01
/02
/201
2
01
/07
/201
2
01
/12
/201
2
01
/05
/201
3
01
/10
/201
3
Mo
nth
yl S
ale
s

Oxfordshire Strategic Housing Market Assessment: April 2014
GL Hearn Page 39 of 188
J:\Planning\Job Files\J029822 - Oxfordshire SHMA\Reports\Final SHMA Report (11.04.14).docx
Percentage of Sales by Type, 2012-13 Figure 19:
Source: HM Land Registry October 2012 – March 2013
Rental Trends
Over the 2008-2013 period the credit crunch, economic recession and wider market downturn have 3.46
restricted households’ ability and appetite to buy a home. First-time buyer levels have been low
(relative to pre-2008 levels) albeit that levels of first-time buyers have increased in 2012 and 201312
.
Linked to this, demand for rented homes has increased.
Figure 20 benchmarks rental trends at a regional and national level. It shows that private housing 3.47
rental prices have increased quite significantly in the South East over the last 7 years; and that
rental growth has been above average in the region over the last 2.5 years. Between May 2005 and
May 2013, rents have increased slightly more in the South East (7.6%) compared with England
excluding London (7.2%).
12
Council for Mortgage Lenders (Jan 2014) Continued year-on-year home-owner house purchase growth in November
29%
8%
30% 32% 28%
30%
27%
24% 25%
26%
32%
39%
27% 25% 30%
9%
27% 18% 17% 16%
0%
10%
20%
30%
40%
50%
60%
70%
80%
90%
100%
Cherwell Oxford SouthOxfordshire
Vale of WhiteHorse
WestOxfordshire
Flats
Terraced
Semi Detached
Detached

Oxfordshire Strategic Housing Market Assessment: April 2014
GL Hearn Page 40 of 188
J:\Planning\Job Files\J029822 - Oxfordshire SHMA\Reports\Final SHMA Report (11.04.14).docx
Experimental Index of Private Housing Rental Prices Figure 20:
Source: ONS
We have used data recorded by the Valuation Office Agency (VOA) to consider how private rents 3.48
vary geographically across Oxfordshire for different sizes of property. The analysis provides
information on rents over the year to December 2013, indicating:
Rooms for Rent: Rooms are the cheapest accommodation to rent with a median rent of £425
per month. The highest rents were in Oxford at £475 per calendar month (PCM), with rents in
the other Oxfordshire authorities varying from £390 PCM in Cherwell to £412 in the Vale of
White Horse. In all cases these are above the South East average of £370 PCM;
Studios: The average rent for a studio was 29% higher than that for a room at £550 PCM
across Oxfordshire. Again Oxford is the most expensive with a median rent of £625 PCM.
Median rents in the other districts varied from £425 PCM in Cherwell, to between £493 in
Cherwell and £545 in the Vale of White Horse;
1-bed Properties: The median rents for 1-bed properties across Oxfordshire was £725 in 2013.
Rents were lowest in Cherwell at £595 (consistent to the South East average) and highest in
Oxford at £825 pcm (at above 30-40% above those for studios).
90.0
92.0
94.0
96.0
98.0
100.0
102.0
104.0
Jan
Jul
Jan
Jul
Jan
Jul
Jan
Jul
Jan
Jul
Jan
Jul
Jan
Jul
Jan
Jul
Jan
2005 2006 2007 2008 2009 2010 2011 20122013
(nd
ex J
an
uary
2011=
100)
South East
England excluding London

Oxfordshire Strategic Housing Market Assessment: April 2014
GL Hearn Page 41 of 188
J:\Planning\Job Files\J029822 - Oxfordshire SHMA\Reports\Final SHMA Report (11.04.14).docx
Private Rents (2013), Rooms, Studios and One-Bed Properties Figure 21:
Source: VOA Private Rental Statistics
Looking at larger property types, the following is evident: 3.49
2-bed Properties: We see a similar pattern with 2-bed properties with the lowest median rents
in Cherwell at £728 PCM, the highest rents in Oxford at £975 PCM and median rents of
between £775-825 PCM in the other districts;
3-bed Properties: Three bed properties in Oxford have a median rent of £1,200 PCM. In
Cherwell median rents were £895 PCM, with values of between £950-1000 PCM in the other
authorities.
4+ Bed Properties: We see a greater divergence of rents for the larger family homes with 4+
bedrooms with rents varying from between £1,300 PCM in Cherwell to £1,450 in West
Oxfordshire and £15-25-£1550 in the Vale and South Oxfordshire; through to £1,800 PCM in
Oxford.
0
100
200
300
400
500
600
700
800
900
Room Studio 1-Bed
Med
ian
Ren
t £ P
CM
Cherwell
Oxford
South Oxfordshire
Vale of White Horse
West Oxfordshire
Oxfordshire
South East
England

Oxfordshire Strategic Housing Market Assessment: April 2014
GL Hearn Page 42 of 188
J:\Planning\Job Files\J029822 - Oxfordshire SHMA\Reports\Final SHMA Report (11.04.14).docx
Private Rents (2013), Properties with 2 or More Bedrooms Figure 22:
Source: VOA Private Rental Statistics
Rents in Oxford are some of the highest for an area which is outside of London and the surrounding 3.50
counties in its immediate commuter belt (Surrey, Herefordshire and parts of Berkshire and
Buckinghamshire). These are similar to those in Brighton and Hove.
Across most parts of the HMA, rents are above the South East average across property types. The 3.51
exceptions to this are properties in Cherwell (which are below average for rooms, 2-bed and 4+ bed
properties, and similar for other property sizes), and 4+ bed properties to rent in West Oxfordshire.
Figure 23 shows growth in median rents between 2011 and 2013 by property type and area. The 3.52
VOA data only records trends back to 2011. Over this two year period rents increased for most
property sizes across all the Oxfordshire local authorities, the exceptions being a reduction in
values for studio properties in Cherwell (and to a modest extent in the Vale of White Horse), and for
properties with four or more bedrooms in South Oxfordshire.
0
200
400
600
800
1,000
1,200
1,400
1,600
1,800
2,000
2-Bed 3-Bed 4+ Bed
Med
ian
Ren
t £ P
CM
Cherwell
Oxford
South Oxfordshire
Vale of White Horse
West Oxfordshire
Oxfordshire
South East
England

Oxfordshire Strategic Housing Market Assessment: April 2014
GL Hearn Page 43 of 188
J:\Planning\Job Files\J029822 - Oxfordshire SHMA\Reports\Final SHMA Report (11.04.14).docx
Trends in Median Private Rents, 2011 – 2013 Figure 23:
Source: VOA Private Rental Statistics
The data highlights stronger comparative growth in rents in Oxford for studios (reflecting the lower 3.53
base) and for 4+ bed properties. In Cherwell it suggests stronger comparative rental growth than in
other parts of the HMA with the exception of Oxford. In South Oxfordshire it points towards rental
growth for most property types except 4+ bed homes, but with stronger growth for studio and 2-bed
homes. In the Vale of White Horse it suggests a particular growth in rents for 4+ bed homes. In
West Oxfordshire it points to the strongest growth in rents being for 3- and 4+ bed homes.
Figure 24 below plots the VOA data on the number of rental transactions recorded. This does not 3.54
record all transactions but does provide an indication of the relative distribution of transactions by
local authority and property size. It highlights that Oxford has a comparatively larger rental market,
followed by Cherwell, relative to the other authorities.
The distribution of rents recorded by property size across the local authorities is similar, with 2-bed 3.55
properties representing the greatest proportion of overall lettings.
-15%
-10%
-5%
0%
5%
10%
15%
20%
25%
Oxfordshire Cherwell Oxford SouthOxfordshire
Vale ofWhite Horse
WestOxfordshire
% G
row
th in
Ren
ts,
2011
-13
Room
Studio
1-Bed
2-bed
3-Bed
4+ Bed
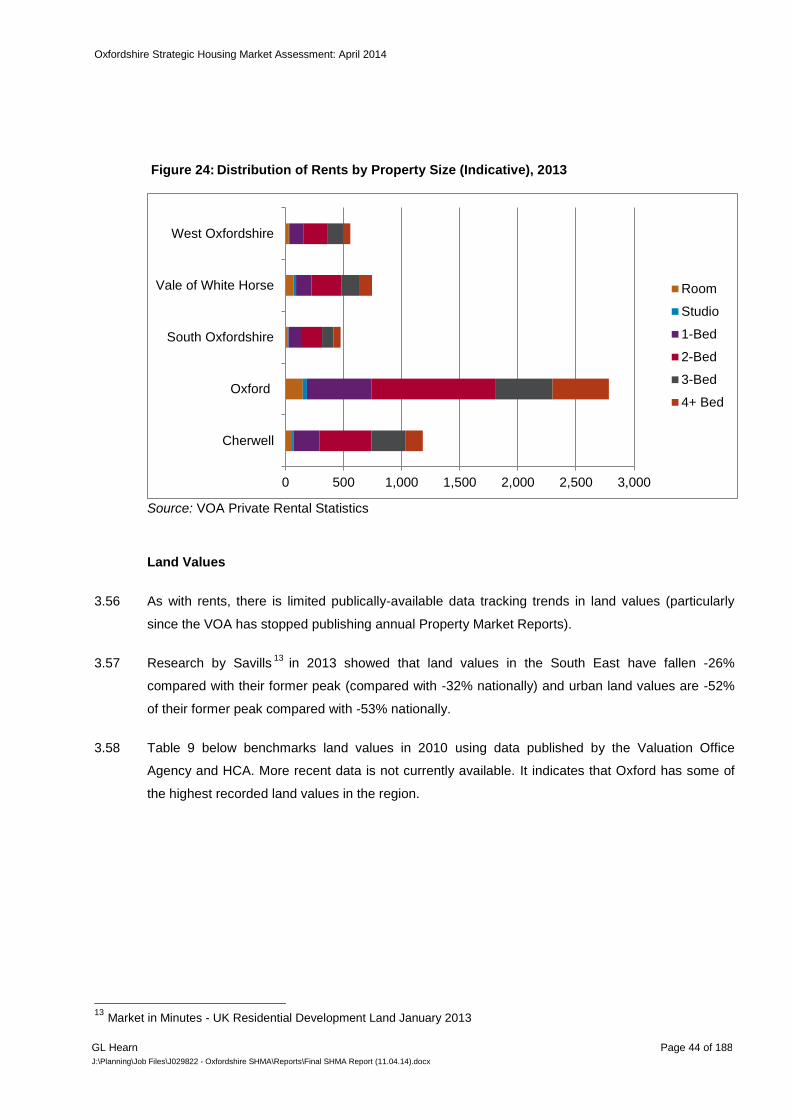
Oxfordshire Strategic Housing Market Assessment: April 2014
GL Hearn Page 44 of 188
J:\Planning\Job Files\J029822 - Oxfordshire SHMA\Reports\Final SHMA Report (11.04.14).docx
Distribution of Rents by Property Size (Indicative), 2013 Figure 24:
Source: VOA Private Rental Statistics
Land Values
As with rents, there is limited publically-available data tracking trends in land values (particularly 3.56
since the VOA has stopped publishing annual Property Market Reports).
Research by Savills13
in 2013 showed that land values in the South East have fallen -26% 3.57
compared with their former peak (compared with -32% nationally) and urban land values are -52%
of their former peak compared with -53% nationally.
Table 9 below benchmarks land values in 2010 using data published by the Valuation Office 3.58
Agency and HCA. More recent data is not currently available. It indicates that Oxford has some of
the highest recorded land values in the region.
13
Market in Minutes - UK Residential Development Land January 2013
0 500 1,000 1,500 2,000 2,500 3,000
Cherwell
Oxford
South Oxfordshire
Vale of White Horse
West Oxfordshire
Room
Studio
1-Bed
2-Bed
3-Bed
4+ Bed
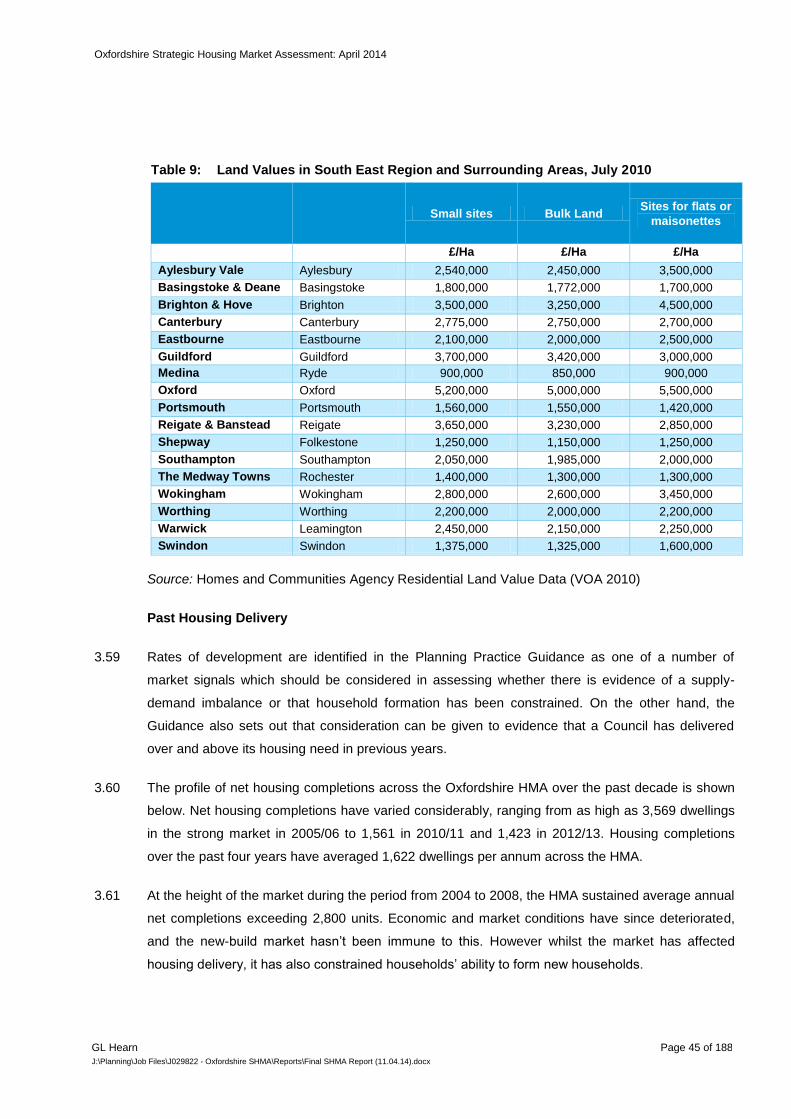
Oxfordshire Strategic Housing Market Assessment: April 2014
GL Hearn Page 45 of 188
J:\Planning\Job Files\J029822 - Oxfordshire SHMA\Reports\Final SHMA Report (11.04.14).docx
Land Values in South East Region and Surrounding Areas, July 2010 Table 9:
Small sites Bulk Land
Sites for flats or
maisonettes
£/Ha £/Ha £/Ha
Aylesbury Vale Aylesbury 2,540,000 2,450,000 3,500,000
Basingstoke & Deane Basingstoke 1,800,000 1,772,000 1,700,000
Brighton & Hove Brighton 3,500,000 3,250,000 4,500,000
Canterbury Canterbury 2,775,000 2,750,000 2,700,000
Eastbourne Eastbourne 2,100,000 2,000,000 2,500,000
Guildford Guildford 3,700,000 3,420,000 3,000,000
Medina Ryde 900,000 850,000 900,000
Oxford Oxford 5,200,000 5,000,000 5,500,000
Portsmouth Portsmouth 1,560,000 1,550,000 1,420,000
Reigate & Banstead Reigate 3,650,000 3,230,000 2,850,000
Shepway Folkestone 1,250,000 1,150,000 1,250,000
Southampton Southampton 2,050,000 1,985,000 2,000,000
The Medway Towns Rochester 1,400,000 1,300,000 1,300,000
Wokingham Wokingham 2,800,000 2,600,000 3,450,000
Worthing Worthing 2,200,000 2,000,000 2,200,000
Warwick Leamington 2,450,000 2,150,000 2,250,000
Swindon Swindon 1,375,000 1,325,000 1,600,000
Source: Homes and Communities Agency Residential Land Value Data (VOA 2010)
Past Housing Delivery
Rates of development are identified in the Planning Practice Guidance as one of a number of 3.59
market signals which should be considered in assessing whether there is evidence of a supply-
demand imbalance or that household formation has been constrained. On the other hand, the
Guidance also sets out that consideration can be given to evidence that a Council has delivered
over and above its housing need in previous years.
The profile of net housing completions across the Oxfordshire HMA over the past decade is shown 3.60
below. Net housing completions have varied considerably, ranging from as high as 3,569 dwellings
in the strong market in 2005/06 to 1,561 in 2010/11 and 1,423 in 2012/13. Housing completions
over the past four years have averaged 1,622 dwellings per annum across the HMA.
At the height of the market during the period from 2004 to 2008, the HMA sustained average annual 3.61
net completions exceeding 2,800 units. Economic and market conditions have since deteriorated,
and the new-build market hasn’t been immune to this. However whilst the market has affected
housing delivery, it has also constrained households’ ability to form new households.

Oxfordshire Strategic Housing Market Assessment: April 2014
GL Hearn Page 46 of 188
J:\Planning\Job Files\J029822 - Oxfordshire SHMA\Reports\Final SHMA Report (11.04.14).docx
Net Completions, Oxfordshire HMA 2002/3 – 2011/12 Figure 25:
Source: Annual Monitoring Reports
Planning Practice Guidance sets out that housing completions should be appraised against planned 3.62
housing supply and against housing need. Housing targets for local authorities within Oxfordshire
were set out within the South East Plan. The development of the South East Plan was informed by
consideration of household projections as well as wider factors including land availability, with the
2004-based Household Projections considered at the Examination in Public.
In determining levels of provision, the South East Plan took into account past under-provision (pre-3.63
2006) where relevant. The South East Plan set out targets for housing provision over the 2006-26
period.
The Planning Practice Guidance sets out that past delivery performance should be considered 3.64
alongside the market signals. Thus in deriving OAN it might provide a basis in some areas for
adjusting the assessment of need. In Oxfordshire the market signals point towards a need for an
upward adjustment to housing provision at the HMA level but not for all districts. These issues are
considered further in Section 9.
It should be remembered that more housing delivery overall will support more affordable delivery 3.65
and workforce growth. Similarly a past shortfall is likely to have increased the affordable backlog;
and market signals case for adjustment. So it would not be appropriate to treat entirely
independently of the affordable needs evidence and market signals in justifying an adjustment.
0
500
1000
1500
2000
2500
3000
3500
4000
20
03/4
20
04/5
20
05/6
20
06/7
20
07/8
20
08/9
20
09/1
0
20
10/1
1
20
11/1
2
20
12/1
3
Net
Co
mp
leti
on
s p
er
An
nu
m
West Oxfordshire
Vale of White Horse
South Oxfordshire
Oxford
Cherwell

Oxfordshire Strategic Housing Market Assessment: April 2014
GL Hearn Page 47 of 188
J:\Planning\Job Files\J029822 - Oxfordshire SHMA\Reports\Final SHMA Report (11.04.14).docx
We have assessed past delivery performance against South East Plan figures for the 2006/7-3.66
2010/11 period; given that SEP included past backlog in determining the housing targets therein;
and 2011 is the base date of the demographic projections considered in this SHMA.
Table 10 indicates that over this period there was a shortfall in supply against planned levels across 3.67
Oxfordshire of 2,279 dwellings. The Strategic Development Area (SDA) is treated separately in this
table, but is included moving forwards as relating to Oxford; in that it was intended on meeting
Oxford’s needs.
Housing delivery in the following districts fell below planned levels: 3.68
Cherwell: 808 dwellings;
South Oxfordshire: 1,398 dwellings; and
Vale of White Horse: 801 dwellings.
Housing delivery exceeded planned levels in Oxford (by 472 dwellings) and in particular in West 3.69
Oxfordshire (by 1,236 dwellings). Delivery of the Strategic Development Area did not commence.
Comparing Past Housing Delivery to SE Plan Targets, 2006/7-2010/11 Table 10:
2006/7-2010/11 Cherwell Oxford SDA South Oxfordshire
Vale of White Horse
West Oxfordshire
Oxfordshire
Target 3,350 2,000 1,000 2,735 2,890 1,825 12,800
Delivery 2,542 2,472 0 1,337 2,089 3,061 11,521
Surplus/Shortfall -808 472 -1,000 -1,398 -801 1,236 -2,279
Source: Monitoring Data/ GL Hearn
As the Guidance recommends, we have also sought to consider how past housing delivery 3.70
compares to housing need. The chart below profiles housing delivery relative to the CLG 2004-
based Household Projections (which informed development of the South East Plan). This analysis
shows that housing delivery in West Oxfordshire exceeded the household projections. In Vale of
White Horse delivery was similar to that projected. In Cherwell, Oxford and South Oxfordshire it fell
short. It should be noted that the household projections are shown to the nearest 1000 homes.

Oxfordshire Strategic Housing Market Assessment: April 2014
GL Hearn Page 48 of 188
J:\Planning\Job Files\J029822 - Oxfordshire SHMA\Reports\Final SHMA Report (11.04.14).docx
Housing Completions relative to 2004-based Household Projections, 2006-11 Figure 26:
Source: CLG 2004-based Household Projections; Monitoring Data
Past relative housing delivery is likely to have influenced more recent trend-based population and 3.71
household projections. Under-delivery of housing across the HMA is likely to have influenced
household formation rates, but also trends in migration. For West Oxfordshire, it is equally true that
population projections are likely to have been influenced by the past above-trend housing delivery
which we would expect to have contributed to stronger relative migration to the District.
Overcrowding and Under-Occupation
Overcrowding is an important market signal. Above average overcrowding is likely to be a reflection 3.72
of either a lack of housing supply (which inhibits new household formation) or an imbalance in the
housing stock. An increase in overcrowding is likely to reflect changing household structures, which
may be influenced by housing costs constraining household formation.
Data about overcrowding is available from the 2011 Census based on the ‘bedroom standard’14
. 3.73
This is defined by the difference between the number of bedrooms needed to avoid undesirable
14
Bedroom standard: The ‘bedroom standard’ is used as an indicator of occupation density. A standard number of bedrooms is
calculated for each household in accordance with its age, sex, and marital status composition of the household and the relationship of the members to one another. A separate bedroom is allowed for each married or cohabiting couple, any other person aged 21 or over, each pair of adolescents aged 10-20 of the same sex, and each pair of children under 10. Any unpaired person aged 10-20 is notionally paired, if possible, with a child under 10 of the same sex, or, if that is not possible, he or she is counted as requiring a separate bedroom, as is any unpaired child under 10. This notional standard number of bedrooms is then compared with the actual number of bedrooms (including bed-sitters) available for
0 500 1000 1500 2000 2500 3000 3500 4000 4500
Cherwell
Oxford
South Oxfordshire
Vale of White Horse
West Oxfordshire
Net Housing Completions Projected Household Growth

Oxfordshire Strategic Housing Market Assessment: April 2014
GL Hearn Page 49 of 188
J:\Planning\Job Files\J029822 - Oxfordshire SHMA\Reports\Final SHMA Report (11.04.14).docx
sharing (given the number, ages and relationships of the household members) and the number of
bedrooms available to the household. A household is defined as overcrowded if there are fewer
bedrooms available than required by the bedroom standard.
Across Oxfordshire, 3.3% of households classified are as overcrowded based on the bedroom 3.74
standard. This is below the regional average of 3.8% and national average of 4.8%. It is partly a
reflection of a housing stock focused more towards larger homes (as considered in Section 2).
However overcrowding is above average in Oxford City, with 6.2% of households classified as 3.75
overcrowded using the bedroom standard. This is likely to reflect a number of factors:
A younger population structure;
The volume of student multi-occupancy lettings in the City15
;
A housing offer focused more towards smaller properties (as described in Section 2); and
Higher housing costs in relative terms.
Outside of Oxford, none of the Oxfordshire authorities have a level of overcrowding which is above 3.76
the national and regional averages.
We have also sought to consider evidence relating to under-occupancy of housing. Households 3.77
who under-occupy homes will have more bedrooms than they would necessarily, need taking
account of the household structure (again using the bedroom standard). In the market sector, many
households under-occupy homes, for instance having ‘guest bedrooms’ or in the case of older
households retaining rooms when children have moved away which provide flexibility to allow
people to come to stay (empty nester and retired households). In the market sector in particular the
size of home which a household occupies typically can relate more to their age and wealth than
necessarily to the number of bedrooms which they might ‘need.’ In affordable housing there is
typically a closer relationship between household size and the size of a home as households are
allocated a home which meets their needs.
The 2011 Census suggests that a significant 73.5% of households in Oxfordshire under-occupy 3.78
homes (using the bedroom standard). This is partly a reflection of market realities, particularly in the
(large) owner occupied sector.
For some of these households, providing attractive smaller properties could be appealing and 3.79
encourage them to downsize. The qualitative research undertaken does suggest that ‘down sizers’
the sole use of the household, and differences are tabulated. Bedrooms converted to other uses are not counted as available unless they have been denoted as bedrooms by the respondents; bedrooms not actually in use are counted unless uninhabitable. Households are said to be overcrowded if they have fewer bedrooms available than the notional number needed. Households are said to be under-occupying if they have two or more bedrooms more than the notional needed. 15
The Council estimate 5,000 HMOs in the City

Oxfordshire Strategic Housing Market Assessment: April 2014
GL Hearn Page 50 of 188
J:\Planning\Job Files\J029822 - Oxfordshire SHMA\Reports\Final SHMA Report (11.04.14).docx
are an important group within the housing market, with households seeking in some instances to
release equity in their homes to fund their lifestyle in retirement.
Overcrowding and Under-Occupation, 2011 Table 11:
Overcrowded Households
% Overcrowded % Under Occupied
Cherwell 1,762 3.1% 74.1%
Oxford 3,447 6.2% 60.5%
South Oxfordshire 1,354 2.5% 77.5%
Vale of White Horse 1,013 2.1% 78.6%
West Oxfordshire 914 2.1% 78.5%
Oxfordshire 8,490 3.3% 73.5%
South East 133,570 3.8% 70.7%
England 1,060,967 4.8% 68.7%
Source: Census (2011)
3.79 As well as looking at current levels of overcrowding, we do need to consider whether overcrowding
has increased: particularly as this might provide some indication of worsening affordability and
supressed household formation. Consistent data using the bedroom standard however isn’t
available.
3.79 Census data also computes a measure of overcrowding using ‘occupancy ratings’ and this allows
comparison between data in the 2011 and 2001 Censuses. Occupancy ratings are a basic measure
of overcrowding: they assume that all households should have one common room and there should
be one additional room for each household member. Therefore a five person household living in a
five room dwelling would be considered as overcrowded. No account is taken of family structures.
The occupancy rating is therefore an imperfect measure; but does allow a broad analysis of
changes in occupancy of housing over the 2001-11 period to be made.
3.79 The analysis of changes in occupancy rating shows that overcrowding on this measure has
increased by 30% in Oxfordshire between 2001-11, but indicates that this is a lower growth than
recorded at either the regional or national level. Whilst this does suggest that a trend towards more
intense occupation of the housing stock (consistent with wider geographies) it does suggest that
this has been mitigated to some degree by the larger than average housing offer in Oxfordshire.
3.79 The analysis shows that over the 2001-11 decade the number of households considered
overcrowded using the occupancy rating increased by around 4,100 (of which the greatest
proportion – 39% - was in Oxford). Given the way that the occupancy ratings are measures, this is
however likely to over-estimate growth in overcrowded households.

Oxfordshire Strategic Housing Market Assessment: April 2014
GL Hearn Page 51 of 188
J:\Planning\Job Files\J029822 - Oxfordshire SHMA\Reports\Final SHMA Report (11.04.14).docx
Changes in Overcrowding using Occupancy Ratings, 2001-11 Table 12:
Overcrowded Households,
2001
Overcrowded Households,
2011
Change, 2001-11
% Change
Cherwell 2604 3461 857 33%
Oxford 6102 7702 1600 26%
South Oxfordshire 1795 2351 556 31%
Vale of White Horse 1795 2416 621 35%
West Oxfordshire 1403 1897 494 35%
Oxfordshire 13699 17827 4128 30%
South East 195392 265974 70582 36%
England 1457512 1928596 471084 32%
Source: Census 2001 and 2011
Affordability of Market Homes
Figure 27 below assesses affordability by making a comparison between house costs and the 3.80
ability to pay house prices. It considers trends in the ratio of lower quartile house prices to lower
quartile incomes. This is Government’s preferred indicator of the affordability of market housing.
The CLG Index clearly shows that the ratio of lower quartile house price to lower quartile earnings is 3.81
higher in Oxfordshire (8.93 in 2011) than in the South East (8.19 in 201116
) and England (6.57),
showing that houses are less affordable.
Trends in LQ Price to Earnings Ratio, 1997-2012 Figure 27:
Source: CLG
16
Data for the South East in 2012 is not available
0.00
2.00
4.00
6.00
8.00
10.00
12.00
19
97
19
98
19
99
20
00
20
01
20
02
20
03
20
04
20
05
20
06
20
07
20
08
20
09
20
10
20
11
20
12
Rati
o o
f lo
wer
qu
art
ile h
ou
se p
rice
to lo
wer
qu
art
ile e
arn
ing
s
Oxford
Vale of White Horse
West Oxfordshire
Oxfordshire
South East
England

Oxfordshire Strategic Housing Market Assessment: April 2014
GL Hearn Page 52 of 188
J:\Planning\Job Files\J029822 - Oxfordshire SHMA\Reports\Final SHMA Report (11.04.14).docx
Table 13 profiles this considering how affordability using this indicator has changed over five-year 3.82
periods. Across Oxfordshire the ratio improved with a reduction of -7% between 2007-12 –
principally reflecting reductions in lower quartile (LQ) housing costs. It fell to the greatest degree in
West Oxfordshire, followed by the Vale of White Horse. However county-wide an in each authority
affordability using this measure remains worse than the national average. Lower quartile house
prices in both Oxford and South Oxfordshire are more than 10 times LQ earnings.
Changes in LQ House Price to Earnings Table 13:
1997-02 2002-7 2007-12 2012 Ratio
Cherwell 76% 32% -7% 8.39
Oxford 60% 27% -4% 10.03
South Oxfordshire 45% 57% -6% 10.75
Vale of White Horse 66% 28% -9% 8.45
West Oxfordshire 44% 33% -16% 8.95
Oxfordshire 56% 32% -7% 9.00
England 25% 63% -9% 6.59
Source: CLG
Between 1997-2002 the affordability of market housing in Oxfordshire deteriorated significantly, to a 3.83
greater extent than across England. Since 2005 levels have been fairly stable – in that whilst we
have seen no significant further deterioration in the affordability of market housing, nor have we
seen a structural improvement.
In reality this is a rather simplistic measure. As Figure 13 indicates, low interest rates have reduced 3.84
the cost of servicing a mortgage for those with sufficient equity or savings who are able to get on
the housing ladder.
Qualitative Research with Estate & Letting Agents
To supplement the statistical analysis presented above, the SHMA has included a programme of 3.85
consultation through face to face interviews with estate agents, letting agents and on site new-build
sales staff in Oxfordshire. Interviews were conducted early July 2013. This is supplemented by
discussions with other stakeholders, including housing teams across the Oxfordshire Councils. The
stakeholder engagement programme is intended to take account of current housing market
conditions “on the ground” and to draw out distinctions between the housing market in different
parts of the HMA. The full analysis considering local dynamics in different parts of Oxfordshire is set
out in Appendix 6. A summary of key findings is included here.
Headline Findings at the HMA Level
The detailed work on the ground highlights that the City of Oxford’s economy drives much of the 3.86
housing market across Oxfordshire. The city hosts a ‘world class’ university and in many respects

Oxfordshire Strategic Housing Market Assessment: April 2014
GL Hearn Page 53 of 188
J:\Planning\Job Files\J029822 - Oxfordshire SHMA\Reports\Final SHMA Report (11.04.14).docx
this drives the sub-regional economy (and is an important component regional and national
economic competitiveness) through the spin-off of science and technology companies, especially
into the health sector. The HMA is also host to Oxford Brookes University, which has three
campuses – in Oxford, South Oxfordshire and the Vale of White Horse which has close links to the
local economy for example with regard to automotive engineering.
All of this combines with Oxford’s rich cultural offer, close proximity to London and situation on the 3.87
River Thames to make it a destination for international students, visiting professionals, visiting
academics and tourists. This means that the City’s local housing market has many competing
claims on it and is driven by households with high income and wealth together with a large student
population.
Oxford is however not a large city, but population density is high and the city’s institutions 3.88
(universities colleges, schools hospitals, administration) occupy a great deal of the available space
alongside retail and housing. Oxford’s local housing market therefore extends well beyond the
City’s boundary. Much of the story of the SHMA is about how the economic and cultural drivers of
Oxford, Reading and London have a major impact on Oxfordshire’s housing market. Lesser impacts
affecting parts of the county are from Swindon, Aylesbury, Buckingham and Milton Keynes.
Beyond the City, Oxfordshire towns fall into two main groups, those that have easy access to direct 3.89
rail links to the City of Oxford and London and those that do not. Those that do not are generally to
the west of the County. The characteristics of these areas have important differences, especially in
regard to demographics (which are considered further in Section 5).
In general terms the stakeholder consultation reveals that the private rented sector houses a higher 3.90
proportion of incomers than the re-sale sector, however investors are active across the county and
are effectively reducing re-sale supply and converting it to rental supply. The proportion of incomers
however is lower in the west of the county due to the absence of rail links into Oxford. Agents tell us
that the road connections to Oxford from the west are heavily congested, especially in the tourist
season.
Estate agents across the county generally believe that the housing market area was affected by the 3.91
credit crunch to a lesser extent than other parts of the country, and has recovered more quickly.
The latter seems to be a more reasonable view, cross-triangulating comments with the data set out
herein. Agents have pointed to local shortages of property that have resulted in prices exceeding
2007 peak values in some areas. Other agents are less bullish about the impact and legacy of the
credit crunch citing reduced sales volumes 2007-2012. The analysis is however clear that relative to
other areas, residential property prices are high and rising and that this contributes to affordability
issues for lower-income working households. Within the county, house prices are cheaper in

Oxfordshire Strategic Housing Market Assessment: April 2014
GL Hearn Page 54 of 188
J:\Planning\Job Files\J029822 - Oxfordshire SHMA\Reports\Final SHMA Report (11.04.14).docx
Bicester and Banbury in the north of the county; and that this is having some impact in helping first-
time buyers and investors to return to the market more strongly in these areas.
Ministry of Defence officials and servicemen have also been active in the market. Officials have 3.92
negotiated significant supplies of rental properties and negotiated sales of new build housing to
house servicemen that are being re-located from within and outside the UK. Servicemen are also
investing in local housing both for their immediate needs and as part of their retirement planning.
This is particularly noteworthy in the around the main towns to the west of Oxford.
Investors are active across the county. This is an entrepreneurial response to demand from 3.93
households who are unable or unwilling to commit to home ownership. Letting agents have
identified shortages of rental properties and rents are rising disproportionately for certain dwelling
types.
Agents in areas with higher house prices and rentals tell us house sharing is frequent for many 3.94
young professionals and lower paid working households without children. Letting agents across the
County told us that many landlords however generally do not encourage or permit house sharing.
The exception to this is the City of Oxford where the house share market is firmly established in all
parts of the City. The market for student housing in the private rented sector is significant and highly
evident in some parts of the City of Oxford. The universities provide halls of residence. Issues
related to the student population are considered further in Section 9.
A high proportion of volume new build sales are purchased by first time buyers mostly using the 3.95
Help to Buy scheme. Whilst there is evidence of notable recent new build especially in the towns
near to Oxford, agents told us that further additional supply through new build is urgently needed to
meet demand and that shortages exist of both rental and resale housing, especially for small
working families.
Most local authorities report a critical shortage of 1 and 2 bedroom social rented homes. This is 3.96
driven by homeless households, those in urgent housing need and those seeking to downsize
because of the 'bedroom tax.'
Key Messages
There is a considerable volume of information in this chapter about local housing market dynamics 3.97
in different parts of the country, and the influenced and supply-demand balance in these local
markets. However in this final section of the chapter, we will focus on seeking to draw out key
issues relating to overall supply-demand balance and market signals.

Oxfordshire Strategic Housing Market Assessment: April 2014
GL Hearn Page 55 of 188
J:\Planning\Job Files\J029822 - Oxfordshire SHMA\Reports\Final SHMA Report (11.04.14).docx
Our analysis points to macro-economic factors – constraints on access to mortgage finance, the 3.98
savings households require to access mortgage finance and the wider poor macro-economic
environment – as important drivers of market demand.
During the course of 2013, the housing market appears to be picking up speed following a relatively 3.99
sustained period of quite flat conditions. It is evident that Oxfordshire’s housing market has been
more resilient than that in many other areas with prices in some areas and segments of the market
now having recovered to over 2007 levels. The Help-to-Buy scheme is helping the market – and
particularly the new-build segment – to pick-up speed. The Oxfordshire HMA has demonstrated
more resilience than the national market which has been clear from the stakeholder consultation
whereby the HMA was said to be less affected by the recession than in other areas in the UK.
Housing demand is particularly strong in Oxford and areas with good transport links to it. More 3.100
generally demand is stronger in the towns with rail links, with prices falling in the west and north of
the HMA. Particularly west of Oxford near Brize Norton, and near Dicot, the presence of MOD
personnel has an important influence on local markets.
The analysis highlights that house prices are generally high – particularly in Oxford and the south of 3.101
the County – and this contributes to affordability pressures, including for young working households
and working households with low incomes. In some areas the private rented sector plays little
contribution to meeting needs from these groups – pointing towards a need to consider enhanced
affordable housing targeted at this group. Given the demographics of the housing market there is
also a notable trend in older households downsizing and potential for provision for this group to
release larger family homes for others.
The market signals indicate that Oxfordshire is a relatively high value market. They indicate strong 3.102
house price growth over the pre-recession decade; and suggest that has been more resilient and is
recovering more quickly than other parts of the region (and England more widely). In relative terms
the analysis suggests that the strongest demand pressures are in Oxford; followed by the south of
the county (Vale of White Horse and South Oxfordshire). In relative terms, the market signals
suggest that there is less market pressure in Cherwell District.
Reflecting the focus of the housing offer on larger properties, overcrowding is below average in the 3.103
HMA with the exception of Oxford where 6.2% of households are overcrowded. The intensity of
occupation of the housing stock appears to have increased between 2001-11, but to a lesser
degree than across the South East or England.
Across the HMA housing supply over the 2006-11 period fell short of planned provision by 2,279 3.104
homes. Performance varied however by area, with West Oxfordshire ‘over-delivering’ by 1,236
Oxfordshire Strategic Housing Market Assessment: April 2014
GL Hearn Page 56 of 188
J:\Planning\Job Files\J029822 - Oxfordshire SHMA\Reports\Final SHMA Report (11.04.14).docx
dwellings; whilst there was a notable shortfall in provision in South Oxfordshire (by -1,398
dwellings). This past performance is considered in Section 10 in identifying overall future housing
needs.

Oxfordshire Strategic Housing Market Assessment: April 2014
GL Hearn Page 57 of 188
J:\Planning\Job Files\J029822 - Oxfordshire SHMA\Reports\Final SHMA Report (11.04.14).docx
4 DEMOGRAPHIC & ECONOMIC DRIVERS OF THE HOUSING MARKET
In this section, we consider the socio- economic characteristics of the HMA population as well as 4.1
the characteristics of the economy and the labour market.
Population Dynamics
The 2011 Census recorded that Oxfordshire had a population of just less than 654,000. Of the 4.2
authorities, the population is highest in Oxford and Cherwell (both over 140,000). Oxford has seen
the greatest population growth over the 2001-11 decade17
.
Population (2011) Table 14:
Area Population,
2001 Population,
2011 Change % Change
Cherwell 131,785 141,868 10,083 8%
Oxford 134,248 151,906 17,658 13%
South Oxfordshire 128,188 134,257 6,069 5%
Vale of White Horse 115,627 120,988 5,361 5%
West Oxfordshire 95,640 104,779 9,139 10%
Oxfordshire 605,488 653,798 48,310 8%
South East 8,000,645 8,634,750 634,105 8%
England 49,138,831 53,012,456 3,873,625 8%
Source: 2001 and 2011 Census
Over the 2001-11 decade Oxford and West Oxfordshire saw the strongest relative population 4.3
growth. Population growth was weaker in South Oxfordshire and the Vale of White Horse.
The population structure varies in different parts of the HMA. Oxford has a relatively young 4.4
population structure, with 14.9% of its population made up of people aged 20-24 (more than double
that in the other authorities), many of whom will be students. The other authorities within the HMA
have an above average proportion of their population aged over 40, and this is the case particularly
in South and West Oxfordshire.
17
Demographic dynamics in Oxford are considered in further detail in Section 6

Oxfordshire Strategic Housing Market Assessment: April 2014
GL Hearn Page 58 of 188
J:\Planning\Job Files\J029822 - Oxfordshire SHMA\Reports\Final SHMA Report (11.04.14).docx
Population (2011) – 5 Year Age Bands Figure 28:
Source: 2011 Census
Figure 29 profiles the population structure for the identified sub-markets. 4.5
Population (2011) – 5 Year Age Bands – Sub Markets Figure 29:
Source: 2011 Census
The figures below show the current structure and changes in structure of the local authorities in the 4.6
Oxfordshire HMA over the past decade. It is evident that the population is ageing in a number of
0.0%
2.0%
4.0%
6.0%
8.0%
10.0%
12.0%
14.0%
16.0%
0 ‒
4
5 ‒
9
10 ‒
14
15 ‒
19
20 ‒
24
25 ‒
29
30 ‒
34
35 ‒
39
40 ‒
44
45 ‒
49
50 ‒
54
55 ‒
59
60 ‒
64
65 ‒
69
70 ‒
74
75 ‒
79
80 ‒
84
85 ‒
89
90
an
d o
ver
Cherwell
Oxford
South Oxfordshire
Vale of White Horse
West Oxfordshire
Oxfordshire
South East
England
0% 20% 40% 60% 80% 100%
KidlingtonBicesterBanbury
Rural
N / A
ThameHenleyDidcot
WallingfordRural (all other areas)
Abingdon and City Fringe (Urban)Abingdon and City Fringe (Rural)
South East Vale (Urban)South East Vale (Rural)
Western Vale (Urban)Western Vale (Rural)
WitneyCarterton
Chipping NortonRural
Ch
erw
ell
Oxf
ord
South
Oxfo
rdshire
Vale
of
Wh
ite
Ho
rse
West
Oxfo
rds
hir
e 5 and Under
6 to 10
11 to 15
16 to 20
21 to 25
26 to 30
31 to 35
36 to 40
41 to 45
46 to 50
51 to 55
56 to 60
61 to 65

Oxfordshire Strategic Housing Market Assessment: April 2014
GL Hearn Page 59 of 188
J:\Planning\Job Files\J029822 - Oxfordshire SHMA\Reports\Final SHMA Report (11.04.14).docx
authorities although the number of young children (aged less than 4 years old) have increased in a
number of areas as the birth rate has risen.
Since 2001, Cherwell has seen most of its growth in people aged over 40. The population in their 4.7
30s has declined (partly as a result of the changing age structure).
Change in Population Structure – Cherwell – 2001 – 2011 Figure 30:
Source: Neighbourhood Statistics
Oxford has an above average proportion of residents aged 20 – 24. Oxford has seen the most 4.8
growth in people aged between 20 and 34 since 2001. The numbers aged under 9, in their 40s and
aged 55-64 has also grown.
-4000
-2000
0
2000
4000
6000
8000
10000
12000
14000
0 to4
5 to9
10to14
15to19
20to24
25to29
30to34
35to39
40to44
45to49
50to54
55to59
60to64
65to69
70to74
75to79
80to84
85+
Change
2001
2011
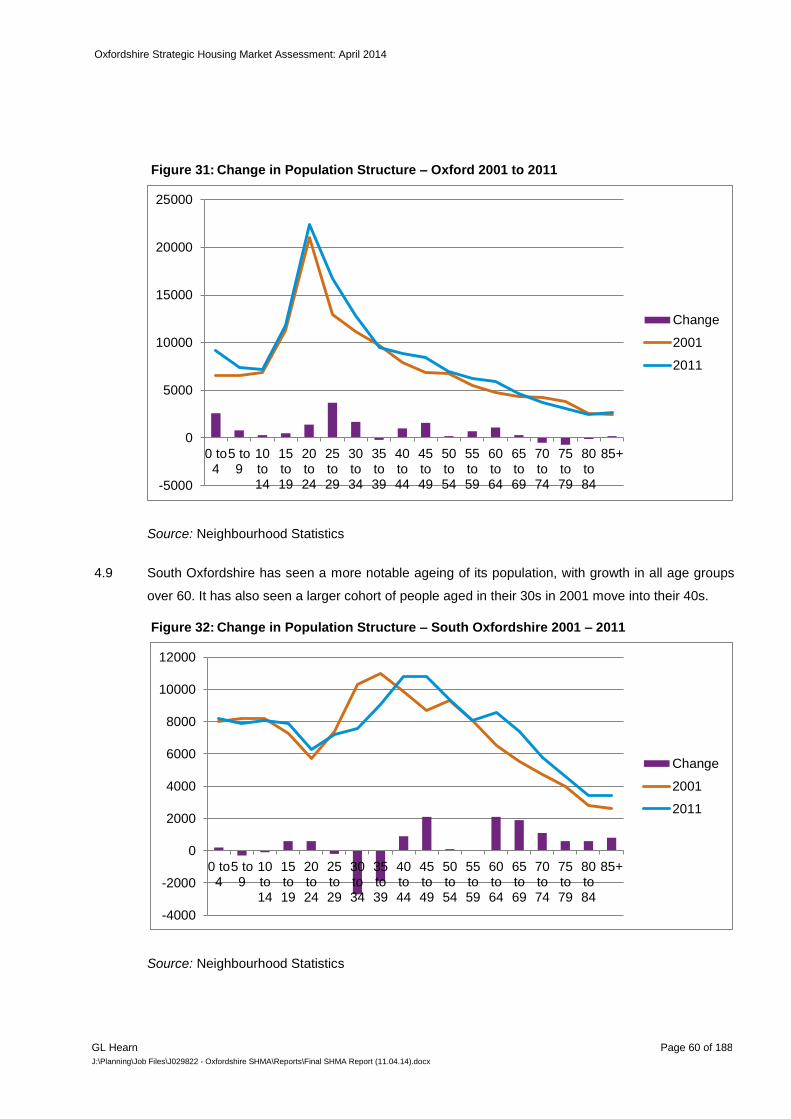
Oxfordshire Strategic Housing Market Assessment: April 2014
GL Hearn Page 60 of 188
J:\Planning\Job Files\J029822 - Oxfordshire SHMA\Reports\Final SHMA Report (11.04.14).docx
Change in Population Structure – Oxford 2001 to 2011 Figure 31:
Source: Neighbourhood Statistics
South Oxfordshire has seen a more notable ageing of its population, with growth in all age groups 4.9
over 60. It has also seen a larger cohort of people aged in their 30s in 2001 move into their 40s.
Change in Population Structure – South Oxfordshire 2001 – 2011 Figure 32:
Source: Neighbourhood Statistics
-5000
0
5000
10000
15000
20000
25000
0 to4
5 to9
10to14
15to19
20to24
25to29
30to34
35to39
40to44
45to49
50to54
55to59
60to64
65to69
70to74
75to79
80to84
85+
Change
2001
2011
-4000
-2000
0
2000
4000
6000
8000
10000
12000
0 to4
5 to9
10to14
15to19
20to24
25to29
30to34
35to39
40to44
45to49
50to54
55to59
60to64
65to69
70to74
75to79
80to84
85+
Change
2001
2011

Oxfordshire Strategic Housing Market Assessment: April 2014
GL Hearn Page 61 of 188
J:\Planning\Job Files\J029822 - Oxfordshire SHMA\Reports\Final SHMA Report (11.04.14).docx
Similarly to South Oxfordshire, the Vale of White Horse is showing an aging population, with the 4.10
greatest change in the 2001 to 2011 decade being in people over the age of 45.
Change in Population Structure –Vale of White Horse 2001 – 2011 Figure 33:
Source: Neighbourhood Statistics
West Oxfordshire has also shown an aging population with the greatest population increases being 4.11
in people over the age of 45. Similar to South Oxfordshire and the Vale of White Horse, it has seen
the population in their 30s drop and those in their 40s grow over the 2001-11 period.
Change in Population Structure – West Oxfordshire 2001 - 2011 Figure 34:
Source: Neighbourhood Statistics
-4000
-2000
0
2000
4000
6000
8000
10000
0 to4
5 to9
10to14
15to19
20to24
25to29
30to34
35to39
40to44
45to49
50to54
55to59
60to64
65to69
70to74
75to79
80to84
85+
Change
2001
2011
-4000
-2000
0
2000
4000
6000
8000
10000
0 to4
5 to9
10to14
15to19
20to24
25to29
30to34
35to39
40to44
45to49
50to54
55to59
60to64
65to69
70to74
75to79
80to84
85+
Change
2001
2011
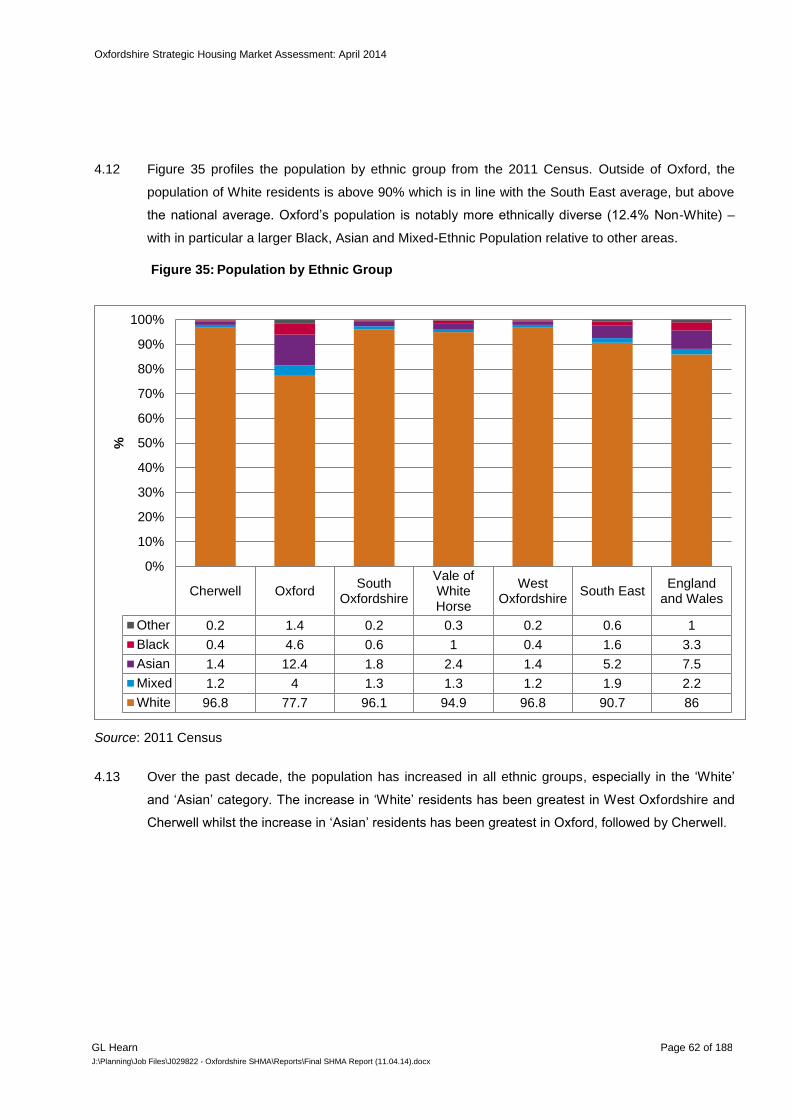
Oxfordshire Strategic Housing Market Assessment: April 2014
GL Hearn Page 62 of 188
J:\Planning\Job Files\J029822 - Oxfordshire SHMA\Reports\Final SHMA Report (11.04.14).docx
Figure 35 profiles the population by ethnic group from the 2011 Census. Outside of Oxford, the 4.12
population of White residents is above 90% which is in line with the South East average, but above
the national average. Oxford’s population is notably more ethnically diverse (12.4% Non-White) –
with in particular a larger Black, Asian and Mixed-Ethnic Population relative to other areas.
Population by Ethnic Group Figure 35:
Source: 2011 Census
Over the past decade, the population has increased in all ethnic groups, especially in the ‘White’ 4.13
and ‘Asian’ category. The increase in ‘White’ residents has been greatest in West Oxfordshire and
Cherwell whilst the increase in ‘Asian’ residents has been greatest in Oxford, followed by Cherwell.
Cherwell OxfordSouth
Oxfordshire
Vale ofWhiteHorse
WestOxfordshire
South EastEngland
and Wales
Other 0.2 1.4 0.2 0.3 0.2 0.6 1
Black 0.4 4.6 0.6 1 0.4 1.6 3.3
Asian 1.4 12.4 1.8 2.4 1.4 5.2 7.5
Mixed 1.2 4 1.3 1.3 1.2 1.9 2.2
White 96.8 77.7 96.1 94.9 96.8 90.7 86
0%
10%
20%
30%
40%
50%
60%
70%
80%
90%
100%
%
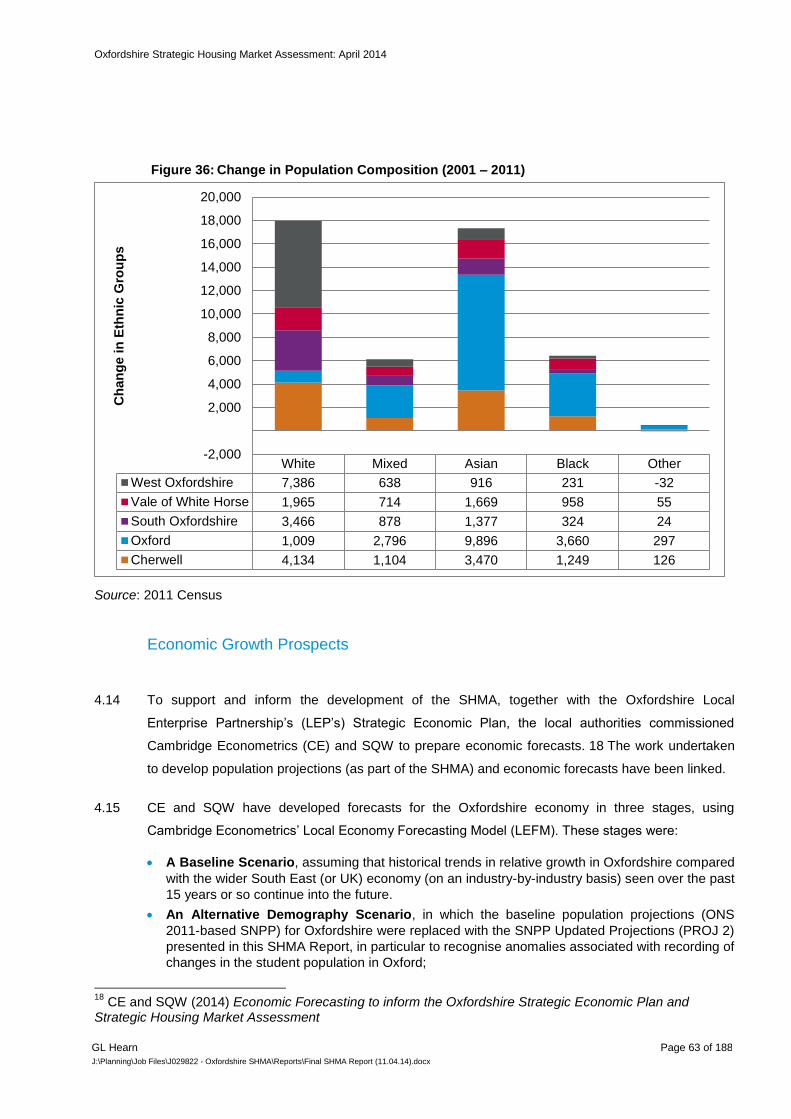
Oxfordshire Strategic Housing Market Assessment: April 2014
GL Hearn Page 63 of 188
J:\Planning\Job Files\J029822 - Oxfordshire SHMA\Reports\Final SHMA Report (11.04.14).docx
Change in Population Composition (2001 – 2011) Figure 36:
Source: 2011 Census
Economic Growth Prospects
To support and inform the development of the SHMA, together with the Oxfordshire Local 4.14
Enterprise Partnership’s (LEP’s) Strategic Economic Plan, the local authorities commissioned
Cambridge Econometrics (CE) and SQW to prepare economic forecasts. 18 The work undertaken
to develop population projections (as part of the SHMA) and economic forecasts have been linked.
CE and SQW have developed forecasts for the Oxfordshire economy in three stages, using 4.15
Cambridge Econometrics’ Local Economy Forecasting Model (LEFM). These stages were:
A Baseline Scenario, assuming that historical trends in relative growth in Oxfordshire compared
with the wider South East (or UK) economy (on an industry-by-industry basis) seen over the past
15 years or so continue into the future.
An Alternative Demography Scenario, in which the baseline population projections (ONS
2011-based SNPP) for Oxfordshire were replaced with the SNPP Updated Projections (PROJ 2)
presented in this SHMA Report, in particular to recognise anomalies associated with recording of
changes in the student population in Oxford;
18
CE and SQW (2014) Economic Forecasting to inform the Oxfordshire Strategic Economic Plan and Strategic Housing Market Assessment
White Mixed Asian Black Other
West Oxfordshire 7,386 638 916 231 -32
Vale of White Horse 1,965 714 1,669 958 55
South Oxfordshire 3,466 878 1,377 324 24
Oxford 1,009 2,796 9,896 3,660 297
Cherwell 4,134 1,104 3,470 1,249 126
-2,000
2,000
4,000
6,000
8,000
10,000
12,000
14,000
16,000
18,000
20,000
Ch
an
ge i
n E
thn
ic G
rou
ps

Oxfordshire Strategic Housing Market Assessment: April 2014
GL Hearn Page 64 of 188
J:\Planning\Job Files\J029822 - Oxfordshire SHMA\Reports\Final SHMA Report (11.04.14).docx
A Committed Economic Growth Scenario, which reflects policy influences on economic
growth such as planned development and initiatives related to the Science Vale Enterprise Zone,
Oxfordshire City Deal, North West Bicester Eco Town and other planned infrastructure
investment.
The Baseline Scenario was derived from the econometric model (LEFM). It assumes that historical 4.16
relationships between growth in the local area relative to the South East or UK on an industry-by-
industry basis hold true into the future. Thus if growth in an industry locally has been stronger than
at the regional or national level in the past, it is expected to continue to out-perform moving
forwards (and visa-versa). An adjustment was however made to the baseline scenario to reflect an
expectation that the education sector in Oxfordshire will suffer less of downturn in employment
growth in the short- and medium-term than the model-based projections initially suggested given
the significant influence of the universities on employment in the sector.
The Baseline Scenario projected an increase in employment in Oxfordshire of 36,400 between 4.17
2011-31, equating to around 1,800 jobs per annum (0.4-0.5% pa growth in employment). At a
district-level, the projections assume that historical relationships between relative growth by sector
in the district relative to the county continue to hold true.
The Alternative Population Scenario adjusts the Baseline Scenario to reflect the SHMA Updated 4.18
Projections (PROJ 2). This results in a projected uplift in the population in 2031 of 45,000 (6%) and
particularly affects the projections for Oxford. The annual growth rates in population (% per annum)
derived from this match more closely to those seen over the 2001-11 decade. This increase in
population results in stronger growth in employment in sectors where demand is influenced by
population dynamics - particularly education and health, retailing and consumer-related services.
This scenario projects 45,335 additional jobs (25% more than in the Baseline Scenario).
The Committed Economic Growth Scenario builds on the Alternative Population Scenario. It takes 4.19
account both of factors can be expected to stimulate ‘above trend’ growth in employment in
Oxfordshire as well as factors which might depress growth.
The Scenario models the impact of the following: 4.20
Expansion of University of Oxford –2,000 additional jobs to 2031 as a result of substantial
increase in space for research and teaching in the Science area, the former Radcliffe Hospital
site, and Churchill site; as well as the availability of further space at Osney Mean and likely
continued growth of Science, Technology, Engineering and Maths (STEM) and medical science
research.
Growth in Research Activities in Oxfordshire –5,400 additional jobs at Harwell and Milton
Park associated with new development as part of the UK Science Vale Enterprise Zone and
growth in research at Harwell linked to greater University of Oxford involvement. In addition 500
additional jobs are modelled at Culham Science Centre.

Oxfordshire Strategic Housing Market Assessment: April 2014
GL Hearn Page 65 of 188
J:\Planning\Job Files\J029822 - Oxfordshire SHMA\Reports\Final SHMA Report (11.04.14).docx
Space Science and Satellite Technologies –4,000 jobs in these sectors across the county,
focused particularly in and around the existing facilities, agencies and research based at Harwell.
Bioscience Cluster – 1,000 additional jobs in Cherwell and 1,000 in Oxford in this sector.
Health Sector – 2,000 additional jobs in Oxford linked to NHS investment in the City as a centre
of excellence, and the attractions of Oxford for the private and charitable health sector.
Advanced Manufacturing –1,000 additional jobs in Cherwell, 500 in West Oxfordshire and 500
in Vale of White Horse associated with growth opportunities in the automotive sector,
motorsports, instrument engineering, magnet technology and cryogenics. In the automotive
sector this reflects the presence of key employers such as BMW, Prodrive and Williams with
opportunities for both research and development, and repatriation of the supply chain.
Environmental Technologies and Green Construction – potential 150 jobs in construction
and 1,000 in environmental good and services across Oxfordshire, with particular growth
associated with delivery of the eco-development at North West Bicester.
Other Sectors – in addition to the above, the scenario takes account of potential for creation of
1500 additional jobs in retail; 2,500 in warehousing and distribution; and a further 2,000
associated with growth at Oxford Airport and the nearby technology park.
There are clearly a range of higher value-added sectors with growth potential across the county; 4.21
with Oxford and the universities and the cluster of research facilities around Didcot forming
important drivers of the sub-regional economy.
Overall these factors are expected to support creation of 25,000 additional jobs (over and above 4.22
those in the Alternative Population Scenario). The Committed Economic Growth Scenario models
this.
The CE and SQW Report recognises that there are factors which could depress growth in 4.23
employment, including public sector spending restraints and competition from surrounding areas
including South Warwickshire, the Thames Valley and London. It identifies a number of potential
risks to delivery of the Committed Economic Growth Scenario, including competition for skilled
labour and delays in the delivery of infrastructure (including potentially shortages of commercial
accommodation). However it does not regard housing delivery as a particular risk, setting out that
past rates of employment and housing growth in Oxfordshire and comparator areas do not point
towards evidence that employment and housing growth have constrained one another. Overall it
concludes that delivery of the Committed Economic Growth Scenario is realistic.
The CE and SQW Report concludes that the resultant level of employment growth of 88,000 jobs 4.24
over the 2011-31 period in the Committed Economic Growth Scenario (equivalent to growth in
employment of 4,400 pa) “would be an achievement, especially in the current economic
environment, but is by no means unprecedented.” In comparative terms it would represent
employment growth of 1.0% per annum (with annual growth rates varying from 0.8% pa in South
Oxfordshire and West Oxfordshire to 1.5% pa in the Vale of White Horse). This compares to an
average annual growth rate of 1.7% across Oxfordshire between 1981-2000; and to 1.2% pa in
Cambridgeshire between 1990-2011.

Oxfordshire Strategic Housing Market Assessment: April 2014
GL Hearn Page 66 of 188
J:\Planning\Job Files\J029822 - Oxfordshire SHMA\Reports\Final SHMA Report (11.04.14).docx
The Committed Economic Growth Scenario is based on the potential for economic growth in 4.25
Oxfordshire and its constituent districts, linked to economic drivers and their potential to stimulate
jobs growth. It is demand-driven. It is not driven by an assessment of supply-side factors such as
employment land availability or supply. Further information regarding how the economic scenarios
were constructed, and the degree to which key economic growth initiatives/ projects informed this,
are set out in the CE and SQW Report.
Labour Market
Understanding labour market dynamics is important in relating jobs and homes, as any economic-4.26
driven projections will be sensitive to changes to economic participation (employment rates) and
commuting.
Jobs density measures the jobs per 100 working-age residents. Oxfordshire HMA has a higher than 4.27
average jobs density, with 88 jobs on average per 100 working-age residents. This compares to 80
across the South East and 78 nationally. It is a testament to the area’s economic success.
The jobs density of each authority is line with or above the national average. Oxford’s has a 4.28
particularly high jobs density with 108 jobs per 100 working-age residents, suggesting significant
net in-commuting to the authority.
Jobs Density Figure 37:
Source: NOMIS / Jobs Density
The skills base is strong: 36% of the working-age population are qualified to degree level or 4.29
equivalent (level 4 or above). The proportion of people with Level 4 qualifications and above is
Cherwell OxfordSouth
Oxfordshire
Vale ofWhiteHorse
WestOxfords
hire
Oxfordshire
SouthEast
England
Jobs density 0.83 1.08 0.80 0.83 0.78 0.88 0.80 0.78
0.00
0.20
0.40
0.60
0.80
1.00
1.20

Oxfordshire Strategic Housing Market Assessment: April 2014
GL Hearn Page 67 of 188
J:\Planning\Job Files\J029822 - Oxfordshire SHMA\Reports\Final SHMA Report (11.04.14).docx
slightly lower in Cherwell (28.1%) compared with other authorities but this is still higher than the
national and regional average. Unsurprisingly, Oxford (where the two universities are based) has
the highest percentage of residents with Level 4 qualifications and above.
Highest Level of Qualification Table 15:
C
herw
ell
Oxfo
rd
So
uth
Oxfo
rd-
sh
ire
Vale
of
Wh
ite
Ho
rse
West
Oxfo
rd-
sh
ire
Oxfo
rd-
sh
ire
HM
A
So
uth
East
En
gla
nd
No Qualifications 19.7% 13.6% 16.5% 16.7% 17.6% 16.7% 19.1% 22.5%
Apprenticeship 4.1% 1.8% 3.8% 4.1% 3.9% 3.5% 3.6% 3.6%
Other Qualifications 5.5% 6.9% 4.0% 4.1% 4.1% 5.0% 5.2% 5.7%
Level 1 Qualifications 15.2% 8.3% 12.1% 11.8% 13.3% 12.0% 13.5% 13.3%
Level 2 Qualifications 15.8% 8.9% 14.9% 14.6% 15.8% 13.8% 15.9% 15.2%
Level 3 Qualifications 11.6% 17.8% 12.0% 11.5% 12.3% 13.3% 12.8% 12.4%
Level 4 Qualifications and Above 28.1% 42.6% 36.7% 37.2% 32.9% 35.7% 29.9% 27.4%
Source: 2011 Census
Highest Level of Qualifications - Submarkets Figure 38:
Source: 2011 Census
0% 20% 40% 60% 80% 100%
KidlingtonBicesterBanbury
Rural
N / A
ThameHenleyDidcot
WallingfordRural (all other areas)
Abingdon and City Fringe…Abingdon and City Fringe…South East Vale (Urban)South East Vale (Rural)
Western Vale (Urban)Western Vale (Rural)
WitneyCarterton
Chipping NortonRural
Ch
erw
ell
Oxfo
rdS
outh
Oxfo
rdshire
Vale
of
Wh
ite
Ho
rse
West
Oxfo
rdshi
re
No qualifications
Apprenticeship
Other qualifications
Level 1 qualifications
Level 2 qualifications
Level 3 qualifications
Level 4 qualifications andabove
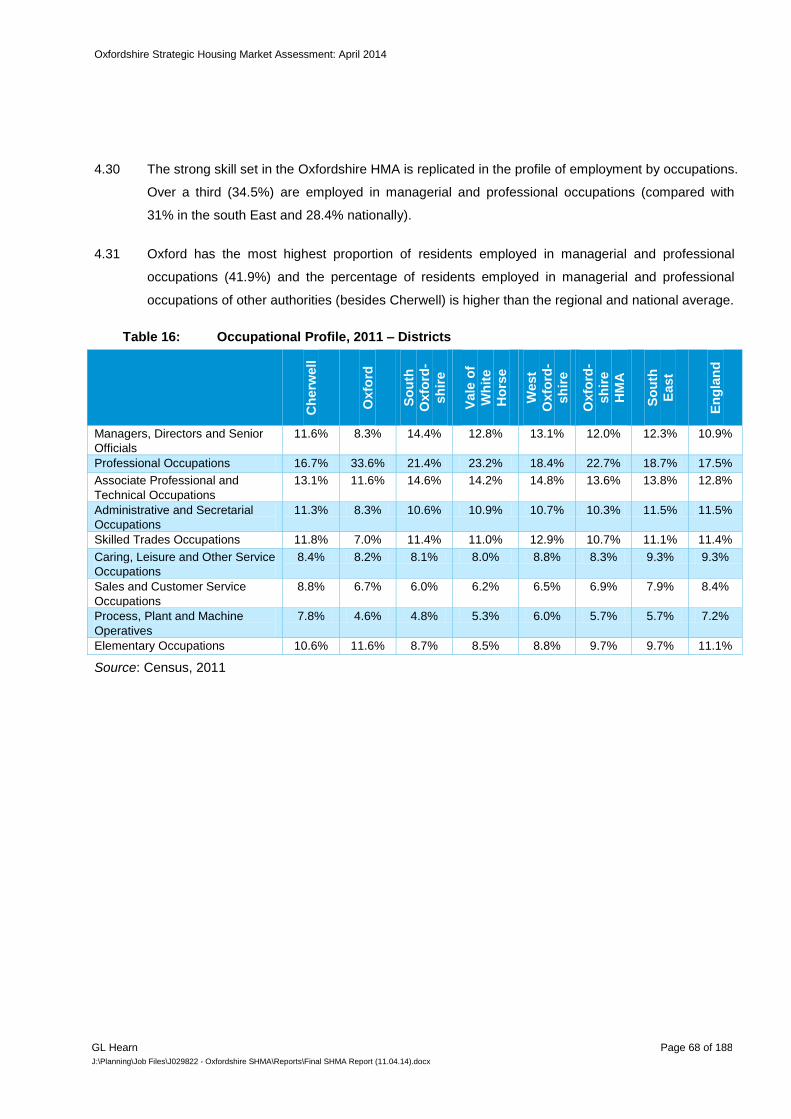
Oxfordshire Strategic Housing Market Assessment: April 2014
GL Hearn Page 68 of 188
J:\Planning\Job Files\J029822 - Oxfordshire SHMA\Reports\Final SHMA Report (11.04.14).docx
The strong skill set in the Oxfordshire HMA is replicated in the profile of employment by occupations. 4.30
Over a third (34.5%) are employed in managerial and professional occupations (compared with
31% in the south East and 28.4% nationally).
Oxford has the most highest proportion of residents employed in managerial and professional 4.31
occupations (41.9%) and the percentage of residents employed in managerial and professional
occupations of other authorities (besides Cherwell) is higher than the regional and national average.
Occupational Profile, 2011 – Districts Table 16:
Ch
erw
ell
Oxfo
rd
So
uth
Oxfo
rd-
sh
ire
Vale
of
Wh
ite
Ho
rse
West
Oxfo
rd-
sh
ire
Oxfo
rd-
sh
ire
HM
A
So
uth
East
En
gla
nd
Managers, Directors and Senior
Officials
11.6% 8.3% 14.4% 12.8% 13.1% 12.0% 12.3% 10.9%
Professional Occupations 16.7% 33.6% 21.4% 23.2% 18.4% 22.7% 18.7% 17.5%
Associate Professional and
Technical Occupations
13.1% 11.6% 14.6% 14.2% 14.8% 13.6% 13.8% 12.8%
Administrative and Secretarial
Occupations
11.3% 8.3% 10.6% 10.9% 10.7% 10.3% 11.5% 11.5%
Skilled Trades Occupations 11.8% 7.0% 11.4% 11.0% 12.9% 10.7% 11.1% 11.4%
Caring, Leisure and Other Service
Occupations
8.4% 8.2% 8.1% 8.0% 8.8% 8.3% 9.3% 9.3%
Sales and Customer Service
Occupations
8.8% 6.7% 6.0% 6.2% 6.5% 6.9% 7.9% 8.4%
Process, Plant and Machine
Operatives
7.8% 4.6% 4.8% 5.3% 6.0% 5.7% 5.7% 7.2%
Elementary Occupations 10.6% 11.6% 8.7% 8.5% 8.8% 9.7% 9.7% 11.1%
Source: Census, 2011
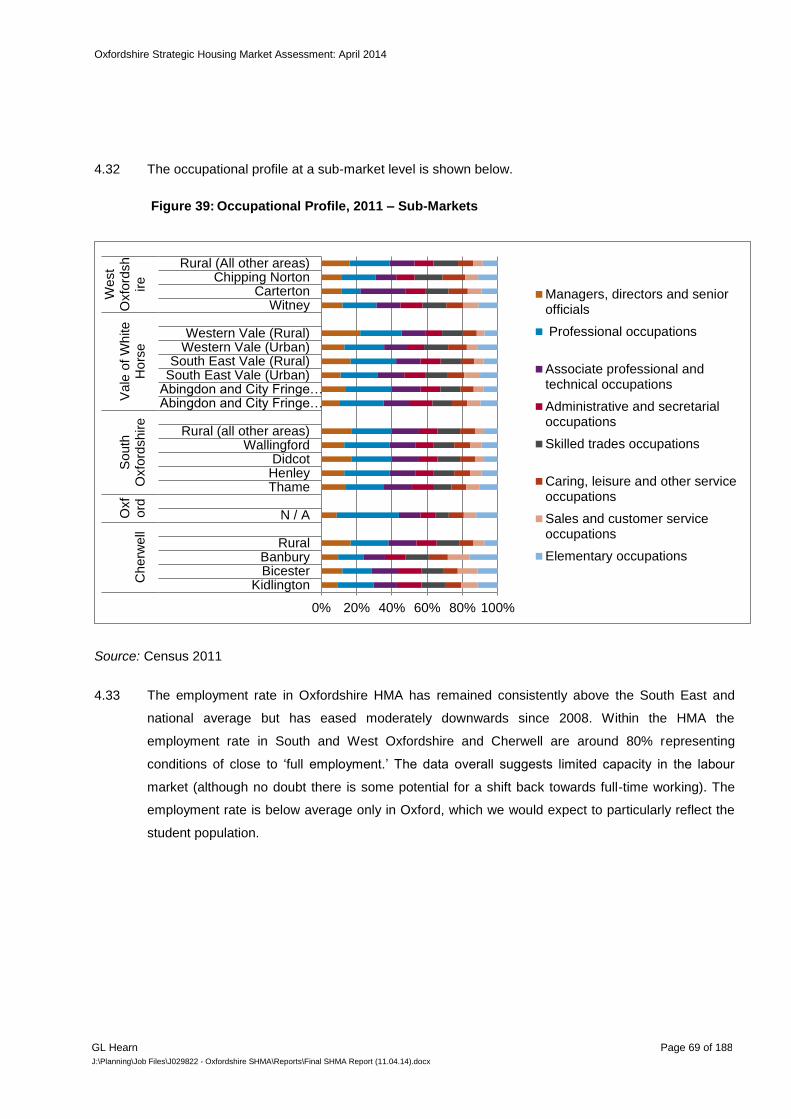
Oxfordshire Strategic Housing Market Assessment: April 2014
GL Hearn Page 69 of 188
J:\Planning\Job Files\J029822 - Oxfordshire SHMA\Reports\Final SHMA Report (11.04.14).docx
The occupational profile at a sub-market level is shown below. 4.32
Occupational Profile, 2011 – Sub-Markets Figure 39:
Source: Census 2011
The employment rate in Oxfordshire HMA has remained consistently above the South East and 4.33
national average but has eased moderately downwards since 2008. Within the HMA the
employment rate in South and West Oxfordshire and Cherwell are around 80% representing
conditions of close to ‘full employment.’ The data overall suggests limited capacity in the labour
market (although no doubt there is some potential for a shift back towards full-time working). The
employment rate is below average only in Oxford, which we would expect to particularly reflect the
student population.
0% 20% 40% 60% 80% 100%
KidlingtonBicesterBanbury
Rural
N / A
ThameHenleyDidcot
WallingfordRural (all other areas)
Abingdon and City Fringe…Abingdon and City Fringe…South East Vale (Urban)South East Vale (Rural)
Western Vale (Urban)Western Vale (Rural)
WitneyCarterton
Chipping NortonRural (All other areas)
Ch
erw
ell
Oxf
ord
South
Oxfo
rdshire
Vale
of
Wh
ite
Ho
rse
West
Oxfo
rdsh
ire
Managers, directors and seniorofficials
Professional occupations
Associate professional andtechnical occupations
Administrative and secretarialoccupations
Skilled trades occupations
Caring, leisure and other serviceoccupations
Sales and customer serviceoccupations
Elementary occupations

Oxfordshire Strategic Housing Market Assessment: April 2014
GL Hearn Page 70 of 188
J:\Planning\Job Files\J029822 - Oxfordshire SHMA\Reports\Final SHMA Report (11.04.14).docx
Employment Rate (% Residents 16 -64), 2004 - 2012 Figure 40:
Source: Annual Population Survey
The unemployment rate in the Oxfordshire HMA since 2008 has been lower than in Great Britain as 4.34
a whole. Of the Local Authorities in the HMA, unemployment has been highest in Oxford and lowest
in the Vale of White Horse and West Oxfordshire. The analysis suggests greater capacity for people
to move back into work in Oxford relative to other parts of the HMA.
60
65
70
75
80
85
90
Oct 0
4-S
ep
05
Apr 0
5-M
ar 0
6
Oct 0
5-S
ep
06
Apr 0
6-M
ar 0
7
Oct 0
6-S
ep
07
Apr 0
7-M
ar 0
8
Oct 0
7-S
ep
08
Apr 0
8-M
ar 0
9
Oct 0
8-S
ep
09
Apr 0
9-M
ar 1
0
Oct 0
9-S
ep
10
Apr 1
0-M
ar 1
1
Oct 1
0-S
ep
11
Apr 1
1-M
ar 1
2
Oct 1
1-S
ep
12
Apr 1
2-M
ar 1
3
% 1
6 -
64 E
mplo
yed U
sin
g a
3 P
eriod M
ovin
g
Avera
ge
Cherwell
Oxford
South Oxfordshire
Vale of White Horse
West Oxfordshire
Oxfordshire HMA
South East
Great Britain

Oxfordshire Strategic Housing Market Assessment: April 2014
GL Hearn Page 71 of 188
J:\Planning\Job Files\J029822 - Oxfordshire SHMA\Reports\Final SHMA Report (11.04.14).docx
Unemployment (% Residents 16 -64) 2004 - 201219
Figure 41:
Source: Annual Population Survey
Across the HMA, resident earnings (£29,134) are broadly consistent with the South East average 4.35
(£29,491) but above the national average (£26, 804).
The incomes of full-time employed residents have been compared with those of people working in 4.36
the authorities. Generally residents’ earnings are above workplace earnings with the exception of
Oxford and the Vale of White Horse, both of which demonstrate a concentration of higher-paid jobs
to which people commute into the areas to work. The lowest workplace earnings are in South
Oxfordshire.
19
Data is not available for South Oxfordshire
0
1
2
3
4
5
6
7
8
9
Oct 04
-Sep
05
Apr
05
-Mar
06
Oct 05
-Sep
06
Apr
06
-Mar
07
Oct 06
-Sep
07
Apr
07
-Mar
08
Oct 07
-Sep
08
Apr
08
-Mar
09
Oct 08
-Sep
09
Apr
09
-Mar
10
Oct 09
-Sep
10
Apr
10
-Mar
11
Oct 10
-Sep
11
Apr
11
-Mar
12
Oct 11
-Sep
12
Apr
12
-Mar
13
% 1
6 -
64 U
nem
plo
yed U
sin
g a
3 P
eriod
Movin
g A
vera
ge
Cherwell
Oxford
Vale of White Horse
West Oxfordshire
Oxfordshire HMA
South East
Great Britain

Oxfordshire Strategic Housing Market Assessment: April 2014
GL Hearn Page 72 of 188
J:\Planning\Job Files\J029822 - Oxfordshire SHMA\Reports\Final SHMA Report (11.04.14).docx
Workplace and Residence-based Earnings, 2012 Figure 42:
Source: NOMIS / Annual Survey of Hours and Earnings
Key Messages
The analysis in this chapter points towards a relatively dynamic economy across Oxfordshire and 4.37
one which has strong growth prospects. However it also points towards a relatively ‘tight’ labour
market and to evidence that the population has been ageing – particularly outside of Oxford. This
presents challenges about how to sustain the area’s economic dynamism.
Scenarios for economic growth have been developed to inform the SHMA. The Baseline Scenario 4.38
projected an increase in employment in Oxfordshire of 36,400 between 2011-31, equating to
around 1,800 jobs per annum (0.4-0.5% pa growth in employment). At a district-level, the
projections assume that historical relationships between relative growth by sector in the district
relative to the county continue to hold true.
The Alternative Population Scenario adjusts the Baseline Scenario to reflect the SHMA Updated 4.39
Projections (PROJ 2). This results in a projected uplift in the population in 2031 of 45,000 (6%) and
particularly affects the projections for Oxford. The annual growth rates in population (% per annum)
derived from this match more closely to those seen over the 2001-11 decade. This increase in
population results in stronger growth in employment in sectors where demand is influenced by
population dynamics - particularly education and health, retailing and consumer-related services.
Cherwell
OxfordSouth
Oxfordshire
Vale ofWhiteHorse
WestOxfords
hire
OxfordshireHMA
SouthEast
England
Resident Earnings £27,910 £26,954 £30,425 £31,261 £30,573 £29,134 £29,491 £26,804
Work Place Earnings £26,899 £28,969 £25,779 £33,253 £27,075 £28,800 £28,181 £26,800
£-
£5,000
£10,000
£15,000
£20,000
£25,000
£30,000
£35,000

Oxfordshire Strategic Housing Market Assessment: April 2014
GL Hearn Page 73 of 188
J:\Planning\Job Files\J029822 - Oxfordshire SHMA\Reports\Final SHMA Report (11.04.14).docx
The Committed Economic Growth Scenario makes a number of assumptions regarding potential for 4.40
enhanced economic performance. The CE and SQW Report concludes that the resultant level of
employment growth of 80,000 jobs over the 2011-31 period (equivalent to growth in employment of
4,000 pa) “would be an achievement, especially in the current economic environment, but is by no
means unprecedented.” In comparative terms it would represent employment growth of 1.0% per
annum (with annual growth rates varying from 0.6% pa in Oxford to 1.5% pa in the Vale of White
Horse). This compares to an average annual growth rate of 1.7% across Oxfordshire between
1981-2000; and to 1.2% pa in Cambridgeshire between 1990-2011.
The economic scenarios presented, and baseline demographic evidence; inform demographic 4.41
projections which are considered in Section 5.

Oxfordshire Strategic Housing Market Assessment: April 2014
GL Hearn Page 74 of 188
J:\Planning\Job Files\J029822 - Oxfordshire SHMA\Reports\Final SHMA Report (11.04.14).docx

Oxfordshire Strategic Housing Market Assessment: April 2014
GL Hearn Page 75 of 188
J:\Planning\Job Files\J029822 - Oxfordshire SHMA\Reports\Final SHMA Report (11.04.14).docx
5 DEMOGRAPHIC AND ECONOMIC-LED PROJECTIONS
Overview
This section of the SHMA begins to consider the overall need for housing across the Oxfordshire 5.1
HMA and within individual authorities. The analysis is predicated on the requirements of the NPPF
which says the scale of housing required should be based on meeting ‘household and population
projections, taking account of migration and demographic change’ (para 159).
The approach adopted follows that set out in the Planning Practice Guidance on Housing and 5.2
Economic Development Needs Assessments (CLG, March 2014)20
. This section specifically reviews
the latest official household projections and updates these as appropriate to take account of the
latest demographic data and local evidence. It also considers the interaction between housing
need/ demographics and prospective economic growth, and includes assessment of housing need
to support forecasts for future economic performance.
In deriving overall conclusions regarding future housing need in accordance with the Guidance, 5.3
market signals (as considered in Section 4) and the need for affordable housing (as considered in
Section 7) are also relevant. The evidence in this section is brought together with these wider
factors in deriving conclusions on future housing provision in Section 9.
Overview of Projections Prepared
The start point for any projection is reasonably an analysis of the most recent Government 5.4
projections. This is reaffirmed in the Planning Practice Guidance.
At the time of writing the latest Government projections are the 2011-based ‘interim’ Sub-national 5.5
Population Projections (SNPP) and the 2011-based ‘interim’ Household Projections from CLG
(which are directly based on the SNPP). These projections are important as they provide a
consistent approach where key inputs (such as levels of internal migration) sum at a national level.
The SNPP is also a good source of data as it uses a ‘multi-regional’ model that studies migratory
movements by age and sex between all local authorities in the Country. The SNPP is however
limited by the accuracy of data underpinning it, such as migration which is notoriously difficult to
accurately measure – particularly at smaller area level. This is considered below.
As well as studying housing need on the basis of demographic trends, a number of scenarios have 5.6
been developed to look at the link between employment growth and housing need. In total four core
scenarios have been developed to consider future housing provision. These are described in Table
17 below.
20
CLG (March 2014) Planning Practice Guidance: Housing and Economic Development Needs Assessments

Oxfordshire Strategic Housing Market Assessment: April 2014
GL Hearn Page 76 of 188
J:\Planning\Job Files\J029822 - Oxfordshire SHMA\Reports\Final SHMA Report (11.04.14).docx
Overview of Projection Scenarios Table 17:
Scenario Description Comments on Projection
PROJ 1 SNPP This projection uses the latest ONS and CLG population/household
projections and extends the projection period from 2021 through to
2031. This can be considered as the start point for considering
housing need, in line with the Guidance.
PROJ 2 SNPP (updated) This projection uses the baseline information in PROJ 1 but updates
key demographic trend data (around migration) to take account of new
ONS Mid-Year Population Estimates. In Oxford this projection looks at
actual population change in the 2001-11 period and develops a
bespoke model (recognising that the ONS migration estimates for
Oxford look to be substantially inaccurate).
PROJ 3 Economic baseline This projection takes a baseline forecast for future employment
growth, based on the Alternative Population Scenario developed by
Cambridge Econometrics and SQW. It estimates the likely population
and household growth required to meet the potential labour demand.
The projection includes assumptions around commuting patterns –
assuming these to remain at a constant level (as indicated in the 2001
Census).
PROJ 4 Committed
economic growth
This projection is based on the Committed Economic Growth Scenario
for employment growth developed by Cambridge Econometrics and
SQW. This reflects policy influences which provide potential to support
higher economic growth than indicated in the baseline forecasts. It
considers the level of housing need which might be necessary to
support this level of employment growth.
Interrogation of Latest National Projections
Table 18 below shows household growth in each of the five local authority areas in the HMA from 5.7
the 2011-based CLG Projections. The projections cover the 10-year period to 2021 which is the full
period covered by CLG.
For the whole of Oxfordshire these projections suggest a 7% increase in households. This is 5.8
notably below the average growth expected in the South East (10.8%) and nationally (10%). The
lower level of growth is mainly due to a negative figure being seen for Oxford, although growth in
South Oxfordshire and to a lesser extent Vale of White Horse is also low.
Stronger household growth is projected in West Oxfordshire and Cherwell districts, within both 5.9
cases growth rates being above regional and national averages (at 10.8% and 10.0% respectively).
In West Oxfordshire in particular this appears to have been influenced by stronger relative past
housing delivery (as our analysis in Section 3 set out – see Table 18).

Oxfordshire Strategic Housing Market Assessment: April 2014
GL Hearn Page 77 of 188
J:\Planning\Job Files\J029822 - Oxfordshire SHMA\Reports\Final SHMA Report (11.04.14).docx
Projected Household Growth 2011-21 – CLG 2011-based Household Projections Table 18:
Area Households
2011
Households
2021
Change in
households
% change
from 2011
Cherwell 56,881 63,765 6,884 12.1%
Oxford 54,997 53,613 -1,384 -2.5%
South Oxfordshire 54,387 57,989 3,602 6.6%
Vale of White Horse 49,781 53,656 3,875 7.8%
West Oxfordshire 43,510 48,784 5,274 12.1%
Oxfordshire 259,556 277,807 18,251 7.0%
Source: CLG 2011-based Household Projections
Whilst we would suggest that the figures in the household projections in the main look reasonable, it 5.10
is clearly the case that the figures for Oxford are not realistic. As the market data has shown, there
is a high demand for housing in the City (as evidenced through high house prices, rent levels and
the need for affordable housing). Despite this the SNPP actually projects a significant level of net
out-migration over the ten year period from 2011.
We have therefore sought to interrogate the data feeding into the SNPP in more detail to develop 5.11
an alternative projection which also takes account of data published since the release of the SNPP.
In particular we have considered the 2011 Mid-Year Population Estimates (which look at
components of change such as migration from 2001-11 and have been rebased to take account of
Census population estimates) and the 2012 Mid-Year Population Estimates which were published
in June 2013.
The analysis focusses on Oxford although consideration of these data sources has been taken into 5.12
account for all other areas.
Understanding Migration Patterns to/from Oxford
Figure 43 shows past trends in migration from 2001 to 2012 and how ONS is projecting this moving 5.13
forward. The data shows over the past decade that there has been fairly constant net internal out-
migration from the City, with international in-migrants out numbering out-migrants in virtually all
years.
In projecting forward, ONS has recognised a net out migration to other parts of the UK; although the 5.14
gap between in- and out-migration looks to be quite wide when compared with recent trends. For
international migration a level of net in-migration is also recognised, although in this case the gap
looks to be quite small relative to past trends. In the case of both internal and international migration
it can also be observed that the levels projected by ONS (for both in- and out-migration) are
somewhat higher than has been observed for much of the projection period.

Oxfordshire Strategic Housing Market Assessment: April 2014
GL Hearn Page 78 of 188
J:\Planning\Job Files\J029822 - Oxfordshire SHMA\Reports\Final SHMA Report (11.04.14).docx
Past and Projected Trends in Migration – Oxford Figure 43:
Source: ONS
Differences between past trends and future projections can more clearly be seen if the analysis 5.15
compares net migration to/from the City – this is shown in Figure 44. The analysis shows an almost
complete disconnect between what has happened in the past and what is expected in the future.
Whilst past trends are highly variable the overall pattern looking back over the past decade is one of
a level of net in-migration. It is considered that this should be included in modelling of future
demographic change.
0
2,000
4,000
6,000
8,000
10,000
12,000
14,000
16,000
18,000
20,000
20
01/2
20
02/3
20
03/4
20
04/5
20
05/6
20
06/7
20
07/8
20
08/9
20
09/1
0
20
10/1
1
20
11/1
2
20
12/1
3
20
13/1
4
20
14/1
5
20
15/1
6
20
16/1
7
20
17/1
8
20
18/1
9
20
19/2
0
20
20/2
1
Internal in Internal out International in International out
Internal in Internal out International in International out

Oxfordshire Strategic Housing Market Assessment: April 2014
GL Hearn Page 79 of 188
J:\Planning\Job Files\J029822 - Oxfordshire SHMA\Reports\Final SHMA Report (11.04.14).docx
Projection Migration 2011/12 to 2030/31 Figure 44:
Source: ONS
To develop a trend-based demographic projection for Oxford, our analysis has looked at population 5.16
change in the period from 2001 to 2011. This is a good timeframe to use, as both the start and end
points are expected to be reasonably accurate given that they are informed by Census data. We
have looked at the number of births and deaths and used the ‘residual’ population growth as an
indication of the likely level of net-migration over the period.
Table 19 below shows that between 2001 and 2011 the population of the City grew by around 5.17
14,700 people. Of this an estimated 8,500 is due to natural change (i.e. more births than deaths)
with the remaining 6,300 likely to be due to net in-migration to the City. It is possible that some of
the change is due to inaccuracies in Census data or other changes in the population (such as the
prison, armed forces population), but it is most likely that net migration was around 6,300 people
over the decade studied.
Population change in Oxford 2001-11 Table 19:
Component Figure - Oxford
Population 2001 135,509
Population 2011 150,245
Change in population (2001-11) 14,736
Natural change 8,469
Migration and other changes 6,267
Source: ONS
-3,000
-2,000
-1,000
0
1,000
2,000
3,000
2001/2
2002/3
2003/4
2004/5
2005/6
2006/7
2007/8
2008/9
2009/10
2010/11
2011/12
2012/13
2013/14
2014/15
2015/16
2016/17
2017/18
2018/19
2019/20
2020/21
Net
mig
rati
on
Past trend Projected

Oxfordshire Strategic Housing Market Assessment: April 2014
GL Hearn Page 80 of 188
J:\Planning\Job Files\J029822 - Oxfordshire SHMA\Reports\Final SHMA Report (11.04.14).docx
This information has been used to develop a ‘trend-based’ demographic model. In projecting 5.18
forward, it is assumed that net migration will be around 600 people per annum. This is consistent
with past trends and is significantly above levels of expected migration in the latest (2011-based)
ONS Projections.
For the model it is also important to establish levels of internal migration (i.e. from one part of the 5.19
Country to another) as well as international migration. Again we have looked at ONS mid-year
population estimate data from 2001 to 2011. This source suggests an average level of net out-
migration to other parts of the Country of about 1,600 people per annum; being offset by net
international in-migration of about 1,900 people. These two figures together suggest a net in-
migration of about 300 people per annum. However, the ONS data also includes a category of
population growth called ‘Unattributable Population Change’ (UPC).
The UPC is a change in population which is evident from the population data but is unknown in 5.20
terms of the component for which it comes. ONS note that the UPC could be caused by a range of
factors including mis-recording of migration or errors in the Census database (either in 2001 or
2011). In Oxford (and in consultation with the City Council) it has been agreed that the difference
between the overall estimate of migration (600 per annum) and the various components (which
come to 300 per annum) will be largely due to an over-estimate of international out-migration – this
is the component which is recognised as the most problematic for ONS to record. Hence for
analysis it is assumed that there will be an additional 300 people net international migration over
and above the figures recorded by ONS.
Overall, therefore the analysis assumes net international in-migration of 2,200 people per annum 5.21
and net internal out-migration of 1,600 people each year. These levels have been assumed to be
constant throughout the projection period (which is generally consistent with the ONS projected
patterns but at a substantially different level).
Understanding Migration Patterns to/from other areas in Oxfordshire
For other areas in the County a similar process has been undertaken (i.e. to study more recent 5.22
releases of migration data along with any differences in past population growth once calibrated to
Census information). This does see some changes to projections in each area although when
compared with Oxford the differences are comparatively minor.
The revisions are in part based on an adjustment due to the UPC which, as described above, is 5.23
likely to be as a result of mis-recording of migration in the past; as well as data about migration for
2010/11 and 2011/12 which post-dates the information feeding into the latest ONS projections.

Oxfordshire Strategic Housing Market Assessment: April 2014
GL Hearn Page 81 of 188
J:\Planning\Job Files\J029822 - Oxfordshire SHMA\Reports\Final SHMA Report (11.04.14).docx
In Cherwell the updating of the SNPP see estimated net in-migration from 2011 to 2021 decrease 5.24
from 323 per annum to 34. In South Oxfordshire the average level of net migration increases from
215 to 379 per annum; with an increase from 324 to 419 being observed in Vale of White Horse. In
West Oxfordshire there is a small decrease in the level of migration from 720 per annum to 593. For
the whole of Oxfordshire our revised demographic projection sees net in-migration of over 2,000
people per annum. This compares with just 300 if we were to simply take the latest ONS projections.
These figures are all shown in Table 20 below. High migration to West Oxfordshire again stands out
(and underpins the relatively stronger household growth projected for the District).
ONS Migration Assumptions and Revised Position Table 20:
Area Average net
migration (ONS)
Revised average
net migration
Difference
Cherwell 323 34 -289
Oxford -1,273 600 +1,873
South Oxfordshire 215 379 +164
Vale of White Horse 324 419 +95
West Oxfordshire 720 593 -127
HMA Total 309 2,025 +1,716
Source: Derived from ONS data
Standing back from these figures we can also consider this against the data in Table 15. This 5.25
showed higher household growth for Cherwell and West Oxfordshire along with lower figures in
South Oxfordshire and the Vale of White Horse. Our updated interrogation of migration data will
therefore bring some of these differences closer together.
Updated Demographic-based Assessment of Housing Need to 2021
Table 21 below shows the outputs of our adjusted migration modelling when converted through into 5.26
household growth (linked to headship rate assumptions in the 2011-based CLG household
projections). The data now suggests household growth across the County of 9.5% over the decade,
with the big difference from earlier figures being the projection output for Oxford. The table also
confirms some closing of the gap between projected household growth rates in other areas in the
County, although South Oxfordshire and Vale of White Horse still show the lowest levels of
household growth.

Oxfordshire Strategic Housing Market Assessment: April 2014
GL Hearn Page 82 of 188
J:\Planning\Job Files\J029822 - Oxfordshire SHMA\Reports\Final SHMA Report (11.04.14).docx
Projected Household Growth 2011-21 – based on Amended Migration Levels Table 21:
Area Households
2011
Households
2021
Change in
households
% change
from 2011
Cherwell 56,882 62,586 5,703 10.0%
Oxford 54,999 60,841 5,843 10.6%
South Oxfordshire 54,391 58,554 4,164 7.7%
Vale of White Horse 49,781 53,985 4,204 8.4%
West Oxfordshire 43,509 48,345 4,836 11.1%
HMA Total 259,562 284,311 24,750 9.5%
Source: CLG 2011-based Household Projections & JGC Modelling
For these projections to be useful for planning purposes, it is however necessary to extend the 5.27
projection period to beyond 2021 and the analysis in the report now moves on to look at housing
requirements in the period from 2011 to 2031. Below we have set out the methodology for carrying
out the longer-term projections.
Overview of Methodology for Demographic Projections
To assess future housing need, it is necessary to establish is the current population and how will 5.28
this change in the period to 2031. This involves working out how likely it is that women will give birth
(the fertility rate); how likely it is that people will die (the death rate); and how likely it is that people
will move into or out of each local authority. These are the principal components of population
change and are used to construct the population projections. Figure 45 shows the key stages of the
projection analysis used to derive an assessment of housing need.

Oxfordshire Strategic Housing Market Assessment: April 2014
GL Hearn Page 83 of 188
J:\Planning\Job Files\J029822 - Oxfordshire SHMA\Reports\Final SHMA Report (11.04.14).docx
Overview of Methodology Figure 45:
Migration Level Assumptions to 2031
Our projection uses information in the ONS 2010- and 2011-based Sub-National Population 5.29
Projections (SNPP) which has been amended to take account of more recent data on migration and
population growth. The broad methodology for the updating of these projections is described above
and has been applied consistently to all areas in the County, with the exception of Oxford where a
bespoke view about migration has been developed.
Figure 46 shows the levels of net migration assumed by our projections from 2011/12 to 2030/31 in 5.30
each of the five areas. For the whole County the projections start in 2011/12 with a net in-migration
figure of around 1,870. This is expected to increase over time and finishes with a net in-migration of
around 2,920 people by 2030/31. For the projection period studied as a whole, the average level of
net migration is an in-migration of 2,440 people per annum.

Oxfordshire Strategic Housing Market Assessment: April 2014
GL Hearn Page 84 of 188
J:\Planning\Job Files\J029822 - Oxfordshire SHMA\Reports\Final SHMA Report (11.04.14).docx
For individual areas however the figures do vary. In Oxford we have set net migration at a constant 5.31
level for the whole projection period. In all other areas levels of net in-migration are expected to
increase over time. There is some logic to this pattern. As populations grow the number of people in
other areas who could in-migrate to the Districts will increase and so in-migration could go up.
Regarding out-migration, it is the case that the population of Oxfordshire is ageing with older people
tending to be less migrant. The projection that the gap between in- and out-migration will increase
slightly over the projection period is therefore perfectly plausible.
Projection Migration 2011/12 to 2030/31 Figure 46:
Source: ONS 2010- and 2011-based Subnational Population Projections; JGC Modelling
It should be noted that the 2011-based SNPP only projects for a ten-year period to 2021. Beyond 5.32
2021 we have used 2010-based SNPP data, but adjusted this to take account of the differences
shown between the 2010- and 2011-based versions of the SNPP in 2020/21. In other words the
migration levels in the 2010-based Projections have been rebased to be consistent with the last
year of data in the 2011-based version. This rebasing is in addition to the updating carried out to
take account of more recent migration and population change data. Again the approach taken in
Oxford is different with a constant level and profile of migration being assumed for the whole of the
projection.
0
100
200
300
400
500
600
700
800
900
20
11/1
2
20
12/1
3
20
13/1
4
20
14/1
5
20
15/1
6
20
16/1
7
20
17/1
8
20
18/1
9
20
19/2
0
20
20/2
1
20
21/2
2
20
22/2
3
20
23/2
4
20
24/2
5
20
25/2
6
20
26/2
7
20
27/2
8
20
28/2
9
20
29/3
0
20
30/3
1
Net
mig
ration
Cherwell Oxford South Oxon VoWH West Oxon

Oxfordshire Strategic Housing Market Assessment: April 2014
GL Hearn Page 85 of 188
J:\Planning\Job Files\J029822 - Oxfordshire SHMA\Reports\Final SHMA Report (11.04.14).docx
Baseline Population
The baseline for the projections is taken to be 2011 with the projections run for each year over the 5.33
period up to 2031. The estimated population profile as of 2011 has been taken from the 2011-based
Mid-Year Population Estimates (from ONS). The overall population in 2011 for the whole County
was estimated to be 654,791 with slightly more females than males.
Population of Oxfordshire (5 year age bands) – 2011 Figure 47:
Age group Male Female
Ages 0-4 20,886 20,264
Ages 5-9 18,265 17,992
Ages 10-14 19,135 18,168
Ages 15-19 21,613 20,175
Ages 20-24 25,043 22,598
Ages 25-29 23,564 23,090
Ages 30-34 22,361 21,630
Ages 35-39 21,341 22,204
Ages 40-44 23,662 24,207
Ages 45-49 23,969 24,455
Ages 50-54 20,673 20,932
Ages 55-59 17,781 18,211
Ages 60-64 18,790 19,143
Ages 65-69 14,769 15,992
Ages 70-74 11,563 12,600
Ages 75-79 9,360 10,468
Ages 80-84 6,445 8,576
Ages 85+ 4,904 9,962
All Ages 324,124 330,667
Source: ONS Mid-Year Population Estimates
Fertility, Mortality and Migration Profile Assumptions
Fertility and mortality rates contained within the ONS 2010-based Sub-National Population 5.34
Projections have been used in the modelling – these are the same as used by ONS in the 2011-
based projections. In all areas these are consistent with past trend data and future expected
patterns as published by ONS on a national basis.
For Oxford, changes have been made to the assumed fertility levels to take account of an 5.35
underestimate of population growth although mortality rates are consistent with the latest ONS data.
Table 22 shows fertility and mortality patterns for key periods of the projection. The figures shown
are for total fertility rate (TFR) and life expectancy at birth (e0).
3.2%
2.8%
2.9%
3.3%
3.8%
3.6%
3.4%
3.3%
3.6%
3.7%
3.2%
2.7%
2.9%
2.3%
1.8%
1.4%
1.0%
0.7%
3.1%
2.7%
2.8%
3.1%
3.5%
3.5%
3.3%
3.4%
3.7%
3.7%
3.2%
2.8%
2.9%
2.4%
1.9%
1.6%
1.3%
1.5%
5% 4% 3% 2% 1% 0% 1% 2% 3% 4% 5%
Ages 0-4
Ages 5-9
Ages 10-14
Ages 15-19
Ages 20-24
Ages 25-29
Ages 30-34
Ages 35-39
Ages 40-44
Ages 45-49
Ages 50-54
Ages 55-59
Ages 60-64
Ages 65-69
Ages 70-74
Ages 75-79
Ages 80-84
Ages 85+
Female Male

Oxfordshire Strategic Housing Market Assessment: April 2014
GL Hearn Page 86 of 188
J:\Planning\Job Files\J029822 - Oxfordshire SHMA\Reports\Final SHMA Report (11.04.14).docx
Fertility and Mortality Assumptions (key periods) Table 22:
Age group Cherwell Oxford
South
Oxfordshire
Vale of White
Horse
West
Oxfordshire
TFR – 2011/12 2.20 1.39 2.29 2.21 2.30
TFR – 2030/31 2.00 1.23 2.10 2.02 2.09
Male e0 – 2011/12 79.4 78.8 80.4 80.8 80.5
Male e0 – 2030/31 83.0 82.3 84.0 84.4 84.2
Female e0 – 2011/12 83.5 83.1 84.1 84.6 84.1
Female e0 – 2030/31 86.7 86.5 87.3 87.8 87.2
Source: ONS 2010-based SNPP
For the purposes of understanding the profile of migrants the modelling has again drawn on the 5.36
ONS 2010- and 2011-based Sub-National Population Projections with the adjustments made to
overall levels of migration feeding into migration profiles (by age and sex) on a pro-rata basis.
Although we have made some changes to overall migration levels, we have no evidence that the
general profile in the SNPP is fundamentally wrong. The exception to this is in the case of Oxford
where a migration profile has been based on understanding population change in the 2001 to 2011
(linking to earlier analysis about overall population change in the City).
Figure 48 below shows levels of net migration by age group in each area. The data is dominated by 5.37
an in-migration of people aged 15-19 to Oxford, with strong levels of net out-migration for age
groups 20-34. In all other areas the data shows a net out-migration of those aged 15-19 with in-
migration of most other age groups. The trends are strongly linked to the student population.
When projecting migration patterns for the various projection scenarios we have used the migration 5.38
data and adjusted levels of net migration to match the requirements of our scenario (e.g. when
testing what level of migration is required to support a workforce of a particular size). This approach
has consistently been adopted across all analysis.

Oxfordshire Strategic Housing Market Assessment: April 2014
GL Hearn Page 87 of 188
J:\Planning\Job Files\J029822 - Oxfordshire SHMA\Reports\Final SHMA Report (11.04.14).docx
Estimated annual level of net migration by five-year age band (2011-2031) Figure 48:
-2,000
-1,000
0
1,000
2,000
3,000
4,000
5,000
0-4 5-9 10-
14
15-
19
20-
24
25-
29
30-
34
35-
39
40-
44
45-
49
50-
54
55-
59
60-
64
65-
69
70-
74
75-
79
80-
84
85+
Age group
Est
imat
ed a
nnua
l lev
el o
f mig
ratio
n (p
eopl
e)
Cherwell
Oxford
South Oxon
VoWH
West Oxon
Source: Derived from ONS 2010-based Population Projections and population change data for Oxford
Assumptions for Economic-Led Projections
Much of the analysis earlier in this section has concentrated on past demographic trends and 5.39
projected these forward to consider future housing need. It sets out that where the supply of
working age population that is economically active (labour force supply) is less than the projected
job growth, this could result in unsustainable commuting patterns (depending on public transport
accessibility and other sustainable options such as walking and cycling) and could reduce the
resilience of local businesses. In such circumstances, plan makers will need to consider how the
location of new housing and infrastructure development could help to address these problems.
Paragraph 158 in the NPPF sets out that evidence and strategies for housing and employment in 5.40
local plans should align with one another.
Alongside work on the SHMA, Cambridge Econometrics and SQW have worked with the local 5.41
authorities to develop three sets of economic projections. These were:
Baseline projections from their LEFM Model;
Alternative Population Scenario which takes account of our demographic projections;
Committed Economic Growth Scenario.
The process and basis of developing these three scenarios has been described in Section 4. The 5.42
Alternative Population Scenario adjusts the baseline LEFM Projections to take account of the above
analysis regarding projected population growth and makes an additional adjustment to reflect the
specific drivers of employment in the education sector in Oxfordshire.
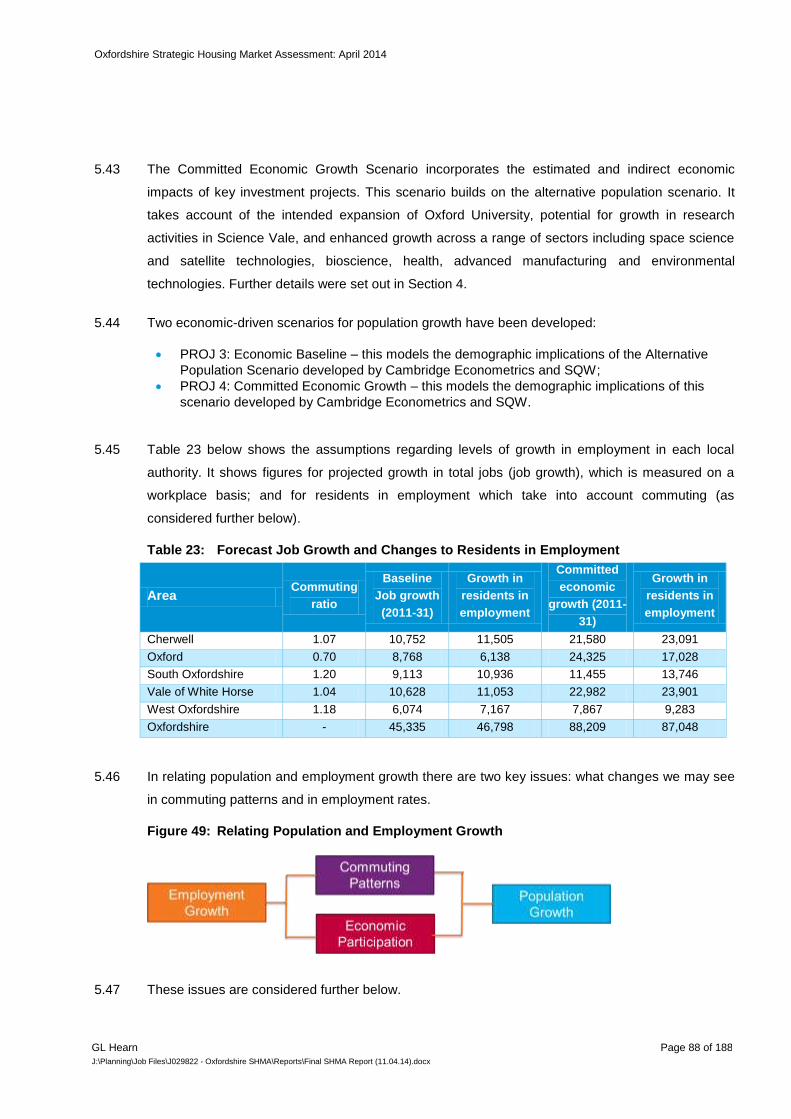
Oxfordshire Strategic Housing Market Assessment: April 2014
GL Hearn Page 88 of 188
J:\Planning\Job Files\J029822 - Oxfordshire SHMA\Reports\Final SHMA Report (11.04.14).docx
The Committed Economic Growth Scenario incorporates the estimated and indirect economic 5.43
impacts of key investment projects. This scenario builds on the alternative population scenario. It
takes account of the intended expansion of Oxford University, potential for growth in research
activities in Science Vale, and enhanced growth across a range of sectors including space science
and satellite technologies, bioscience, health, advanced manufacturing and environmental
technologies. Further details were set out in Section 4.
Two economic-driven scenarios for population growth have been developed: 5.44
PROJ 3: Economic Baseline – this models the demographic implications of the Alternative
Population Scenario developed by Cambridge Econometrics and SQW;
PROJ 4: Committed Economic Growth – this models the demographic implications of this
scenario developed by Cambridge Econometrics and SQW.
Table 23 below shows the assumptions regarding levels of growth in employment in each local 5.45
authority. It shows figures for projected growth in total jobs (job growth), which is measured on a
workplace basis; and for residents in employment which take into account commuting (as
considered further below).
Forecast Job Growth and Changes to Residents in Employment Table 23:
Area Commuting
ratio
Baseline
Job growth
(2011-31)
Growth in
residents in
employment
Committed
economic
growth (2011-
31)
Growth in
residents in
employment
Cherwell 1.07 10,752 11,505 21,580 23,091
Oxford 0.70 8,768 6,138 24,325 17,028
South Oxfordshire 1.20 9,113 10,936 11,455 13,746
Vale of White Horse 1.04 10,628 11,053 22,982 23,901
West Oxfordshire 1.18 6,074 7,167 7,867 9,283
Oxfordshire - 45,335 46,798 88,209 87,048
In relating population and employment growth there are two key issues: what changes we may see 5.46
in commuting patterns and in employment rates.
Relating Population and Employment Growth Figure 49:
These issues are considered further below. 5.47

Oxfordshire Strategic Housing Market Assessment: April 2014
GL Hearn Page 89 of 188
J:\Planning\Job Files\J029822 - Oxfordshire SHMA\Reports\Final SHMA Report (11.04.14).docx
It should be recognised that the relationship between overall economic growth, growth in 5.48
employment and population growth will also be influenced by changes to productivity and to the
balance between full- and part-time working. The projections are sensitive to these factors. The
demographic projections in this report have assumed that a similar scale of growth in the workforce
to projected growth in total jobs would be necessary.
Employment Rates
Changes in the demographic structure result in alterations in the number of people who are working 5.49
(as the population of people of working age changes). The next stage of the projection process
estimates how employment levels change under each of the projections and to consider the
demographic implications of different levels of employment growth.
The methodology applied here includes consideration of recent trends in economic activity rates 5.50
along with the likelihood that some people will work longer due to changes in pensionable age.
Profiles for the proportion of people working were developed for a series of broad age groups (by
sex) from 16 to 74.
Figure 50 below shows past trends in economic activity rates (nationally) based on Census data. A 5.51
similar analysis using Labour Force Survey data shows almost exactly the same pattern. The data
shows that there have been some notable increases in activity rates for older age groups over the
past decade.
To project these rates forward, it has been assumed that there will be some continuation of the 5.52
trends shown below although these have been tempered slightly. The overall assumption is that
rates will change moving forward at a rate which is around half of the rate seen over the past
decade. For older age groups (and females for most age groups) this sees some increase in
employment rates. For those aged 16-24 the rates are assumed to continue declining, but at a
lesser rate to that observed over the 2001-11 decade.

Oxfordshire Strategic Housing Market Assessment: April 2014
GL Hearn Page 90 of 188
J:\Planning\Job Files\J029822 - Oxfordshire SHMA\Reports\Final SHMA Report (11.04.14).docx
Past Trends and Projected Change to Economic Activity Rates Figure 50:
Males Females
Source Census
Although the overall employment rates in the analysis will vary depending on the scenario being run 5.53
Table 24 below provides an indication of how employment rates (measured as the proportion of the
population aged 16-74 who are working) are projected to change in each area. The analysis is
based on the projection linked to updated demographics (PROJ 2) with very small differences to be
observed with alternative scenarios. The data shows increases in employment rates in the region of
1%-2% in all areas.
Employment Rate Assumptions (key periods) Table 24:
Age group Cherwell Oxford
South
Oxfordshire
Vale of White
Horse
West
Oxfordshire
Male – 2011 76.5% 61.7% 76.8% 76.3% 78.5%
Male – 2031 76.2% 61.5% 76.7% 76.0% 78.4%
Female – 2011 68.0% 57.8% 67.1% 66.9% 69.0%
Female – 2031 70.7% 61.4% 70.6% 70.4% 71.7%
Total – 2011 72.3% 59.7% 71.9% 71.6% 73.7%
Total – 2031 73.5% 61.4% 73.6% 73.2% 75.0%
Source: Derived from LFS and Census data
Commuting Patterns
The commuting ratio describes the relationship between the number of people working in an area 5.54
and the residents in employment. A number over 1 suggests some net out-commuting; with a figure
below 1 suggesting that some employment growth in the area is expected to be supported by
people commuting into the area to work.
0%
10%
20%
30%
40%
50%
60%
70%
80%
90%
100%
% o
f pop
ulat
ion
econ
omic
ally
act
ive
Year
16-24
25-34
35-49
50-64
65+
0%
10%
20%
30%
40%
50%
60%
70%
80%
90%
100%
% o
f pop
ulat
ion
econ
omic
ally
act
ive
Year
16-24
25-34
35-49
50-64
65+

Oxfordshire Strategic Housing Market Assessment: April 2014
GL Hearn Page 91 of 188
J:\Planning\Job Files\J029822 - Oxfordshire SHMA\Reports\Final SHMA Report (11.04.14).docx
In this updated assessment we have used the following commuting ratios (based on figures from 5.55
the 2001 Census). No adjustment has been made to these – we consider that we would need a
strong justification to do so At this stage. Table 25 shows the commuting ratios. It indicates net in-
commuting to Oxford, and net out-commuting from other authorities.
Commuting Ratios Table 25:
Area Commuting Ratio
Cherwell 1.07
Oxford 0.70
South Oxfordshire 1.20
Vale of White Horse 1.04
West Oxfordshire 1.18
Source: 2001 Census
Projecting Household Growth
Having estimated the population size and the age/sex profile of the population the next step in the 5.56
process is to convert this information into estimates of the number of households in the area. To do
this we use the concept of headship rates. Headship rates can be described in their most simple
terms as the number of people who are counted as heads of households (or in this case the more
widely used Household Reference Person (HRP)).
In calculating headship rates, the population living in ‘communal establishments’ is excluded. This 5.57
includes those living in nursing homes, halls of residence, military barracks and prisons.
Figure 51 shows the estimated average household size in Oxfordshire in 2001 and 2011 along with 5.58
estimated household sizes derived from CLG Projections. The data shows that household sizes
have increased slightly over the past decade whereas the 2008-based Projections expected a
moderate fall. Moving forward the 2011-based Household Projections expect to see a decline in
average household sizes; although this again is not as rapid as expected by the 2008-based
Projections.
In interpreting this data it is important to consider the extent to which household formation may have 5.59
been constrained in the past (possibly due to mortgage finance constraints) and we have looked at
this issue to develop the most realistic scenario moving forward.
Firstly, whilst the 2011-based CLG projections suggest a decrease in average household sizes, 5.60
moving forward an analysis of individual rates when attached to a constant age structure suggest
that household sizes would actually go up. This suggests that the CLG projections are expecting
some degree of constraint in the future (which is likely to have been driven by past trends). Whilst

Oxfordshire Strategic Housing Market Assessment: April 2014
GL Hearn Page 92 of 188
J:\Planning\Job Files\J029822 - Oxfordshire SHMA\Reports\Final SHMA Report (11.04.14).docx
this analysis is not perfect as headship rates themselves will be influenced by other factors in the
future (such as people living longer), there is a case for adjusting the assumptions used to ensure
that the projections are not planning for continued constraints in household formation.
An alternative view has therefore been developed (which is shown as the brown line with diamonds 5.61
in Figure 51). This trend is based on household formation rates across all ages being roughly in
balance in 2011 and then through to 2031. Some headship rates do change (particularly as a result
of people living longer and there being more ‘elderly’ couple households), but overall this trend
would see no further suppression of household formation.
It is interesting to note that the headship rate assumptions when converted into average household 5.62
sizes broadly track expected changes in the 2008-based CLG projections and are also quite similar
to the outputs we might expect if we exactly replicated 2008-based figures rebased to the 2011 start
point. The projections therefore move away from 2011-based CLG figures as these appear to
include some degree of suppression in headship rates.
The projections which follow in the report are based on these assumptions about headship rates 5.63
which use household formation rates from the 2008-based projections, rebased to 2011.
For the purposes of the projection it is assumed that average household sizes start at about 2.52 in 5.64
2011 and reduce down to 2.41 in 2031 (although exact figures do vary depending on the projection
being run).

Oxfordshire Strategic Housing Market Assessment: April 2014
GL Hearn Page 93 of 188
J:\Planning\Job Files\J029822 - Oxfordshire SHMA\Reports\Final SHMA Report (11.04.14).docx
Past and projected trends in Average Household Size – Oxfordshire Figure 51:
Source: Derived from ONS and CLG data
Converting Households to Dwellings
In converting an estimated number of households into requirements for additional dwellings a small 5.65
allowance for vacant and second homes is included. For the analysis it is assumed that between
about 3% and 5% of additional stock will comprise vacant or second homes. The figures used are
based on analysis of the proportion of household spaces shown in the 2011 Census with no usual
residents and are summarised in the figure below.
Vacant and Second Home Assumptions Table 26:
Area Assumed Rate
Cherwell 4.0%
Oxford 4.0%
South Oxfordshire 4.5%
Vale of White Horse 3.2%
West Oxon 5.2%
Oxfordshire 4.2%
Source: 2011 Census
2.2
2.3
2.4
2.5
2.6
20
01
20
02
20
03
20
04
20
05
20
06
20
07
20
08
20
09
20
10
20
11
20
12
20
13
20
14
20
15
20
16
20
17
20
18
20
19
20
20
20
21
20
22
20
23
20
24
20
25
20
26
20
27
20
28
20
29
20
30
20
31
Avera
ge H
ousehold
Siz
e
Trend (Census)
Projected (CLG 2011-based)
Projected (CLG 2008-based)
Projected (constant age structure)
Projected (constant headship)
08-based (rebased to 2011)

Oxfordshire Strategic Housing Market Assessment: April 2014
GL Hearn Page 94 of 188
J:\Planning\Job Files\J029822 - Oxfordshire SHMA\Reports\Final SHMA Report (11.04.14).docx
Projection Results
Population Projections
Table 27 and Figure 52 summarise the expected growth in the population at the HMA level. The 5.66
Updated SNPP Projection (PROJ 2) indicates 16.4% population growth. In contrast the committed
economic growth scenario indicates stronger population growth, of 28.1% over the 2011-31 period.
Population Estimates 2011 to 2031 Table 27:
2011 2016 2021 2026 2031
PROJ 1 – SNPP 654,791 675,719 694,287 713,456 731,554
0.0% 3.2% 6.0% 9.0% 11.7%
PROJ 2 – SNPP
(updated)
654,791 683,477 711,360 737,657 762,255
0.0% 4.4% 8.6% 12.7% 16.4%
PROJ 3 –
Economic baseline
654,791 684,856 711,254 739,771 764,386
0.0% 4.6% 8.6% 13.0% 16.7%
PROJ 4 –
Committed
economic growth
654,791 707,241 761,557 802,318 838,724
0.0% 8.0% 16.3% 22.5% 28.1%
Population Change, 2011 – 2031 Figure 52:
650,000
700,000
750,000
800,000
850,000
20
11
20
12
20
13
20
14
20
15
20
16
20
17
20
18
20
19
20
20
20
21
20
22
20
23
20
24
20
25
20
26
20
27
20
28
20
29
20
30
20
31
Popula
tion
PROJ 1 (SNPP)
PROJ 2 (SNPP - updated)
PROJ 3 (Economic baseline)
PROJ 4 (Committed economic growth)
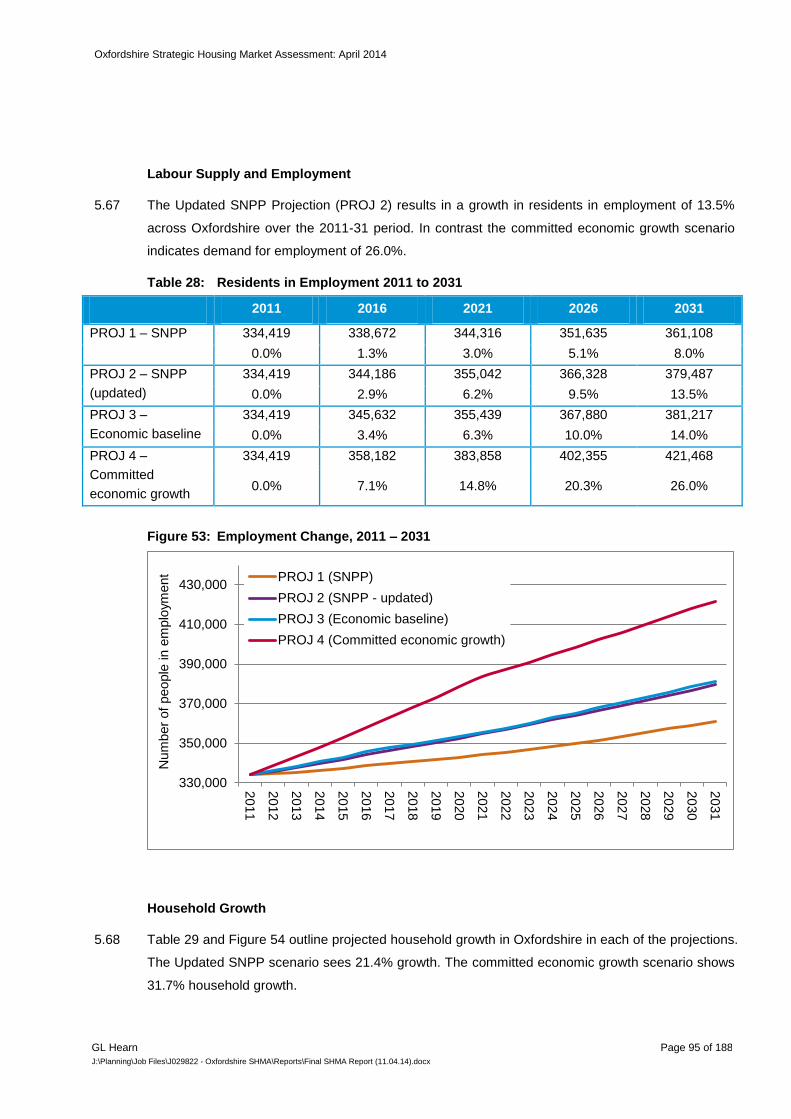
Oxfordshire Strategic Housing Market Assessment: April 2014
GL Hearn Page 95 of 188
J:\Planning\Job Files\J029822 - Oxfordshire SHMA\Reports\Final SHMA Report (11.04.14).docx
Labour Supply and Employment
The Updated SNPP Projection (PROJ 2) results in a growth in residents in employment of 13.5% 5.67
across Oxfordshire over the 2011-31 period. In contrast the committed economic growth scenario
indicates demand for employment of 26.0%.
Residents in Employment 2011 to 2031 Table 28:
2011 2016 2021 2026 2031
PROJ 1 – SNPP 334,419 338,672 344,316 351,635 361,108
0.0% 1.3% 3.0% 5.1% 8.0%
PROJ 2 – SNPP
(updated)
334,419 344,186 355,042 366,328 379,487
0.0% 2.9% 6.2% 9.5% 13.5%
PROJ 3 –
Economic baseline
334,419 345,632 355,439 367,880 381,217
0.0% 3.4% 6.3% 10.0% 14.0%
PROJ 4 –
Committed
economic growth
334,419 358,182 383,858 402,355 421,468
0.0% 7.1% 14.8% 20.3% 26.0%
Employment Change, 2011 – 2031 Figure 53:
Household Growth
Table 29 and Figure 54 outline projected household growth in Oxfordshire in each of the projections. 5.68
The Updated SNPP scenario sees 21.4% growth. The committed economic growth scenario shows
31.7% household growth.
330,000
350,000
370,000
390,000
410,000
430,000
20
11
20
12
20
13
20
14
20
15
20
16
20
17
20
18
20
19
20
20
20
21
20
22
20
23
20
24
20
25
20
26
20
27
20
28
20
29
20
30
20
31
Num
ber
of
people
in e
mplo
yment PROJ 1 (SNPP)
PROJ 2 (SNPP - updated)
PROJ 3 (Economic baseline)
PROJ 4 (Committed economic growth)

Oxfordshire Strategic Housing Market Assessment: April 2014
GL Hearn Page 96 of 188
J:\Planning\Job Files\J029822 - Oxfordshire SHMA\Reports\Final SHMA Report (11.04.14).docx
Household Estimates 2011 to 2031 Table 29:
2011 2016 2021 2026 2031
PROJ 1 – SNPP 259,562 268,770 277,803 286,951 295,999
0.0% 3.5% 7.0% 10.6% 14.0%
PROJ 2 – SNPP
(updated)
259,562 273,739 287,601 301,271 314,996
0.0% 5.5% 10.8% 16.1% 21.4%
PROJ 3 –
Economic baseline
259,562 274,742 288,058 301,968 315,230
0.0% 5.8% 11.0% 16.3% 21.4%
PROJ 4 –
Committed
economic growth
259,562 281,686 304,625 323,667 341,802
0.0% 8.5% 17.4% 24.7% 31.7%
Household Change, 2011 – 2031 Figure 54:
Dwellings
The analysis above concentrated on the number of additional households. In reality there are 5.69
always likely to be some vacant homes in the area and so the number of properties required to
house all of these households will be slightly greater than the projected household numbers. A
vacancy allowance of around 3%-5% (depending on area) has therefore been applied to all of the
above figures to make estimated housing need.
250,000
270,000
290,000
310,000
330,000
350,000
20
11
20
12
20
13
20
14
20
15
20
16
20
17
20
18
20
19
20
20
20
21
20
22
20
23
20
24
20
25
20
26
20
27
20
28
20
29
20
30
20
31
Household
s
PROJ 1 (SNPP)
PROJ 2 (SNPP - updated)
PROJ 3 (Economic baseline)
PROJ 4 (Committed economic growth)

Oxfordshire Strategic Housing Market Assessment: April 2014
GL Hearn Page 97 of 188
J:\Planning\Job Files\J029822 - Oxfordshire SHMA\Reports\Final SHMA Report (11.04.14).docx
Table 30 shows an annual housing need for between 1,900 and 4,280 homes depending on the 5.70
scenario used – about 37,990 to 85,593 over the 20-year period to 2031. Housing need in the
Committed Economic Growth Scenario is notably higher than for either of the demographic
scenarios.
Estimated Housing Need with Vacancy Allowance (to 2031) Table 30:
Area Annual household
growth
Annual requirement
with vacancy
allowance
Requirement over
20-years
PROJ 1 – SNPP 1,822 1,900 37,990
PROJ 2 – SNPP (updated) 2,772 2,887 57,748
PROJ 3 – Economic baseline 2,783 2,900 57,996
PROJ 4 – Committed
Economic Growth 4,112 4,280 85,593
Summary Projection Results: Oxfordshire HMA
For the HMA as a whole, the demographic-led projections indicate a need for up to 2,900 homes a 5.71
year. This would support 0.7% per annum growth in employment. The Committed Economic Growth
Scenario is higher than this (showing a need for 4,300 homes per annum).
Summary of Projections 2011 to 2031 – Annual – HMA Table 31:
Projection Population growth Housing numbers Employment growth
Per
annum
%
change
Per
annum
%
change
Per
annum
%
change
PROJ 1 – SNPP 3,838 0.6% 1,900 0.7% 1,334 0.4%
PROJ 2 – SNPP (updated) 5,373 0.8% 2,887 1.1% 2,253 0.7%
PROJ 3 – Economic baseline 5,480 0.8% 2,900 1.1% 2,340 0.7%
PROJ 4 – Committed
economic growth 9,197 1.4% 4,280 1.6% 4,352 1.3%
Summary of Projections 2011 to 2031 – Total – HMA Table 32:
Projection Population growth Housing numbers Employment growth
Total %
change
Total %
change
Total %
change
PROJ 1 – SNPP 76,763 11.7% 37,990 14.0% 26,689 8.0%
PROJ 2 – SNPP (updated) 107,464 16.4% 57,748 21.4% 45,068 13.5%
PROJ 3 – Economic baseline 109,595 16.7% 57,996 21.4% 46,798 14.0%
PROJ 4 – Committed
economic growth 183,933 28.1% 85,593 31.7% 87,049 26.0%

Oxfordshire Strategic Housing Market Assessment: April 2014
GL Hearn Page 98 of 188
J:\Planning\Job Files\J029822 - Oxfordshire SHMA\Reports\Final SHMA Report (11.04.14).docx
Summary Projection Results by Authority
Cherwell
For Cherwell, PROJ 2 results in a housing need for 641 dwellings per annum which would 5.72
represent a 1.1% annual growth rate in the housing stock. The PROJ 3 economic baseline figures
are around 100 per annum above this with the Committed Economic Growth Scenario being
significantly higher (1,142 homes per annum).
Summary of Projections 2011 to 2031 – Annual - Cherwell Table 33:
Projection Population growth Housing numbers Employment growth
Per
annum
%
change
Per
annum
%
change
Per
annum
%
change
PROJ 1 – SNPP 1,191 0.8% 656 1.1% 597 0.8%
PROJ 2 – SNPP (updated) 918 0.6% 641 1.1% 426 0.6%
PROJ 3 – Economic baseline 1,184 0.8% 743 1.3% 575 0.8%
PROJ 4 – Committed
economic growth 2,224 1.6% 1,142 1.9% 1,155 1.5%
Summary of Projections 2011 to 2031 – Total – Cherwell Table 34:
Projection Population growth Housing numbers Employment growth
Total %
change
Total %
change
Total %
change
PROJ 1 – SNPP 23,827 16.7% 13,126 22.2% 11,947 16.0%
PROJ 2 – SNPP (updated) 18,369 12.9% 12,830 21.7% 8,513 11.4%
PROJ 3 – Economic baseline 23,677 16.6% 14,862 25.1% 11,505 15.4%
PROJ 4 – Committed
economic growth 44,485 31.3% 22,841 38.6% 23,091 30.9%
Oxford
For Oxford, PROJ 2 results in a housing need for 755 dwellings per annum representing a 1.3% 5.73
growth rate in the housing stock. Given the population age structure this supports a reasonable
growth in employment – indeed above both the baseline and committed economic growth scenarios.
This reflects the City’s younger age structure.

Oxfordshire Strategic Housing Market Assessment: April 2014
GL Hearn Page 99 of 188
J:\Planning\Job Files\J029822 - Oxfordshire SHMA\Reports\Final SHMA Report (11.04.14).docx
Summary of Projections 2011 to 2031 – Annual - Oxford Table 35:
Projection Population growth Housing numbers Employment growth
Per
annum
%
change
Per
annum
%
change
Per
annum
%
change
PROJ 1 – SNPP 149 0.1% -2 0.0% -81 -0.1%
PROJ 2 – SNPP (updated) 1,840 1.2% 755 1.3% 956 1.4%
PROJ 3 – Economic baseline 616 0.4% 289 0.5% 307 0.4%
PROJ 4 – Committed
economic growth 1,649 1.1% 700 1.2% 851 1.2%
Summary of Projections 2011 to 2031 – Total – Oxford Table 36:
Projection Population growth Housing numbers Employment growth
Total %
change
Total %
change
Total %
change
PROJ 1 – SNPP 2,980 2.0% -34 -0.1% -1,622 -2.3%
PROJ 2 – SNPP (updated) 36,792 24.5% 15,105 26.4% 19,124 27.4%
PROJ 3 – Economic baseline 12,326 8.2% 5,781 10.1% 6,138 8.8%
PROJ 4 – Committed
economic growth 32,979 22.0% 14,008 24.5% 17,027 24.4%
The household projections do not take account of growth in students living in university 5.74
accommodation – there are looking only at students living in households. Students living in colleges,
halls or purpose-build student accommodation are counted within the demographic projections as
part of an institutional population.
The 2001 and 2011 Census results show that the number of student only households increased by 5.75
79 (from 1,793 to 1,872 households) in Oxford over the 2001-11 decade. The total number of
household reference persons who were students in Oxford however fell from 3,827 to 3,799 (a fall
of a marginal 0.7%) and declined as a proportion of all households. We estimate the impact of
student growth on the projections would thus be marginal and at most of 8 homes per year in
Oxford. When looking across Oxfordshire the impact is of less than 1 home per year.
South Oxfordshire
In South Oxfordshire, PROJ 2 results in a housing need for 482 dwellings per annum representing a 5.76
0.8% growth rate in the housing stock. The economic-driven scenarios result in a (significantly)
higher level of need, ranging from between 655-749 dwellings per annum.

Oxfordshire Strategic Housing Market Assessment: April 2014
GL Hearn Page 100 of 188
J:\Planning\Job Files\J029822 - Oxfordshire SHMA\Reports\Final SHMA Report (11.04.14).docx
Summary of Projections 2011 to 2031 – Annual – South Oxfordshire Table 37:
Projection Population growth Housing numbers Employment growth
Per
annum
%
change
Per
annum
%
change
Per
annum
%
change
PROJ 1 – SNPP 687 0.5% 366 0.6% 218 0.3%
PROJ 2 – SNPP (updated) 821 0.6% 482 0.8% 284 0.4%
PROJ 3 – Economic baseline 1,295 1.0% 655 1.2% 547 0.8%
PROJ 4 – Committed
economic growth 1,550 1.1% 749 1.3% 687 1.0%
Summary of Projections 2011 to 2031 – Total – South Oxfordshire Table 38:
Projection Population growth Housing numbers Employment growth
Total %
change
Total %
change
Total %
change
PROJ 1 – SNPP 13,733 10.2% 7,318 12.9% 4,359 6.2%
PROJ 2 – SNPP (updated) 16,417 12.2% 9,634 17.0% 5,686 8.1%
PROJ 3 – Economic baseline 25,898 19.2% 13,105 23.1% 10,936 15.6%
PROJ 4 – Committed
economic growth 31,004 23.0% 14,972 26.3% 13,746 19.6%
Vale of White Horse
For the Vale of White Horse, the PROJ 2 figures result in a housing need for 468 homes per annum, 5.77
representing a 0.9% growth rate in the housing stock. The economic scenarios in contrast indicate
much higher levels of provision – ranging from 623 – 1,028 homes per annum.
Summary of Projections 2011 to 2031 – Annual – Vale of White Horse Table 39:
Projection Population growth Housing numbers Employment growth
Per
annum
%
change
Per
annum
%
change
Per
annum
%
change
PROJ 1 – SNPP 791 0.6% 367 0.7% 262 0.4%
PROJ 2 – SNPP (updated) 873 0.7% 468 0.9% 301 0.5%
PROJ 3 – Economic baseline 1,331 1.1% 623 1.2% 553 0.9%
PROJ 4 – Committed
economic growth 2,528 2.1% 1,028 2.0% 1,195 1.9%
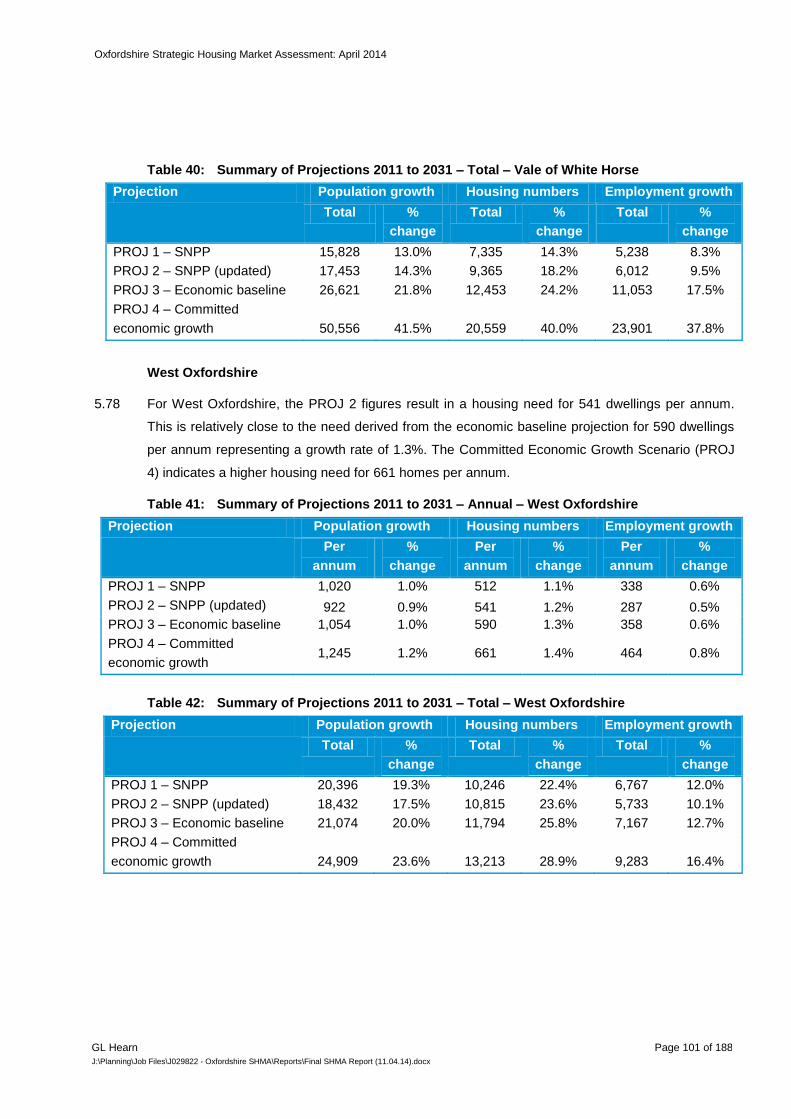
Oxfordshire Strategic Housing Market Assessment: April 2014
GL Hearn Page 101 of 188
J:\Planning\Job Files\J029822 - Oxfordshire SHMA\Reports\Final SHMA Report (11.04.14).docx
Summary of Projections 2011 to 2031 – Total – Vale of White Horse Table 40:
Projection Population growth Housing numbers Employment growth
Total %
change
Total %
change
Total %
change
PROJ 1 – SNPP 15,828 13.0% 7,335 14.3% 5,238 8.3%
PROJ 2 – SNPP (updated) 17,453 14.3% 9,365 18.2% 6,012 9.5%
PROJ 3 – Economic baseline 26,621 21.8% 12,453 24.2% 11,053 17.5%
PROJ 4 – Committed
economic growth 50,556 41.5% 20,559 40.0% 23,901 37.8%
West Oxfordshire
For West Oxfordshire, the PROJ 2 figures result in a housing need for 541 dwellings per annum. 5.78
This is relatively close to the need derived from the economic baseline projection for 590 dwellings
per annum representing a growth rate of 1.3%. The Committed Economic Growth Scenario (PROJ
4) indicates a higher housing need for 661 homes per annum.
Summary of Projections 2011 to 2031 – Annual – West Oxfordshire Table 41:
Projection Population growth Housing numbers Employment growth
Per
annum
%
change
Per
annum
%
change
Per
annum
%
change
PROJ 1 – SNPP 1,020 1.0% 512 1.1% 338 0.6%
PROJ 2 – SNPP (updated) 922 0.9% 541 1.2% 287 0.5%
PROJ 3 – Economic baseline 1,054 1.0% 590 1.3% 358 0.6%
PROJ 4 – Committed
economic growth 1,245 1.2% 661 1.4% 464 0.8%
Summary of Projections 2011 to 2031 – Total – West Oxfordshire Table 42:
Projection Population growth Housing numbers Employment growth
Total %
change
Total %
change
Total %
change
PROJ 1 – SNPP 20,396 19.3% 10,246 22.4% 6,767 12.0%
PROJ 2 – SNPP (updated) 18,432 17.5% 10,815 23.6% 5,733 10.1%
PROJ 3 – Economic baseline 21,074 20.0% 11,794 25.8% 7,167 12.7%
PROJ 4 – Committed
economic growth 24,909 23.6% 13,213 28.9% 9,283 16.4%

Oxfordshire Strategic Housing Market Assessment: April 2014
GL Hearn Page 102 of 188
J:\Planning\Job Files\J029822 - Oxfordshire SHMA\Reports\Final SHMA Report (11.04.14).docx
Interpreting the Demographic Projections and Moving Forward
The SHMA needs to draw conclusions, based on the range of evidence on the overall need for 5.79
housing.
The Planning Practice Guidance indicates is that the starting point for this is the latest official 5.80
household projections, but it makes clear that it is appropriate to test the robustness of these at a
local level, to take account of more recent demographic evidence and to extend the projections to
support longer-term strategic planning. This is what we have done in developing PROJ 2.
The demographic projections consider need looking from 2011 forwards. They do not take account 5.81
of any delivery shortfall or over-provision of housing which arose prior to this (although they do
adjust household formation rates so as to ensure that constrained household formation is not
projected forwards). On this basis it is appropriate to consider whether adjustments to housing
provision need to be made to take these factors into account. Past housing provision against
targets was considered in Section 3.
The Guidance then sets out that a number of other factors should be considered, particularly in 5.82
exploring whether there is a case for an upwards adjustment to the projections. These factors are:
Evidence of affordability pressures or market signals indicating that consideration should be
given to increasing housing supply;
Economic projections and consideration of the balance between projected economic growth and
projected growth in labour supply;
Affordable housing needs evidence, with considering needing to be given to increasing housing
supply where it can help to deliver more affordable housing to meet identified need.
We paraphrase the guidance here, but these are what we consider to be the core tests therein. 5.83
The projections considered in this chapter include economic-led projections which seek to 5.84
interrogate what level of population and housing growth might be necessary to support future
economic performance.
Section 3 has considered evidence related to market signals. Section 6 considers the need for 5.85
affordable housing. These are brought together with the projections presented in Section 9 in
drawing overall conclusions regarding future housing need.

Oxfordshire Strategic Housing Market Assessment: April 2014
GL Hearn Page 103 of 188
J:\Planning\Job Files\J029822 - Oxfordshire SHMA\Reports\Final SHMA Report (11.04.14).docx
6 AFFORDABLE HOUSING NEED
Introduction
In this section we discuss levels of affordable housing need in Oxfordshire and each of the five 6.1
districts. Affordable housing need is defined in SHMA guidance as “the quantity of housing required
for households who are unable to access suitable housing without financial assistance21
.” These
households will be eligible for affordable housing. Affordable housing is defined in the National
Planning Policy Framework as social rented, affordable rented and intermediate housing provided
to eligible households whose needs are not met by the market.
Government guidance on Strategic Housing Market Assessments sets out a model for assessing 6.2
housing need (known as the Basic Needs Assessment Model). This model has been used herein.
This considers the need for affordable housing which includes:
Social rented housing;
Affordable rented housing; and
Intermediate housing (including shared ownership and shared equity homes).
Definitions of the different categories of affordable housing are set out in Appendix 3. 6.3
The analysis is based on secondary data sources. It draws on a number of sources of information 6.4
including 2011 Census data, demographic projections, house prices/rents and income information.
The approach is consistent with the Planning Practice Guidance (CLG March 2014)22
which says
that local authorities ‘should avoid expending significant resources on primary research… as this
will in many cases be a disproportionate way of establishing an evidence base. They should instead
look to rely predominantly on secondary data (e.g. Census, national survey) to inform their
assessment’. The approach taken has been applied consistently across all five local authority areas
and as such may differ from previous affordable housing needs research (particularly where this is
based on survey information).
Housing Needs Assessment
The analysis in this section considers the need for affordable housing. It considers the need for 6.5
affordable housing by considering the numbers of households with a current housing need, and
those which are expected to fall into housing need over time. This is compared against the stock of
affordable housing available to meet need, taking account of relets of current affordable housing
and stock from homes in the development pipeline. The approach follows the Basic Needs
Assessment Model, in accordance with the CLG Practice Guidance. This model is summarised in
Figure 55 below.
21
CLG (Aug 2007) Strategic Housing Market Assessments – Practice Guidance, Version 2 22
CLG (March 2014) Planning Practice Guidance: Housing and Economic Development Needs Assessments

Oxfordshire Strategic Housing Market Assessment: April 2014
GL Hearn Page 104 of 188
J:\Planning\Job Files\J029822 - Oxfordshire SHMA\Reports\Final SHMA Report (11.04.14).docx
Overview of Basic Needs Assessment Model Figure 55:
The figures presented in this report for affordable housing needs have been based on secondary 6.6
data sources including analysis of 2011 Census data. The housing needs modelling undertaken
provides an assessment of housing need covering the 18-year period from 2013 to 2031. Each of
the stages of the housing needs model calculation are discussed in more detail in the remainder of
this section.
Key definitions related to housing need, affordability and affordable housing are set out in Appendix 6.7
4.
Understanding the Context to the Housing Needs Model
The housing needs model is based largely on housing market conditions (and particularly the 6.8
relationship of housing costs and incomes) at a particular point in time – the time of the assessment
– as well as the existing supply of affordable housing (through relets of current stock) which can be
used to meet housing need.
As such the figures derived from it should be used with caution when looking over longer planning 6.9
timeframes. It is not designed to (or necessarily suitable) for considering overall housing need,
given that the findings are informed by a range of factors such that:
An improvement in overall housing supply over time (for instance through higher housing
provision against demographics) could result in improvements in the affordability of market
housing affecting the level of ‘affordable need’ identified in the model;
Similarly an improvement in housing supply will over time reduce the supply of affordable
housing through re-lets, meaning for instance that stronger housing provision will
progressively reduce the level of annual need for affordable housing. This is relevant when
extrapolating model findings over 15+ years.
Future Housing Need
Estimate of Newly-Forming Households in Need & Existing Households falling into Need
over plan period
Affordable Housing Supply
Estimate of Supply of Affordable Housing from Relets of Existing
Properties over plan period
Affordable Housing Supply
Supply of Affordable Housing
from Vacant Stock &
Development Pipeline
Current Housing Need (Gross)
Current Households in Housing
Need based on Census and other modelled data
Total Net Current Need
Net Housing
Need Arising
Total Net Current Need

Oxfordshire Strategic Housing Market Assessment: April 2014
GL Hearn Page 105 of 188
J:\Planning\Job Files\J029822 - Oxfordshire SHMA\Reports\Final SHMA Report (11.04.14).docx
Furthermore affordable housing numbers include some households who are already housed in 6.10
numerical terms (albeit that it may be in unsuitable housing or PRS properties where there is
insecurity of tenure).
The assessment is intended to consider whether there is a shortfall or surplus of affordable housing 6.11
provision. Given the nature of the model, we would recommend that the evidence is reviewed
periodically (typically in five years). On-going monitoring and review will be important in consider
how the affordability of market housing changes, and ensuring that housing supply is able to
respond to market signals.
Income Thresholds to Afford Different Housing Tenures
A detailed exercise has been undertaken to compare the costs of different types of housing. This is 6.12
set out in Appendix 5 and considers the costs of:
Market housing to buy (at lower quartile prices);
Market housing to rent (at lower quartile rents);
Costs of affordable housing (at social rent and affordable rent levels).
This is considered in each case for different sizes of property, and is informed by a market survey of 6.13
housing costs undertaken in June 2013.
This analysis can be used to consider what income households would typically need to have to be 6.14
able to access different housing tenures. Table 43 below estimates how current prices and rents in
Oxfordshire might equate to income levels required to afford such housing. The analysis considers
four different tenures (buying, private rent, affordable rent and social rent) and compares housing
costs taken as the lower quartile price/rent across the whole stock of housing available (i.e.
including all property sizes).
The data clearly indicates a gap between the costs of ‘entry-level’ market housing and the social 6.15
rented sector – demonstrating the potential for intermediate and affordable rented housing to meet
some of the affordable need.
Indicative income required to purchase/rent without additional subsidy Table 43:
Area Lower quartile
purchase price
Lower quartile
private rent Affordable rent
Lower quartile
social rent
Cherwell £52,900 £24,900 £19,900 £15,600
Oxford £61,700 £36,900 £29,500 £15,800
South Oxon £67,100 £30,700 £24,500 £16,700
VoWH £56,900 £26,600 £21,300 £17,600
West Oxon £53,700 £26,600 £21,300 £18,000
Source: Online Estate and Letting Agents Survey (June 2013) and CORE
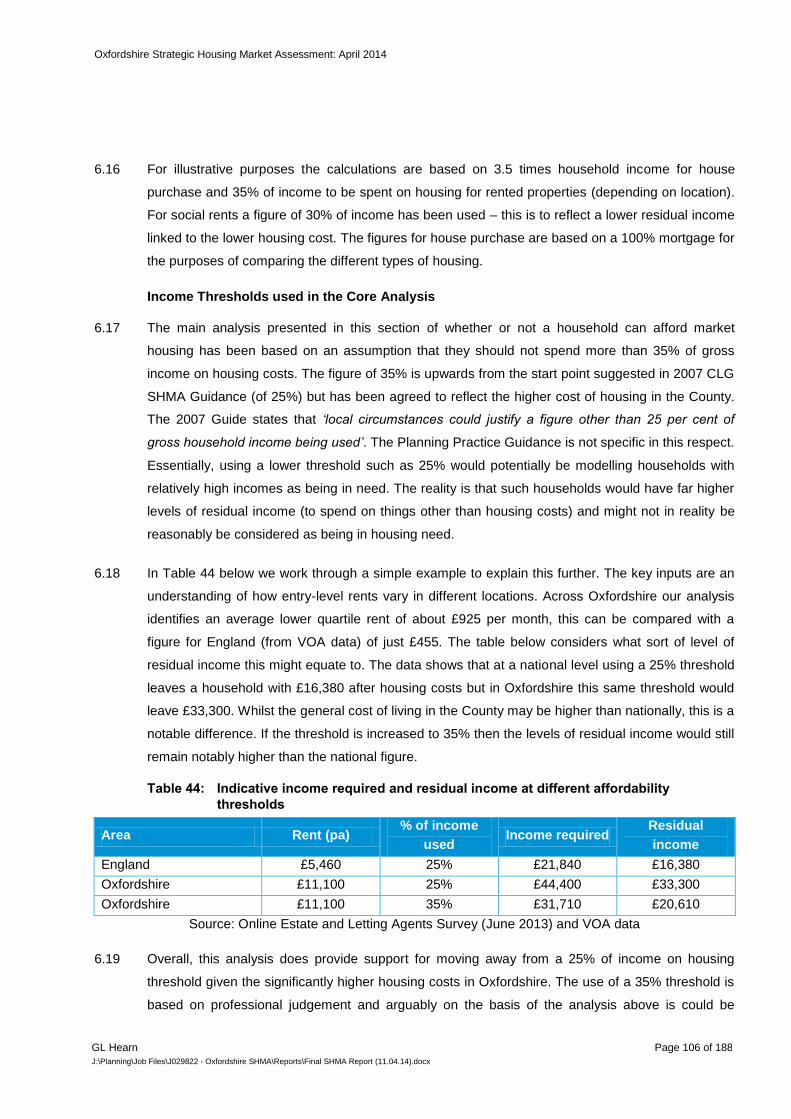
Oxfordshire Strategic Housing Market Assessment: April 2014
GL Hearn Page 106 of 188
J:\Planning\Job Files\J029822 - Oxfordshire SHMA\Reports\Final SHMA Report (11.04.14).docx
For illustrative purposes the calculations are based on 3.5 times household income for house 6.16
purchase and 35% of income to be spent on housing for rented properties (depending on location).
For social rents a figure of 30% of income has been used – this is to reflect a lower residual income
linked to the lower housing cost. The figures for house purchase are based on a 100% mortgage for
the purposes of comparing the different types of housing.
Income Thresholds used in the Core Analysis
The main analysis presented in this section of whether or not a household can afford market 6.17
housing has been based on an assumption that they should not spend more than 35% of gross
income on housing costs. The figure of 35% is upwards from the start point suggested in 2007 CLG
SHMA Guidance (of 25%) but has been agreed to reflect the higher cost of housing in the County.
The 2007 Guide states that ‘local circumstances could justify a figure other than 25 per cent of
gross household income being used’. The Planning Practice Guidance is not specific in this respect.
Essentially, using a lower threshold such as 25% would potentially be modelling households with
relatively high incomes as being in need. The reality is that such households would have far higher
levels of residual income (to spend on things other than housing costs) and might not in reality be
reasonably be considered as being in housing need.
In Table 44 below we work through a simple example to explain this further. The key inputs are an 6.18
understanding of how entry-level rents vary in different locations. Across Oxfordshire our analysis
identifies an average lower quartile rent of about £925 per month, this can be compared with a
figure for England (from VOA data) of just £455. The table below considers what sort of level of
residual income this might equate to. The data shows that at a national level using a 25% threshold
leaves a household with £16,380 after housing costs but in Oxfordshire this same threshold would
leave £33,300. Whilst the general cost of living in the County may be higher than nationally, this is a
notable difference. If the threshold is increased to 35% then the levels of residual income would still
remain notably higher than the national figure.
Indicative income required and residual income at different affordability Table 44:
thresholds
Area Rent (pa) % of income
used Income required
Residual
income
England £5,460 25% £21,840 £16,380
Oxfordshire £11,100 25% £44,400 £33,300
Oxfordshire £11,100 35% £31,710 £20,610
Source: Online Estate and Letting Agents Survey (June 2013) and VOA data
Overall, this analysis does provide support for moving away from a 25% of income on housing 6.19
threshold given the significantly higher housing costs in Oxfordshire. The use of a 35% threshold is
based on professional judgement and arguably on the basis of the analysis above is could be

Oxfordshire Strategic Housing Market Assessment: April 2014
GL Hearn Page 107 of 188
J:\Planning\Job Files\J029822 - Oxfordshire SHMA\Reports\Final SHMA Report (11.04.14).docx
pushed higher to retain the same level of residual income. However, we would recognise that a) the
cost of living in Oxfordshire is likely to be higher than nationally and b) that the figures above are
based on gross income and so actual levels of residual income would be lower once tax
contributions are taken into account (with these affecting households in Oxfordshire more than
nationally at the levels of income discussed above).
Overall, we would consider that the use of a 35% threshold is realistic in local circumstance and 6.20
reflects a pragmatic approach given the available data about housing costs and how this might
translate into the affordability of housing. Across the whole County, the analysis is essentially
assuming that a household with an income below about £31,700 is unable to afford market housing.
This figure is significantly above our national estimate of £21,800. Additional analysis has been
provided in this section about the levels of need with other thresholds although all of our main
analysis is based on the 35% figure.
Income Distribution
Data about total household income has been modelled on the basis of a number of different 6.21
sources of information to provide both an overall average income and the likely distribution of
incomes in each area. The key sources of data include:
CACI from Wealth of the Nation 2012 – to provide an overall national average income figure for
benchmarking
English Housing Survey – to provide information about the distribution of incomes (taking
account of variation by tenure in particular)
Annual Survey of Hours and Earnings (ASHE) – to assist in looking at differences between local
authority area (but recognising that this source only provides data about people in employment)
ONS modelled income estimates – to assist in providing more localised income estimates
The methodology essentially uses the national data from CACI as a start point – for 2012 the CACI 6.22
Wealth of the Nation Report estimates an average (mean) household income of £35,900 (this is
estimated on the basis of gross income including benefits). The EHS shows a similar mean income
(of £34,700) but is on a very slightly different basis (the data being based on the head of household
and their partner but not other household members). The EHS is however used to construct a
distribution of incomes.
At the local level the ASHE and ONS data is then used to estimate how much each area varies 6.23
from the national position. The analysis is not an exact science as it is recognised that the sources
used are imperfect; the ONS data being modelled on a range of socio-economic variables (and
being slightly dated (2008)) whilst the ASHE does not look at household income but just earnings.
These sources are however broadly consistent and do give a clear direction of differences between
locations which we have used to provide a view about how income levels vary at a local area level.

Oxfordshire Strategic Housing Market Assessment: April 2014
GL Hearn Page 108 of 188
J:\Planning\Job Files\J029822 - Oxfordshire SHMA\Reports\Final SHMA Report (11.04.14).docx
Drawing all of this data together we have therefore been able to construct an income distribution for 6.24
the whole of the County and individual districts for 2013. Figure 56 below shows the distribution of
household incomes for the whole of the County. The data shows that around a quarter of
households have an income below £20,000 with a further third in the range of £20,000 to £40,000.
The overall median income of all households in the County was estimated to be around £34,700
with a mean income of £45,800 – this is about 28% higher than the national estimate from CACI.
Distribution of Household Income in Oxfordshire Figure 56:
2.3%
22.5%
18.1%
14.1%
10.5%
8.6%9.6%
4.9%
9.4%
0%
5%
10%
15%
20%
25%
Under 10k £10k to
£20k
£20k to
£30k
£30k to
£40k
£40k to
£50k
£50k to
£60k
£60k to
£80k
£80k to
£100k
Over £100k
Pro
port
ion
of h
ouse
hold
s in
gro
up
Source: Derived from ASHE, Experian, SEH, CACI and ONS data
Table 45 shows how the distribution of income varies for each of the five districts. Incomes were 6.25
found to be highest in South Oxfordshire and Vale of White Horse with the lowest incomes
estimated to be in Oxford.

Oxfordshire Strategic Housing Market Assessment: April 2014
GL Hearn Page 109 of 188
J:\Planning\Job Files\J029822 - Oxfordshire SHMA\Reports\Final SHMA Report (11.04.14).docx
Gross Household Income Distribution by District Table 45:
Income band Cherwell Oxford South
Oxon
VoWH West Oxon County
Under £10k 2.3% 4.0% 1.6% 1.8% 2.1% 2.3%
£10k to £20k 22.9% 26.8% 19.7% 20.3% 22.3% 22.5%
£20k to £30k 18.1% 18.5% 18.0% 18.0% 18.1% 18.1%
£30k to £40k 14.3% 13.9% 13.9% 14.1% 14.2% 14.1%
£40k to £50k 10.4% 10.9% 10.5% 10.4% 10.4% 10.5%
£50k to £60k 8.8% 7.3% 9.0% 9.0% 8.9% 8.6%
£60k to £80k 9.4% 7.5% 11.0% 10.7% 9.7% 9.6%
£80k to £100k 4.7% 4.3% 5.5% 5.2% 4.8% 4.9%
Over £100k 9.2% 6.9% 10.9% 10.6% 9.6% 9.4%
Total 100.0% 100.0% 100.0% 100.0% 100.0% 100.0%
Mean £45,254 £40,007 £49,477 £48,558 £46,097 £45,800
Median £34,419 £30,429 £37,632 £36,933 £35,061 £34,729
Source: Derived from ASHE, Experian, SHE, CACI and ONS data
To assess affordability we have looked at households ability to afford either home ownership or 6.26
private rented housing (whichever is the cheapest which in all areas is private rented housing),
without financial support. The distribution of household incomes, within each area, is then used to
estimate the likely proportion of households who are unable to afford to meet their needs in the
private sector without support, on the basis of existing incomes. This analysis brings together the
data on household incomes with the estimated incomes required to access private sector housing.
Different affordability tests are applied to different parts of the analysis depending on the group 6.27
being studied (e.g. recognising that newly forming households are likely on average to have lower
incomes than existing households). Assumptions about income levels are discussed for relevant
analyses where relevant in the analysis that follows.
Affordable Housing Needs Model
This section considers the various steps which inform the assessment of affordable housing need. 6.28
Current Housing Need (Backlog)
In line with CLG guidance, the backlog of affordable housing need has been based on estimating 6.29
the number of households living in unsuitable housing along with consideration of their current
tenure and affordability. One problem with guidance is that Councils are encouraged to use
secondary data sources and yet the list of reasons for housing need include a number which cannot
readily be established without conducting a survey (e.g. households with insecure tenancies or

Oxfordshire Strategic Housing Market Assessment: April 2014
GL Hearn Page 110 of 188
J:\Planning\Job Files\J029822 - Oxfordshire SHMA\Reports\Final SHMA Report (11.04.14).docx
housing that is too expensive compared to disposable income). For this reason the analysis in this
section draws on secondary data but also makes estimates of likely need through the modelling of
data based on the profile of households in each area where secondary data is unable to provide the
required outputs.
An assessment of households living in unsuitable housing has been undertaken based on the 6.30
number of households shown to be overcrowded in the 2011 Census along with an estimate of
other needs which have been modelled by comparing the tenure profile in each area with
information from previous surveys about households in need. The previous surveys utilised are a
range of housing needs surveys carried out by GL Hearn and JGC over the past three years –
regardless of location, these surveys show surprisingly consistent outputs in terms of housing need
such as the proportion of private tenants who have problems with insecure tenancies or housing
costs. The other needs analysed (in-line with guidance) were harassment, insecure tenure and
housing being too expensive. The analysis of households in unsuitable housing therefore focuses
only on estimating the number of households who would also need to move home to resolve their
problems (i.e. to exclude those who might be expected to have an in-situ solution such as due to a
dwelling being in a poor state of repair).
The data modelling estimates households living in unsuitable housing by tenure and from these 6.31
figures households living in affordable housing are excluded (as these households would release a
dwelling on moving and so no net need for affordable housing will arise). The analysis also
excludes all outright owners, under the assumption that they will have sufficient equity to move, and
90% of owners with a mortgage. It is assumed that the vast majority of owners with a mortgage are
able to afford housing once savings and equity are taken into account. The implied figures for
owner-occupiers have again been based on studying typical patterns from surveys carried out
across the Country. A final adjustment (which mainly impacts on Oxford) is to slightly reduce the
unsuitability figures to take account of student-only households – such households could technically
be over-crowded but would be unlikely to be considered as being in housing need.
At the time of the assessment there were an estimated 7,159 households living in unsuitable 6.32
housing (excluding current social tenants and the majority of owner-occupiers) – this represents
2.7% of all households in the County. The figure below shows the current locations of these
households – the data suggests a similar level of unsuitability in most areas with Oxford standing
out as having a much higher level of unsuitability; this is linked to higher levels of overcrowding and
a relatively large private rented sector.

Oxfordshire Strategic Housing Market Assessment: April 2014
GL Hearn Page 111 of 188
J:\Planning\Job Files\J029822 - Oxfordshire SHMA\Reports\Final SHMA Report (11.04.14).docx
Estimated number of Households in Unsuitable Housing Table 46:
Area In unsuitable
housing
Total number of
households
% in unsuitable
housing
Cherwell 1,513 58,253 2.6%
Oxford 2,600 55,956 4.6%
South Oxon 1,145 55,354 2.1%
VoWH 973 50,839 1.9%
West Oxon 928 44,649 2.1%
County 7,159 265,051 2.7%
Source: Census (2011) and data modelling
In modelling the current need in Oxford, it is not possible to specifically disaggregate student 6.33
households / student household incomes from those of all households based on secondary data
sources. We have sought to estimate and address the impact, reducing current need figures
derived from Census-based modelling by 12% to reflect the proportion of private rented properties
which house student households. Our estimated level of backlog need is therefore 7,159. We can
however additionally consider that a number of these households might be able to afford market
housing without the need for subsidy. Analysis of housing needs survey data across the Country
identifies that households living in unsuitable housing have an average income which is lower than
for other households: we estimate that their incomes are on average around 69% of the figure for all
households in an area (this figure has been established by studying past survey information which
is remarkably consistent between different areas). Overall, around 37% of households with a
current need are estimated to be likely to have sufficient income to afford market housing and so
our estimate of the total backlog need is reduced to 4,483 households.
Estimated Backlog Need by Sub-Area Table 47:
Area In unsuitable
housing
% Unable to
Afford
Revised Gross
Need (including
Affordability)
Cherwell 1,513 52.4% 793
Oxford 2,600 77.1% 2,003
South Oxon 1,145 58.4% 668
VoWH 973 52.2% 508
West Oxon 928 55.0% 510
County 7,159 62.6% 4,483
Source: Census (2011), data modelling and income analysis
The findings above can be compared with information about the number of people on the Housing 6.34
Register in each area. To do this we have accessed data from the Local Authority Housing
Statistics (LAHS) for 2013. This source shows a total of 4,880 households as registered and in a
reasonable preference category. This figure is of a similar order of magnitude to the estimated

Oxfordshire Strategic Housing Market Assessment: April 2014
GL Hearn Page 112 of 188
J:\Planning\Job Files\J029822 - Oxfordshire SHMA\Reports\Final SHMA Report (11.04.14).docx
number of households in housing need. The Housing Register data however shows a slightly lower
level of ‘need’ in Cherwell and Oxford and higher levels in other areas than is shown by our analysis.
Care should be taken when using Housing Register data to assess need as different areas will have 6.35
different allocation policies (which will impact on the assessment of a reasonable preference
category). In addition, the Housing Register will include households living with family/friends – such
households are included in our assessment of need arising in the future from newly forming
households. The Housing Register may also exclude households in need where they are not
registered due to the lack of affordable housing in the areas they would be seeking to live.
Overall, however, Housing Register data for the HMA supports the levels of need being shown by 6.36
our analysis but with a slightly different spatial distribution which in turn may be influenced by local
factors such as the availability of affordable housing and different allocations policies.
Newly-Arising Need
To estimate newly-arising (projected future) need we have looked at two key groups of households 6.37
based on the CLGs SHMA Guidance. These are:
Newly forming households; and
Existing households falling into need.
Newly-Forming Households
For newly-forming households we have estimated (through our demographic modelling) the number 6.38
of new households likely to form per annum and then applied an affordability test. This has been
undertaken by considering the changes in households in specific 5-year age bands relative to
numbers in the age band below 5 years previously to provide an estimate of gross household
formation. This differs from numbers presented in the demographic projections which are for net
household growth. The number of newly-forming households are limited to households forming who
are aged under 45. This methodology is recognised in guidance as a robust method for assessing
the number of newly forming households which notes that ‘at 45 it is assumed headship rates
plateau’ (CLG SHMA guidance 2007 (Annexes, page 19, para 17)).
The estimates of gross new household formation have been based on outputs from our projection 6.39
linked to the adjusted SNPP (past demographic trends in the case of Oxford). In looking at the likely
affordability of newly-forming households we have drawn on data from previous surveys carried out
nationally by GL Hearn and JGC. This establishes that the average income of newly-forming
households is around 84% of the figure for all households. This figure is remarkably consistent
across areas (and is also consistent with analysis of English Housing Survey data at a national
level).

Oxfordshire Strategic Housing Market Assessment: April 2014
GL Hearn Page 113 of 188
J:\Planning\Job Files\J029822 - Oxfordshire SHMA\Reports\Final SHMA Report (11.04.14).docx
We have therefore adjusted the overall household income data to reflect the lower average income 6.40
for newly-forming households. The adjustments have been made by changing the distribution of
income by bands such that average income level is 84% of the all household average. In doing this
we are able to calculate the proportion of households unable to afford market housing without any
form of subsidy (such as LHA/HB). Our assessment suggests that overall around 50% of newly-
forming households will be unable to afford market housing – there is no great difference in
assessed affordability in the different sub-areas other than a significantly higher proportion unable
to afford in Oxford.
Estimated Level of Housing Need from Newly Forming Households (per annum) Table 48:
Area Number of new
households
% unable to
afford
Total in need
Cherwell 1,148 42.7% 491
Oxford 1,331 67.7% 900
South Oxon 973 48.5% 472
VoWH 908 42.4% 385
West Oxon 793 45.0% 356
County 5,153 50.5% 2,604
Source: Projection Modelling/Income analysis
Existing Households falling into Housing Need
The second element of newly arising need is existing households falling into need. To assess this 6.41
we have used information from CORE. We have looked at households who have been housed over
the past five years - this group will represent the flow of households onto the Housing Register over
a five year period. From this we have discounted any newly forming households (e.g. those
currently living with family) as well as households who have transferred from another social rented
property.
An affordability test has also been applied, although relatively few households are estimated to 6.42
have sufficient income to afford market housing. The test has again been based on studying past
survey information (including the SEH) and is based on understanding the incomes of households
living in the social rented sector (which is taken as a proxy for those entering the sector). The
various sources used establish that the incomes of these households are about 42% of the ‘all
household’ average.
This method for assessing existing households falling into need is consistent with the SHMA guide 6.43
which says on page 46 that ‘Partnerships should estimate the number of existing households falling
into need each year by looking at recent trends. This should include households who have entered
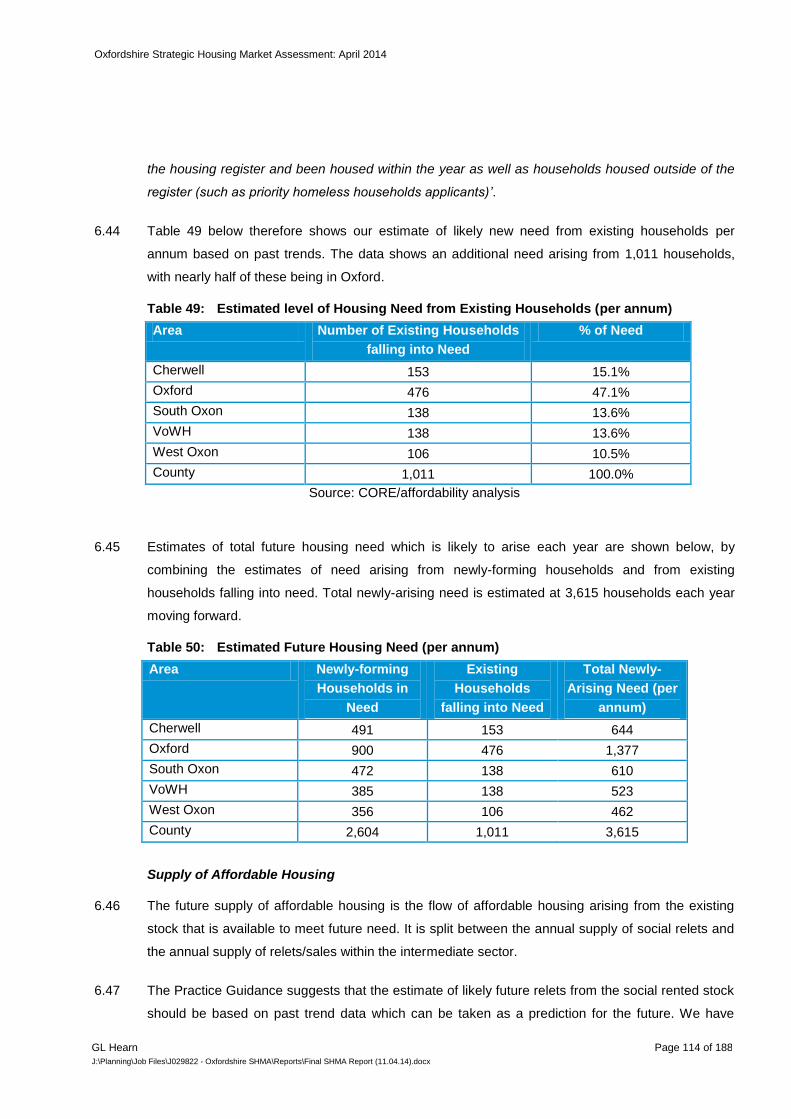
Oxfordshire Strategic Housing Market Assessment: April 2014
GL Hearn Page 114 of 188
J:\Planning\Job Files\J029822 - Oxfordshire SHMA\Reports\Final SHMA Report (11.04.14).docx
the housing register and been housed within the year as well as households housed outside of the
register (such as priority homeless households applicants)’.
Table 49 below therefore shows our estimate of likely new need from existing households per 6.44
annum based on past trends. The data shows an additional need arising from 1,011 households,
with nearly half of these being in Oxford.
Estimated level of Housing Need from Existing Households (per annum) Table 49:
Area Number of Existing Households
falling into Need
% of Need
Cherwell 153 15.1%
Oxford 476 47.1%
South Oxon 138 13.6%
VoWH 138 13.6%
West Oxon 106 10.5%
County 1,011 100.0%
Source: CORE/affordability analysis
Estimates of total future housing need which is likely to arise each year are shown below, by 6.45
combining the estimates of need arising from newly-forming households and from existing
households falling into need. Total newly-arising need is estimated at 3,615 households each year
moving forward.
Estimated Future Housing Need (per annum) Table 50:
Area Newly-forming
Households in
Need
Existing
Households
falling into Need
Total Newly-
Arising Need (per
annum)
Cherwell 491 153 644
Oxford 900 476 1,377
South Oxon 472 138 610
VoWH 385 138 523
West Oxon 356 106 462
County 2,604 1,011 3,615
Supply of Affordable Housing
The future supply of affordable housing is the flow of affordable housing arising from the existing 6.46
stock that is available to meet future need. It is split between the annual supply of social relets and
the annual supply of relets/sales within the intermediate sector.
The Practice Guidance suggests that the estimate of likely future relets from the social rented stock 6.47
should be based on past trend data which can be taken as a prediction for the future. We have

Oxfordshire Strategic Housing Market Assessment: April 2014
GL Hearn Page 115 of 188
J:\Planning\Job Files\J029822 - Oxfordshire SHMA\Reports\Final SHMA Report (11.04.14).docx
used information from the Continuous Recording system (CORE) to establish past patterns of social
housing availability. Our figures include general needs and supported lettings but exclude lettings to
new properties plus an estimate of the number of transfers from other social rented homes. These
exclusions are made to ensure that the figures presented reflect relets from the existing stock.
Additionally for Oxford City a significant number of supported lettings (mainly those on a license
agreement) have been excluded.
On the basis of past trend data is has been estimated that 1,385 units of social rented housing are 6.48
likely to become available each year moving.
Analysis of past Social Rented Housing Supply (per annum based on past 5 Table 51:
years)
Cherwell Oxford South
Oxon
VoWH West
Oxon
County
Total lettings 478 630 460 483 400 2,450
% as non-newbuild 86.4% 92.5% 82.8% 83.0% 80.2% 85.6%
Lettings in existing stock 413 583 381 401 321 2,098
% non-transfers 63.8% 72.8% 63.7% 64.4% 61.5% 66.0%
Total lettings to new tenants 263 424 242 258 197 1,385
Source: CORE
The supply figure is for social rented housing only and whilst the stock of intermediate housing in 6.49
Oxfordshire is not significant compared to the social rented stock it is likely that some housing does
become available each year (e.g. resales of shared ownership). For the purposes of this
assessment we have estimated the likely size and turnover in the intermediate stock on the basis of
2011 Census data. From this it is estimated that around 110 additional properties might become
available per annum.
The total supply of affordable housing is therefore estimated to be 1,494 per annum. The table 6.50
below shows the locations where supply is expected to arise.
Supply of affordable housing by sub-area Table 52:
Source: Derived from CORE and Census (2011) analysis
Area Social rented
relets
Intermediate
housing ‘relets’
Total supply (per
annum)
Cherwell 263 17 280
Oxford 424 34 459
South Oxon 242 18 260
VoWH 258 20 278
West Oxon 197 20 217
County 1,385 110 1,494

Oxfordshire Strategic Housing Market Assessment: April 2014
GL Hearn Page 116 of 188
J:\Planning\Job Files\J029822 - Oxfordshire SHMA\Reports\Final SHMA Report (11.04.14).docx
Net Housing Need
Excluding Commitments for New Affordable Housing
Table 53 below shows our overall calculation of housing need. This excludes supply arising from 6.51
sites with planning consent (the ‘development pipeline’). The analysis has been based on meeting
housing need over the 18-year period from 2013 to 2031. Whilst most of the data in the model are
annual figures the backlog has been divided by 18 to make an equivalent annual figure.
The data shows an overall need for affordable housing of 42,658 units over the next 18-years 6.52
(2,370 per annum). The net need is calculated as follows:
Net Need = Backlog Need + Need from Newly-Forming Households + Existing Households falling
into Need – Supply of Affordable Housing
Estimated level of Housing Need (2013-31) Table 53:
Per annum 18-years
Backlog need 249 4,483
Newly forming households 2,604 46,878
Existing households falling into need 1,011 18,196
Total Gross Need 3,864 69,558
Supply 1,494 26,899
Net Need 2,370 42,658
Source: Census (2011)/CORE/Projection Modelling and affordability analysis
Table 54 below shows the annualised information for individual districts. The analysis shows a need 6.53
for additional affordable housing in all areas with Oxford seeing the highest need (about 42% of the
total).
Estimated level of Housing Need (per annum) Table 54:
Area Backlog
need
Newly
forming
household
s
Existing
household
s falling
into need
Total
Need
Supply Net Need
(per
annum)
Cherwell 44 491 153 688 280 407
Oxford 111 900 476 1,488 459 1,029
South Oxon 37 472 138 647 260 386
VoWH 28 385 138 551 278 273
West Oxon 28 356 106 491 217 274
County 249 2,604 1,011 3,864 1,494 2,370
Source: Census (2011)/CORE/Projection Modelling and affordability analysis

Oxfordshire Strategic Housing Market Assessment: April 2014
GL Hearn Page 117 of 188
J:\Planning\Job Files\J029822 - Oxfordshire SHMA\Reports\Final SHMA Report (11.04.14).docx
Taking account of Affordable Housing with Planning Consent
The final stage in the analysis of affordable need is to take account of the supply of affordable 6.54
housing in the development pipeline. Information has been provided by each Council about the
number of affordable units with planning permission and which therefore can be expected to be built.
These can be taken off the net need figures shown above to provide an indication of the number of
additional homes required to meet need.
Table 55 below shows the estimated level of need taking account of the development pipeline in the 6.55
period to 2031. The analysis suggests an annual need for around 2,054 units to be delivered if all
affordable housing needs were to be met through delivery of new affordable homes.
Assessed Affordable Housing Need (2013-31) – including Development Pipeline Table 55:
Gross
Current Need
Supply of Affordable Housing
in Developm
ent Pipeline
Net Backlog
Annual Newly-Arising Need
Annual Supply through Relets
Net Need per
Annum
Cherwell 793 2602 -1809 644 280 264
Oxford 2,003 722 1281 1376 459 988
South Oxon 668 1019 -351 610 260 331
VoWH 508 1054 -546 523 278 215
West Oxon 510 292 218 462 217 257
County 4,483 5689 -1208 3615 1494 2054
Sensitivity to Period over Which Backlog is Addressed
Table 54 above showed the overall estimated level of affordable need from 2013 to 2031 and an 6.56
annualised figure for the 18-year period. It is possible to take this data and consider what the
annual level of need would be if a different period were taken to clear the backlog.
In Table 56 we have analysed clearing the backlog over a 5- and 10-year period (as well as 6.57
showing the core data for the full 18-year period). The data shows with the backlog being met over
18-years that some 2,370 dwellings per annum are required; with a 10-year period for the backlog
this rises to 2,569 and clearing the backlog over just 5-years shows a higher figure again (of 3,017).

Oxfordshire Strategic Housing Market Assessment: April 2014
GL Hearn Page 118 of 188
J:\Planning\Job Files\J029822 - Oxfordshire SHMA\Reports\Final SHMA Report (11.04.14).docx
Estimated annual level of Housing Need with different ‘backlog’ periods (all Table 56:
figures per annum)
Backlog cleared over… 5-years 10-years 18-years
Backlog need 897 448 249
Newly forming households 2,604 2,604 2,604
Existing households falling into need 1,011 1,011 1,011
Total Gross Need 4,512 4,064 3,864
Supply 1,494 1,494 1,494
Net Need 3,017 2,569 2,370
Source: Census (2011)/CORE/Projection Modelling and affordability analysis
Sensitivity to Income Thresholds
The analysis above is based on using a 35% threshold of income for affordability. This is justified by 6.58
an analysis of the cost of entry-level housing and likely residual incomes for households to spend
on non-housing costs. It is however of interest to see how this figures change under a range of
different scenarios. The analysis below looks at levels of need with thresholds of 25% (in-line with
the start point in the 2007 SHMA Guidance) up to 40%. This is set out to illustrate the sensitivity of
the affordable need analysis to different income thresholds.
Table 57 below summarises the findings. In particular, we can see that an assumption of 6.59
households spending 40% gross income on housing costs sees need fall to 1,969 households per
annum (from 2,370 in the main analysis). At the other end of the spectrum, with a 25% threshold
the figure increases significantly (to 3,346 per annum).
Estimated level of Housing Need (2013-31) at variant income thresholds (per Table 57:
annum)
@25% @30% @35% @40%
Backlog need 305 275 249 223
Newly forming households 3,423 2,995 2,604 2,285
Existing households falling into need 1,113 1,063 1,011 956
Total Need 4,841 4,333 3,864 3,463
Supply 1,494 1,494 1,494 1,494
Net Need 3,346 2,839 2,370 1,969
Sensitivity to Student Numbers
We have also sought to explore the potential influence of student households in Oxford on the 6.60
affordable housing needs analysis. In the modelling above, we have estimate and address the
impact, reducing current need figures derived from Census-based modelling by 12% to reflect the
proportion of private rented properties which house student households.

Oxfordshire Strategic Housing Market Assessment: April 2014
GL Hearn Page 119 of 188
J:\Planning\Job Files\J029822 - Oxfordshire SHMA\Reports\Final SHMA Report (11.04.14).docx
In regard to newly-forming student households in Oxford, of the total of 1,331 newly-forming 6.61
households per year, we estimate that at most 0.5% reflect the growth in student households. The
impact of this would suggest that the affordable need identified in Oxford could be inflated by up to
10 households per annum.
Role of the Private Rented Sector in Meeting Housing Need
In considering the true dynamics of the local housing market, it is important to consider the role 6.62
played by the private rented sector (through the Housing Benefit/Local Housing Allowance (LHA)
system) in meeting housing needs. To do this, we have analysed data from the Department of Work
and Pensions (DWP) in order to identify the number of LHA supported private rented homes and
estimate its role in augmenting the supply of homes for households in need.
The data shows that, as of February 2013 it is estimated that there were 10,895 benefit claimants in 6.63
the private rented sector in Oxfordshire. This is a 5% increase on the number observed two years
earlier (February 2011). Comparing this to the total private rented sector stock in the County
suggests that benefit claimants account for around a quarter of the sector.
Number of people claiming LHA in private rented sector (February 2011 and Table 58:
February 2013)
Area February
2011
February
2013
Absolute
change
% change
Cherwell 2,690 2,645 -45 -1.7%
Oxford 3,500 3,670 170 4.9%
South Oxon 1,550 1,712 162 10.5%
VoWH 1,200 1,406 206 17.2%
West Oxon 1,400 1,462 62 4.4%
County 10,340 10,895 555 5.4%
Source: Department of Work and Pensions
What this information does not tell us is how many lettings are made each year to tenants claiming 6.64
benefit as this will depend on the turnover of stock. From English Housing Survey we estimate that
the proportion of households within the private sector who are “new lettings” each year (i.e.
stripping out the effect of transfers) is around 13%. Applying this to the private rented stock in
Oxfordshire gives us an estimate of 5,877 private sector lettings per annum in the County.
Of these lettings, we assume 24% are to benefit claimants, consistent with their representation in 6.65
the total private rented stock, giving a total of 1,416 lettings per annum to LHA claimants. As such,
the overall estimated number of lettings in the LHA part of the PRS can be seen to be around two-
thirds of the total net need derived through housing needs analysis (it should be noted that the
number of claimants is individuals and in some cases there may be more than one claimant per

Oxfordshire Strategic Housing Market Assessment: April 2014
GL Hearn Page 120 of 188
J:\Planning\Job Files\J029822 - Oxfordshire SHMA\Reports\Final SHMA Report (11.04.14).docx
household. This reduces slightly the estimate of the number of lettings to ‘unique’ households (with
the highest potential impact likely to be in Oxford). Whilst the private rented sector is not recognised
as a genuine affordable housing product, it is important to recognise that, in practice, the sector
makes a significant contribution to meeting housing need and filling a shortfall in genuine affordable
housing products.
The extent to which the Councils wish to see this role in the future will clearly have implications for 6.66
both affordable housing supply and by implication overall housing targets. However, this is
ultimately a local policy decision which is beyond the scope of this study. We would however note
the following considerations:
The private rented sector continues to grow (across Oxfordshire and the South East) and given
the stock of affordable housing locally, as well as the future prospects in terms of grant funding
for new affordable housing delivery, the reality is that there is likely to be comparatively greater
availability in the private rented sector moving forward.
The private rented sector continues to grow significantly across Oxfordshire and the South East
generally (as the earlier analysis demonstrates);
On the other hand the Government has capped the growth in LHA moving forwards to inflation
as measured by the Consumer Price Index (CPI). It has also introduced caps on LHA payments
and shifted the calculation of LHA rates from median rents to the 30% percentile (as described in
Section 1). If rents rise faster than inflation this could limit the supply of private rented housing to
those on LHA or reduce the proportion of rent which LHA will cover;
There is emerging evidence nationally that some landlords are concerned about the introduction
of Universal Credit and the impact which this could have on tenants falling into rent arrears.
Some landlords may move away from housing benefit supported households (or even the PRS
generally) as demand improves within the market or due to uncertainties resulting from welfare
reforms;
The sales market is however improving and if households who have rented in recent years begin
to buy homes in greater volumes, this could affect the supply-demand balance within the private
rented sector (in regard to both tenant volumes and levels of ‘reluctant landlords’ who may now
choose to sell);
The delivery mechanisms and funding available to support delivery of new affordable housing
are likely to influence how many households can have their needs met by provision of new
affordable homes;
The 2011 Localism Act allows councils to discharge their statutory ‘homeless duty’ through
offering households suitable accommodation in private rented properties;
However, the private rented sector provides less security than the affordable sector, standards
can also be lower than for social rented properties and there are likely to be households with
Oxfordshire Strategic Housing Market Assessment: April 2014
GL Hearn Page 121 of 188
J:\Planning\Job Files\J029822 - Oxfordshire SHMA\Reports\Final SHMA Report (11.04.14).docx
specific housing needs who may not be able to find suitable accommodation within the Private
Rented Sector.
Need for Different Types of Affordable Housing
Having studied housing costs, incomes and housing need the next step is to make an estimate of 6.67
the proportion of affordable housing need that should be met through provision of different housing
products. We therefore use the income information presented earlier in this section to estimate the
proportion of households who are likely to be able to afford intermediate housing and the number
for whom only social or affordable rented housing will be affordable. There are three main types of
affordable housing that can be studied in this analysis:
Intermediate (shared ownership/equity)
Affordable rent
Social rent
Whilst the process of separating households into different income bands for analytical purposes is 6.68
quite straightforward, this does not necessarily tell us what sort of affordable housing they might be
able to afford or occupy.
For example a household with an income close to being able to afford market housing might be 6.69
able to afford intermediate or affordable rent but may be prevented from accessing certain
intermediate products (such as shared ownership) as they have an insufficient savings to cover a
deposit. Such a household might therefore be allocated to affordable rented or intermediate rented
housing as the most suitable solution. However we would expect that few Registered Providers
would build intermediate rented homes, given that the level of potential occupants for affordable
rented homes is greater (as it includes households who could claim housing benefit to supplement
their incomes).
The distinction between social and affordable rented housing is also complex. Whilst rents for 6.70
affordable rented housing would be expected to be higher than social rents, this does not
necessarily mean that such a product would be reserved for households with a higher income. In
reality, as long as the rent to be paid falls at or below LHA limits then it will be accessible to a range
of households (many of whom will need to claim housing benefit). Local authorities’ tenancy
strategies might set policies regarding the types of households which might be allocated affordable
rented homes; and many authorities will seek to avoid where possible households having to claim
higher levels of housing benefit. This however needs to be set against other factors, including
viability and the availability of grant funding. Over the current spending period to 2015 (and beyond

Oxfordshire Strategic Housing Market Assessment: April 2014
GL Hearn Page 122 of 188
J:\Planning\Job Files\J029822 - Oxfordshire SHMA\Reports\Final SHMA Report (11.04.14).docx
this to 201823
) grant funding is primarily available to support delivery of affordable rented homes. A
significant level of affordable housing delivery is delivered through developer contributions (Section
106 Agreements).
For these reasons it is difficult to exactly pin down what proportion of additional affordable homes 6.71
should be provided through different affordable tenure categories. In effect there is a degree of
overlap between different affordable housing tenures, as the figure below shows. At present,
Registered Providers are only developing one- and two-bedroom units due to concerns over high
rents on larger units – as such this tenure will not currently be meeting needs across the full range
of households.
Overlap between Affordable Housing Tenures Figure 57:
Given this overlap, for analytical purposes we have defined the following categories: 6.72
Households who can afford 80% or more of market rent levels;
Households who afford no more than existing social rent levels (or would require housing benefit,
or an increased level of housing benefit to do so);
Households which fall in between these parameters, who would potentially be able to afford
more than existing social rent levels but could not afford 80% of market rents.
Table 59 shows the proportion of households who fall into these broad income categories (based 6.73
on analysis of the distribution of household incomes). Overall, around a sixth can afford 80% or
more of market rent levels with only around 29% of households being in the band between social
23
See HCA (Jan 2014) National Affordable Housing Programme 2015-18, Prospectus

Oxfordshire Strategic Housing Market Assessment: April 2014
GL Hearn Page 123 of 188
J:\Planning\Job Files\J029822 - Oxfordshire SHMA\Reports\Final SHMA Report (11.04.14).docx
rents and 80% of market rents. This reflects the fact that there is a notable gap between housing
costs for these two types of ‘product’.
Proportion of Households who Cannot afford Market Housing by Income Table 59:
Category
Area Can afford 80%+
Market Rents
Can afford between
Social and 80% Market
Rents
Can only afford at
Social Rent or Below
Cherwell 21.2% 22.8% 56.0%
Oxford 12.0% 38.1% 49.9%
South Oxon 19.4% 32.1% 48.4%
VoWH 20.7% 17.7% 61.6%
West Oxon 20.2% 15.1% 64.7%
County 17.2% 28.6% 54.3%
Source: Housing Needs Analysis
We do not have detailed information on households’ savings. We have assumed that around half of 6.74
households with an income which would allow them to afford 80% or more of market rents would
represent the potential market for equity-based intermediate products such as shared ownership
and shared equity homes.
Taking the gross numbers for housing need and comparing this against the supply from relets of 6.75
existing stock, the following net need arises within the different categories. The categories shown
are as follows:
1. Equity-based Intermediate Housing: estimate of proportion of net need which could be
satisfied by provision of shared ownership or equity homes;
2. Need from Households who could afford more than existing social rents without benefit but
not Equity-Based Intermediate Housing: estimate of net need which could be satisfied by
housing priced between social rent levels and 80% of market rents, without increasing levels
of Housing Benefit received;
3. Rented Housing at Social Rent Levels: estimate of net need from households who would
not be able to afford more than existing social rent levels witout increased support from
Housing Benefit.
The analysis shows an estimated level of need for equity-based intermediate housing as well as 6.76
showing (in affordability terms) that affordable rented housing may have a reasonable role to play in
meeting need. Affordable rent seems least affordable in West Oxfordshire and most affordable in
Oxford. This latter finding is more substantially related to the larger gap between social rents and
80% of market costs than income levels in the City

Oxfordshire Strategic Housing Market Assessment: April 2014
GL Hearn Page 124 of 188
J:\Planning\Job Files\J029822 - Oxfordshire SHMA\Reports\Final SHMA Report (11.04.14).docx
Net Need within different Affordability Categories Table 60:
Area Equity-based Intermediate
Housing (Shared
Ownership / Shared Equity)
Need from Households who
could afford more than
existing social rents
without benefit but not
Equity-Based Intermediate
Housing
Rented Housing at Social
Rent Levels
Cherwell 13.7% 32.3% 54.0%
Oxford 5.3% 44.4% 50.2%
South Oxon 11.6% 41.0% 47.4%
VoWH 13.5% 27.1% 59.4%
West Oxon 10.8% 25.0% 64.2%
County 9.4% 37.5% 53.1%
Source: Housing Needs Analysis
Conclusions and Implications
The NPPF (and the Planning Practice Guidance) sets out that plans should be prepared on the 6.77
basis of meeting full needs for market and affordable housing. In assessing needs for affordable
housing, we have adopted the methodology set out in the Planning Practice Guidance.
In following this approach, we have identified a net affordable housing need in Oxfordshire of 6.78
42,660 households over the period from 2013 to 2031, equivalent to 2,370 households each year.
This assumes that a backlog of need is met over the period to 2031. If the backlog of need is
addressed over a shorter-period, the level of affordable need would be higher initially.
There is thus a significant need for new affordable housing in Oxfordshire and we therefore 6.79
consider the Councils are justified in seeking to secure the maximum viable level of affordable
housing.
However, whilst a significant quantitative shortfall is identified, there are in reality two key factors 6.80
against which the assessment must be put into context. Firstly, in practice there are likely to be
households who are adequately housed whilst paying more than the 35% of income threshold used
in this report, particularly in a relatively affluent area such as Oxfordshire.
Secondly, in considering the true dynamics in the affordable sector, it is important that the role 6.81
played by the private rented sector is recognised, particularly insofar as it provides adequate and
affordable housing when supported by the LHA. In this regard, our evidence shows that in
Oxfordshire the private rented sector makes a potentially significant contribution to meeting
affordable housing needs with an estimated 1,416 lettings per annum in sector to claimants
supported by LHA.

Oxfordshire Strategic Housing Market Assessment: April 2014
GL Hearn Page 125 of 188
J:\Planning\Job Files\J029822 - Oxfordshire SHMA\Reports\Final SHMA Report (11.04.14).docx
Clearly the private rented sector is not a recognised form of affordable housing and the extent to 6.82
which the Councils wish to see it being used to make up for shortages of affordable housing is
ultimately a local policy decision which is outside the scope of this study. If we assume (for
modelling purposes) that the role the Private Rented Sector plays continues but that the number of
LHA claimants in the sector does not rise further, our analysis indicates a need to deliver around
950 affordable homes per annum. This could be deliverable – taking account of affordable housing
policy requirements - if overall housing provision is in excess of about 2,500 homes per annum.
In establishing an objective assessment of overall housing need, the outputs of this assessment will 6.83
be considered alongside market signals as well as the demographic projections.
With respect to tenure mix, our assessment indicates a County-wide mix target of 25% 6.84
intermediate: 75% rent would be appropriate. In need terms, the rent composition is slightly skewed
towards social rent; however, the deliverability of this in the context of national affordable housing
policy and funding availability should be considered. We also identify some variation at local
authority level which could feed into local policies and would suggest that the types of tenure that
will be sought is a policy decision to be made through the Local Plan. A policy to house those in the
greatest need might therefore see a higher proportion of social rented housing being sought.

Oxfordshire Strategic Housing Market Assessment: April 2014
GL Hearn Page 126 of 188
J:\Planning\Job Files\J029822 - Oxfordshire SHMA\Reports\Final SHMA Report (11.04.14).docx

Oxfordshire Strategic Housing Market Assessment: April 2014
GL Hearn Page 127 of 188
J:\Planning\Job Files\J029822 - Oxfordshire SHMA\Reports\Final SHMA Report (11.04.14).docx
7 NEED FOR DIFFERENT SIZES OF HOMES
Introduction
As discussed in Section 4, there are a range of factors which influence housing demand. These 7.1
factors play out at different spatial scales and influence both the level of housing demand (in terms
of aggregate household growth) and the nature of demand for different types, tenures and sizes of
homes.
In this section we consider the implications of demographic drivers on demand for different housing 7.2
products. The assessment is intended to provide an understanding of the implications of
demographic dynamics on need and demand for different sizes of homes. This however needs to
be brought together with an understanding of wider factors including:
The need and opportunity to develop the housing offer;
The findings of the housing needs analysis which provide a short-term view of requirements;
Expected future economic growth and how this may influence demographics and demand for
different housing products;
Local evidence regarding supply and demand imbalances, such as identified in the analysis in
Section 4; and
Local policy objectives.
The analysis in this section seeks to use the information available about the size and structure of 7.3
the population and household structures; and consider what impact this may have on the sizes of
housing required in the future. It is about understanding the implications of demographic change.
For the purposes of this analysis we have looked at the demographic change as indicated in a
projection linked to the midpoint of the range of need identified - delivery of 5,003 additional homes
per annum from 2011 to 2031.
Methodology
Figure 58 describes the broad methodology employed in the housing market modelling. Data is 7.4
drawn from a range of sources including the 2011 Census and our demographic projections.

Oxfordshire Strategic Housing Market Assessment: April 2014
GL Hearn Page 128 of 188
J:\Planning\Job Files\J029822 - Oxfordshire SHMA\Reports\Final SHMA Report (11.04.14).docx
Summary of Housing Market Model Figure 58:
Understanding how Households Occupy Homes
Whilst the demographic projections provide a good indication of how the population and household 7.5
structure will develop it is not a simple task to convert the net increase in the number of households
in to a suggested profile for additional housing to be provided. The main reason for this is that in the
market sector households are able to buy or rent any size of property (subject to what they can
afford) and therefore knowledge of the profile of households in an area does not directly transfer
into the sizes of property to be provided. The size of housing which households occupy relates
more to their wealth and age than the number of people which they contain.
For example, there is no reason why a single person cannot buy (or choose to live in) a four 7.6
bedroom home as long as they can afford it and hence projecting an increase in single person
households does not automatically translate in to a need for smaller units.
In the affordable sector this issue is less relevant in the affordable sector (particularly since the 7.7
introduction of the ‘bedroom tax’) although there will still be some level of under-occupation moving
forward with regard to older person and working households who may be able to continue to under-
occupy their current homes.
The general methodology is to use the information derived in the projections about the number of 7.8
household reference persons (HRPs) in each age and sex group and apply this to the profile of
Output recommendations for housing requirements by tenure and size of housing
Model future requirements for market and affordable housing by size and compare to existing profile of homes
Draw together housing needs, viability and funding issues to consider affordable housing delivery
Project how the profile of households of different ages will change in future
Establish how households of different ages occupy homes (by tenure)
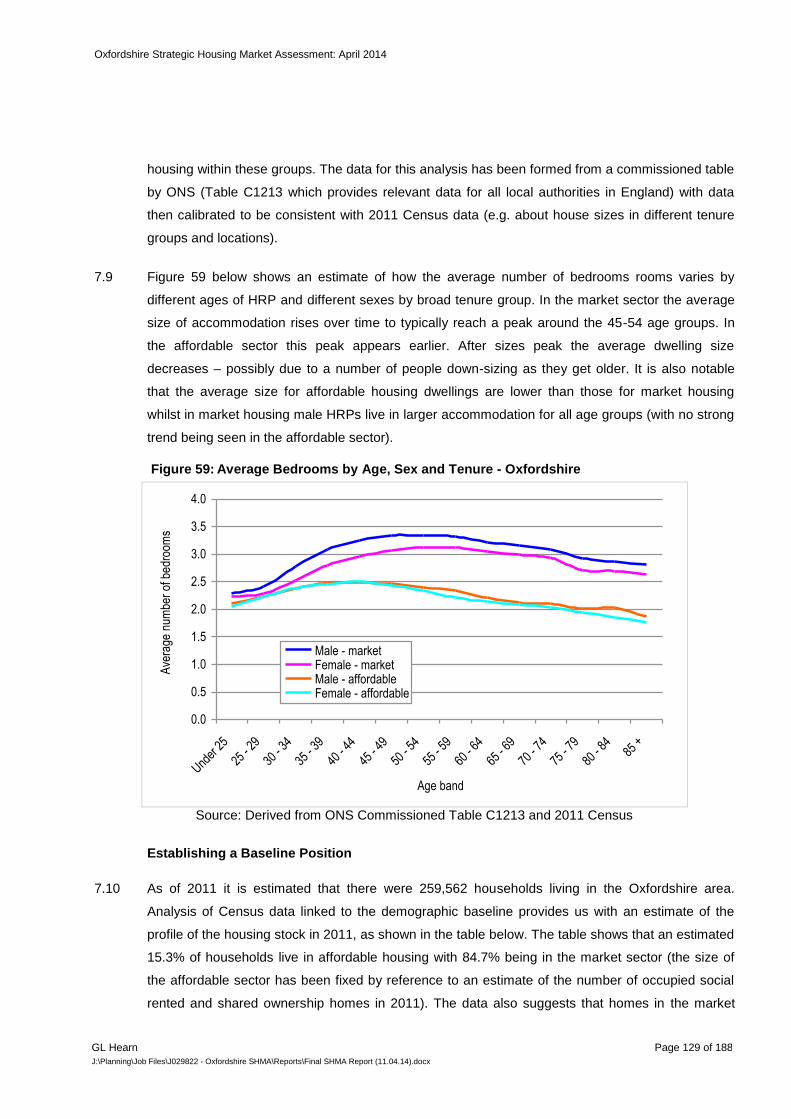
Oxfordshire Strategic Housing Market Assessment: April 2014
GL Hearn Page 129 of 188
J:\Planning\Job Files\J029822 - Oxfordshire SHMA\Reports\Final SHMA Report (11.04.14).docx
housing within these groups. The data for this analysis has been formed from a commissioned table
by ONS (Table C1213 which provides relevant data for all local authorities in England) with data
then calibrated to be consistent with 2011 Census data (e.g. about house sizes in different tenure
groups and locations).
Figure 59 below shows an estimate of how the average number of bedrooms rooms varies by 7.9
different ages of HRP and different sexes by broad tenure group. In the market sector the average
size of accommodation rises over time to typically reach a peak around the 45-54 age groups. In
the affordable sector this peak appears earlier. After sizes peak the average dwelling size
decreases – possibly due to a number of people down-sizing as they get older. It is also notable
that the average size for affordable housing dwellings are lower than those for market housing
whilst in market housing male HRPs live in larger accommodation for all age groups (with no strong
trend being seen in the affordable sector).
Average Bedrooms by Age, Sex and Tenure - Oxfordshire Figure 59:
0.0
0.5
1.0
1.5
2.0
2.5
3.0
3.5
4.0
Under
25
25 -
29
30 -
34
35 -
39
40 -
44
45 -
49
50 -
54
55 -
59
60 -
64
65 -
69
70 -
74
75 -
79
80 -
8485
+
Age band
Ave
rage
num
ber
of b
edro
oms
Male - marketFemale - marketMale - affordableFemale - affordable
Source: Derived from ONS Commissioned Table C1213 and 2011 Census
Establishing a Baseline Position
As of 2011 it is estimated that there were 259,562 households living in the Oxfordshire area. 7.10
Analysis of Census data linked to the demographic baseline provides us with an estimate of the
profile of the housing stock in 2011, as shown in the table below. The table shows that an estimated
15.3% of households live in affordable housing with 84.7% being in the market sector (the size of
the affordable sector has been fixed by reference to an estimate of the number of occupied social
rented and shared ownership homes in 2011). The data also suggests that homes in the market

Oxfordshire Strategic Housing Market Assessment: April 2014
GL Hearn Page 130 of 188
J:\Planning\Job Files\J029822 - Oxfordshire SHMA\Reports\Final SHMA Report (11.04.14).docx
sector are generally bigger than in the affordable sector with 71% having three or more bedrooms
compared to 40% for affordable housing.
These figures are for households rather than dwellings due to information about the sizes of vacant 7.11
homes across the whole stock (i.e. market and affordable) not being readily available. For the
purposes of analysis this will not make any notable difference to the. We have however translated
the household projections into dwelling figures by including a vacancy allowance when studying the
final outputs of the market modelling.
Estimated Profile of Dwellings in 2011 by Size Table 61:
Size of housing Market Affordable Total
Number % Number % Number %
1 bedroom 15,846 7.2% 10,345 26.0% 26,191 10.1%
2 bedrooms 48,926 22.3% 13,513 34.0% 62,439 24.1%
3 bedrooms 90,008 40.9% 14,069 35.4% 104,077 40.1%
4+ bedrooms 65,025 29.6% 1,829 4.6% 66,855 25.8%
Total 219,806 100.0% 39,756 100.0% 259,562 100.0%
% in tenure 84.7% 15.3% 100.0%
Source: Derived from 2011 Census
Tenure Assumptions
The housing market model has been used to estimate future requirements for different sizes of 7.12
property over the next 20-years. The model works by looking at the types and sizes of
accommodation occupied by different ages of residents, and attaching projected changes in the
population to this to project need and demand for different sizes of homes. However the way
households of different ages occupy homes differs between the market and affordable sectors (as
shown earlier). Thus it is necessary to consider what mix of future housing will be in the market and
affordable sectors.
To consider what mix of housing might be delivered as affordable housing we have considered 7.13
various factors. The affordable housing needs analysis in this report provides evidence of
considerable housing need which would support any target although the viability of providing
affordable housing will limit the amount that can be delivered. The current or proposed affordable
housing policy in each authority is summarised below:
Cherwell – 30% in Banbury and Bicester and in 35% Kidlington and Rural Areas on sites over 10
homes in urban areas and 3 in rural areas;
Oxford – a minimum 50% affordable housing on sites 0.25 ha/ 10 dwellings;
South Oxfordshire – 40% on all sites where net gain of 3+ dwellings;
Vale - 40% on all sites where net gain of 3+ dwellings; and
West – 50% in the higher value zone, 40% in the medium value zone, and 35% in the lower
value zone on sites of over 5 dwellings, with a financial contribution on sites of 1-5 dwellings.

Oxfordshire Strategic Housing Market Assessment: April 2014
GL Hearn Page 131 of 188
J:\Planning\Job Files\J029822 - Oxfordshire SHMA\Reports\Final SHMA Report (11.04.14).docx
Some development schemes will fall below thresholds, whist on others scheme viability can reduce 7.14
affordable housing delivery. However this can be offset by delivery on housing sites owned by
Registered Providers and public sector bodies and on Rural Exception Sites.
It is necessary for modelling purposes (given the differences in occupancy patterns between tenure 7.15
categories) to make a broad assumption for modelling purposes on the potential balance between
delivery of market and affordable housing. On the basis of information available we have assumed
in Cherwell that 33% of new housing delivered over the period to 2031 is affordable housing with a
figure of 40% for South Oxfordshire, Vale of White Horse and West Oxfordshire and 50% in Oxford.
This is based on the relative viability of affordable housing delivery in different parts of the county,
based on current evidence and policies. It should be stressed that these figures are not intended to
pre-judge the Councils setting out future policies. The figures have been applied simply for the
purposes of providing outputs from the modelling process.
Key Findings: Affordable Housing
The table and figure below show estimates of the sizes of affordable housing required based on our 7.16
understanding of demographic trends. The data suggests in the period between 2011 and 2031 that
around 63% of the requirement is for homes with one- or two-bedrooms with around 37% of the
requirement being for larger homes with three or more bedrooms.
This analysis provides a longer-term view of requirements for affordable housing and does not 7.17
reflect any specific priorities such as for family households in need rather than single people. In
addition we would note that smaller properties (i.e. one bedroom homes) typically offer limited
flexibility in accommodating the changing requirements of households, whilst delivery of larger
properties can help to meet the needs of households in high priority and to manage the housing
stock by releasing supply of smaller properties. That said, there may in the short-term be an
increased requirement for smaller homes as a result of welfare reforms limiting the amount of
housing benefit being paid to some working-age households.
Impact of Demographic Trends on the Size of Dwellings Required 2011 to 2031 – Table 62:
Affordable Housing
Size 2011 2031
Additional
households 2011-
2031
% of additional
households
1 bedroom 10,345 21,584 11,239 28.4%
2 bedrooms 13,513 27,252 13,739 34.7%
3 bedrooms 14,069 27,020 12,951 32.7%
4+ bedrooms 1,829 3,517 1,687 4.3%
Total 39,756 79,373 39,617 100.0%
Source: Housing Market Model

Oxfordshire Strategic Housing Market Assessment: April 2014
GL Hearn Page 132 of 188
J:\Planning\Job Files\J029822 - Oxfordshire SHMA\Reports\Final SHMA Report (11.04.14).docx
Figure 60 below shows how our estimated affordable requirement compares with the stock of 7.18
affordable housing in 2011 – the figures are based on households (i.e. before adding in a vacancy
allowance). The data shows that relative to the current stock there is a slight move towards a
greater proportion of smaller homes being required – this makes sense given that in the future
household sizes are expected to drop whilst the population of older people will increase – older
person households (as shown earlier) are more likely to occupy smaller dwellings. However, the
analysis still identifies a requirement for more larger units (particularly three bedroom
accommodation).
Impact of Demographic Trends on Affordable Housing Requirements by House Figure 60:
Size, 2011 to 2031 - Oxfordshire
10,34513,513 14,069
1,829
11,239
13,739 12,951
1,687
0
5,000
10,000
15,000
20,000
25,000
30,000
1 bedroom 2 bedrooms 3 bedrooms 4+ bedrooms
Num
ber
of h
ouse
hold
s in
gro
up
20312011
Source: Housing Market Model
Key Findings: Market Housing
As we have previously identified there are a range of factors which can be expected to influence 7.19
demand for housing. This analysis specifically looks at the implications of demographic drivers. It
uses a demographic-driven approach to quantify demand for different sizes of properties over the
20-year period from 2011 to 2031.
Table 63 and Figure 61 below shows estimates of the sizes of market housing required from 2011 7.20
to 2031 based on demographic trends for the whole of the Oxfordshire area. The data suggests a
requirement for homes for 56,532 additional households with the majority of these being two- and
three-bedroom homes.

Oxfordshire Strategic Housing Market Assessment: April 2014
GL Hearn Page 133 of 188
J:\Planning\Job Files\J029822 - Oxfordshire SHMA\Reports\Final SHMA Report (11.04.14).docx
Impact of Demographic Trends on the Size of Dwellings Required – Market Table 63:
Housing
Size 2011 2031
Additional
households 2011-
2031
% of additional
households
1 bedroom 15,846 19,779 3,933 7.0%
2 bedrooms 48,926 62,738 13,812 24.4%
3 bedrooms 90,008 114,242 24,234 42.9%
4+ bedrooms 65,025 79,578 14,553 25.7%
Total 219,806 276,337 56,532 100.0%
Source: Housing Market Model
Figure 61 shows how our estimated market requirement compares with the current stock of housing 7.21
(based on households (i.e. excluding the vacancy allowance)). The data suggests that housing
requirements reinforce around the existing profile of stock, but with a slight shift towards a
requirement for smaller dwellings relative to the distribution of existing housing. This is
understandable given the fact that household sizes a projected to fall slightly in the future (which
itself is partly due to the ageing of the population).
Impact of Demographic Trends on Market Housing Requirements by House Size, Figure 61:
2011 to 2031 - Oxfordshire
15,846
48,926
90,008
65,025
3,933
13,812
24,234
14,553
0
20,000
40,000
60,000
80,000
100,000
120,000
1 bedroom 2 bedrooms 3 bedrooms 4+ bedrooms
Num
ber
of h
ouse
hold
s in
gro
up
20312011
Source: Housing Market Model
Interpreting the Analysis
The graphs and statistics are based upon our modelling of demographic trends. As we have 7.22
identified, it should be recognised that a range of factors including affordability pressures and
market signals will continue to be important in understanding market demand; this may include an
increased demand in the private rented sector for rooms in a shared house due to changes in

Oxfordshire Strategic Housing Market Assessment: April 2014
GL Hearn Page 134 of 188
J:\Planning\Job Files\J029822 - Oxfordshire SHMA\Reports\Final SHMA Report (11.04.14).docx
housing benefit for single people. In determining policies for housing mix, policy aspirations are also
relevant.
The analysis herein needs to be brought together the evidence presented in Section 3 relating to 7.23
localised supply-demand imbalances or gaps in the housing offer. These are however particularly
short-term issues with the focus of analysis in this chapter on informing strategic long-term planning.
We are of the view that it is appropriate through the planning system to seek to influence the 7.24
balance of types and sizes of market housing through considering the mix of sites allocated for
development rather than specific policies relating to the proportion of homes of different sizes which
are then applied to specific sites. This approach is implicit within NPPF which requires local
planning authorities to ‘identify the size, type, tenure and range of housing that is required’.
At the strategic level, a local authority in considering which sites to allocate, can consider what type 7.25
of development would likely be delivered on these sites. It can also provide guidance on housing
mix implicitly through policies on development densities.
Overall Housing Mix
Table 64 below summarises the above data in both the market and affordable sectors under the 7.26
modelling exercise. We have also factored in a vacancy allowance in moving from household
figures to estimates of housing requirements (ranging from about 3%-5% depending on area).
Implications of Demographic Projections on Overall Housing Mix Table 64:
Number of
bedrooms
Market Affordable
Households Dwellings % of
dwellings
Households Dwellings % of
dwellings
1 bedroom 3,933 4,092 7.0% 11,239 11,695 28.4%
2 bedrooms 13,812 14,381 24.4% 13,739 14,303 34.7%
3 bedrooms 24,234 25,221 42.9% 12,951 13,475 32.7%
4+ bedrooms 14,553 15,139 25.7% 1,687 1,755 4.3%
Total 56,532 58,832 100.0% 39,617 41,228 100.0%
Source: Housing Market Model
Whilst the outputs of the modelling provide estimates of the proportion of homes of different sizes 7.27
that should be provided there are a range of factors which should be taken into account in setting
policies for provision. Regard should also be had to issues relating to the turnover and management
of stock, recognising for instance that 1-bed units can provide limited flexibility to meet households’
changing circumstances, whist delivery of larger homes can help to meet needs of households with
a high priority need and help to release supply of smaller properties for other households.
Oxfordshire Strategic Housing Market Assessment: April 2014
GL Hearn Page 135 of 188
J:\Planning\Job Files\J029822 - Oxfordshire SHMA\Reports\Final SHMA Report (11.04.14).docx
It should also be recognised that local authorities have statutory homeless responsibilities towards 7.28
families with children and would therefore prioritise the needs of families over single person
households and couples. On this basis the profile of affordable housing to be provided would be
further weighted to two or more bedroom housing. In the short-term however there may be a need
to increase the supply of one-bedroom homes due to the ‘bedroom tax’.
For these reasons we would suggest in converting the long-term modelled outputs into a profile of 7.29
housing to be provided (in the affordable sector) that the proportion of one bedroom homes required
is reduced slightly from these outputs with a commensurate increase in four or more bedroom
homes also being appropriate.
1-bed properties: 25%-30%
2-bed properties: 30%-35%
3-bed properties: 30%-35%
4-bed properties: 5%-10%
Our strategic conclusions recognise the role which delivery of larger family homes can play in 7.30
releasing supply of smaller properties for other households; together with the limited flexibility which
one-bed properties offer to changing household circumstances which feed through into higher
turnover and management issues.
In setting policies regarding the mix of affordable housing sought in each district, the findings of the 7.31
SHMA should be brought together with other evidence (including where appropriate up-to-date
housing needs assessments).
The need for affordable housing of different sizes will vary by location across the County and over 7.32
time. In considering the mix of homes to be provided within specific development schemes, the
information herein should be brought together with details of households currently on the Housing
Register in the local area and the stock and turnover of existing properties.
In the market sector we would suggests a profile of housing that more closely matches the outputs 7.33
of the modelling. The recommendations take some account of the time period used for the
modelling and the fact that the full impact of the ageing population will not be experienced in the
short-term.
On the basis of these factors we consider that the provision of market housing should be more 7.34
explicitly focused on delivering smaller family housing for younger households. On this basis we
would recommend the following mix of market housing be sought:
5% 1-bed properties
25% 2-bed properties
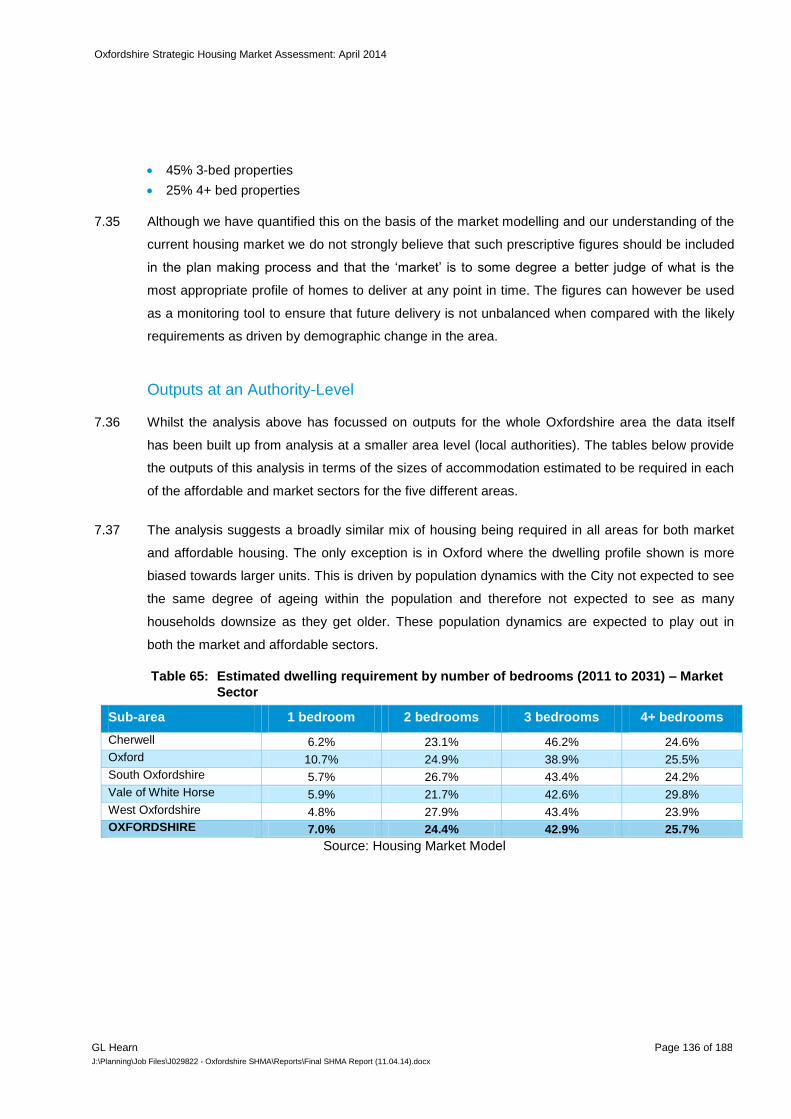
Oxfordshire Strategic Housing Market Assessment: April 2014
GL Hearn Page 136 of 188
J:\Planning\Job Files\J029822 - Oxfordshire SHMA\Reports\Final SHMA Report (11.04.14).docx
45% 3-bed properties
25% 4+ bed properties
Although we have quantified this on the basis of the market modelling and our understanding of the 7.35
current housing market we do not strongly believe that such prescriptive figures should be included
in the plan making process and that the ‘market’ is to some degree a better judge of what is the
most appropriate profile of homes to deliver at any point in time. The figures can however be used
as a monitoring tool to ensure that future delivery is not unbalanced when compared with the likely
requirements as driven by demographic change in the area.
Outputs at an Authority-Level
Whilst the analysis above has focussed on outputs for the whole Oxfordshire area the data itself 7.36
has been built up from analysis at a smaller area level (local authorities). The tables below provide
the outputs of this analysis in terms of the sizes of accommodation estimated to be required in each
of the affordable and market sectors for the five different areas.
The analysis suggests a broadly similar mix of housing being required in all areas for both market 7.37
and affordable housing. The only exception is in Oxford where the dwelling profile shown is more
biased towards larger units. This is driven by population dynamics with the City not expected to see
the same degree of ageing within the population and therefore not expected to see as many
households downsize as they get older. These population dynamics are expected to play out in
both the market and affordable sectors.
Estimated dwelling requirement by number of bedrooms (2011 to 2031) – Market Table 65:
Sector
Sub-area 1 bedroom 2 bedrooms 3 bedrooms 4+ bedrooms
Cherwell 6.2% 23.1% 46.2% 24.6%
Oxford 10.7% 24.9% 38.9% 25.5%
South Oxfordshire 5.7% 26.7% 43.4% 24.2%
Vale of White Horse 5.9% 21.7% 42.6% 29.8%
West Oxfordshire 4.8% 27.9% 43.4% 23.9%
OXFORDSHIRE 7.0% 24.4% 42.9% 25.7%
Source: Housing Market Model

Oxfordshire Strategic Housing Market Assessment: April 2014
GL Hearn Page 137 of 188
J:\Planning\Job Files\J029822 - Oxfordshire SHMA\Reports\Final SHMA Report (11.04.14).docx
Estimated dwelling requirement by number of bedrooms (2011 to 2031) – Table 66:
Affordable Sector
Sub-area 1 bedroom 2 bedrooms 3 bedrooms 4+ bedrooms
Cherwell 28.3% 31.0% 36.9% 3.7%
Oxford 29.0% 32.7% 32.2% 6.1%
South Oxfordshire 32.6% 35.5% 29.3% 2.7%
Vale of White Horse 27.3% 35.1% 33.6% 3.9%
West Oxfordshire 23.3% 43.7% 30.4% 2.6%
OXFORDSHIRE 28.4% 34.7% 32.7% 4.3%
Source: Housing Market Model
Conclusions and Implications
There are a range of factors which will influence demand for different sizes of homes, including 7.38
demographic changes; future growth in real earnings and households’ ability to save; economic
performance and housing affordability. Our analysis linked to long-term (20-year) demographic
change concludes that the following represents an appropriate mix of affordable and market homes.
Conclusions regarding Mix of Homes, HMA Level Table 67:
1-bed 2-bed 3-bed 4+ bed
Market 5% 25% 45% 25%
Affordable 25-30% 30-35% 30-35% 5-10%
All dwellings 15% 30% 40% 15%
Our strategic conclusions in the affordable sector recognise the role which delivery of larger family 7.39
homes can play in releasing supply of smaller properties for other households; together with the
limited flexibility which one-bed properties offer to changing household circumstances which feed
through into higher turnover and management issues.
The mix identified above should inform strategic HMA-wide policies. In applying these to individual 7.40
development sites regard should be had to the nature of the development site and character of the
area, and to up-to-date evidence of need as well as the existing mix and turnover of properties at
the local level.
Based on the evidence, we would expect the a balanced profile of market homes of different sizes, 7.41
including smaller two- and three-bedroom homes for younger households and those looking to
downsize; as well as larger family homes. The mix identified is focused more towards smaller
properties than the existing mix of homes.
The analysis of an appropriate mix of dwellings should also inform the ‘portfolio’ of sites which are 7.42
considered through the Local Plan process, including: Site Allocations, Neighbourhood Plans and
other planning documents. Equally it will be of relevance to affordable housing negotiations.

Oxfordshire Strategic Housing Market Assessment: April 2014
GL Hearn Page 138 of 188
J:\Planning\Job Files\J029822 - Oxfordshire SHMA\Reports\Final SHMA Report (11.04.14).docx

Oxfordshire Strategic Housing Market Assessment: April 2014
GL Hearn Page 139 of 188
J:\Planning\Job Files\J029822 - Oxfordshire SHMA\Reports\Final SHMA Report (11.04.14).docx
8 HOUSING NEEDS OF SPECIFIC GROUPS IN THE POPULATION
Introduction
This section considers the housing needs of specific groups within the population, whose needs 8.1
may differ from those of the wider population. Estimates of household groups who have particular
housing needs is a key output of the SHMA Guidance whilst the National Planning Policy
Framework identifies that local planning authorities should plan for a mix of housing which takes
account of the needs of different groups in the community.
The following key groups have been identified which may have housing needs which differ from 8.2
those of the wider population:
Older Persons;
People with disabilities;
Black and Minority Ethnic (BME) households;
Households with children;
Young people;
Students;
Self-builders.
Housing Needs of Older People
The SHMA Guidance recognises the need to provide housing for older people as part of achieving 8.3
a good mix of housing. A key driver of change in the housing market over the next 20 years is
expected to be the growth in the population of older persons.
Indeed as population projections show, the number of older people is expected to increase 8.4
significantly over the next few years. In this section we draw on a range of sources including our
population projections and data from POPPI (Projecting Older People Population Information).
The context to older persons housing provision can be summarised as below: 8.5
A need to provide housing for older people as part of achieving a good mix of housing, but
recognizing that many older people are able to exercise choice and control over housing options
– e.g. owner occupiers with equity in their homes;
Falling demand for residential care in some areas, and a rapidly rising average age of people
living in sheltered housing over 20 years, requiring higher levels of support. However many local
authorities have struggled to contain expenditure on services for older people;
New models of enhanced and extra care housing have emerged. These aim to meet the needs
of those who require high levels of care and support alongside those who are still generally able
to care for themselves. These models often allow for changing circumstances in situ rather than
requiring a move; and
Providing choice, including supporting people to stay in their own homes including through
supporting adaptations to properties and through provision of floating support.

Oxfordshire Strategic Housing Market Assessment: April 2014
GL Hearn Page 140 of 188
J:\Planning\Job Files\J029822 - Oxfordshire SHMA\Reports\Final SHMA Report (11.04.14).docx
Current Population of Older Persons
Below we have provided some baseline population data about older persons and compared this 8.6
with other areas. The data for has been taken from the published ONS mid-year population
estimates and is provided for age groups from 55 and upwards. In reality, those aged 55 might not
be considered as ‘old’ but we have started the analysis from this age group due to the fact that
some housing developments are specifically targeted at the over 55 age group.
The data shows that, when compared with both the South East (Region) and England, the County 8.7
has a lower proportion of older persons. In 2011 it is estimated that 27.3% of the population of
Oxfordshire was aged 55 or over compared with 29.2% in the South East (Region) and 28.0% for
the whole of England.
The lower level of older persons can largely be explained by the population profile of Oxford City 8.8
which has only 19.2% of its population aged 55 and over. All other areas have at least 27% of their
population aged 55 and over with the highest figure (of 31%) being seen in West Oxfordshire.
Older person population (2011) Table 68:
Age group Oxfordshire South East England
Population % of popn Population % of popn Population % of popn
Under 55 476,227 72.7% 6,127,449 70.8% 38,211,710 72.0%
55-64 73,925 11.3% 1,029,865 11.9% 6,165,792 11.6%
65-74 54,924 8.4% 771,829 8.9% 4,592,171 8.6%
75-84 34,849 5.3% 503,979 5.8% 2,944,178 5.5%
85+ 14,866 2.3% 219,662 2.5% 1,193,318 2.2%
Total 654,791 100.0% 8,652,784 100.0% 53,107,169 100.0%
Total 55+ 178,564 27.3% 2,525,335 29.2% 14,895,459 28.0%
Source: ONS 2011 mid-year population estimates
Future Changes in the Population of Older Persons
As well as providing a baseline position for the proportion of older persons in the County we can 8.9
use our population projections to provide an indication of how the numbers might change in the
future compared with other areas. The data provided below is based on a demographic model
linked to the midpoint housing number of 5,003 units per annum.
The data shows that Oxfordshire is expected to see a substantial increase in the older person 8.10
population with the total number of people aged 55 and over expected to increase by 49% over just
20-years. A particularly high increase is expected in Cherwell with a lower figure being seen in
Oxford. The finding for Oxford is mainly linked to the younger population age profile in the City and
the fact that migration patterns tend to focus on younger people. In the case of Cherwell the

Oxfordshire Strategic Housing Market Assessment: April 2014
GL Hearn Page 141 of 188
J:\Planning\Job Files\J029822 - Oxfordshire SHMA\Reports\Final SHMA Report (11.04.14).docx
findings are to some degree related to the higher overall population growth projected for the area.
For all areas we are also expected to see significant population growth in the oldest age groups
with the population aged 85 and over expected to increase by 127% over the next 20-years. To
some degree the pattern in Oxfordshire follows that expected nationally although the overall growth
in the population aged 55 and over (and age groups within this) is higher than projected nationally
in the last completed set of subnational population projections (the 2010-based version).
Projected Change in Population of Older Persons (2011 to 2031) Table 69:
Age group Cherwell Oxford South Oxon VoWH West Oxon Oxfordshire
Under 55 21.2% 50.8% 14.3% 38.1% 9.9% 28.7%
55-64 32.4% 27.6% 23.0% 22.9% 21.0% 25.5%
65-74 61.6% 44.3% 41.0% 49.2% 52.3% 49.7%
75-84 76.7% 39.1% 64.7% 67.4% 79.2% 66.4%
85+ 142.8% 47.9% 134.6% 142.8% 159.4% 126.8%
Total 31.1% 48.1% 24.0% 41.7% 23.6% 34.3%
Total 55+ 58.0% 36.6% 46.0% 49.7% 54.1% 49.3%
Source: Population projections
Characteristics of Older Persons Households
The table below shows data from the 2011 Census about the number of pensioner households 8.11
(defined as people aged 65 and over regardless of sex) compared with other areas. The data
shows in 2011 that around 21% of households were comprised entirely of pensioners. This is the
same as the regional figure and very slightly lower than the national average. Of the total number of
pensioner households some 56% are single person households.
Pensioner households (Census 2011) Table 70:
Pensioner households Oxfordshire South East England
Single pensioner 29,852 2,725,596 449,969
2 or more pensioners 23,635 1,851,180 329,263
All households 258,855 22,063,368 3,555,463
Single pensioner 11.5% 12.4% 12.7%
2 or more pensioners 9.1% 8.4% 9.3%
All households 100.0% 100.0% 100.0%
Total % pensioner only 20.7% 20.7% 21.9%
Source: Census (2011)
The figure below shows the tenure of older person households – the data has been split between 8.12
single pensioner households and those with two or more pensioners (which will largely be couples).
The data shows that pensioner households are relatively likely to live in owner-occupied
accommodation (77%) and are also slightly more likely than other households to be in the social
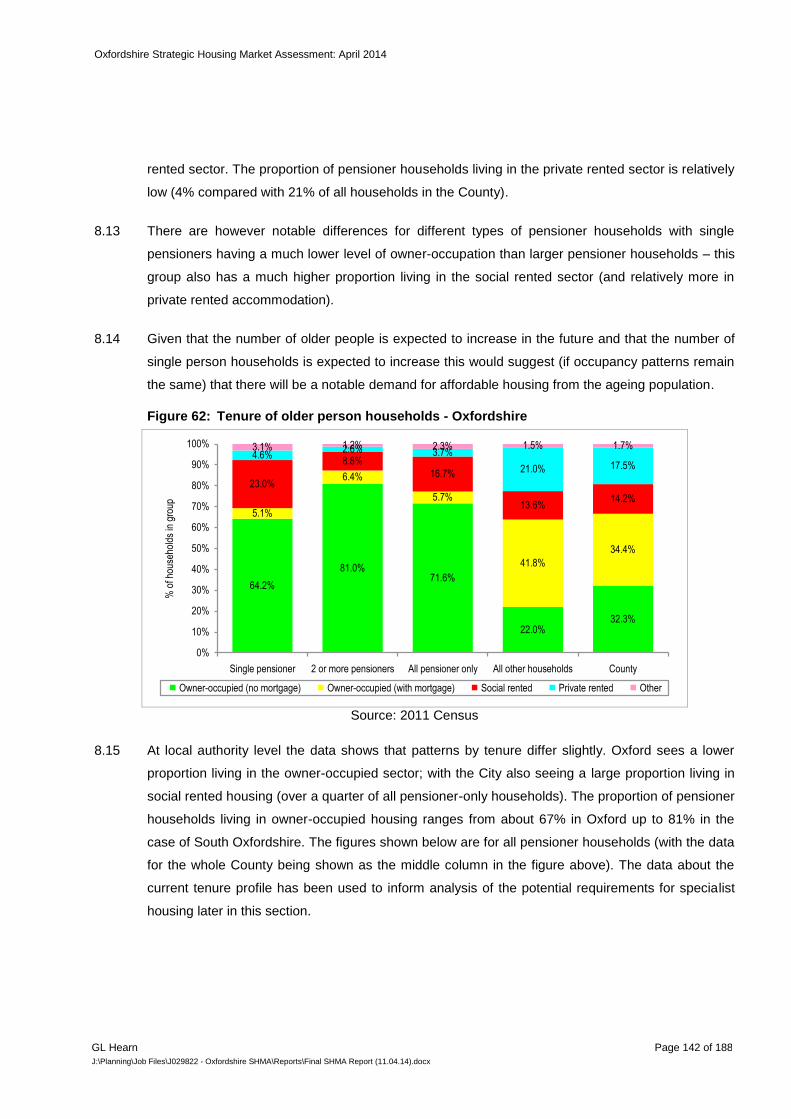
Oxfordshire Strategic Housing Market Assessment: April 2014
GL Hearn Page 142 of 188
J:\Planning\Job Files\J029822 - Oxfordshire SHMA\Reports\Final SHMA Report (11.04.14).docx
rented sector. The proportion of pensioner households living in the private rented sector is relatively
low (4% compared with 21% of all households in the County).
There are however notable differences for different types of pensioner households with single 8.13
pensioners having a much lower level of owner-occupation than larger pensioner households – this
group also has a much higher proportion living in the social rented sector (and relatively more in
private rented accommodation).
Given that the number of older people is expected to increase in the future and that the number of 8.14
single person households is expected to increase this would suggest (if occupancy patterns remain
the same) that there will be a notable demand for affordable housing from the ageing population.
Tenure of older person households - Oxfordshire Figure 62:
64.2%
81.0%71.6%
22.0%32.3%
5.1%
6.4%
5.7%
41.8%
34.4%
23.0%
8.8%
16.7%
13.6%14.2%
4.6%2.6% 3.7%
21.0% 17.5%
3.1% 1.2% 2.3% 1.5% 1.7%
0%
10%
20%
30%
40%
50%
60%
70%
80%
90%
100%
Single pensioner 2 or more pensioners All pensioner only All other households County
% o
f hou
seho
lds
in g
roup
Owner-occupied (no mortgage) Owner-occupied (with mortgage) Social rented Private rented Other
Source: 2011 Census
At local authority level the data shows that patterns by tenure differ slightly. Oxford sees a lower 8.15
proportion living in the owner-occupied sector; with the City also seeing a large proportion living in
social rented housing (over a quarter of all pensioner-only households). The proportion of pensioner
households living in owner-occupied housing ranges from about 67% in Oxford up to 81% in the
case of South Oxfordshire. The figures shown below are for all pensioner households (with the data
for the whole County being shown as the middle column in the figure above). The data about the
current tenure profile has been used to inform analysis of the potential requirements for specialist
housing later in this section.

Oxfordshire Strategic Housing Market Assessment: April 2014
GL Hearn Page 143 of 188
J:\Planning\Job Files\J029822 - Oxfordshire SHMA\Reports\Final SHMA Report (11.04.14).docx
Tenure of Older Person Households – by local authority Figure 63:
71.5%62.2%
75.5% 74.6% 72.2%
5.9%
4.7%
6.0% 5.4% 6.1%
15.8%26.3%
13.3% 14.9% 15.4%
4.0% 3.9% 3.4% 3.4% 4.1%2.8% 2.9% 1.8% 1.8% 2.2%
0%
10%
20%
30%
40%
50%
60%
70%
80%
90%
100%
Cherwell Oxford South Oxon VoWH West Oxon
% o
f hou
seho
lds
in g
roup
Owner-occupied (no mortgage) Owner-occupied (with mortgage) Social rented Private rented Other
Source: 2011 Census
A key theme that is often brought out in Housing Market Assessment work is the large proportion of 8.16
older person households who under-occupy their dwellings. Data from the Census allows us to
investigate this using the bedroom standard. The Census data suggests that older person
households are more likely to under-occupy their housing than other households in the County. In
total 61% have an occupancy rating of +2 or more (meaning there are at least two more bedrooms
than are technically required by the household). This compares with 35% for non-pensioner
households. Further analysis suggests that under-occupancy is far more common in households
with two or more pensioners than single pensioner households.
Occupancy rating of older person households - Oxfordshire Figure 64:
49.5%
75.2%
60.7%
35.4%40.5%
30.9%
20.6%
26.5%
34.6%33.0%
19.3%
4.1%12.7%
25.9% 23.2%
0.2% 0.1% 0.2% 4.1% 3.3%
0%
10%
20%
30%
40%
50%
60%
70%
80%
90%
100%
Single pensioner 2 or more pensioners All pensioner only All other households All households
% o
f hou
seho
lds
in g
roup
+2 or more -1 0 -1 or less
Source: 2011 Census

Oxfordshire Strategic Housing Market Assessment: April 2014
GL Hearn Page 144 of 188
J:\Planning\Job Files\J029822 - Oxfordshire SHMA\Reports\Final SHMA Report (11.04.14).docx
It is of interest to study the above information by tenure. The table below shows the number of 8.17
pensioner households who had an occupancy rating of +2 or more in each of three broad tenure
groups in 2011. Whilst the majority of older person households with an occupancy rating of +2 or
more were in the owner-occupied sector, there were around 1,800 properties in the social rented
sector occupied by pensioner only households with an occupancy rating of +2 or more. This may
therefore present some opportunity to reduce under-occupation although to achieve this it may be
necessary to provide housing in areas where households currently live and where they have social
and community ties
Pensioner households with occupancy rating of +2 or more by tenure Table 71:
Tenure Single pensioner
2 or more
pensioners
All pensioner only
households
Owner-occupied 12,786 16,182 28,968
Social rented 1,174 655 1,829
Private rented 822 431 1,253
All tenures 14,782 17,268 32,050
Source: 2011 Census
It should however be recognised that many older households in the private sector will have built up 8.18
equity in their existing homes. In the private sector many older households may be able to afford a
larger home than they need (and thus under-occupy housing). Some may look to downsize to
release equity from homes to support their retirement (or may move away from the area); however
we would expect many older households to want to retain family housing with space to allow friends
and relatives to come to stay.
Health-related Population Projections
In addition to providing projections about how the number and proportion of older people is 8.19
expected to change in the future we can look at the likely impact on the number of people with
specific illnesses or disabilities. For this we have used data from the Projecting Older People
Information System (POPPI) website which provides prevalence rates for different disabilities by
age and sex. For the purposes of the SHMA analysis has focussed on estimates of the number of
people with dementia and mobility problems.
For both of the health issues analysed the figures relate to the population aged 65 and over. The 8.20
figures from POPPI are based on prevalence rates from a range of different sources and whilst
these might change in the future (e.g. as general health of the older person population improves)
the estimates are likely to be of the right order.
The table below shows that both of the illnesses/disabilities are expected to increase significantly in 8.21
the future although this would be expected given the increasing population. In particular there is

Oxfordshire Strategic Housing Market Assessment: April 2014
GL Hearn Page 145 of 188
J:\Planning\Job Files\J029822 - Oxfordshire SHMA\Reports\Final SHMA Report (11.04.14).docx
projected to be a large rise in the number of people with dementia (up 98%) along with an 82%
increase in the number with mobility problems.
Estimated population change for range of health issues (2011 to 2031) Table 72:
Type of illness/disability 2011 2031 Change % increase
Cherwell
Dementia 1,525 3,189 1,663 109.0%
Mobility problems 4,006 7,711 3,705 92.5%
Oxford
Dementia 1,284 1,877 593 46.2%
Mobility problems 3,248 4,638 1,390 42.8%
South Oxfordshire
Dementia 1,735 3,457 1,722 99.3%
Mobility problems 4,523 8,170 3,646 80.6%
Vale of White Horse
Dementia 1,573 3,252 1,679 106.7%
Mobility problems 4,067 7,642 3,575 87.9%
West Oxfordshire
Dementia 1,404 3,089 1,685 120.0%
Mobility problems 3,615 7,197 3,582 99.1%
Oxfordshire
Dementia 7,521 14,864 7,343 97.6%
Mobility problems 19,459 35,358 15,898 81.7%
Source: Data from POPPI and demographic projections
The table below shows this information by age band for the whole of Oxfordshire. Consistent with 8.22
overall demographic change the analysis shows particularly large increases in the population aged
85 and over with the health issues studied.
Estimated population change for range of health issues (2011 to 2031) – by age Table 73:
Age band
Dementia Mobility problems
2011 2031 Change %
increase 2011 2031 Change
%
increase
65-69 381 564 182 47.8% 2,621 3,866 1,245 47.5%
70-74 661 1,007 346 52.4% 3,172 4,834 1,662 52.4%
75-79 1,158 1,743 585 50.6% 3,321 5,010 1,689 50.8%
80-84 1,798 3,352 1,554 86.4% 3,647 6,767 3,120 85.5%
85+ 3,523 8,198 4,675 132.7% 6,697 14,881 8,184 122.2%
Total 7,521 14,864 7,343 97.6% 19,459 35,358 15,898 81.7%
Source: Data from POPPI and demographic projections

Oxfordshire Strategic Housing Market Assessment: April 2014
GL Hearn Page 146 of 188
J:\Planning\Job Files\J029822 - Oxfordshire SHMA\Reports\Final SHMA Report (11.04.14).docx
Indicative Requirements for Specialist Housing
Given the ageing population and higher levels of disability and health problems amongst older 8.23
people there is likely to be an increased requirement for specialist housing options moving forward.
The analysis in this section draws on data provided by the County Council and the Housing
Learning and Information Network (Housing LIN) along with our demographic projections to provide
an indication of the potential level of additional specialist housing that might be required for older
people moving forward.
Current stock of housing
The table below shows the current supply of specialist housing for older people. At present it is 8.24
estimated that there are 6,633 units; this is equivalent to 133 units per person aged 75 and over.
The majority (63%) of this housing is in the affordable sector with only a third being market housing
(even though the majority of retired households are owner-occupiers). Looking at individual areas it
is clear that the supply relative to the population is particularly high in Cherwell and Oxford with
much lower figures in West Oxfordshire and to a lesser extent the Vale of White Horse. West
Oxfordshire also stands out as the only area where the supply of market units is higher than in the
affordable sector.
Current supply of specialist housing for older people Table 74:
Area Affordable Market Total Supply per
1,000 aged 75+
Cherwell 1,374 587 1,961 192
Oxford 1186 349 1,535 185
South Oxon 1,023 489 1,512 132
VoWH 531 480 1,011 96
West Oxon 91 523 614 66
County 4,205 2,428 6,633 133
Source: Housing LIN
Projected future need for specialist housing
The analysis above showed a total of 133 specialist units per 1,000 people aged 75 and over; this 8.25
figure is lower than the national average of about 170. In projecting forward how many additional
units might be required we have modelled on the basis of maintaining the 133 position and also the
implications of increasing this to 170. The analysis is based on achieving these levels in all areas by
2031. The analysis has been linked to a demographic projection taking the midpoint of the housing
need (some 5,003 units per annum).

Oxfordshire Strategic Housing Market Assessment: April 2014
GL Hearn Page 147 of 188
J:\Planning\Job Files\J029822 - Oxfordshire SHMA\Reports\Final SHMA Report (11.04.14).docx
Oxfordshire County Council currently works on the basis of seeking to provide 55 units of extra care 8.26
housing per 1,000 people aged 75 and over as part of the overall specialist housing need.
The analysis shows to maintain the current level of provision there would need to be a further 5,564 8.27
units provided – this figure increases to 8,958 if the level of provision were to get to the national
average. The analysis also shows relatively little need for additional provision in Oxford and a
relatively high level in West Oxfordshire. The low figure in Oxford is driven by the high current
supply along with a less rapidly growing older person population. The higher figures in west
Oxfordshire are for exactly the opposite reasons.
Projected need for specialist housing for older people Table 75:
Area @ 133 per 1,000 @ 170 per 1,000
Need Supply Net need Need Supply Net need
Cherwell 2,657 1,961 696 3,397 1,961 1,436
Oxford 1,568 1,535 33 2,004 1,535 469
South Oxon 2,821 1,512 1,309 3,606 1,512 2,094
VoWH 2,646 1,011 1,635 3,382 1,011 2,371
West Oxon 2,505 614 1,891 3,202 614 2,588
County 12,197 6,633 5,564 15,591 6,633 8,958
Source: Derived from demographic projections
It should be stressed that the analysis above is based on modelling data on a series of assumptions 8.28
and should therefore be treated as indicative.
The figures in Table 75 reflect the net need for additional stock. They do not take account of 8.29
‘replacement’ provision for existing specialist accommodation which is no longer fit-for-purpose. It is
expected that a significant proportion of the current specialist housing stock may need replacing or
remodelling to meet modern requirements and disability standards. The gross need for specialist
housing is thus expected to be higher than shown.
Types and tenures of specialist housing
The analysis above is not specific about the types of specialist housing that might be required; we 8.30
would consider that decisions about mix should be taken at a local level taking account of specific
needs and the current supply of different types of units available. There may also be the opportunity
moving forward for different types of provision to be developed as well as the more traditional
sheltered and Extra-Care housing.
Within the different models and assumptions made regarding the future need for specialist 8.31
retirement housing (normally defined as a form of congregate housing designed exclusively for
older people which usually offers some form of communal space, community alarm service and

Oxfordshire Strategic Housing Market Assessment: April 2014
GL Hearn Page 148 of 188
J:\Planning\Job Files\J029822 - Oxfordshire SHMA\Reports\Final SHMA Report (11.04.14).docx
access to support and care if required), there may for example be an option to substitute some of
this specialist provision with a mix of one and two bedroomed housing aimed to attract ‘early retired’
older people which could be designated as age specific or not. Such housing could be part of the
general mix of one and two bedroom homes but built to Lifetime Homes standards in order to attract
retired older people looking to ‘down size’ but perhaps not wanting to live in specialist retirement
housing.
It is however worth noting that at present the County Council work on the basis of providing around 8.32
55 units of extra-care housing per 1,000 people aged 75 and over. Information about the provision
of extra-care housing is set out in Market Position Statements (MPS) which can be found on the
Source Oxfordshire website www.sourceoxfordshire.org.uk; the County Council will keep the
content of the MPS up to date.
Stakeholder work carried out as part of the SHMA has also identified that there is likely to be a 8.33
demand for bungalows. Where developments including bungalows were found it was clear that
these were very popular to older people downsizing. In reality it may be difficult to provide a
significant number of bungalows moving forward given the typical plot size compared to floorspace
– however, there may be some merit in considering providing bungalows in locations where a
specific demand for a household to downsize can be established.
Regarding the tenure mix; we have noted that at present there is a much higher level of supply in 8.34
the affordable sector than for market housing whereas the majority of older person households are
owner-occupiers. This would suggest moving forward that a greater emphasis could be placed on
market specialist provision than has been the case in the past.
Decisions on the type and tenure of specialist housing should be arrived at through joint working 8.35
between the County Council, district council and other stakeholders. Extra care is an example of the
different types of provision which can be developed as well as the more traditional sheltered
housing. Local plans should consider setting the framework for what provision of specialist housing
is needed, and might consider seeking provision of specialist accommodation on strategic sites.
Registered Care Homes
As well as the need for specialist housing for older people the analysis needs to consider registered 8.36
care home places. At present (according to Housing LIN) there are around 4,400 spaces in nursing
and residential care homes. At the current time the County Council does not have plans to increase
the number of bedspaces it funds in Registered Care Homes and is seeking to provide more
community based alternatives such as Extra-Care housing. There is however a recognition that

Oxfordshire Strategic Housing Market Assessment: April 2014
GL Hearn Page 149 of 188
J:\Planning\Job Files\J029822 - Oxfordshire SHMA\Reports\Final SHMA Report (11.04.14).docx
there will be some additional need for particular groups such as those requiring care homes offering
specialist nursing or for people with dementia.
Older Person Households - Conclusions
The older person population of Oxfordshire is about average when compared with national figures 8.37
and is projected to increase significantly up until 2031.
Older persons are more likely to under-occupy homes. In the affordable sector, there may be 8.38
potential to reduce (or seek to limit potential growth in) under-occupation and the Councils may
wish to consider providing support and incentives to social housing occupiers to downsize. This will
help to release larger affordable homes for younger households. An analysis of older person
households suggest that they are more likely to live in social rented housing (especially single
pensioner households). With the projected increases in older persons there may therefore be
additional pressure on the affordable housing stock from such households.
Our analysis also suggests that the growing older population (particularly in the oldest age groups) 8.39
will result in growth in households with specialist housing needs. Typically the greatest support
needs are for alterations to properties (such as to bathrooms, showers and toilets, provision of
emergency alarms or help maintaining homes). Many of these can be resolved in situ through
adaptations to existing properties and the resource implications of this will need to be planned for.
The growing older population will however likely lead to some increase in requirements for 8.40
specialist housing solutions. The analysis above suggests a 98% growth in older population with
dementia, and an 82% increase in the older population with mobility problems. From a planning
point of view, some of these people will require specialist housing such as sheltered or extra care
provision. Increasing numbers of older people with health problems will also require joint-working
between housing and health (Council and NHS).
Our analysis suggests a potential requirement for around 280-450 additional housing units to be 8.41
specialist accommodation across the County to meet the needs of the older person population each
year moving to 2031.
People with Disabilities
This section concentrates on the housing situation of people/households that contain someone with 8.42
some form of disability. We have again drawn on Census data although at the time of writing the
level of available Census data was quite limited. It should also be recognised that an analysis of
people with disabilities is very strongly linked with the above analysis about older people.
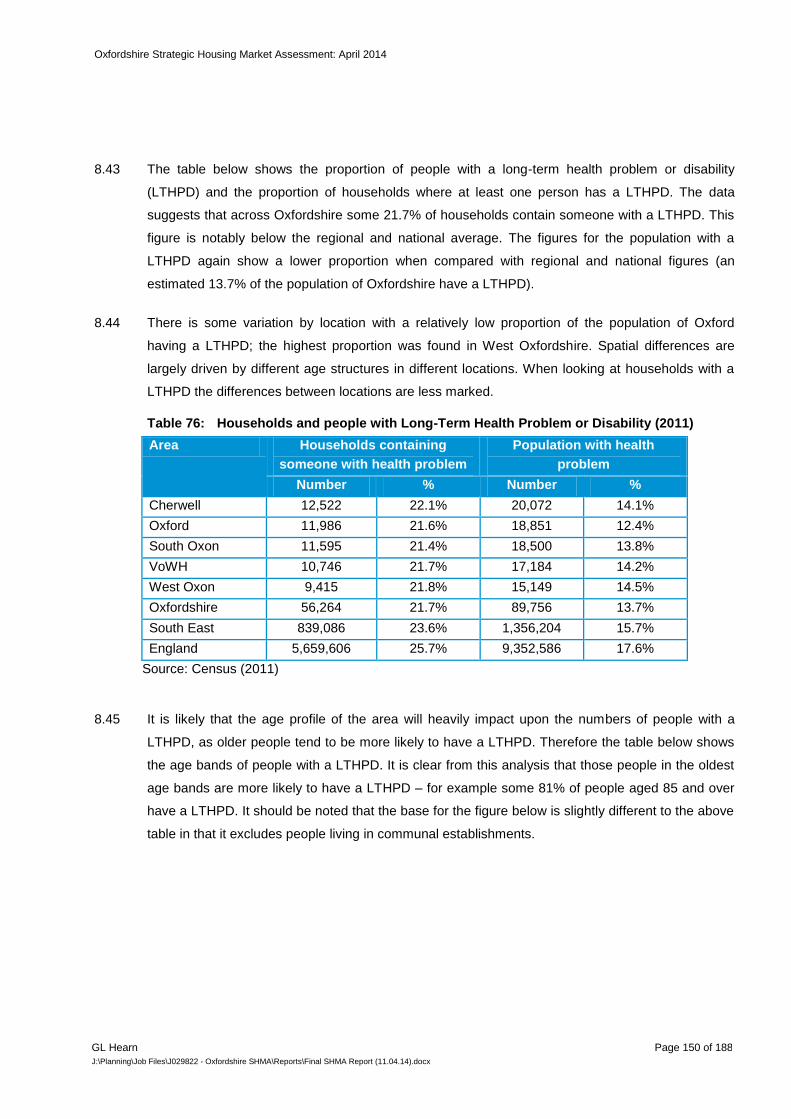
Oxfordshire Strategic Housing Market Assessment: April 2014
GL Hearn Page 150 of 188
J:\Planning\Job Files\J029822 - Oxfordshire SHMA\Reports\Final SHMA Report (11.04.14).docx
The table below shows the proportion of people with a long-term health problem or disability 8.43
(LTHPD) and the proportion of households where at least one person has a LTHPD. The data
suggests that across Oxfordshire some 21.7% of households contain someone with a LTHPD. This
figure is notably below the regional and national average. The figures for the population with a
LTHPD again show a lower proportion when compared with regional and national figures (an
estimated 13.7% of the population of Oxfordshire have a LTHPD).
There is some variation by location with a relatively low proportion of the population of Oxford 8.44
having a LTHPD; the highest proportion was found in West Oxfordshire. Spatial differences are
largely driven by different age structures in different locations. When looking at households with a
LTHPD the differences between locations are less marked.
Households and people with Long-Term Health Problem or Disability (2011) Table 76:
Area Households containing
someone with health problem
Population with health
problem
Number % Number %
Cherwell 12,522 22.1% 20,072 14.1%
Oxford 11,986 21.6% 18,851 12.4%
South Oxon 11,595 21.4% 18,500 13.8%
VoWH 10,746 21.7% 17,184 14.2%
West Oxon 9,415 21.8% 15,149 14.5%
Oxfordshire 56,264 21.7% 89,756 13.7%
South East 839,086 23.6% 1,356,204 15.7%
England 5,659,606 25.7% 9,352,586 17.6%
Source: Census (2011)
It is likely that the age profile of the area will heavily impact upon the numbers of people with a 8.45
LTHPD, as older people tend to be more likely to have a LTHPD. Therefore the table below shows
the age bands of people with a LTHPD. It is clear from this analysis that those people in the oldest
age bands are more likely to have a LTHPD – for example some 81% of people aged 85 and over
have a LTHPD. It should be noted that the base for the figure below is slightly different to the above
table in that it excludes people living in communal establishments.

Oxfordshire Strategic Housing Market Assessment: April 2014
GL Hearn Page 151 of 188
J:\Planning\Job Files\J029822 - Oxfordshire SHMA\Reports\Final SHMA Report (11.04.14).docx
Population with LTHPD in each Age Band Figure 65:
13.6%
81.1%
54.6%
29.9%
15.8%
8.2%
4.9%
4.5%
2.8%
0% 10% 20% 30% 40% 50% 60% 70% 80% 90%
All ages
Age 85 and over
Age 75 to 84
Age 65 to 74
Age 50 to 64
Age 35 to 49
Age 25 to 34
Age 16 to 24
Age 0 to 15
LTHPD
Source: Census (2011)
The age specific prevalence rates shown above can be applied to the demographic data to estimate 8.46
the likely increase over time of the number of people with a LTHPD. In applying this information to
our main demographic projections it is estimated that the number of people with a LTHPD will
increase by around 47,100 (a 50% increase). The vast majority of this increase (76%) is expected
to be in age groups aged 65 and over. The population increase of people with a LTHPD represents
21% of the total increase in the population projected by the demographic modelling.
Many people with disabilities are likely to want to live in their own homes, rather than in institutions. 8.47
Properties are likely to require adaptations in some instances, whilst other households may require
more specialist housing designed to meet their needs. Providing a choice of suitable housing
(including in a range of tenures and a greater range of self-contained flats) will continue to be
important to meeting the needs of households with disabilities.
Specialist housing for adults with care and support needs
The analysis above highlights that the number of people with a disability is expected to increase 8.48
notably over the next few years. This appears to largely be due to an ageing population and a
greater number of older people. It is however also worthwhile reflecting on the need for specialist
housing for a changing adult population. For this analysis we have drawn on information provided
by the County Council and included in the document ‘A strategy for delivering an increased supply

Oxfordshire Strategic Housing Market Assessment: April 2014
GL Hearn Page 152 of 188
J:\Planning\Job Files\J029822 - Oxfordshire SHMA\Reports\Final SHMA Report (11.04.14).docx
of Specialist Housing for adults with care and support needs in Oxfordshire’ (May 2013). The table
below shows a summary of estimated requirements for the period 2013 to 2020.
Specialist Housing Requirements 2013-20 – adult population Table 77:
Area Number %
Cherwell 82 21%
Oxford 102 26%
South Oxon 74 19%
VoWH 70 18%
West Oxon 63 16%
Oxfordshire 391 100%
Source: Oxfordshire County Council
The table shows a need for an additional 391 units of accommodation (about 56 per annum on 8.49
average). Of these, around 38% are for people with physical disabilities, 25% for those with learning
disabilities and 38% for people with mental health problems. More information about the specific
types of accommodation, locations and client groups can be found in the County Council report.
People with disabilities - conclusions
Currently 22% of households contain someone with a long-term health problem or disability. 8.50
Demographic trends are expected to lead to a significant growth in the population and number of
households with disabilities over the period to 2031. Housing support services, including provision
of adaptations to properties, will need to be adequately resources to take account of this.
BME Households
Black or Minority Ethnic (BME) households, as a group, are quite often found to have distinct 8.51
characteristics in terms of their housing needs, or may be disadvantaged in some way.
From 2011 Census data we find that around 15% of the population of Oxfordshire came from a non-8.52
White (British/Irish) background. This figure is slightly lower than found across England but higher
than the comparative regional figure (of 14%). The key BME groups in Oxfordshire are Other-White
(which is likely to contain a number of Eastern European migrants) and Asian – the Asian
population makes up 4.8% of all people in the County.
Additional data analysis shows some large differences by location with the proportion of the 8.53
population from a non-White (British/Irish) group varying from 7% in West Oxfordshire up to 35% in
Oxford.
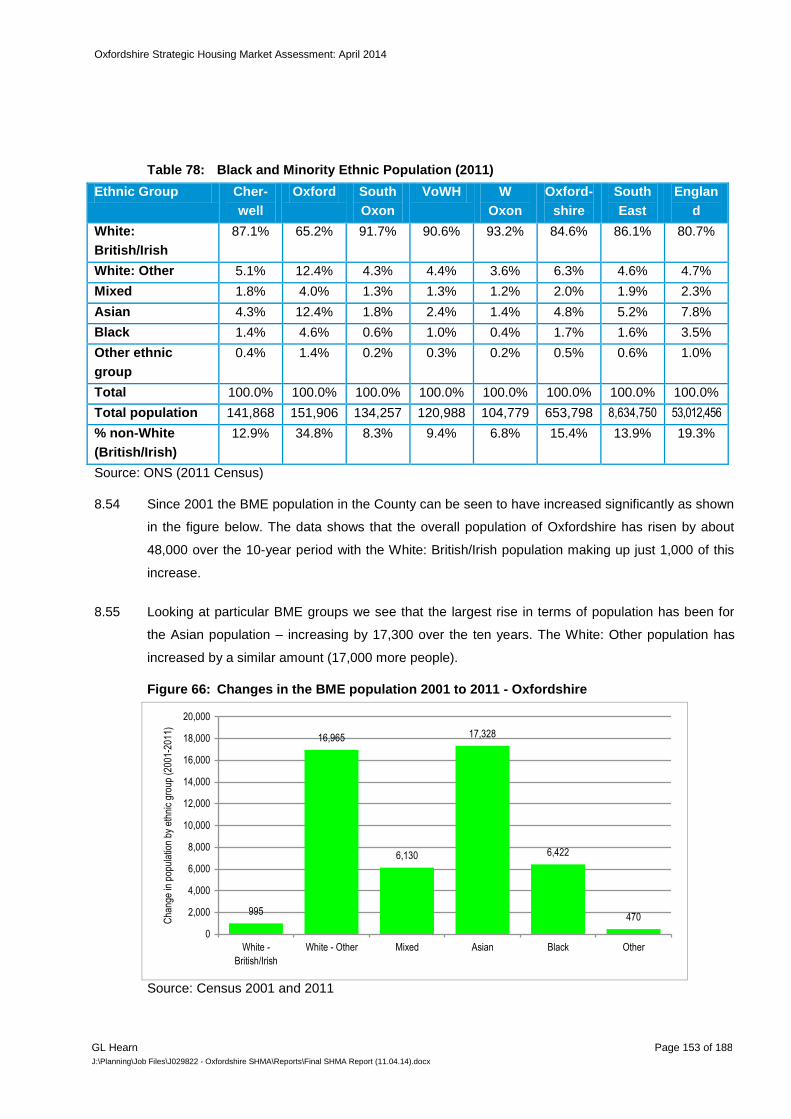
Oxfordshire Strategic Housing Market Assessment: April 2014
GL Hearn Page 153 of 188
J:\Planning\Job Files\J029822 - Oxfordshire SHMA\Reports\Final SHMA Report (11.04.14).docx
Black and Minority Ethnic Population (2011) Table 78:
Ethnic Group Cher-
well
Oxford South
Oxon
VoWH W
Oxon
Oxford-
shire
South
East
Englan
d
White:
British/Irish
87.1% 65.2% 91.7% 90.6% 93.2% 84.6% 86.1% 80.7%
White: Other 5.1% 12.4% 4.3% 4.4% 3.6% 6.3% 4.6% 4.7%
Mixed 1.8% 4.0% 1.3% 1.3% 1.2% 2.0% 1.9% 2.3%
Asian 4.3% 12.4% 1.8% 2.4% 1.4% 4.8% 5.2% 7.8%
Black 1.4% 4.6% 0.6% 1.0% 0.4% 1.7% 1.6% 3.5%
Other ethnic
group
0.4% 1.4% 0.2% 0.3% 0.2% 0.5% 0.6% 1.0%
Total 100.0% 100.0% 100.0% 100.0% 100.0% 100.0% 100.0% 100.0%
Total population 141,868 151,906 134,257 120,988 104,779 653,798 8,634,750 53,012,456
% non-White
(British/Irish)
12.9% 34.8% 8.3% 9.4% 6.8% 15.4% 13.9% 19.3%
Source: ONS (2011 Census)
Since 2001 the BME population in the County can be seen to have increased significantly as shown 8.54
in the figure below. The data shows that the overall population of Oxfordshire has risen by about
48,000 over the 10-year period with the White: British/Irish population making up just 1,000 of this
increase.
Looking at particular BME groups we see that the largest rise in terms of population has been for 8.55
the Asian population – increasing by 17,300 over the ten years. The White: Other population has
increased by a similar amount (17,000 more people).
Changes in the BME population 2001 to 2011 - Oxfordshire Figure 66:
995
16,965
6,130
17,328
6,422
470
0
2,000
4,000
6,000
8,000
10,000
12,000
14,000
16,000
18,000
20,000
White -
British/Irish
White - Other Mixed Asian Black Other
Cha
nge
in p
opul
atio
n by
eth
nic
grou
p (2
001-
2011
)
Source: Census 2001 and 2011

Oxfordshire Strategic Housing Market Assessment: April 2014
GL Hearn Page 154 of 188
J:\Planning\Job Files\J029822 - Oxfordshire SHMA\Reports\Final SHMA Report (11.04.14).docx
BME Household Characteristics
Census data can also be used to provide some broad information about the household and housing 8.56
characteristics of the BME population in the County. The figures below look at the household
composition of six broad groups in the County using data from the 2011 Census.
The age profile of the BME population is striking when compared with White: British/Irish people (as 8.57
shown in the figure below). All BME groups are considerably younger than the White (British/Irish)
group with people from a Mixed background being particularly likely to be aged under 15 when
compared with any other group. The proportions of older persons are also notable with 24.4% of
White; British/Irish people being age 60 or over compared with all BME groups showing proportions
of 8.4% or less
Population Age Profile (2011) Figure 67:
Source: Census (2011)
We have used 2011 Census data to provide an indication of the characteristics of BME households. 8.58
Table 79 below shows estimates of the number of households in each BME group. Whilst the data
broadly follows patterns for population it is notable that BME households make up a lower
proportion of total households when compared with population proportions. This suggests higher
average household sizes for most BME groups (as shown in the last column of the table).
17.5%
19.7%
23.3%
21.0%
45.5%
13.3%
16.8%
20.9%
30.7%
25.6%
32.0%
28.6%
31.5%
19.2%
20.7%
29.7%
29.2%
29.2%
14.9%
33.1%
19.2%
19.2%
13.6%
15.1%
11.9%
7.5%
13.7%
20.4%
14.1%
5.1%
4.8%
4.6%
2.6%
6.0%
15.8%
7.5%
1.3%
2.0%
1.3%
0.9%
2.4%
8.6%
0% 10% 20% 30% 40% 50% 60% 70% 80% 90% 100%
County
Other
Black
Asian
Mixed
White: Other
White: British/Irish
Under 15 15-29 30-44 45-59 60-74 75 and over

Oxfordshire Strategic Housing Market Assessment: April 2014
GL Hearn Page 155 of 188
J:\Planning\Job Files\J029822 - Oxfordshire SHMA\Reports\Final SHMA Report (11.04.14).docx
Number of Households by Ethnic Group (2011) and Average Household Size Table 79:
Ethnic Group Population Households Average
hh size No. % No. %
White: British/Irish 553,092 84.6% 227,484 87.9% 2.43
White: Other White 40,912 6.3% 14,699 5.7% 2.78
Mixed 13,233 2.0% 2,564 1.0% 5.16
Asian 31,657 4.8% 8,705 3.4% 3.64
Black 11,424 1.7% 4,198 1.6% 2.72
Other ethnic group 3,480 0.5% 1,205 0.5% 2.89
Total 653,798 100.0% 258,855 100.0% 2.53
Source: Census (2011)
Figure 68 shows the tenure split of households in each of six broad ethnic groups. The data shows 8.59
that White (British/Irish) households are the most likely to be owner-occupiers with no mortgage
(and owner-occupiers more generally). Black households show high proportions living in social
rented housing whilst all BME groups are more likely than average to live in the private rented
sector. Levels of outright ownership amongst BME households are very low.
Tenure by Ethnic Group - Oxfordshire Figure 68:
34.7%
16.5% 13.0% 15.4%7.7%
13.9%
35.2%
23.5% 30.0%
37.6%
23.2%
23.9%
14.4%
6.9%
22.2%11.3%
32.2% 14.4%
11.9%
47.2%
29.5% 30.1% 31.0%
40.4%
3.7% 5.9% 5.2% 5.6% 5.9% 7.5%
0%
10%
20%
30%
40%
50%
60%
70%
80%
90%
100%
White British/Irish White Other Mixed Asian Black Other
% o
f hou
seho
lds
in g
roup
Owner-occupied (no mortgage) Owner-occupied (with mortgage) Social rented Private rented Other
Source: 2011 Census
Figure 69 shows ‘occupancy ratings’ by BME group; this is based on the bedroom standard where a 8.60
positive figure indicates under-occupancy and negative figures suggest some degree of over-
crowding. The data clearly shows that all BME groups are more likely to be overcrowded (i.e. have
a negative occupancy rating) than White (British/Irish) households. In particular, the Census data
suggests that 15% of Asian households are overcrowded - this compares with only 2.4% of the
White (British/Irish) group. Levels of under-occupation are also very low amongst BME groups.

Oxfordshire Strategic Housing Market Assessment: April 2014
GL Hearn Page 156 of 188
J:\Planning\Job Files\J029822 - Oxfordshire SHMA\Reports\Final SHMA Report (11.04.14).docx
Occupancy Rating by Ethnic Group - Oxfordshire Figure 69:
42.8%
27.1% 27.1%21.9%
17.2% 21.5%
33.3%
32.1% 30.9%
28.7%28.5%
32.7%
21.5%
33.9% 35.5%
34.5% 42.5%
37.4%
2.4%6.9% 6.4%
14.8% 11.9% 8.4%
0%
10%
20%
30%
40%
50%
60%
70%
80%
90%
100%
White British/Irish White Other Mixed Asian Black Other
% o
f hou
seho
lds
in g
roup
+2 or more +1 0 -1 or less
Source: 2011 Census
BME Conclusions
The BME population in Oxfordshire has grown strongly since 2001. The 2011 Census shows that 8.61
BME groups make up 15% of the County’s population (up from 9% in 2001). The Asian and White:
Other populations (which includes Eastern European migrants) have both grown notably.
BME households appear to be typically younger and less likely to be owner occupiers than the 8.62
White (British/Irish) population; there is also a greater reliance on the private rented sector. BME
households are also more likely to be overcrowded and less likely to under-occupy dwellings.
The implications of this are more for housing strategy than planning, and suggest a need to 8.63
consider particularly how the needs of different groups are met within the local housing market, to
explore the reasons for higher levels of overcrowding in BME communities and how this can be
addressed. It will also be important to consider the role which the Private Rented Sector plays in
meeting needs of new migrant communities and the standards of housing in this sector.
Investigating these issues in greater detail may assist development of strategic housing policies.
Households with Children (Family Households)
The number of families in Oxfordshire (defined for the purpose of this assessment as any 8.64
household which contains at least one dependent child) currently totals 75,920 accounting for
29.3% of households. A demographic projection linked to the midpoint housing need (for 5,003
units per annum) suggests that the number of children (aged Under 15) is expected to increase
markedly from 2011 to 2031 (an increase of around 38,300 – 33%).

Oxfordshire Strategic Housing Market Assessment: April 2014
GL Hearn Page 157 of 188
J:\Planning\Job Files\J029822 - Oxfordshire SHMA\Reports\Final SHMA Report (11.04.14).docx
Households with Dependent Children (2011) Table 80:
Household type Number %
Married couple 46,781 18.1%
Cohabiting couple 9,268 3.6%
Lone parent 14,257 5.5%
Other households 5,614 2.2%
All other households (no dependent children) 182,935 70.7%
Total 258,855 100.0%
Total with dependent children 75,920 29.3%
Source: ONS (2011 Census)
Figure 70 below shows the current tenure of households with dependent children. There are some 8.65
considerable differences by household type with lone parents having a very high proportion living in
the social rented sector and also in private rented accommodation. Around 35% of lone parent
households are owner-occupiers compared with 75% of married couples with children.
Tenure of Households with Dependent Children - Oxfordshire Figure 70:
Source: 2011 Census
Overcrowding is often a key theme when looking at the housing needs of households with children 8.66
and the figure below shows that households with children are about four times more likely than
other households to be overcrowded. In total, some 6.8% of all households with dependent children
are overcrowded and included within this the data shows 9% of lone parent households are
overcrowded along with 30% of ‘other’ households with dependent children. Other than for married
couple households levels of under-occupancy are also very low.
11.9% 6.0% 8.1%
16.2%
41.2% 32.3%
10.8%
63.5%
46.2%
27.3%
44.1%
26.6% 34.4%
53.1%
8.1%
25.0%
39.2%
16.7% 13.2% 14.2% 16.6%
15.4% 21.8% 24.3% 21.8% 17.1% 17.5% 18.3%
1.3% 0.9% 1.2% 1.2% 1.9% 1.7% 1.2%
0%
10%
20%
30%
40%
50%
60%
70%
80%
90%
100%
Married couple Cohabitingcouple
Lone parent Otherhouseholds
All otherhouseholds (no
dependentchildren)
All households All householdswith dependent
children
% o
f hou
seho
lds
in g
roup
Owner-occupied (no mortgage) Owner-occupied (with mortgage) Social rented Private rented Other

Oxfordshire Strategic Housing Market Assessment: April 2014
GL Hearn Page 158 of 188
J:\Planning\Job Files\J029822 - Oxfordshire SHMA\Reports\Final SHMA Report (11.04.14).docx
Occupancy Rating and Households with Dependent Children Figure 71:
Source: 2011 Census data (from NOMIS)
Households with Children - Conclusions
Overall, the somewhat limited data available about family households suggests that this group may 8.67
be quite polarised. Whilst married couple households have high levels of owner-occupation and
may well be slightly better off than the general population the data does point to lone parent (and
other) households being more disadvantaged. Given that households with children should be seen
as a priority for the Councils this points towards ensuring that the housing offer meets the needs of
such households and in particular the need to ensure a reasonable quality of housing in the private
rented sector.
Young people
Providing for the needs of younger person households is an important consideration for the 8.68
Councils. Given ageing populations the ability to retain young people in an area can assist in
providing a more balanced demographic profile as well as providing a vital part of the local
workforce. Young people may however find barriers to accessing housing given typically low
incomes and potential difficulties in securing mortgage finance due to deposit requirements.
The demographic projections suggest that in 2011 there were around 45,000 households headed 8.69
by someone aged under 35 and that this is set to increase by around 9,800 over the period from
2011 to 2031 (based on a midpoint demographic projection linked to delivery of 5,003 homes per
annum across the County).
As well as households headed by a younger person there will be others living as part of another 8.70
household (typically with parents). The table below shows the number of households in the County
29.6%
12.7% 9.7% 11.8%
48.0% 40.5%
22.5%
41.4%
38.2% 32.2%
21.8%
30.9% 33.0%
37.9%
25.4%
42.3% 49.3%
36.9%
19.3% 23.2%
32.8%
3.5% 6.8% 8.8%
29.5%
1.8% 3.3% 6.8%
0%
10%
20%
30%
40%
50%
60%
70%
80%
90%
100%
Married couple Cohabitingcouple
Lone parent Otherhouseholds
All otherhouseholds (no
dependentchildren)
All households All householdswith dependent
children
% o
f hou
seho
lds
in g
roup
+2 or more +1 0 -1 or less

Oxfordshire Strategic Housing Market Assessment: April 2014
GL Hearn Page 159 of 188
J:\Planning\Job Files\J029822 - Oxfordshire SHMA\Reports\Final SHMA Report (11.04.14).docx
with non-dependent children. In total, some 9% of households (23,100) contain non-dependent
children. This may to some degree highlight the difficulties faced by young people in accessing
housing. Ineligibility for social housing, lower household incomes and the unaffordability of owner
occupation for such age groups all contribute to the current trend for young people moving in with or
continuing to live with parents.
Households with non-dependent children (2011) Table 81:
Household type Number %
Married couple 14,420 5.6%
Cohabiting couple 1,121 0.4%
Lone parent 7,517 2.9%
All other households 235,797 91.1%
Total 258,855 100.0%
Total with non-dependent
children
23,058 8.9%
Source: ONS (2011 Census)
Moving back to study households that are currently headed by a younger person (taken for this 8.71
analysis as being aged under 34) we can use Census data to look at some key characteristics. The
figure below shows the tenure groups of these households (compared with other age groups). The
data clearly shows that very few younger households are owner-occupiers with a particular reliance
on the private rented sector and to a lesser degree social rented housing.
Tenure by Age of HRP - Oxfordshire Figure 72:
3.8% 4.1%10.3%
38.1%
70.2% 72.9%66.8%
32.3%
8.7%
33.6%
55.5%
39.9%
9.9% 5.2%4.5%
34.4%
24.3%
15.1%
13.1%
12.1%14.2% 16.7%
20.5%
14.2%
55.2%
39.3%
16.8%
7.6% 3.8% 2.6%2.8%
15.2%
8.0% 7.9% 4.2% 2.4% 1.8% 2.6% 5.3% 4.0%
0%
10%
20%
30%
40%
50%
60%
70%
80%
90%
100%
Age 24 and
under
Age 25 to 34 Age 35 to 49 Age 50 to 64 Age 65 to 74 Age 75 to 84 Age 85 and
over
All
households
% o
f hou
seho
lds
in g
roup
Owner-occupied (no mortgage) Owner-occupied (with mortgage) Social rented Private rented Other
Source: 2011 Census

Oxfordshire Strategic Housing Market Assessment: April 2014
GL Hearn Page 160 of 188
J:\Planning\Job Files\J029822 - Oxfordshire SHMA\Reports\Final SHMA Report (11.04.14).docx
Census data can also be used to look at economic activity rates; including employment and 8.72
unemployment levels. Data about this is shown in the table below (again based on the head of
household/household reference person age). The data shows that whilst the vast majority of HRPs
aged 16 to 34 are in employment there are a notable proportion unemployed or not economically
active. A total of 3.2% of HRPs aged 16-34 are unemployed compared with a County-wide figure of
just 1.7%.
The figure however does not tell the full story around unemployment as the data is based on people 8.73
who are already living in their own household (or in this case are considered as the HRP or head of
household). Additional Census data shows that of the population aged 16-24 who are economically
active some 12% are unemployed.
Economic activity by age of HRP - Oxfordshire Figure 73:
84.9%92.7%
85.3%
18.2%
70.2%
3.2%
2.2%
1.8%
1.7%
4.7%0.4%
0.1%
1.0%
7.1% 4.7%12.7%
81.5%
27.1%
0%
10%
20%
30%
40%
50%
60%
70%
80%
90%
100%
Age 16 to 34 Age 35 to 49 Age 50 to 64 Age 65 and over All households
% o
f hou
seho
lds
in g
roup
Working Unemployed Student Other
Source: 2011 Census
Young People - Conclusions
Analysis of younger person households shows a high reliance on rented housing. Younger age 8.74
cohorts may therefore be forced into private rented (including shared) housing as the only means of
meeting their housing needs, aside from residing with parents, where they would not form a head of
household. Factors such as a balanced approach to housing in terms of bedroom sizes and
property types, along with high standards for Houses in Multiple Occupation (HMOs) will help
younger households to access housing.

Oxfordshire Strategic Housing Market Assessment: April 2014
GL Hearn Page 161 of 188
J:\Planning\Job Files\J029822 - Oxfordshire SHMA\Reports\Final SHMA Report (11.04.14).docx
Self- and Custom-Build
SHMAs need to investigate the contribution that self-build makes toward the local supply. It is 8.75
referred to in the NPPF and in ‘Laying the Foundations – a Housing Strategy for England 2010’.
The strategy states that only one in 10 new homes in Britain was self-built in 2010 that the barriers
for the sector to grow are lack of land, limited finance and mortgage products, restrictive regulation
and a lack of impartial information for potential custom home builders. However the Government
aspires to make self-build a ‘mainstream housing option’ by making funding available to support
self-builders and by asking local authorities to champion the sector. Up to £30m of funding has
been made available via the Custom Build programme administered by the HCA to provide short-
term project finance to help unlock group custom build or self-build schemes. The fund can be used
to cover eligible costs such as land acquisition, site preparation, infrastructure, S106 planning
obligations etc.
Recent research into the self-build market is limited. The Joseph Rowntree Foundation report ‘The 8.76
current state of the self-build housing market (2001)’. However market conditions have changed
since then and government schemes such as help to buy and increased competition amongst
house-builders has arguably removed some of the motivation from potential self-builders.
Interestingly, the media has focussed on custom build. We are aware of many popular radio and TV 8.77
programmes that have made case studies of custom build projects. The genre is also significant
from an investment point of view given that there have been very poor returns on personal or
business deposits since 2008.
Since the publication of the NPPF we have carried out bespoke qualitative research into self-build 8.78
as part of our SHMA methodology. We have sought information from local authority planning
departments; estate agents, the internet and a small number of self-builders. We have adopted a
wide definition of self-build and conclude that the term ‘custom build’ is probably a better description
of the sector. This is because the initiator can be involved in construction, produce or project
manage the project or simply commission a project for professionals and house builders to deliver.
The initiator may not be the occupier, seeing the project as an investment for sale or rent.
Quantitative information is hard to come by. Planning officers are not required to keep records as 8.79
and frequently draw our attention to the fact that a custom build classification is not included on the
national 1APP planning forms and/or the building regulations forms. Information from local authority
planning officers is therefore anecdotal. Most officers tell us that activity as a percentage of
completions is low, ranging from ‘next to nothing’ to 10% although most say that the level is under
5%. The evidence from our discussions with officers at the Oxfordshire authorities confirms this.
They tell us that dwellings can have design merit but can require more input from planning and

Oxfordshire Strategic Housing Market Assessment: April 2014
GL Hearn Page 162 of 188
J:\Planning\Job Files\J029822 - Oxfordshire SHMA\Reports\Final SHMA Report (11.04.14).docx
building control officers. Two local authorities have told us about estate level self-build schemes
completed in the 1980’s where the local authority made serviced land available. We were told in
one case that the project resulted in an ‘an eclectic mix’ of dwellings being built. Officers also refer
to the construction of annexes. These will be standalone self-contained dwellings and are often
constructed for employees or family members some of whom may be frail or disabled in some way.
Planning officers told us that planning conditions are mostly applied to ensure that occupancy is
connected to the main dwelling in some way.
Estate agents tell us that they are frequently involved in valuations where there is potential for 8.80
‘intensification’, for example the potential for constructing dwellings on large gardens or corner plots.
Local planning policy may be adopted to restrict this if it is considered that an area is in danger of
being over developed. Lack of open space and problematic car parking and infrastructure capacity
have been cited as considerations. Agents involved in the re-sale of custom built housing tell us that
they rarely encounter problems with lenders as surveyors are always involved in the process.
Estate agents tell us that older low density estates can attract custom builders. They have cited
areas where small low value dwellings on large plots have been demolished and new dwellings
established. They tell us that custom build tends to occur mostly in areas that are becoming
fashionable, within rural settlements and in coastal areas and some will be second homes.
Whilst most new housing is constructed by the volume house builders we have come across many 8.81
local house builders who develop small plots for individual clients – many for the rental market.
Landlords have told us that this is a more cost effective route than purchasing off volume builders.
Some landlords generate significant cash surpluses from their portfolio and choose to invest in this
way as returns are more attractive than other investments.
At the other end of the scale we have interviewed entrepreneurs and individuals with large savings 8.82
who will use their local knowledge and skill to acquire individual vacant plots and custom build. Two
such entrepreneurs we came across were planning to use the dwelling in the tourist rather than
residential sector. We have also come across a medium size regional house builder whose key
selling point is that he will customise his products for the purchaser and was offering dwellings
within the Help to Buy scheme.
Finally we have reviewed a number of websites dedicated to advising and assisting people to self-8.83
build. Some assist in the brokerage of individual building plots and this is part of our SHMA
information gathering.
Overall the evidence we have collected across England, and looking more specifically at 8.84
Oxfordshire, suggest that this is a niche sector, but one that is not necessarily only delivering high
value bespoke homes. It is clear that much activity is undertaken by entrepreneurs aimed at more

Oxfordshire Strategic Housing Market Assessment: April 2014
GL Hearn Page 163 of 188
J:\Planning\Job Files\J029822 - Oxfordshire SHMA\Reports\Final SHMA Report (11.04.14).docx
modest homes for sale or rent and in doing so making better use of land that may detract from the
local environment. It is also clear that the role of a local champion for the sector is a step that needs
to be taken if further interest is to be generated. It is noteworthy that all of the examples of custom
build we have come across have been commissioned by individuals or entrepreneurs with savings,
rather than borrowings. These points will need to be addressed if custom build is to become ‘a
mainstream option’.
In policy terms there is some potential to encourage through policy developers of larger schemes to 8.85
designate parts of these scheme as serviced plots which can be developed as self-build. There is
some, albeit limited evidence of this. It is difficult to demonstrate concrete evidence of demand.
Student Population Growth and Accommodation Needs
Understanding student housing demand in Oxfordshire and its impact on the overall housing market 8.86
is an important part of this SHMA. In doing so we have drawn on existing studies and data,
supplemented by stakeholder consultation.
The key issues which need to be understood are: 8.87
Expected growth in student numbers (overall and relative to past trends); and
The balance between development of this and new student bedspaces.
Understanding this will allow to consider the implications of students on the private rented sector 8.88
and the wider housing market.
Student Numbers
Figure 74 below shows the increase of the number of students at Oxford University and Oxford 8.89
Brookes University between 2002/3 – 2011/12 rising from approximately 41,500 students to 44,015
(an increase of 6%). The increase in student numbers over this period has been much more
pronounced in Oxford University (increasing by 11% to over 25,500 in 2011/12) than Oxford
Brookes University where the student numbers have been broadly stable (18, 425 in 2011/12).

Oxfordshire Strategic Housing Market Assessment: April 2014
GL Hearn Page 164 of 188
J:\Planning\Job Files\J029822 - Oxfordshire SHMA\Reports\Final SHMA Report (11.04.14).docx
Total Student Numbers 2002/3 – 2011/12 Figure 74:
Source: Higher Education Statistics Agency
There has been an increase in full time students (15%) since 2002/3 whilst the number of part time 8.90
students has decreased (-6%).
At the University of Oxford, the number of full time (14%) and part time students (5%) has increased 8.91
over the decade to 2012. At Oxford Brookes, the increase in full- time students has been slightly
higher (16%) but there has been a fairly significant decrease in the number of part time students (-
28%).
The higher education sector has been turbulent over the past year with university fee increases 8.92
from September 2012. It is currently unclear what the impact of this will be on student numbers,
albeit that we would expect Oxford University in particular to be less impacted than other UK higher
education institutions.
Over the decade to 2012, Oxford University saw a small increase in the number of UK students 8.93
(3%) and saw the percentage of EU and Non EU students increase by over a third (55% and 36%
respectively). Oxford Brookes, on the other hand, saw decreases in the UK (-1%) and non EU
population (-6%) with an increase in the EU population 27%.
The overall increase in EU and non–EU students in Oxford reflects the high calibre University which 8.94
attracts students from all over the world.
0
5000
10000
15000
20000
25000
30000
20
02/3
20
03/4
20
04/5
20
05/6
20
06/7
20
07/8
20
08/9
20
09/1
0
20
10/1
1
20
11/1
2
Nu
mb
er
of
Stu
den
ts
Oxford University
Oxford Brookes University

Oxfordshire Strategic Housing Market Assessment: April 2014
GL Hearn Page 165 of 188
J:\Planning\Job Files\J029822 - Oxfordshire SHMA\Reports\Final SHMA Report (11.04.14).docx
UK, EU and Non- Student Numbers 2002/3 – 2011/12 Figure 75:
Source: Higher Education Statistics Agency
Student Accommodation
In 2008, a study entitled The Economic Role of the Higher Education, Health and Health Retail 8.95
Sectors in the Oxford Economy written by NLP concluded that the space requirements of core
academic and research activities could largely be accommodated on established or committed
university sites, but sites may be needed for student accommodation.
The number of student accommodation units in halls of residence can be shown in Table 82 8.96
below.24
It is clear from this table that the number of student accommodation units has risen for both
Universities since 1998. Despite the increase in student accommodation provision, the vacancy rate
of student accommodation for both universities is thought to be low.
24
Student Numbers in Oxford Paper April, Tim Sadler (2012)
0
5000
10000
15000
20000
25000
30000
35000
40000
20
02/3
20
03/4
20
04/5
20
05/6
20
06/7
20
07/8
20
08/9
20
09/1
0
20
10/1
1
20
11/1
2
Nu
mb
er
of
Stu
den
ts
UK
EU
Non EU

Oxfordshire Strategic Housing Market Assessment: April 2014
GL Hearn Page 166 of 188
J:\Planning\Job Files\J029822 - Oxfordshire SHMA\Reports\Final SHMA Report (11.04.14).docx
Student Bedspaces in Halls of Residence Table 82:
Year Oxford University Oxford Brookes University
1998 /99 13, 091 N / A
2000 N / A 2, 928
2004 /5 13, 650 3, 784
2005/ 6 13, 863 3, 639
2006/ 7 13, 799 3, 639
2007/ 8 13, 799 3, 742
2008/ 9 13, 720 3, 674
2009/ 10 14, 058 3, 516
2010/ 11 13, 852 4, 094
Source: Oxford City Council Annual Monitoring Reports Cited in Student Numbers in Oxford Paper
(2012)
Encouraging the universities to develop new purpose-built halls of residence to reduce the impact of 8.97
students on the private rented market has been a long-standing policy of Oxford City Council. Both
universities have undertaken a considerable development programme in recent decades; however
part of this has been for replacement of sub-standard provision.
In addition to spaces in halls, Oxford Brookes University has housed approximately 400 students in 8.98
its Head Lease Scheme, whereby the University rents properties from private landlords.
Some students however live in the Private Rented Sector, the majority in Houses in Multiple 8.99
Occupation (HMOs).
Oxford City Council has agreed with each of the universities that the number of students living in 8.100
the City outside of University-provided accommodation should be limited to 3,000; and that no
increase in university academic floorspace would be allowed if this level is exceeded.
As at December 2012, there were an estimated 3,508 Oxford University students living outside of 8.101
University accommodation. The University had an additional 542 bedspaces under construction.
For Oxford Brookes University, there were an estimated 3,836 students living outside of University
accommodation.
Looking outside of purpose built student accommodation; a 2012 paper found that 50% of Houses 8.102
in Multiple Occupation (HMOs) in the City are occupied by students from the University of Oxford
and University of Oxford Brookes.

Oxfordshire Strategic Housing Market Assessment: April 2014
GL Hearn Page 167 of 188
J:\Planning\Job Files\J029822 - Oxfordshire SHMA\Reports\Final SHMA Report (11.04.14).docx
University Past and Future Growth
Oxford University
The University of Oxford has grown (in terms of space) significantly over the past decade. In 2008, 8.103
a report by NLP25
stated that the size of the estate had increased by 34% over the past 10 years.
Looking forward, the development of science and other facilities are due to be developed in areas
including the former Radford Infirmary site and the Science area (South Parks Road). In addition,
colleges may apply for redevelopment / expansions.
Despite the potential for expansion of the University, The University plans to have a policy of a 8.104
“19,400 celling” on full-time students. Within this, the proportion of post graduate students looks
likely to increase more than the proportion of post graduates.26
This was confirmed by a
conversation with The University of Oxford, which indicates that overall future student numbers are
not anticipated to increase looking forward. It follows that whilst there may be some refurbishment
of existing accommodation, no large student residential schemes are planned over the next few
years. Instead, student growth will be static or may increase incrementally.
Indeed, the only area that the University foresee growth in is associated with research (e.g. post-8.105
doctoral researchers working in experimental sciences). Growth is envisaged in this area, with
plans for creation of 1,000 new research posts. This will create additional demand for housing.
The University expressed concern about the lack of suitable housing for these researchers and 8.106
those working in university departments (e.g. the University Press and other University departments
employ over 10,000 people). The University and colleges already subsidise housing through low
interest mortgages and subsidised rents; and have expressed concern regarding the impact of high
housing costs on their ability to attract and retain academics and support staff. The University
stressed that many of these employees and researchers are on modest incomes and that high
housing and transport costs are problematic. It was thought that the lack of housing and suitable
accommodation is more acute for older students (in their mid to late 20s), such as post graduate
students, rather than undergraduate students.
The University also mentioned the restriction of Policy CS25 in the adopted Oxford Core Strategy 8.107
and touched on how the policy caps the number of students in the private rented sector at 3,000.
Oxford City Council has suggested that the University may follow the example of a number of 8.108
American universities and Cambridge University, and develop its own housing directly.
25
The Economic Role of the Higher Education, Health and Retail Sectors in the Oxford Economy, NLP (2008) 26
Student Numbers in Oxford Paper April, Tim Sadler (2012)

Oxfordshire Strategic Housing Market Assessment: April 2014
GL Hearn Page 168 of 188
J:\Planning\Job Files\J029822 - Oxfordshire SHMA\Reports\Final SHMA Report (11.04.14).docx
Oxford Brookes University
The Headington campus at Oxford Brookes University grew in the 1990s. In the University’s ‘Our 8.109
Strategy for 2020’2728
and ‘Our Year Ahead’ shows that Oxford Brookes in keen to expand further
and improve its estate. For example, the University plans: to undertake essential works to Gypsy
Lane.
A conversation with Oxford Brookes University showed that steady student growth is predicted 8.110
looking forward. It is hoped the current number of students will be retained, rather than increase or
decrease over the next few years. The University mentioned its partner colleges e.g. Solihull
College may see increases in student numbers (possibly resulting in a slight decrease in the
number of students at the University of Oxford Brookes) but this would not be significant.
Linked to the stable number of students looking forward, The University of Oxford Brookes does not 8.111
have plans for the development of new halls. The University instead plans to manage and improve
its existing accommodation. For example, the University said that there will be re-development of
rooms at Harcourt Hill. It expects to move the residential element of its Wheatley campus in South
Oxfordshire to Gypsy Lane in Oxford.
The University said that they were not expecting to have voids over the next few years. The 8.112
University mentioned the policy restricting the number of students in the community to 3, 000. In the
last academic year (2012/13) the university had just over 2,800 students looking for a place of
residence outside of University accommodation. Looking forward, the university plans to ensure that
the number of students in the community remain below 3, 000.
The University does not anticipate significant increases in the number of students living at home to 8.113
save money as a result of the rise in tuition fees. It was thought that a movement of students living
at home with their parents was more likely to be seen in major conurbations and cities e.g.
Birmingham / Manchester rather than in Oxfordshire. However, it was noted that it is difficult to
predict such changes.
Other Students
Other than the two universities, there are a number of language and business schools in Oxford 8.114
which attract students to the City. The daily info website lists 48 English language schools in Oxford
City, including some which offer wider tutoring. There are other institutions in addition to these
providing business-focused skills and training, including Oxford Media and Business School and
27
Student Numbers in Oxford Paper April, Tim Sadler (2012) 28
http://www.brookes.ac.uk/about-brookes/strategy-2020/our-strategy-for-2020/

Oxfordshire Strategic Housing Market Assessment: April 2014
GL Hearn Page 169 of 188
J:\Planning\Job Files\J029822 - Oxfordshire SHMA\Reports\Final SHMA Report (11.04.14).docx
Oxford Business College, as well as wider vocational and further education courses. The latter
includes Oxford College, the City of Oxford College.
This segment of the education sector is likely to have some impact on the housing market as well, 8.115
particularly in creating demand for private rented accommodation (including HMOs) given the
flexible and short-term tenancies which some students might seek.
Conclusions on Student Needs
The policy framework restricting the scale of students living outside of University accommodation is 8.116
likely to moderate the impact of changes in student numbers on the housing market. The University
of Oxford’s proposals for growth – particularly in the STEM subjects and medical sciences –
however may create an additional 1,200 jobs and 1,000 post graduate student places. Whilst some
may live in student accommodation, the post graduate students may be more likely to exercise
choice in the wider housing market. Some may for instance move with their families. This may have
some impact on the housing market locally (and has been considered through the economic-driven
projections).
Growth in student numbers from the two universities is likely to be controlled through the cap put in 8.117
place through the Oxford Core Strategy which seeks to manage delivery of additional academic
floorspace and student accommodation. However additional growth in non-university education
could feasibly create additional demand pressures particularly within the private rented sector. The
number of language schools and other institutions however makes it difficult to accurately judge and
quantify the potential scale of impact. This may be an area in which the Council could consider
further specific research.

Oxfordshire Strategic Housing Market Assessment: April 2014
GL Hearn Page 170 of 188
J:\Planning\Job Files\J029822 - Oxfordshire SHMA\Reports\Final SHMA Report (11.04.14).docx

Oxfordshire Strategic Housing Market Assessment: April 2014
GL Hearn Page 171 of 188
J:\Planning\Job Files\J029822 - Oxfordshire SHMA\Reports\Final SHMA Report (11.04.14).docx
9 CONCLUSIONS
In this final section of the report we draw together the preceeding analysis to identify the key 9.1
conclusions of the SHMA. The SHMA responds to the requirements of the National Planning Policy
Framework (NPPF), and is particularly focused on considering three questions:
How many homes might need to be developed in the future;
What mix of homes is needed;
What housing might be needed to meet the needs of specific groups within the population.
The Oxfordshire HMA
The SHMA identifies an Oxford-focused Housing Market Area which extends across much of the 9.2
County, reflecting the economic influence of the City. The county still remains the most appropriate
geography for analysis of housing markets in terms of the ‘best fit’ of local authority boundaries to a
functional housing market area. It is thus appropriate for the Oxfordshire authorities to collaborate in
the development of an SHMA which aligns to the County geography.
However there are links, in housing market and economic terms, between parts of Oxfordshire and 9.3
surrounding areas, including major employment centres close to the county’s boundaries,
particularly Reading (the influence of which tends into South Oxfordshire including Henley-on-
Thames) and Swindon (the influence of which extends into the Vale of White Horse). In the north of
the county, the economic and housing market influence of Banbury and Bicester extend into South
Northamptonshire and Aylesbury Vale respectively.
How many homes might be needed?
The NPPF sets out that plans should be based on meeting the full need for market and affordable 9.4
housing where it is sustainable to do so. Paragraph 159 is clear that demographic projections,
affordable housing need and market signals are all relevant in identifying the need for housing.
Latest National Household Projections
The Planning Practice Guidance sets out that the latest national household projections should be 9.5
seen as a starting point for considering housing need. It sets out that these are statistically robust
and based on nationally consistent assumptions.
The CLG 2011-based Household Projections indicate a net increase of 18,250 households between 9.6
2011-21, representing a 7.0% increase in households. This is notably below the average growth
expected in the South East (10.8%) and nationally (10%). The lower level of growth is mainly due to
a negative figure for projected household growth in Oxford, although growth in South Oxfordshire

Oxfordshire Strategic Housing Market Assessment: April 2014
GL Hearn Page 172 of 188
J:\Planning\Job Files\J029822 - Oxfordshire SHMA\Reports\Final SHMA Report (11.04.14).docx
and to a lesser extent Vale of White Horse is also low set against the wider market evidence and
regional/ national projections. It is clear that the figures for Oxford are not realistic. In contrast the
projections for West Oxfordshire are above the regional and national averages and correlate with
stronger (above target) housing delivery over the 2005-10 period.
Projected Household Growth 2011-21 – CLG 2011-based Household Projections Table 83:
Area Households
2011
Households
2021
Change in
households
% change
from 2011
Cherwell 56,881 63,765 6,884 12.1%
Oxford 54,997 53,613 -1,384 -2.5%
South Oxfordshire 54,387 57,989 3,602 6.6%
Vale of White Horse 49,781 53,656 3,875 7.8%
West Oxfordshire 43,510 48,784 5,274 12.1%
Oxfordshire 259,556 277,807 18,251 7.0%
Source: CLG 2011-based Household Projections
A further issue is that the 2011-based Household Projections only cover a ten year period to 2021. 9.7
The Planning Practice Guidance is clear that plan makers would need to assess likely trends after
2021 to align with development plan periods. However it also sets out that account should be taken
of the most recent demographic evidence.
Core Demographic Projections
The core demographic projections have been developed through a process of testing and updating 9.8
the CLG 2011-based Interim Household Projections, specifically:
Updating assumptions on future migration to take account of 2011 Census, ONS revisions’ to
population components of change data for the 2001-11 period, and 2012 Mid-Year Population
estimates;
Work with Oxford City Council to develop a bespoke projection for the City’s population, taking
account of the substantial under-recording of population growth in the City by ONS shown by
the 2011 Census. This has looked at detailed population change between 2001-11 by single
year of age and sex;
Remodelling headship rates based on constant headship rates (by age and sex) between
2011-31, as opposed to the 2011 based CLG projections which project reducing household
formation rates. This adjustment has effectively removed the trend towards further constraints
to household formation in the 2011-based Projections. Rates of household formation derived
from this analysis are close to tracking the trends in household size in the 2008-based
Household Projections.
These amendments ensure that an appropriate projection for population growth in Oxford is used 9.9
which is consistent to past trends, and that the recessionary impact in constraining household
formation is not projected forwards.
The outputs of these projections (shown in terms of annual need for housing over the 2011-31 9.10
period) are shown below:

Oxfordshire Strategic Housing Market Assessment: April 2014
GL Hearn Page 173 of 188
J:\Planning\Job Files\J029822 - Oxfordshire SHMA\Reports\Final SHMA Report (11.04.14).docx
Demographic Trend-based Projection to 2031 Table 84:
Households
2011
Households
2031
Change in
households
% change
from 2011
Housing
Requirement
Housing
Requirement
(per annum)
Cherwell 56,882 69,219 12,336 21.7% 12,830 641
Oxford 54,999 69,523 14,524 26.4% 15,105 755
South Oxfordshire 54,391 63,610 9,219 17.0% 9,634 482
Vale of White Horse 49,781 58,856 9,074 18.2% 9,365 468
West Oxfordshire 43,509 53,789 10,280 23.6% 10,815 541
Oxfordshire 259,562 314,996 55,434 21.4% 57,748 2,887
These projections indicate a need for almost 2,900 homes per year across Oxfordshire. This 9.11
represents the core demographic projection prepared.
For comparison purposes Table 85 below sets out the relevant national household projections (both 9.12
the 2008-based Household Projections and the 2011-based Interim Household Projections).
Comparison with National (CLG) Household Projections Table 85:
2008 CLG Household
Projections
2011 CLG Household
Projections
GLH Demographic-
based Projections
2011-31 2011-21 2011-31
Cherwell 671 688 617
Oxford 302 -138 726
South Oxfordshire 470 360 461
Vale of White Horse 412 388 465
West Oxfordshire 562 527 514
Oxfordshire 2416 1825 2772
For the Oxfordshire HMA, the core demographic projections indicate a level of housing need based 9.13
on the most recent demographic evidence which is 15% above the 2008-based CLG Household
Projections, and 52% above the 2011-based Household Projections (particularly as a result of the
issues with the projections for Oxford).
Taking account of Past Housing Delivery
The next step in deriving an assessment of housing need is to consider past housing delivery 9.14
against the South East Plan housing requirement, and to include provision to make good any past
shortfall at a local authority level where appropriate.
Making good a past shortfall in housing provision will support more affordable housing delivery and 9.15
workforce growth. It should similarly be recognised that a past shortfall in housing provision is likely

Oxfordshire Strategic Housing Market Assessment: April 2014
GL Hearn Page 174 of 188
J:\Planning\Job Files\J029822 - Oxfordshire SHMA\Reports\Final SHMA Report (11.04.14).docx
to have contributed to the affordable housing backlog (current need) and to the case and to market
signals pointing towards a need to increase housing supply.
Drawing this together with the demographic projections can be used to define a revised baseline for 9.16
future housing provision.
Including Provision for Past Housing Delivery Shortfall – Housing Need per Year Table 86:
2011-31
GLH Demographic-based
Projections, 2011-31 Past Shortfall
Revised Assessment of
Need (Demographic-
Driven)
2006-11 2011-31
Cherwell 12,830 808 13,638 (682 pa)
Oxford 15,105 52829
15,633 (782 pa)
South Oxfordshire 9,634 1398 11,032 (552 pa)
Vale of White Horse 9,365 801 10,166 (508 pa)
West Oxfordshire 10,815 0 10,815 (541 pa)
Oxfordshire 57,748 - 61,284 (3064 pa)
West Oxfordshire stands out as having delivered significantly higher housing provision relative to its 9.17
South East Plan targets over the 2006-11 period. It delivered almost 1,400 additional homes over
and above its housing target. This level of growth was a result of several urban extensions coming
forward at the same time, resulting in high levels of in-migration which have influenced household
projections moving forward. As such, the District Council may wish to further consider this in light of
the Planning Practice Guidance which highlights the need to consider previous over-supply as well
as under-supply. No adjustment to figures has been made at the SHMA, but there is potentially a
good basis for doing so with reference to previous household projections and needs’ assessments
alongside the South East Plan targets.
Overlaying Economic Performance
The Planning Practice Guidance sets out that plan makers should assess likely growth in job 9.18
numbers. Where labour supply is less than projected job growth, this could result in unsustainable
commuting patterns and could reduce the resilience of local businesses (depending on public
transport accessibility and other sustainable travel options).
Paragraph 158 in the NPPF sets out that evidence and strategies for housing and employment in 9.19
local plans should align with one another.
29
Including Strategic Development Area

Oxfordshire Strategic Housing Market Assessment: April 2014
GL Hearn Page 175 of 188
J:\Planning\Job Files\J029822 - Oxfordshire SHMA\Reports\Final SHMA Report (11.04.14).docx
The SHMA has considered two economic scenarios. The first (which we have called herein the 9.20
baseline scenario) considers a ‘business as usual’ case, with some adjustments to take of the
issues related to ONS Population Projections and the nature of the education sector in the County.
In both cases these have the effect of increasing projected employment growth.
Table 87 profiles these projections alongside the demographic projections considered above. 9.21
Overlaying the Baseline Scenario for Employment Growth – Housing Need, 2011-Table 87:
31
2011-31
Demographic-Based
Need
Demographic Need + Past
Shortfall
Meeting Alternative
Population Economic
Projection
2011-31 PA 2011-31 PA 2011-31 PA
Cherwell 12,830 642 13,638 682 14,862 743
Oxford 15,105 755 15,633 782 5,781 289
South Oxfordshire 9,634 482 11,032 552 13,105 655
Vale of White Horse 9,365 468 10,166 508 12,453 623
West Oxfordshire 10,815 541 10,815 541 11,794 590
Oxfordshire 57,748 2,887 61,284 3,064 57,996 2,900
The analysis shows that across the Oxfordshire HMA , an upwards adjustment to housing provision 9.22
would not be necessary to support the baseline scenario for employment growth.
Oxfordshire Local Enterprise Partnership’s Strategic Economic Plan does not however seek to plan 9.23
on a ‘business as usual’ basis, and indeed there are a significant number of economic investment
projects in the pipeline which mean that economic performance is likely to be stronger than that
indicated in the Baseline Scenario.
Key investment projects and sector growth opportunities have been considered in the development 9.24
of the Committed Economic Growth Scenario for employment growth. This has fed into both the
LEP’s Strategic Economic Plan and the SHMA.
The NPPF is clear (in Paragraph 158) that the evidence base and policies for housing and 9.25
employment should be aligned with one another.
To support the Committed Economic Growth Scenario, the SHMA indicates that provision of 4,280 9.26
homes per year over the period to 2031 would be needed. This is a significant 40% uplift on the
assessed housing need based on past demographic trends (with the inclusion of provision to
redress past shortfalls in housing delivery where applicable).
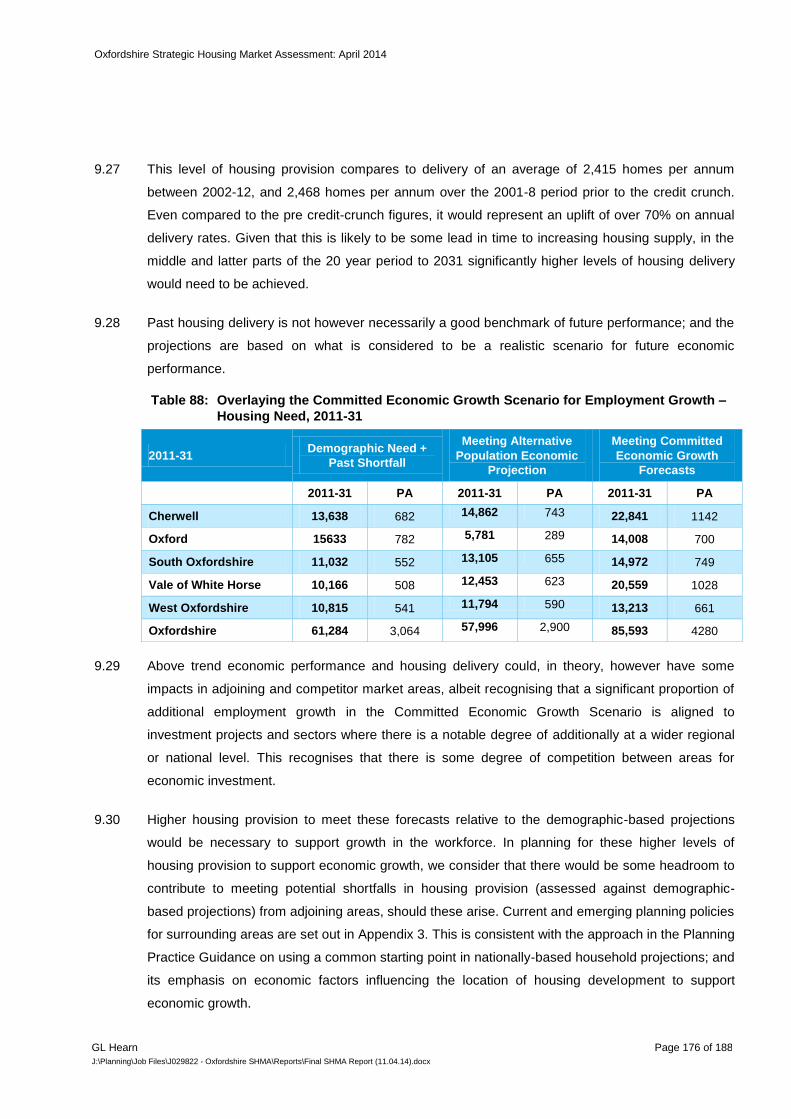
Oxfordshire Strategic Housing Market Assessment: April 2014
GL Hearn Page 176 of 188
J:\Planning\Job Files\J029822 - Oxfordshire SHMA\Reports\Final SHMA Report (11.04.14).docx
This level of housing provision compares to delivery of an average of 2,415 homes per annum 9.27
between 2002-12, and 2,468 homes per annum over the 2001-8 period prior to the credit crunch.
Even compared to the pre credit-crunch figures, it would represent an uplift of over 70% on annual
delivery rates. Given that this is likely to be some lead in time to increasing housing supply, in the
middle and latter parts of the 20 year period to 2031 significantly higher levels of housing delivery
would need to be achieved.
Past housing delivery is not however necessarily a good benchmark of future performance; and the 9.28
projections are based on what is considered to be a realistic scenario for future economic
performance.
Overlaying the Committed Economic Growth Scenario for Employment Growth – Table 88:
Housing Need, 2011-31
2011-31 Demographic Need +
Past Shortfall
Meeting Alternative
Population Economic
Projection
Meeting Committed
Economic Growth
Forecasts
2011-31 PA 2011-31 PA 2011-31 PA
Cherwell 13,638 682 14,862 743 22,841 1142
Oxford 15633 782 5,781 289 14,008 700
South Oxfordshire 11,032 552 13,105 655 14,972 749
Vale of White Horse 10,166 508 12,453 623 20,559 1028
West Oxfordshire 10,815 541 11,794 590 13,213 661
Oxfordshire 61,284 3,064 57,996 2,900 85,593 4280
Above trend economic performance and housing delivery could, in theory, however have some 9.29
impacts in adjoining and competitor market areas, albeit recognising that a significant proportion of
additional employment growth in the Committed Economic Growth Scenario is aligned to
investment projects and sectors where there is a notable degree of additionally at a wider regional
or national level. This recognises that there is some degree of competition between areas for
economic investment.
Higher housing provision to meet these forecasts relative to the demographic-based projections 9.30
would be necessary to support growth in the workforce. In planning for these higher levels of
housing provision to support economic growth, we consider that there would be some headroom to
contribute to meeting potential shortfalls in housing provision (assessed against demographic-
based projections) from adjoining areas, should these arise. Current and emerging planning policies
for surrounding areas are set out in Appendix 3. This is consistent with the approach in the Planning
Practice Guidance on using a common starting point in nationally-based household projections; and
its emphasis on economic factors influencing the location of housing development to support
economic growth.

Oxfordshire Strategic Housing Market Assessment: April 2014
GL Hearn Page 177 of 188
J:\Planning\Job Files\J029822 - Oxfordshire SHMA\Reports\Final SHMA Report (11.04.14).docx
The Planning Practice Guidance is clear that national household projections provide the starting 9.31
point for assessing housing need, not least as they are nationally consistent and their findings ‘sum’
at a national level. Whilst it is clearly appropriate to adjust these to ensure that supply and demand
balance at an HMA level, in increasing the level of population growth which is expected relative to
trend-based projections, we consider that there is some potential to meet unmet needs from
adjoining HMAs which may not be able to support population growth in line with trends, whilst
ensuring that across a wider area and nationally there is no overall shortfall.
The lower economic-driven projections in Oxford relative to the demographic-based projections are 9.32
a function of the City’s younger age structure relative to other parts of the County.
Taking Account of Market Signals
Market signals point towards an imbalance between housing supply and demand during the 1997-9.33
2002 period in which the affordability of market housing deteriorated significantly. Since 2005 the
lower quartile house price to lower quartile earnings ratio has remained broadly stable.
The market signals indicate that Oxfordshire is a relatively high value market. They indicate strong 9.34
house price growth over the pre-recession decade; and suggest that has been more resilient and is
recovering more quickly than other parts of the region (and England more widely). In relative terms
the analysis suggests that the strongest demand pressures are in Oxford; followed by the south of
the county (Vale of White Horse and South Oxfordshire). In relative terms, the market signals
suggest that there is less market pressure in Cherwell District and West Oxfordshire.
In Oxford in particular the analysis points towards significant affordability pressures, both in regard 9.35
to the (un)affordability of market housing and in terms of an acute shortage of affordable housing.
Oxford has some of the highest land values in the region. Lower quartile house prices are 10 times
lower quartile earnings.
Reflecting the focus of the housing offer on larger properties, overcrowding is below average in the 9.36
HMA with the exception of Oxford where 6.2% of households are overcrowded. The intensity of
occupation of the housing stock appears to have increased between 2001-11, but to a lesser
degree than across the South East or England.
The analysis above proposes a significant upward adjustment to housing provision across the HMA 9.37
in order to make-good past under-delivery against South East Plan targets; and to support
economic growth. It is realistic to assume that the 77% increase in housing provision envisaged in
the Committed Economic Growth Scenario at the HMA level relative to delivery over the 2002-12
decade could potentially contribute to some improvement in affordability. In considering this issue,

Oxfordshire Strategic Housing Market Assessment: April 2014
GL Hearn Page 178 of 188
J:\Planning\Job Files\J029822 - Oxfordshire SHMA\Reports\Final SHMA Report (11.04.14).docx
we are mindful that house prices are influenced not just by local factors but by the supply-demand
balance at a wider regional level.
The market signals do however provide some justification for considering the case of Oxford in 9.38
more detail. We address this below taking account of the market signals alongside the affordable
housing needs evidence.
Enhancing Affordable Housing Delivery
The Planning Practice Guidance sets out that the total affordable housing need should be 9.39
considered in the context of its likely delivery as a proportion of mixed market and affordable
housing developments, given the probable percentage of affordable housing to be delivered by
market housing led developments. An increase in the total housing figures should be considered
where it would help to deliver the required number of affordable homes.
The reality however is that not all affordable housing is delivered through S106 Agreements with 9.40
some sites delivering higher than policy requirements; whilst on the other hand a proportion of sites
will fall below the threshold requiring affordable housing provision whilst in some instances target
levels of affordable housing provision may not be viable. On balance for the purposes of the SHMA,
it is considered appropriate to take a middle ground by assuming delivery in line with the typical
policy requirement of each authority.
Table 89 sets out some indicative modelling based on current policies for affordable housing 9.41
delivery on what theoretical level of affordable housing might be necessary year-on-year to deliver
the affordable housing need identified. This assumes 50% of housing delivered in Oxford is
affordable housing; 33% in Cherwell District; and 40% in the other Districts (based broadly on the
Councils’ current affordable housing policies/ viability evidence). The percentage figures used are
indicative and used to consider whether there is some case for uplift of the overall assessment of
housing need. We have included the Committed Economic Growth Scenario in the table for
comparison.

Oxfordshire Strategic Housing Market Assessment: April 2014
GL Hearn Page 179 of 188
J:\Planning\Job Files\J029822 - Oxfordshire SHMA\Reports\Final SHMA Report (11.04.14).docx
Housing Provision Required to Meet Affordable Need in Full – Housing Need per Table 89:
Annum, 2011-31
Area Net Need (per
annum)
Assumed %
Affordable
Delivered
Total Annual Delivery
Required to Meet
Affordable Need in Full
Supporting Committed
Economic Growth
Cherwell 407 33% 1233 1142
Oxford 1,029 50% 2058 700
South Oxfordshire 386 40% 965 749
Vale of White Horse 273 40% 683 1028
West Oxfordshire 274 40% 685 661
County 2,370 - 5624 4280
The affordable housing evidence points towards some basis for considering higher housing 9.42
provision than in the Committed Economic Growth Scenario in Oxford and South Oxfordshire. In
West Oxfordshire the difference is modest.
The figures in this table need to be considered in context – expressed over a 20 year plan period 9.43
they are likely to over-estimate the levels of housing provision necessary. The affordable housing
needs model is based on evidence of need and supply of affordable housing as a point in time – the
time of the assessment. It is not designed to (or necessarily suitable) for considering overall
housing need, given that the findings are informed by a range of factors such that:
An improvement in overall housing supply over time (for instance through higher housing
provision against demographics) could result in improvements in the affordability of market
housing affecting the level of ‘affordable need’ identified in the model;
Similarly an improvement in housing supply will over time increase the supply of affordable
housing through re-lets, meaning for instance that stronger housing provision will progressively
reduce the level of annual need for affordable housing. This is relevant when extrapolating
model findings over 5+ years.
Furthermore affordable housing numbers include some households who are already housed in 9.44
numerical terms (albeit that it may be in unsuitable housing or PRS properties where there is
insecurity of tenure).
As the report has identified the affordable housing analysis furthermore does not take account of 9.45
the role which the Private Rented Sector plays in meeting the needs of households who are defined
in the Basic Needs Assessment model as requiring affordable housing. Our analysis indicated that
based on current dynamics, the Private Rented Sector contributes a supply of around 1,400
properties to meeting the needs of households who require financial support. Taking this into
account at the HMA level, the affordable housing evidence would not necessarily provide a basis for
a further upwards adjustment to housing provision. However the Private Rented Sector does not

Oxfordshire Strategic Housing Market Assessment: April 2014
GL Hearn Page 180 of 188
J:\Planning\Job Files\J029822 - Oxfordshire SHMA\Reports\Final SHMA Report (11.04.14).docx
necessarily provide a solution which is affordable and secure of tenure for households in housing
need.
It is also important to recognise that the ability to deliver affordable housing is influenced by funding 9.46
mechanisms which support affordable housing delivery. Figures thus need to be treated with
caution in looking at the need for affordable housing over 15-20 year timeframes, recognising that
there are a range of factors which could influence the affordability of market housing and
mechanisms for delivery of affordable housing over this period.
We conclude that the affordable housing evidence provides a basis for considering higher housing 9.47
provision in particular in Oxford City. We consider that there is some basis for considering an
upwards adjustment to the identified need in South Oxfordshire and West Oxfordshire.
Overall Conclusions on Housing Need
Table 90 brings together the evidence on housing need. Conclusions on housing need have been 9.48
drawn using the following staged process in line with the Planning Practice Guidance:
The starting point is the assessment of housing need based on demographic trends, including
where applicable provision for addressing the past shortfall in housing delivery against the
South East Plan between 2006-1130
(Column A).
Consideration is given to whether there is a need to adjust upwards the level of housing
provision in order to support Committed Economic Growth. This is undertaken by comparing
Columns A and B;
The results of this are then compared against the indicative modelling of the level of housing
provision which might be required to meet affordable housing need in full (Column C); as well
as the wider evidence of market signals. This is used to assess whether a further adjustment
to the assessed housing need is necessary.
This process has been used to derive conclusions regarding housing need in each authority. The 9.49
specific circumstances of Oxford in regard to both affordability pressures and need for affordable
housing justify a substantial upwards adjustment to the assessed need relative to the projections
based on past population change and committed economic growth. This upward adjustment aims to
improve the supply-demand balance for housing and improve affordability over the longer-term.
A bigger range is identified for Oxford reflecting the difficulty in being precise regarding what scale 9.50
of adjustment is necessary to support an improvement in affordability; and the difference in scale
between the figures in Columns B and C. In the other local authorities, the range is determined by
the evidence in Columns A-C. The top of the range is not expected to exceed the highest of the
figures shown; whist the lower end is not expected to fall more than 5% below the Committed
30
This does not apply to West Oxfordshire

Oxfordshire Strategic Housing Market Assessment: April 2014
GL Hearn Page 181 of 188
J:\Planning\Job Files\J029822 - Oxfordshire SHMA\Reports\Final SHMA Report (11.04.14).docx
Economic Growth Scenario to ensure that the Strategic Economic Plan and City Deal are supported
across Oxfordshire.
A single figure is set out for the Vale of White Horse as this is directly aligned to the Committed 9.51
Economic Growth Scenario and did not require further adjustment in relation to the affordable need
scenario unlike the other districts within the housing market area.
Conclusions on Future Need for Housing
The SHMA concludes that across Oxfordshire, there is an identified need for provision of between 9.52
4,678 – 5,328 homes a year over the 2011-31 period. This level of housing provision is necessary
to support committed economic growth; to support delivery of affordable housing; and to support an
improvement in the affordability of housing over time. The figures for individual local authorities are
set out in Table 90.
Conclusions regarding Overall Housing Need Table 90:
Housing Needed per Year (2011-31)
A. Demographic
Base + Shortfall
B. To Support Committed Economic
Growth
C. To Meet
Affordable Housing Need in
Full
D. Range:
Housing Need per
Year
E. Midpoint of Range
Cherwell 682 1142 1233 1090-1190 1140
Oxford 782 700 2058 1200 - 1600 1400
South Oxfordshire 552 749 965 725-825 775
Vale of White Horse 508 1028 683 1028 1028
West Oxfordshire 541 661 685 635-685 660
Oxfordshire 3064 4280 5624 4678 - 5328 5003
The level of need for housing identified is quite different from that delivered in the past. This reflects 9.53
evidence that housing provision in the past has not kept pace with that needed; the need to house a
growing older population (with people living longer); and the significant drivers – particularly in
terms of job creation – which are expected to influence future need for homes.
The NPPF clearly sets out that the Government expects the planning system to do “everything it 9.54
can to support sustainable economic growth” and that significant weight should be placed on the
need to support economic growth through the planning system (Para 19).
The Planning Practice Guidance reaffirms this and outlines why the homes need to be provided to 9.55
support the committed economic growth. It sets out that where there is an imbalance, this will result
in unsustainable commuting patterns and could reduce the resilience of local businesses. An
imbalance between housing need and supply over the longer-term could also reduce affordability
and the ability of young households to form and get on the housing ladder. This is not compatible
with achieving sustainable development.

Oxfordshire Strategic Housing Market Assessment: April 2014
GL Hearn Page 182 of 188
J:\Planning\Job Files\J029822 - Oxfordshire SHMA\Reports\Final SHMA Report (11.04.14).docx
The need for housing identified thus reflects the combined need to support population growth, to 9.56
ensure that young people are able to form new households, that businesses are able to grow and
recruit new staff who will be able to live locally, and to ensure that those households who need
affordable housing are able to find it.
The midpoint of the identified range would see housing provision of around 5,000 homes a year 9.57
across Oxfordshire. This represents a significant 17% uplift on the level of housing provision
identified as necessary to support Committed Economic Growth. This upwards adjustment is
principally to the assessed need for Oxford and reflects the particular affordability pressures and
acute need for affordable housing within the City. It reflects the need to deliver a substantial scale of
increase in housing provision to support an improvement in housing affordability in the City and the
wider housing market area over the longer-term.
For Cherwell District the evidence indicates a need for 1,142 dwellings per annum (2011-31) to 9.58
support the Strategic Economic Plan. This is based on supporting Committed Economic Growth.
The range set out represents +/- 50 homes per annum either side of this.
For Oxford the evidence suggests a base demographic need (including provision for addressing the 9.59
shortfall related to the SDA) for 780 homes per annum. However the evidence points to a clear
need for higher housing delivery. We consider that provision of 1,400 homes per annum would be
appropriate representing a housing growth rate of 2.0% per annum to 2031. This is at the higher
end of the range of growth rates achieved nationally over the past 15 years and reflects the strong
evidence from market signals and affordable housing needs of the need to significantly boost
housing supply. This level of provision would meet two-thirds of the identified affordable housing
needs. A bigger range is identified for Oxford (for between 1,200 – 1,600 homes per annum)
reflecting the difficulty in being precise regarding what scale of adjustment is necessary to support
an improvement in affordability; and the difference in scale between the figures in Columns B and C.
For South Oxfordshire the evidence indicates a need for 750 dwellings per annum (2011-31) to 9.60
support employment growth. The affordable housing evidence provides some basis for considering
higher housing provision. Drawing the evidence together we consider that housing need would fall
between 725 – 825 homes per annum. The higher end of this range would support enhanced
affordable housing delivery.
For the Vale of White Horse the evidence indicates a need for 1028 dwellings per annum (2011-31) 9.61
to support the Strategic Economic Plan. This is based on the supporting Committed Economic
Growth. This did not require further adjustment in relation to the affordable need scenario unlike the
other districts within the housing market area.

Oxfordshire Strategic Housing Market Assessment: April 2014
GL Hearn Page 183 of 188
J:\Planning\Job Files\J029822 - Oxfordshire SHMA\Reports\Final SHMA Report (11.04.14).docx
For West Oxfordshire the evidence indicates a need for between 635 – 685 dwellings per annum 9.62
(2011-31). The midpoint of this range is based on the Committed Economic Growth Scenario, with
the higher end based on a modest upwards adjustment to enhance affordable housing delivery. The
lower end reflects the sensitivity of the modelling of the relationship between economic performance
and housing need. This assessment does not make any adjustment for past over-provision relative
to previous household projections and targets for West Oxfordshire. The District Council may wish
to further consider this issue in line of the Planning Practice Guidance which highlights the need to
consider previous over-supply and provides some scope for adjustments to projections to take
account of this. Strong past housing provision is likely to have influenced both the demographic
projections and the economic forecasts, to some degree, as these take account of population
trends in projecting employment growth in sectors where the population base influences demand31
.
Taking the Assessment Forward
The SHMA does not set housing targets. It provides an assessment of the future need for housing. 9.63
Government guidance and advice is explicit that the SHMA itself must not apply constraints to the
overall assessment of need, such as environmental constraints or issues related to congestion and
local infrastructure. This does not mean that these issues are not important. They are very relevant
in considering how much development can be sustainably accommodated and where new
development should be located.
In accordance with the duty to co-operate, the Oxfordshire councils will continue to work together 9.64
through the Oxfordshire Spatial Planning and Infrastructure Partnership (SPIP) in order to identify
the most appropriate locations to accommodate future development and to ensure that
infrastructure provision is properly coordinated to address existing issues and support delivery of
new homes.
It will be for each local authority to consider the extent to which it is able to meet its own identified 9.65
needs through their individual local plan process. The authorities have signed up to a ‘statement of
co-operation’ to help manage the outcomes of the SHMA should any authority be unable to
accommodate its identified housing need in full.
Co-ordinated through SPIP, the authorities will continue to work together to consider how housing 9.66
need can be sustainably accommodated. Some of this work will be carried out by individual
authorities, some on a joint-basis. Key tasks are likely to include:
31
This principally includes health, education, retail and other consumer-related services

Oxfordshire Strategic Housing Market Assessment: April 2014
GL Hearn Page 184 of 188
J:\Planning\Job Files\J029822 - Oxfordshire SHMA\Reports\Final SHMA Report (11.04.14).docx
1. Capacity Assessment – assessment of the capacity of different areas, including Oxford City, to
accommodate new housing development, taking account of housing expected to be delivered
on sites with planning consent and other sites which can accommodate housing;
2. Testing Spatial Options – drawing the assessment of capacity together to identify what
additional land may be necessary to meet housing need, and to identify and test potential
options for additional development to accommodate this; and
3. Deliverability Assessment – considering and testing the deliverability of different levels and
options for housing development.
This process will be used to refine and test what level of future housing development can be 9.67
sustainably planned for across the Oxfordshire Housing Market Area and how this is distributed
across different areas.
What Mix of Homes is Needed?
The NPPF also requires local planning authorities, through the SHMA, to identify the range of types 9.68
and sizes of accommodation likely to be needed by the population in future, including that required
by those groups with specific housing needs.
Types of Affordable Housing Needed
In regard to the mix of affordable housing sought on development sites, the assessment indicates 9.69
that across the housing market area the housing needs evidence would support 25% intermediate
housing and 75% rented. In need terms, the balance of the rented affordable housing need is
focused slightly more towards social rent. We also identify some variation in the need for different
types of affordable housing at local authority level which could feed into local policies.
However in setting policies for the mix of affordable housing, councils will need to consider both the 9.70
evidence regarding housing needs as well as the viability of delivering affordable housing. The
SHMA does not consider development viability, which is equally important in determining policies
for affordable housing mix, and is intended to be addressed through Plan-wide Viability Studies.
Ultimately the types of affordable housing sought is also a policy decision to be made through the 9.71
Local Plan and needs to balance these factors.
Sizes of Homes
There are a range of factors which will influence the need for different sizes of homes, including 9.72
demographic changes; future growth in real earnings and households’ ability to save; economic
performance and housing affordability.
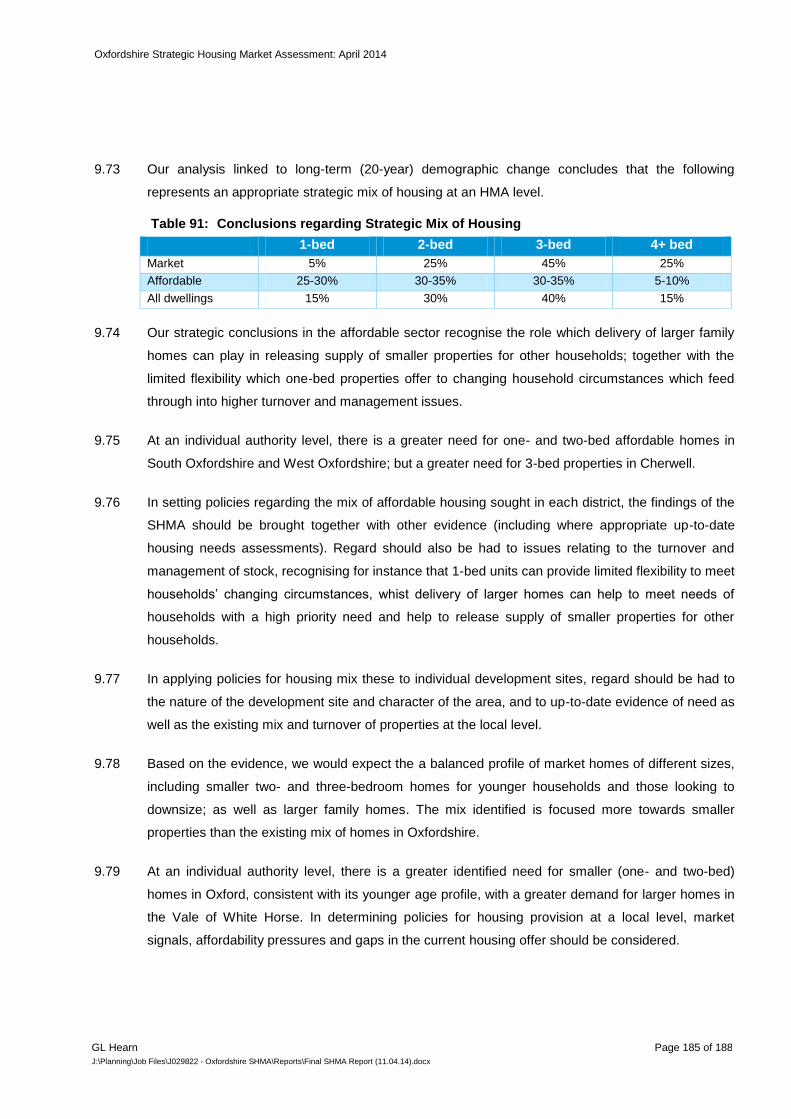
Oxfordshire Strategic Housing Market Assessment: April 2014
GL Hearn Page 185 of 188
J:\Planning\Job Files\J029822 - Oxfordshire SHMA\Reports\Final SHMA Report (11.04.14).docx
Our analysis linked to long-term (20-year) demographic change concludes that the following 9.73
represents an appropriate strategic mix of housing at an HMA level.
Conclusions regarding Strategic Mix of Housing Table 91:
1-bed 2-bed 3-bed 4+ bed
Market 5% 25% 45% 25%
Affordable 25-30% 30-35% 30-35% 5-10%
All dwellings 15% 30% 40% 15%
Our strategic conclusions in the affordable sector recognise the role which delivery of larger family 9.74
homes can play in releasing supply of smaller properties for other households; together with the
limited flexibility which one-bed properties offer to changing household circumstances which feed
through into higher turnover and management issues.
At an individual authority level, there is a greater need for one- and two-bed affordable homes in 9.75
South Oxfordshire and West Oxfordshire; but a greater need for 3-bed properties in Cherwell.
In setting policies regarding the mix of affordable housing sought in each district, the findings of the 9.76
SHMA should be brought together with other evidence (including where appropriate up-to-date
housing needs assessments). Regard should also be had to issues relating to the turnover and
management of stock, recognising for instance that 1-bed units can provide limited flexibility to meet
households’ changing circumstances, whist delivery of larger homes can help to meet needs of
households with a high priority need and help to release supply of smaller properties for other
households.
In applying policies for housing mix these to individual development sites, regard should be had to 9.77
the nature of the development site and character of the area, and to up-to-date evidence of need as
well as the existing mix and turnover of properties at the local level.
Based on the evidence, we would expect the a balanced profile of market homes of different sizes, 9.78
including smaller two- and three-bedroom homes for younger households and those looking to
downsize; as well as larger family homes. The mix identified is focused more towards smaller
properties than the existing mix of homes in Oxfordshire.
At an individual authority level, there is a greater identified need for smaller (one- and two-bed) 9.79
homes in Oxford, consistent with its younger age profile, with a greater demand for larger homes in
the Vale of White Horse. In determining policies for housing provision at a local level, market
signals, affordability pressures and gaps in the current housing offer should be considered.
Oxfordshire Strategic Housing Market Assessment: April 2014
GL Hearn Page 186 of 188
J:\Planning\Job Files\J029822 - Oxfordshire SHMA\Reports\Final SHMA Report (11.04.14).docx
The analysis of an appropriate mix of dwellings should also inform the ‘portfolio’ of sites which are 9.80
considered through the Local Plan process, including: Site Allocations, Neighbourhood Plans and
other planning documents. Equally it will be of relevance to affordable housing negotiations.
Meeting Specific Housing Needs
The SHMA has additionally considered the needs of different household groups within the 9.81
population.
The older person population of Oxfordshire is projected to increase significantly up until 2031. Older 9.82
persons are more likely to under-occupy homes.
In the affordable sector, there may be potential to reduce (or seek to limit potential growth in) under-9.83
occupation and the Councils may wish to consider providing support and incentives to social
housing occupiers to downsize. This will help to release larger affordable homes for younger
households. An analysis of older person households suggest that they are more likely to live in
social rented housing (especially single pensioner households). With the projected increases in
older persons there may therefore be additional pressure on the affordable housing stock from such
households.
The SHMA analysis indicates that the growing older population (particularly in the oldest age 9.84
groups) will result in growth in households with specialist housing needs. Typically the greatest
support needs are for alterations to properties (such as to bathrooms, showers and toilets, provision
of emergency alarms or help maintaining homes). Many of these can be resolved in situ through
adaptations to existing properties and the resource implications of this will need to be planned for.
Many older households are likely to want to remain in their existing homes.
The growing older population will however likely lead to some increase in requirements for 9.85
specialist housing solutions. The analysis above suggests a 98% growth in older population with
dementia, and an 82% increase in the older population with mobility problems. From a planning
point of view, some of these people will require specialist housing such as sheltered or extra care
provision. Increasing numbers of older people with health problems will also require joint-working
between housing and health (Council and NHS). The SHMA analysis indicates a potential need for
between 280-450 additional housing units to be specialist accommodation across the County to
meet the needs of the older person population each year moving to 2031.
Currently 22% of households contain someone with a long-term health problem or disability. 9.86
Demographic trends are expected to lead to a significant growth in the population and number of

Oxfordshire Strategic Housing Market Assessment: April 2014
GL Hearn Page 187 of 188
J:\Planning\Job Files\J029822 - Oxfordshire SHMA\Reports\Final SHMA Report (11.04.14).docx
households with disabilities over the period to 2031. Housing support services, including provision
of adaptations to properties, will need to be adequately resources to take account of this.
The Black and Minority Ethnic (BME) population in Oxfordshire has grown strongly since 2001. The 9.87
2011 Census shows that BME groups make up 15% of the County’s population (up from 9% in
2001). The Asian and White:Other populations (which includes Eastern European migrants) have
both grown notably.BME households appear to be typically younger and less likely to be owner
occupiers than the White (British/Irish) population; there is also a greater reliance on the private
rented sector. BME households are also more likely to be overcrowded and less likely to under-
occupy dwellings.The implications of this are more for housing strategy than planning, and suggest
a need to consider particularly how the needs of different groups are met within the local housing
market, to explore the reasons for higher levels of overcrowding in BME communities and how this
can be addressed. It will also be important to consider the role which the Private Rented Sector
plays in meeting needs of new migrant communities and the standards of housing in this sector.
Investigating these issues in greater detail may assist development of strategic housing policies.
The data regarding family households suggests that their needs may be quite polarised. Whilst 9.88
married couple households have high levels of owner-occupation and may well be slightly better off
than the general population the data does point to lone parent (and other) households being more
disadvantaged. Given that households with children should be seen as a priority for the councils,
this points towards ensuring that the housing offer meets the needs of such households and in
particular the need to ensure a reasonable quality of housing in the private rented sector.
Analysis of younger person households shows a high reliance on rented housing. Younger age 9.89
cohorts may therefore be forced into private rented (including shared) housing as the only means of
meeting their housing needs, aside from residing with parents. National trends illustrate a particular
growth in people in the 20s and early 30s living with parents or in shared housing. This is also
borne out in the Oxfordshire HMA. An increase in housing supply will be important in helping to
address this in the longer-term. Factors such as a balanced approach to housing in terms of
bedroom sizes and property types, along with high standards for Houses in Multiple Occupation
(HMOs), will help younger households to access housing.
The SHMA has also looked at the self-build sector. Overall the evidence we have collected across 9.90
England, and looking more specifically at Oxfordshire, suggest that self-build is a niche sector, but
one that is not necessarily only delivering high value bespoke homes. It is clear that much activity is
undertaken by entrepreneurs aimed at more modest homes for sale or rent and in doing so making
better use of land that may detract from the local environment. It is also clear that the role of a local
champion for the sector is a step that needs to be taken if further interest is to be generated. In
policy terms there is some potential to encourage self-build through policy developers of larger

Oxfordshire Strategic Housing Market Assessment: April 2014
GL Hearn Page 188 of 188
J:\Planning\Job Files\J029822 - Oxfordshire SHMA\Reports\Final SHMA Report (11.04.14).docx
schemes to designate parts of these schemes as serviced plots which can be developed as self-
build.
There is a significant student component to the housing market in Oxford. The policy framework 9.91
restricting the scale of students living outside of University accommodation is likely to moderate the
impact of changes in student numbers on the housing market. The University of Oxford’s proposals
for growth – particularly in the STEM subjects and medical sciences – however may create an
additional 1,200 jobs and 1,000 post graduate student places. Whilst some may live in student
accommodation, the post graduate students may be more likely to exercise choice in the wider
housing market. Some may for instance move with their families.
Growth in student numbers from the two universities is likely to be controlled through the cap put in 9.92
place through the Oxford Core Strategy which seeks to manage delivery of additional academic
floorspace and student accommodation. However additional growth in non-university education and
could feasibly create additional demand pressures particularly within the private rented sector. The
number of language schools and other institutions however makes it difficult to accurately judge and
quantify the potential scale of impact. This may be an area in which the Council could consider
further specific research.
Monitoring and Review
Through a proactive monitoring process it will be possible to maintain and develop understanding of 9.93
the housing market, building on the outcomes of the SHMA. It will allow the implementation of
policies to be tailored to evolving circumstances and inform future policy development.
A monitoring framework is set out alongside the SHMA which considers demographic and 9.94
economic trends which influence the operation of the housing market, alongside changes in market
dynamics (including supply, demand, need and price variables). Long-term monitoring which
addresses indicators of housing need, market signals relating to supply-demand balance, and the
housing supply trajectory can inform future development and implementation of planning policies for
housing provision.