oxygen chemisorption-induced surface phase...
TRANSCRIPT

Surface Science 627 (2014) 75–84
Contents lists available at ScienceDirect
Surface Science
j ourna l homepage: www.e lsev ie r .com/ locate /susc
Oxygen chemisorption-induced surface phase transitions on Cu(110)
Qianqian Liu a, Liang Li a, Na Cai a, Wissam A. Saidi b, Guangwen Zhou a,⁎a Department of Mechanical Engineering & Multidisciplinary Program in Materials Science and Engineering, State University of New York, Binghamton, NY 13902, United Statesb Department of Chemical and Petroleum Engineering, University of Pittsburgh, Pittsburgh, PA 15261, United States
⁎ Corresponding author.E-mail address: [email protected] (G. Zhou).
http://dx.doi.org/10.1016/j.susc.2014.04.0170039-6028/© 2013 Elsevier B.V. All rights reserved.
a b s t r a c t
a r t i c l e i n f oArticle history:Received 11 October 2013Accepted 29 April 2014Available online 9 May 2014
Keywords:Oxygen chemisorptionCu(110)Scanning tunneling microscopy (STM)SurfaceReconstruction
From an interplay between variable temperature scanning tunneling microscopy and density–functional theorycalculations, the evolution of oxygen chemisorption-induced surface reconstructions of the Cu(110) surface isdetermined. The surface reconstructions proceed via a sequential pathway with increasing oxygen surfacecoverage. The (2 × 1) reconstruction occurs first and then transits to the c(6 × 2) phase with a higher oxygencoverage through a mechanism that consumes the existing (2 × 1) phase with the supply of Cu adatoms fromstep edges and terraces. The temperature dependence of the (2 × 1) → c(6 × 2) transition demonstrates thatthe surface phase transition is an activated process for breaking up added Cu–O–Cu rows in the (2 × 1)structure. Comparison between the experimental observations and the theoretical surface phase diagramobtained from first-principles thermodynamic calculations reveals that the (2 × 1) → c(6 × 2) transition takesplace at the oxygen chemical potentials that are far above the chemical potential for Cu2O bulk oxide formation,reflecting the existence of kinetic limitations to the surface phase transition and the bulk oxide formation.
© 2013 Elsevier B.V. All rights reserved.
1. Introduction
Effects resulting from the interaction between oxygen and a metalsurface are of great interest in many areas such as oxidation, corrosion,and heterogeneous catalysis. Acquiring a fundamental understanding ofthe nature of the interactions is critical to elucidate the role of oxygenfor these important technological processes. For instance, many currentindustrial processes are centered on catalytic oxidation reactions.Upon exposure to an oxygen-containing atmosphere, the metal surfaceundergoes a series of structural changes varying from the formation ofinitial oxygen chemisorbed adlayers to oxygen sub-surface diffusionand then to bulk oxide formation, depending on the oxidation condi-tions including the oxygen gas partial pressure, temperature, and orien-tation of the metal surface. It has been increasingly apparent that theactive phase of some catalytic oxidation catalysts under operatingconditions is in fact their oxides rather than the puremetal [1,2]. Duringcatalytic reactions different compositions and structures of the metalsurface may be present depending on the operation conditions. How-ever, not all oxide phases are equally active to fulfill multiple catalyticfunctions. Thus, a detailed study of the formation of each surface recon-struction and the mechanism governing their transitions to otherphases will provide insight for finely tuning the operating conditionsto favor one phase over the other for better activities and selectivities.
Copper-based catalysts are well known to be active for various cata-lytic reactions including the water–gas shift reaction [3,4], methanol
synthesis andmethanol oxidation [5], the reduction and decompositionof nitrogen oxides [6], and fuel cell electrodes [7]. Dissociative adsorp-tion of oxygen, for instance, represents the first step in the synthesisof formaldehyde by methanol oxidation over copper [5]. Surface oxida-tion and the formation of oxide overlayers are believed to play a criticalrole in copper catalysis [8,9]. Consequently, Cu has been studied as aprototype system dealing with the oxygen surface chemisorption.Particularly, the oxygen chemisorption on Cu(110), the most open ofthe low-index surfaces, is among the most studied systems, involvingoxygen adsorption, interdiffusion of Cu and O, and various restructuringphases [10–23]. A consensus has been established on some aspects ofthe behavior of oxygen adsorption on Cu(110) under ultrahigh vacuum(UHV) conditions. Two superstructures occur upon UHV oxygenexposures: an added-row (2 × 1)–O structure with θ = 0.5 oxygencoverage, and a c(6 × 2) structure with θ = 2/3 oxygen coverage forincreased oxygen exposure [17,19–21].
However, even though the formation of these reconstructed struc-tures has been known for over 20 years, the detailed kinetic and ther-modynamic mechanisms controlling the crossover from the added-row (2 × 1) to the c(6 × 2) reconstruction are still open for debate.The added-row (2 × 1) was found to nucleate homogenously on well-ordered terraces and the process can be described as a two-dimensional precipitation of a solid phase from a dilute, mixed fluidof Cu and O [10–23]. Compared to the detailed understanding of the(2 × 1) reconstruction, very little is known about the formation processof the c(6 × 2). For instance, it is unclear if the c(6 × 2) reconstructioncan occur directly on an un-reconstructed Cu(110) surface or has tofollow a sequential pathway via the (2 × 1) → c(6 × 2) conversionprocess when a clean Cu(110) surface is directly exposed to the oxygen

76 Q. Liu et al. / Surface Science 627 (2014) 75–84
gas underwhich the c(6×2) reconstruction is thermodynamicallymorefavored over the (2 × 1) reconstruction. Alternatively, if the c(6 × 2)reconstruction occurs by consuming the existing (2 × 1) structure, itwill involve massive surface restructuring, the break-up of Cu–O–Curows in the (2 × 1) (i.e., a solid–solid transition may be more appro-priate), and thus, the effects of kinetic limitationsmay be equally impor-tant in addition to the thermodynamic driving force for the phasetransition. Particularly, the requirements of temperature and oxygenpressure delineating the transitions of these surface phases have notbeen established. Due to the lack of systematic experimental data onthe temperature and pressure effects on the surface phase transition,comparisons with theoretical thermodynamic calculations have notbeen made in the past studies. Our goal in this work is to bridge thisinformation gap by performing a set of experiments with well-controlled temperature and pressure conditions for elucidating thetemperature/pressure requirements leading to the crossover from the(2 × 1) to c(6 × 2) reconstructions. Addressing these thermodynamicand kinetic processes governing the surface phase selection is expectedto have significant technological implications for controlling the surfacestructure and reactivity.
In thisworkwepresent a systematic study of the effect of oxygen gasexposure and oxidation temperature on the formation of the (2× 1) andc(6 × 2) phases during the oxidation of Cu(110). Variable temperaturescanning tunneling microscopy (STM) is employed to monitor thestructure evolution of the surface reconstructions induced by oxygenchemisorption at different temperatures. By examining the oxygenexposure at the oxygen pressure up to 1 × 10⁻⁵ Torr at three differenttemperatures (27 °C, 100 °C, and 350 °C), we demonstrate that thec(6 × 2) formation is temperature dependent, where a critical oxygencoverage is required for the phase transition, thereby supporting thesequential pathway of the surface reconstructions (i.e., the c(6 × 2)reconstruction occurs via the (2 × 1) → c(6 × 2) conversion process).From an interplay between the experiments and the first-principlesthermodynamic calculations, we find that a significant kinetic barrierexists for the (2 × 1) → c(6 × 2) phase transition, and toward thebulk oxide formation.
2. Experimental and computational methods
The experiments were performed by an ultrahigh vacuum (UHV)variable-temperature scanning tunneling microscope (Omicron VT-STMXA)with a base pressure of ~1 × 10⁻¹¹ Torr. An electrochemicallyetched polycrystalline tungsten wire was used for the STM tip. The STMtips were flashed (1 kV and 2 mA) for several times to evaporate adsor-bates and native oxide. Meanwhile, the oxygen dosing was performedin a separate chamber than the STM chamber to ensure the pristine na-ture of the tip. The Cu(110) single crystal is a ‘top-hat’ disk (1mm thickand 8 mm in diameter), purchased from Princeton Scientific Corp., cutto within 0.1° to the (110) crystallographic orientation and polished toa mirror finish. The crystal was cleaned by repeated cycles of Ar+
sputtering at room temperature (5 × 10⁻⁵ Torr of Ar+, 1 μA cm−2,1.0 keV) followed by annealing at 600 °C for 10 min. Cleanliness of theCu(110) surface was checked by STM imaging prior to oxidation by ox-ygen gas dosing at different temperatures (T = 27 °C, 100 °C, and350 °C). All the oxidation experiments were carried out on freshlycleaned Cu(110) surfaces. Oxygen gas (purity = 99.9999%) was intro-duced to the system through a variable-pressure leak valve and thesample was oxidized under a controlled oxygen pressure (pO2) rangingfrom1×10−10 Torr to 1× 10⁻⁵ Torr. All the STM imageswere acquiredat room temperature in constant–current mode with bias on thesample.
Density–functional theory (DFT) calculations are performed usingthe generalized gradient approximation (GGA) of Perdew–Wang(PW91) [24] for the exchange and correlation functional, as implement-ed in the Vienna Ab-initio Simulation Package (VASP) [25–29].We usedprojector augmented wave (PAW) potentials in conjunction with a
planewave cutoff energy of 380 eV. The Brillouin-zone integration forthe (2 × 1) and c(6 × 2) unit cells is performed using (5 × 7 × 1) and(2 × 4 × 1) Monkhorst–Pack grids [30], and with broadening of theFermi surface according to Methfessel–Paxton smearing technique[31] with a smearing parameter of 0.2 eV. All of our calculations arespin-averaged except those for the oxygen atom and molecule whichare spin polarized. In our modeling of the chemisorbed species on thesurface, we used a slab model with five layers where the bottom layeris fixed. Periodic images along the direction perpendicular to the surfaceare separated by a vacuum region of 12 Å. Adsorption is done on oneside of the slab only. Atomic and molecular oxygen are studied using alarge cubic cell. The positions of all of the atoms, except those of the bot-tom layer, are relaxed until the forces are less than 0.015 eV/Å. Varioustests have been performed to verify our computational framework suchas k-grid convergence, vacuum size, and planewave cutoff. As a validitycheck, our calculated lattice constant for Cu is 3.64 Å which is in goodagreement with the experimental value 3.61 Å [32] and with previouscalculations [33–35].
We employed a first-principles atomistic thermodynamic frame-work to assess the relative stability of the considered surface structuresas a function of p(O2) and T [8,13]. The average adsorption energy forsingle oxygen atom can be defined as,
EadsO ¼ 1NO
EtotO=Cu−EslabCu −ΔNCuECu−NO
2EO2
� �; ð1Þ
where EO/Cutot is the total energy of the Cu–O system, and ECuslab is theenergy of a clean, non-reconstructed Cu surface. ΔNCu accounts fordifferences in the number of Cu atoms between the reference clean Cusurface and the Cu–O system, and ECu is the energy of a single Cuatom in bulk state. EO2
is the energy of an isolated oxygen moleculeand NO is the number of oxygen atoms adsorbed on the Cu substrate.The Gibbs free energy Δγ of the Cu–O system relative to the cleannon-reconstructed Cu surface is calculated as,
Δγ ¼ 1A
EtotO=Cu−EslabCu −ΔNCuμCu−NOμO T;pð Þh i
: ð2Þ
Here A is the surface unit area and μCu and μO denote the Cu and Ochemical potentials, respectively. The chemical potential of Cu is takento be that of a Cu atom in bulk phase, thus assuming that the slab is inequilibrium with the bulk phase that acts as the Cu reservoir. Theoxygen chemical potential depends on temperature and pressureaccording to
μO T;pð Þ ¼ 12
EtotalO2þ eμO2
T;p0� �
þ kBT lnpO2
p0
� �� �; ð3Þ
where p0 represents the standard atmospheric pressure and eμO2T;p0
� �denotes the chemical potential of oxygen gas at 1 atm, which is tabu-lated in ref. [36]. In Eqs. (2) and (3), we neglected the vibrational andconfigurational terms in the Gibbs free energy as these contributionsare small [37,38]. Additionally, the −pV contribution is also small forpressures less than 100 atm [38]. By redefining the chemical potentialas ΔμO ¼ μO− 1
2 EO2and combining Eqs. (1) and (3), we can express
the Gibbs free energies in Eq. (2) as,
Δγ ¼ 1A
NOEadsO −NOΔμO
� �: ð4Þ
Before concluding this section, we point out that the GGA/PW91error for the binding energy for O2 (the energy that is needed to disso-ciate an O2 molecule) is large [35,39,40]. Our calculated value is 6.3 eVwhile the experimental value is 5.1 eV [41]. Our GGA/PW91 valueagrees with previous results [35,39,40]. This error in the binding energyof O2 affects the thermodynamic analysis. To remedy this, previousstudies have used the calculated O2 binding energy for computing the

77Q. Liu et al. / Surface Science 627 (2014) 75–84
phase diagram relying on cancelation of errors when computing energydifferences. This is perhaps partially true but oxygen is also a specialcase and it is not clear whether this is the best approach. In order toestimate a margin of error for our results, we performed our thermo-dynamic analysis using the computed aswell as the experimental bind-ing energy of O2. In the latter case, we define the “experimentally-corrected” total energy of O2 as 1
2 EgasO2
¼ EDFTO − 12 E
bindO2
, where EODFT is the
DFT energy of an isolated O atom and EbindO2
is the experimental bindingenergy of O2. In addition, to ensure that our results are not affected bythe choice of exchange–correlation functional, we also use GGA/PBE[40] and LDA [42] formalisms to double check the results. Unless other-wise stated, the theoretical data listed below is obtained using PW91.
3. Results and discussion
The clean Cu(110) surface was oxidized at various temperaturesand oxygen pressures ranging from 1 × 10⁻¹⁰ to 1 × 10⁻⁵ Torr. Allthe STM images were obtained on the Cu(110) surface using con-stant current mode. Fig. 1 shows the STM images of typical largeareas and zoomed-in areas of the surfaces oxidized at room temper-ature (T = 27 °C) under different oxygen pressures and exposuredurations. Fig. 1(a) shows the STM images obtained from oxidationat pO2 = 1 × 10⁻¹⁰ Torr for 5 h of oxygen exposure (i.e., 1.8 L). Thesurface is covered by alternating wide and narrow stripes. Widestripes correspond to the bare Cu substrate that results from the
Fig. 1. Topographic STM images of typical large areas of the Cu(110) surface oxidized at room te5 h (exposure = 1.8 L); (b) pO2 = 1 × 10⁻⁸ Torr for 60 min (exposure = 36 L); (c) pO2 = 1(exposure = 18,000 L). Insets are zoomed-in STM images revealing the atomic structure of ththe STM imaging are IT = 0.1–1 nA and VB = −2–1.5 V.
relatively low oxygen exposure due to the extremely low oxygenpressure. The narrow stripes are the Cu(110)–(2 × 1)–O reconstruct-ed phase. As revealed by the inset zoomed-in STM image, the (2 × 1)stripes are oriented along the Cu[001] direction. The formation of(2 × 1) stripes on Cu(110) under low oxygen coverage is consistentwith previous STM observations [10,18,20,22].
Fig. 1(b) corresponds to the oxidation at pO2 = 1 × 10⁻⁸ Torr for60 min (oxygen exposure = 36 L). Compared to the reconstruction atthe oxygen exposure pO2 = 1 × 10⁻¹⁰ Torr, the topographic STMimages obtained from the surface after the higher oxygen exposure ap-pear quite differently. It can be seen that the step edges become clearlycorrugated and the upper and lower terraces exhibit dark depressionsthat are approximately 1.38 Å deep, which corresponds to single atomiclayer deep from the surrounding area [for bulk Cu(110), the singleatomic height is 1.27 Å]. As revealed by the inset zoomed-in STMimage of Fig. 1(b), the surface is covered by the (2 × 1) phase includingin the dark impression areas and tiny areas of the c(6 × 2) phase(the observed c(6 × 2) surface coverage is ~0.012). The formation ofthe co-existing (2 × 1) and c(6 × 2) phases was also observed inprevious STM study [19]. More details for the atomic processes of the(2 × 1) → c(6 × 2) transition are described in Fig. 2.
Fig. 1(c) corresponds to the oxidation at pO2 = 1 × 10⁻⁶ Torr for40min (oxygen exposure=2400 L). Compared to the oxygen exposureat pO2 = 1 × 10⁻⁸ Torr, Fig. 1(c) reveals that the surface becomesroughened with the formation of a high density of one-atomic-deepdepressions. The inset zoomed-in STM image shows that the surface is
mperature (T=27 °C) under the different oxygen pressures: (a) pO2=1× 10⁻¹⁰ Torr for× 10−6 Torr for 40 min (exposure = 2,400 L); and (d) pO2 = 1 × 10⁻⁵ Torr for 30 mine surface reconstructions at the different oxygen pressures. The tunneling conditions for
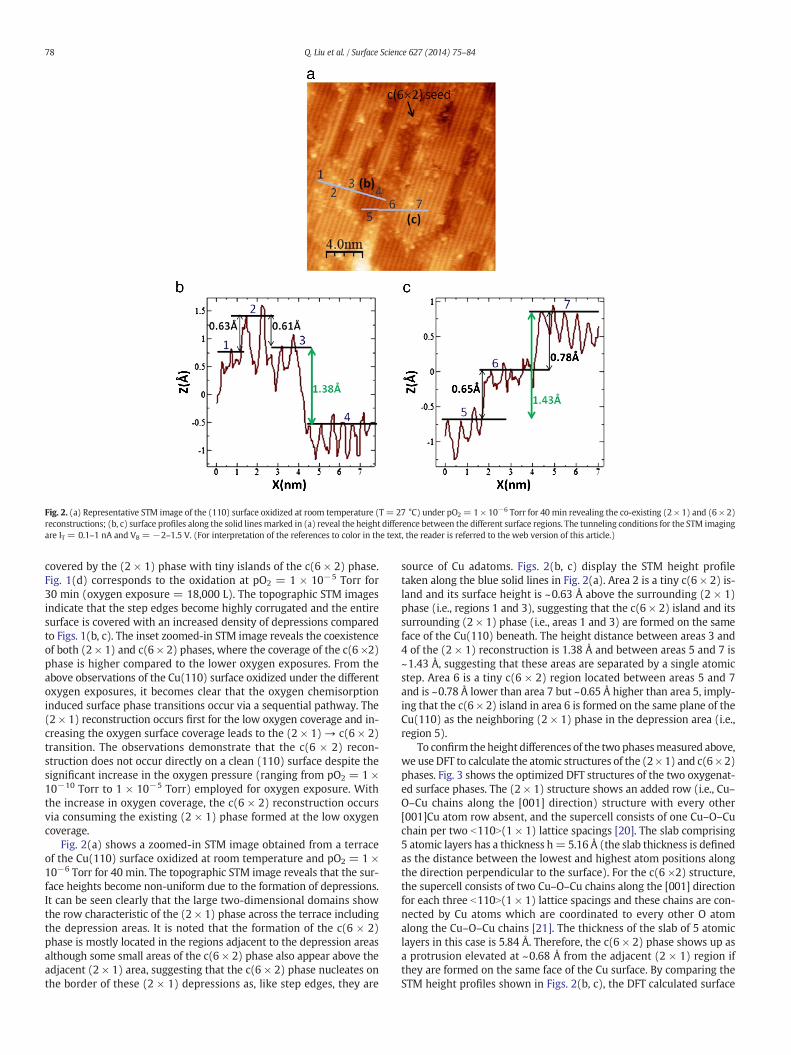
Fig. 2. (a) Representative STM image of the (110) surface oxidized at room temperature (T = 27 °C) under pO2 = 1 × 10⁻⁶ Torr for 40 min revealing the co-existing (2 × 1) and (6 × 2)reconstructions; (b, c) surface profiles along the solid linesmarked in (a) reveal the height difference between the different surface regions. The tunneling conditions for the STM imagingare IT = 0.1–1 nA and VB = −2–1.5 V. (For interpretation of the references to color in the text, the reader is referred to the web version of this article.)
78 Q. Liu et al. / Surface Science 627 (2014) 75–84
covered by the (2 × 1) phase with tiny islands of the c(6 × 2) phase.Fig. 1(d) corresponds to the oxidation at pO2 = 1 × 10⁻⁵ Torr for30 min (oxygen exposure = 18,000 L). The topographic STM imagesindicate that the step edges become highly corrugated and the entiresurface is covered with an increased density of depressions comparedto Figs. 1(b, c). The inset zoomed-in STM image reveals the coexistenceof both (2 × 1) and c(6 × 2) phases, where the coverage of the c(6 ×2)phase is higher compared to the lower oxygen exposures. From theabove observations of the Cu(110) surface oxidized under the differentoxygen exposures, it becomes clear that the oxygen chemisorptioninduced surface phase transitions occur via a sequential pathway. The(2 × 1) reconstruction occurs first for the low oxygen coverage and in-creasing the oxygen surface coverage leads to the (2 × 1) → c(6 × 2)transition. The observations demonstrate that the c(6 × 2) recon-struction does not occur directly on a clean (110) surface despite thesignificant increase in the oxygen pressure (ranging from pO2 = 1 ×10⁻¹⁰ Torr to 1 × 10⁻⁵ Torr) employed for oxygen exposure. Withthe increase in oxygen coverage, the c(6 × 2) reconstruction occursvia consuming the existing (2 × 1) phase formed at the low oxygencoverage.
Fig. 2(a) shows a zoomed-in STM image obtained from a terraceof the Cu(110) surface oxidized at room temperature and pO2 = 1 ×10⁻⁶ Torr for 40 min. The topographic STM image reveals that the sur-face heights become non-uniform due to the formation of depressions.It can be seen clearly that the large two-dimensional domains showthe row characteristic of the (2 × 1) phase across the terrace includingthe depression areas. It is noted that the formation of the c(6 × 2)phase is mostly located in the regions adjacent to the depression areasalthough some small areas of the c(6 × 2) phase also appear above theadjacent (2 × 1) area, suggesting that the c(6 × 2) phase nucleates onthe border of these (2 × 1) depressions as, like step edges, they are
source of Cu adatoms. Figs. 2(b, c) display the STM height profiletaken along the blue solid lines in Fig. 2(a). Area 2 is a tiny c(6 × 2) is-land and its surface height is ~0.63 Å above the surrounding (2 × 1)phase (i.e., regions 1 and 3), suggesting that the c(6 × 2) island and itssurrounding (2 × 1) phase (i.e., areas 1 and 3) are formed on the sameface of the Cu(110) beneath. The height distance between areas 3 and4 of the (2 × 1) reconstruction is 1.38 Å and between areas 5 and 7 is~1.43 Å, suggesting that these areas are separated by a single atomicstep. Area 6 is a tiny c(6 × 2) region located between areas 5 and 7and is ~0.78 Å lower than area 7 but ~0.65 Å higher than area 5, imply-ing that the c(6 × 2) island in area 6 is formed on the same plane of theCu(110) as the neighboring (2 × 1) phase in the depression area (i.e.,region 5).
To confirm theheight differences of the two phasesmeasured above,we use DFT to calculate the atomic structures of the (2× 1) and c(6 × 2)phases. Fig. 3 shows the optimized DFT structures of the two oxygenat-ed surface phases. The (2 × 1) structure shows an added row (i.e., Cu–O–Cu chains along the [001] direction) structure with every other[001]Cu atom row absent, and the supercell consists of one Cu–O–Cuchain per two b110N(1 × 1) lattice spacings [20]. The slab comprising5 atomic layers has a thickness h= 5.16 Å (the slab thickness is definedas the distance between the lowest and highest atom positions alongthe direction perpendicular to the surface). For the c(6 ×2) structure,the supercell consists of two Cu–O–Cu chains along the [001] directionfor each three b110N(1 × 1) lattice spacings and these chains are con-nected by Cu atoms which are coordinated to every other O atomalong the Cu–O–Cu chains [21]. The thickness of the slab of 5 atomiclayers in this case is 5.84 Å. Therefore, the c(6 × 2) phase shows up asa protrusion elevated at ~0.68 Å from the adjacent (2 × 1) region ifthey are formed on the same face of the Cu surface. By comparing theSTM height profiles shown in Figs. 2(b, c), the DFT calculated surface

Fig. 3. (a) Atomic structures of the two DFT optimized surface phases of (2 × 1) and c(6 × 2). The surface heights between (2 × 1) and c(6 × 2) differ by ~0.68 Å. (b) Simulated STMmicrographsusing the structuralmodels of (2× 1) and c(6× 2) (shown in a), inwhichCu atoms are visible. (c) Experimental STM imagesof the (2× 1) and c(6× 2) reconstructed surfaces.For comparison, the unit cells are delineated in both simulated and experimental images in (b) and (c).
79Q. Liu et al. / Surface Science 627 (2014) 75–84
heights of the two phases match well with the experimental data. Forinstance, the height difference of 1.38 Å between areas 3 and 4 isequal to the single-atomic height step of the pristine Cu(110), whilethe height difference of ~0.65 Å between the (2 × 1) and c(6 × 2)formed on the same face of the Cu(110) (i.e., areas 5 and 6) agreeswell with the DFT result of the surface height difference of the twophases, and the height difference of 0.63 Å between areas 1 and 2 isalso very close to the height difference of the (2 × 1) and c(6 × 2)formed on the same Cu(110) face beneath. To provide more evidence,the DFT calculations of the (2 × 1) and c(6 × 2) structural modelsshown in Fig. 3a are also used to simulate constant–current STM imagesusing the Tersoff–Haman scheme [43] with a bias voltage of −1 V,which is within the range (−2–1.5 V) in the experiments. As can beseen in Figs. 3(b, c), the structural features revealed from the simulatedimages are similar to the experimental STM micrographs, where Cuatoms are visible in the simulated STM images. By comparing with thesimulated and experimental STM images as shown in Figs. 3(b, c), itcan be inferred that it is Cu atoms that are observed in the STM images.
It can be seen from Figs. 1 and 2 that the surface terraces becomehighly corrugated due to the increased oxygen exposure that leads tothe c(6 × 2) phase formation by consuming the existing (2 × 1)phase. The growth of the c(6 × 2) domains requires not only theconsumption of the existing (2 × 1) region but also the incorporationof new Cu atoms from the substrate, which can be from the terraceor step edges. The origin of such a process can be easily traced to thedifferent surface coverages of Cu and O atoms between the (2 × 1)and c(6 × 2) phases. As shown in Fig. 3, the surface coverages of CuandO for the (2× 1) reconstruction are θ=0.5, which can be translated
to an atomic surface density of 0.05/Å2; while for the c(6 × 2) re-construction, the surface coverages of Cu and O are θ=5/6 and 2/3, re-spectively, which correspond to the atomic surface densities of 0.09/Å2
and 0.07/Å2. Apparently, in addition to incorporating Cu and O atomsfrom the existing (2 × 1) phase, the (2 × 1)→ c(6 × 2) transformationrequires incorporation of new Cu and O atoms from the surrounding,where O atoms are supplied from the adsorbed oxygen for increased ox-ygen exposure, while Cu atoms are supplied from the immediatesources of terraces or step edges. It can be noted from Figs. 1(b and c)that the areas of the depressions are much larger than c(6 × 2) islands,suggesting that the initiation of these depressionsmay be related to theflux of impinging O2 molecules with respect to the density of Cu ad-atoms on the terraces and those from step edges. If the oxygen flux istoo large (i.e., higher oxygen pressure) while the supply of Cu adatomsfrom surface steps does not increase correspondingly, the formation ofthe Cu–O compounds requires another source of Cu atoms, namelythe terrace atoms. Then, monolayer depressions can be formed onthe terraces. One can see that the depression regions also develop the(2 × 1) reconstruction. When the c(6 × 2) phase appears, it enlargesthe depressions with the supply of Cu adatoms from the step edges ofthese depressions.
It is interesting to note from Fig. 2 that the (2 × 1) reconstructionoccurs also for the exposed fresh Cu surface in the depression areas.This further demonstrates that the (2 × 1) phase forms first on a cleanCu(110) surface preceding its transition to the c(6 × 2) phase withincreasing the oxygen surface coverage. Since the amount of oxygencoverage on a clean surface builds up gradually upon increasing theoxygen gas exposure and the (2 × 1) reconstruction occurs at the low

Fig. 4. Pictorial illustration of the (2 × 1)→ c(6 × 2) phase transition. The (2 × 1) phase forms first on the surfacewith a saturated oxygen coverage θ=0.5. Further oxygen uptake leads tothe nucleation and growth of c(6 × 2) islands by consuming the existing (2 × 1) phase with the supply of Cu adatoms from step edges of the depressions.
Fig. 5. Topographic STM images of Cu(110) surfaces oxidized at 100 °C: (a) pO2 = 1 × 10⁻⁸ Torr for 60 min (exposure= 36 L); (b) pO2 = 1 × 10⁻⁵ Torr for 4 min (exposure= 2,400 L);and (c, d) pO2 = 1 × 10⁻⁵ Torr for 30min (exposure = 18,000 L); insets are zoomed-in STM images revealing the atomic structure of the surface reconstructions at the different oxygenpressures. The tunneling conditions for the STM imaging are IT = 0.1–0.6 nA and VB = −1.5–1.5 V.
80 Q. Liu et al. / Surface Science 627 (2014) 75–84

81Q. Liu et al. / Surface Science 627 (2014) 75–84
oxygen coverage, it is clear that the c(6 × 2) reconstruction occurs via asequential pathway of the (2 × 1) → c(6 × 2) transition despite themagnitude of the oxygen gas pressure examined in our experiments.A pictorial illustration of the (2 × 1) → c(6 × 2) transition describedabove is given in Fig. 4.
To examine if the surface reconstructions and their phase transitionsobserved above at room temperature are also temperature dependent,we monitor the surface structures of the Cu(110) oxidized at anothertwo temperatures, one at 100 °C and the other at 350 °C. Fig. 5 illus-trates the STM images obtained from the oxidation at T = 100 °C withthe different oxygen exposures. Fig. 5(a) corresponds to the oxidationat pO2 = 1 × 10⁻⁸ Torr for 60 min (oxygen exposure = 36 L). It canbe seen that surface morphology is smooth including terrace areasand step edges; the step edges are aligned along the Cu[100] direction.Aligned long and bright stripes are also formed on the surface.Zoomed-in STM images as shown in the inset reveal that the entire sur-face is coveredmostly by the (2 × 1) phase co-existing with long brightstripes (the surface coverage of these long bright stripes is ~0.02). Thezoomed-in STM image shows that the long-bright stripe is alignedalong the (2 × 1)–Cu–O chain direction (i.e., [100]Cu), but the atomicstructure of these long bright stripes cannot be resolved clearly fromthe STM image. By comparing with the oxidation at room temperatureunder the same oxygen exposure of 36 L, where the (2 × 1) → c(6 ×2) phase transition has also taken place as shown in Fig. 1(b) andthe c(6 × 2) phase forms as tiny clusters with a surface coverage of
Fig. 6. Topographic STM images of Cu(110) oxidized at 350 °C under the different oxygen gas pres60min (exposure= 36 L); (c) p(O2)= 1× 10⁻⁶ Torr for 40min (exposure= 2,400 L); and (d) pshowing the atomic structures of the surface reconstructions at the different oxygen pressures. Th
~0.012, one can see that the same oxygen exposure (36 L) at 100 °Cdoes not show clear sign of c(6 × 2) formation.
Fig. 5(b) illustrates an STM image obtained from the Cu(110) surfaceoxidized under pO2=1× 10⁻⁵ Torr for 4minwith oxygen exposure=2400 L. The image reveals that the surface exhibits a large number ofdepressions across the terraces. Inset zoomed-in STM image showsthat the surface is covered by both (2 × 1) and c(6 × 2) phases, wherethe c(6 × 2) domains have relatively larger sizes than those formed atroom temperature under the same oxygen exposure, indicating theenhanced atom mobility at the higher temperature, thus promotingthe phase transition. Fig. 5(c) shows the surface oxidized at 100 °Cand pO2 = 1 × 10⁻⁵ Torr for 30 min (oxygen exposure = 18,000 L).Rather than forming small depressions as observed from the oxidationat room temperature and the low oxygen exposures, the surfaceobserved here shows large flat areas and narrow stripes across theterraces. Zoomed-in STM images as shown in Fig. 5(d) reveal that thesurface is now dominated by the c(6 × 2) phase with small stripes ofthe (2 × 1) phase, as compared to the much smaller coverage of thec(6 × 2) phase for the same oxygen exposure at room temperature.This growth morphology further demonstrates the enhanced kineticsof the phase transition at the higher temperature. These observationsalso demonstrate that the (2 × 1)→ c(6 × 2) phase transition is drivenby the oxygen surface coverage (i.e., thermodynamics aspect), while thekinetic aspect (i.e. temperature effect) of the phase transition becomesdominant once a critical oxygen coverage is reached.
sures: (a) p(O2)=5× 10⁻⁹ Torr for 10min (exposure=3 L); (b) p(O2)=1× 10⁻⁸ Torr for(O2)= 5× 10⁻⁵ Torr for 40min (exposure= 120,000 L). Insets are zoomed-in STM imagese tunneling conditions for the STM imaging are IT = 0.1–3 nA and VB =−2 to−0.3 V.

82 Q. Liu et al. / Surface Science 627 (2014) 75–84
Fig. 6 shows the oxidation of the Cu(110) surface at 350 °C withthe different oxygen exposures. Fig. 6(a) shows an STM image ob-tained from the surface exposed to pO2 = 5 × 10⁻⁹ Torr for10 min (exposure = 3 L). Inset is a high-resolution STM image re-vealing that the surface is only partially covered by well aligned periodicstripes of the (2 × 1) phase with bare Cu surface, which is similar to theoxidation at room temperature as shown in Fig. 1(a), but having a higherordered arrangement of the (2 × 1) stripes due to the enhancedmobilityof atoms at the elevated temperature.
Fig. 6(b) corresponds to the oxidation at pO2 = 1 × 10⁻⁸ Torrfor 60 min (oxygen exposure = 36 L). It can be seen that the surfacemorphology is smooth including terrace areas and step edges; thestep edges are aligned along the Cu[100] direction. Zoomed-in STMimages as shown in the inset reveal that the entire surface is coveredby the (2 × 1) phase. By comparing with the oxidation at roomtemperature under the same oxygen exposure of 36 L, where the (2 ×1) → c(6 × 2) phase transition has already started as shown inFig. 1(b), this oxygen exposure (36 L) at 350 °C still does not reach theoxygen surface coverage required for the formation of the c(6 × 2)phase. This is also the case for the same amount (36 L) of oxygen expo-sure at 100 °C as shown in Fig. 5(b). This differencemay be attributed tothe temperature effect on the effective oxygen surface sticking probabil-ity, where the effect from the surface morphology of the Cu(110)surface can be minor since all the oxygen dosing starts with freshlycleaned Cu(110) surfaces with similar surface morphology features(terrace width, step height, etc.). The higher temperature usuallyleads to a smaller effective oxygen sticking coefficient, and thus a largeroxygen exposure is needed for the phase transition.
Fig. 6(c) shows an STM image of the Cu(110) surface oxidizedunder a higher oxygen exposure of pO2 = 1 × 10⁻⁶ Torr for 40 min(exposure = 2400 L) at 350 °C. It can be seen that the surfaces in thiscase have atomically smooth step edges andflat terraces, that is dramat-ically different from the surfaces oxidized at the lower temperatureswith the same amount of oxygen exposure, which are corrugated withhigh densities of depressions due to the co-existing (2 × 1) and c(6 ×2) phases [c.f. Figs. 1(c) and 5(b)]. High-resolution STM images asshown in the inset reveal that the entire surface is fully covered by thec(6 × 2) phase only. This further supports the earlier observations thatthe kinetics of the (2 × 1) → c(6 × 2) transition are greatly enhancedat higher temperature once the critical oxygen coverage is reached forthe phase transition. Fig. 6(d) illustrates an STM image obtained fromthe Cu(110) surface oxidized at 350 °C with the significantly increasedoxygen exposure under pO2 = 5 × 10⁻⁵ Torr for 40 min (exposure =120,000 L), which exhibits similarly atomically smooth step edges andflat terraces as shown in Fig. 6(c). Inset in Fig. 6(d) shows a high-resolution STM image demonstrating that the entire surface is fully cov-ered by the c(6 × 2) phase only despite the increased oxygen exposure,suggesting that the surface is saturated with the c(6 × 2) phase and isinert toward further oxidation to form the bulk Cu2O phase.
The STM observations described above reveal clearly that a criticaloxygen surface coverage is required for the (2 × 1) → c(6 × 2) transi-tion. Increasing the oxidation temperature results in a smaller effectiveoxygen sticking coefficient and thus a larger oxygen exposure to reachthe required oxygen coverage for the phase transition. This demon-strates that the (2 × 1)→ c(6 × 2) transition is driven by the thermody-namics of oxygen coverage. The question arises if the observed surfacestructures are thermodynamically stable phases under the range of Tand pO2 examined. To identify the microscopic origin of the evolutionof the surface structures observed above, we employ a first-principlesatomistic thermodynamic framework to assess the relative stability ofthe (2 × 1) and c(6 × 2) structures as a function of pO2 and T. UsingDFT calculations, we computed the oxygen binding energy at theoxygen surface coverage of θ = 0.5 corresponding to the (2 × 1) struc-ture, and θ=2/3 corresponding to the c(6 × 2) structure. The obtainedvalues are−2.12 [−2.72] and−2.00 [−2.59] eV for θ=0.5 and θ=2/3,respectively. For each surface reconstruction, we show two values where
the first one is calculated using the total computed DFT energy of O2,while the second value between the parentheses is obtained using the“experimentally-corrected” total energy of O2. The first set of values ob-tained with the total DFT energy of O2 (i.e., −2.12 and −2.0 eV for θ =0.5 and θ=2/3, respectively) are in good agreement with the previouslyreported values of −2.00 and −1.87 eV respectively in ref. [13]. UsingEq. (4), we then calculated the surface free energy for a given T and pO2
by assuming the full thermodynamic equilibrium of the surface with theoxygen gas. For a given T and pO2, the preferred surface that we shouldexpect to observe experimentally is the one having the lowest surfacefree energy under these conditions.
The analysis above leads to the phase stability diagrams. Fig. 7(a)shows the free energies of the considered surface structures plot-ted against the oxygen chemical potential μO. Here we used theexperimentally-corrected total energy of O2 (using the computed DFTenergy of O2 instead would result in a shift of 0.6 eV along the chemicalpotential horizontal axis of Fig. 7(a)). The upper and lower limits of theoxygen chemical potential for clean Cu(110) surface and the formationof bulk Cu2O are also determined. In between these two limits, the freeenergy lines of the more stable reconstructed surface structures inter-sect one another and their intersection points on the μ axis define theconditions under which a phase changes from one minimum surfacefree energy to another. The μ scale can be thus divided into severaldistinct regions in which clean and the two oxygenated surface struc-tures are thermodynamically stable. The phase stability diagramshows a transition of the clean surface into the (2 × 1) phase at ΔμO =−2.12 [−2.72] eV. As the oxygen chemical potential increases toΔμO = −1.62 [−2.22] eV, the thermodynamic preference changesfrom the (2 × 1) to c(6 × 2) reconstructions. The c(6 × 2) reconstruc-tion is the stable phase up to ΔμO = −1.46 [−2.06] eV of the calcu-lated bulk oxide limit, whereas using PBE exchange–correlationfunctional, this value is determined to be −1.40 [−1.87] eV, andLDA yields −1.60 [−2.98] eV. Fig. 7(b) shows the (pO2, T) phasediagram with the distinct surface phases obtained by translatingthe μ boundaries into the temperature and oxygen pressure depen-dence, where both PW91 and PBE results are shown in solid blackcurves and dotted blue curves, respectively.
The phase diagram shows the clean Cu surface oxidizes first to theadded-row (2 × 1) phase and then to c(6 × 2) upon further oxidation,a trend that is in general agreement with experimental results. How-ever, as can be seen from the phase diagram, the (2 × 1) and c(6 × 2)phases form at oxygen chemical potentials far above the chemical po-tential for Cu2O formation over thewhole pO2 and T regime investigatedin our study. Under equilibrium conditions, and for the oxidation at27 °C, 100 °C and 350 °C, the phase diagram shows that Cu2O shouldalready form at pO2 ~1 × 10−57, ~7 × 10−44, and ~9 × 10⁻²¹ Torr,respectively. Additionally, for 27 °C, 100 °C and 350 °C, the oxygengas pressures for the (2 × 1) → c(6 × 2) phase transition are pO2 ~5 ×10−63, ~4 × 10−48, and ~2× 10⁻²³ Torr, respectively. These boundariesin the oxygen pressure are far lower than accessed experimentally. Forinstance, the experimental value of the oxygen pressure at which weobserved the (2 × 1) → c(6 × 2) phase transition at T = 27 °C for thesufficient oxygen exposure is pO2 ~1 × 10⁻⁸ Torr, which is significantlyhigher than the theoretical oxygen pressure of 5 × 10−63 Torr. Using agas mixture (e.g. O2 + Ar) may allow for a much lower oxygen partialpressure in the experiments, but the formation of a (2 × 1) reconstruct-ed layer under very lowoxygen partial pressurewould be on a timescaleinaccessible by the experiments. However, once the (2 × 1) reconstruc-tion is formed under a higher oxygen pressure (e.g., 1 × 10⁻⁸ Torr), itdoes not disappear under UHV at a base pressure of 1 × 10⁻¹¹ Torr inthe chamber, suggesting that the rate of oxygen desorption from thesurface is very small and the system is far from equilibrium.
The phase diagram obtained using PBE exchange–correlation func-tional agrees slightly better with the experiments, but the discrepancyis still significant, while LDA phase diagram displays appreciabledownward shift compared with that obtained by PW91 functional,
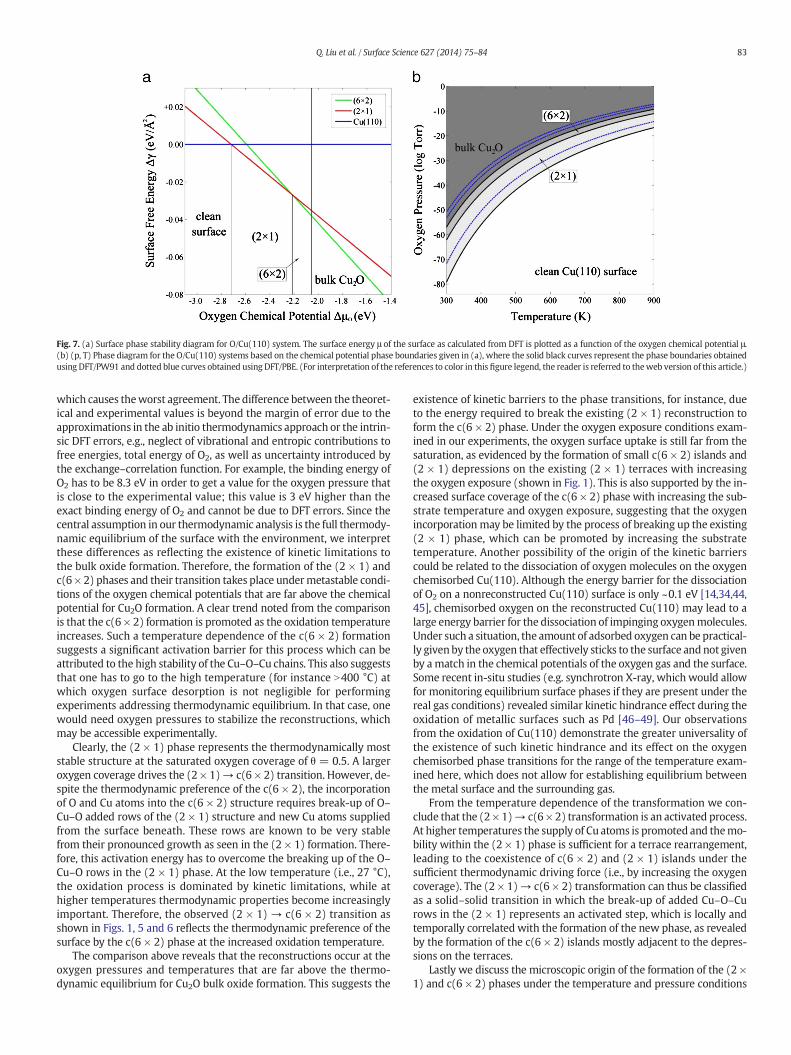
Fig. 7. (a) Surface phase stability diagram for O/Cu(110) system. The surface energy μ of the surface as calculated from DFT is plotted as a function of the oxygen chemical potential μ.(b) (p, T) Phase diagram for the O/Cu(110) systems based on the chemical potential phase boundaries given in (a), where the solid black curves represent the phase boundaries obtainedusing DFT/PW91 and dotted blue curves obtained using DFT/PBE. (For interpretation of the references to color in this figure legend, the reader is referred to theweb version of this article.)
83Q. Liu et al. / Surface Science 627 (2014) 75–84
which causes theworst agreement. The difference between the theoret-ical and experimental values is beyond the margin of error due to theapproximations in the ab initio thermodynamics approach or the intrin-sic DFT errors, e.g., neglect of vibrational and entropic contributions tofree energies, total energy of O2, as well as uncertainty introduced bythe exchange–correlation function. For example, the binding energy ofO2 has to be 8.3 eV in order to get a value for the oxygen pressure thatis close to the experimental value; this value is 3 eV higher than theexact binding energy of O2 and cannot be due to DFT errors. Since thecentral assumption in our thermodynamic analysis is the full thermody-namic equilibrium of the surface with the environment, we interpretthese differences as reflecting the existence of kinetic limitations tothe bulk oxide formation. Therefore, the formation of the (2 × 1) andc(6 × 2) phases and their transition takes place undermetastable condi-tions of the oxygen chemical potentials that are far above the chemicalpotential for Cu2O formation. A clear trend noted from the comparisonis that the c(6 × 2) formation is promoted as the oxidation temperatureincreases. Such a temperature dependence of the c(6 × 2) formationsuggests a significant activation barrier for this process which can beattributed to the high stability of the Cu–O–Cu chains. This also suggeststhat one has to go to the high temperature (for instance N400 °C) atwhich oxygen surface desorption is not negligible for performingexperiments addressing thermodynamic equilibrium. In that case, onewould need oxygen pressures to stabilize the reconstructions, whichmay be accessible experimentally.
Clearly, the (2 × 1) phase represents the thermodynamically moststable structure at the saturated oxygen coverage of θ = 0.5. A largeroxygen coverage drives the (2 × 1)→ c(6 × 2) transition. However, de-spite the thermodynamic preference of the c(6 × 2), the incorporationof O and Cu atoms into the c(6 × 2) structure requires break-up of O–Cu–O added rows of the (2 × 1) structure and new Cu atoms suppliedfrom the surface beneath. These rows are known to be very stablefrom their pronounced growth as seen in the (2 × 1) formation. There-fore, this activation energy has to overcome the breaking up of the O–Cu–O rows in the (2 × 1) phase. At the low temperature (i.e., 27 °C),the oxidation process is dominated by kinetic limitations, while athigher temperatures thermodynamic properties become increasinglyimportant. Therefore, the observed (2 × 1) → c(6 × 2) transition asshown in Figs. 1, 5 and 6 reflects the thermodynamic preference of thesurface by the c(6 × 2) phase at the increased oxidation temperature.
The comparison above reveals that the reconstructions occur at theoxygen pressures and temperatures that are far above the thermo-dynamic equilibrium for Cu2O bulk oxide formation. This suggests the
existence of kinetic barriers to the phase transitions, for instance, dueto the energy required to break the existing (2 × 1) reconstruction toform the c(6 × 2) phase. Under the oxygen exposure conditions exam-ined in our experiments, the oxygen surface uptake is still far from thesaturation, as evidenced by the formation of small c(6 × 2) islands and(2 × 1) depressions on the existing (2 × 1) terraces with increasingthe oxygen exposure (shown in Fig. 1). This is also supported by the in-creased surface coverage of the c(6 × 2) phase with increasing the sub-strate temperature and oxygen exposure, suggesting that the oxygenincorporation may be limited by the process of breaking up the existing(2 × 1) phase, which can be promoted by increasing the substratetemperature. Another possibility of the origin of the kinetic barrierscould be related to the dissociation of oxygen molecules on the oxygenchemisorbed Cu(110). Although the energy barrier for the dissociationof O2 on a nonreconstructed Cu(110) surface is only ~0.1 eV [14,34,44,45], chemisorbed oxygen on the reconstructed Cu(110) may lead to alarge energy barrier for the dissociation of impinging oxygenmolecules.Under such a situation, the amount of adsorbed oxygen can be practical-ly given by the oxygen that effectively sticks to the surface andnot givenby amatch in the chemical potentials of the oxygen gas and the surface.Some recent in-situ studies (e.g. synchrotron X-ray, which would allowfor monitoring equilibrium surface phases if they are present under thereal gas conditions) revealed similar kinetic hindrance effect during theoxidation of metallic surfaces such as Pd [46–49]. Our observationsfrom the oxidation of Cu(110) demonstrate the greater universality ofthe existence of such kinetic hindrance and its effect on the oxygenchemisorbed phase transitions for the range of the temperature exam-ined here, which does not allow for establishing equilibrium betweenthe metal surface and the surrounding gas.
From the temperature dependence of the transformation we con-clude that the (2 × 1)→ c(6 × 2) transformation is an activated process.At higher temperatures the supply of Cu atoms is promoted and themo-bility within the (2 × 1) phase is sufficient for a terrace rearrangement,leading to the coexistence of c(6 × 2) and (2 × 1) islands under thesufficient thermodynamic driving force (i.e., by increasing the oxygencoverage). The (2 × 1)→ c(6 × 2) transformation can thus be classifiedas a solid–solid transition in which the break-up of added Cu–O–Curows in the (2 × 1) represents an activated step, which is locally andtemporally correlated with the formation of the new phase, as revealedby the formation of the c(6 × 2) islands mostly adjacent to the depres-sions on the terraces.
Lastly we discuss the microscopic origin of the formation of the (2 ×1) and c(6 × 2) phases under the temperature and pressure conditions
84 Q. Liu et al. / Surface Science 627 (2014) 75–84
where the formation of Cu2O bulk oxide is energetically more favorable.Thermodynamically, Cu2O phase should set in after the c(6 × 2) phaseonce the oxygen chemical potential is increased to −1.46 [−2.06] eV.However, the transition from an oxygen chemisorbed phase to thebulk oxide is an activated process involving incorporation of oxygeninto the subsurface region [46,50–56], which imposes the high kineticbarriers toward the bulk oxide formation, and therefore a significantlylarge oxygen gas pressure is needed to nucleate Cu2O on the surface[57–59]. As a result, the kinetically more favorable processes of surfacediffusion of O and Cu atoms lead to the formation of either (2 × 1) orc(6 × 2) phase. Such a two-dimensional oxygen-terminated layer cannot only further hamper oxygen dissociation but also impede oxygensubsurface diffusion, thereby stabilizing the oxygenated surface underthe metastable environmental conditions.
4. Conclusion
The surface reconstructions induced by oxygen chemisorption duringthe initial oxidation of Cu(110) surface are examined by STM measure-ments under a wide range of oxygen gas exposures at different tempera-tures and oxygen pressures varying from 1× 10⁻¹⁰ to 5 × 10⁻⁵ Torr. It isshown that the reaction proceeds in a sequential manner. The (2 × 1) re-construction occurs first at the low oxygen coverage with a saturated ox-ygen coverage of θ=0.5. Increasing the oxygen coverage beyond θ=0.5drives the (2 × 1)→ c(6 × 2) transition. Due to its larger Cu surface cov-erage, the formation of the c(6 × 2) requires not only the consumption ofthe existing (2 × 1) phase but also the incorporation of underlying Cuatoms that results in the formation of depressions on the surface terraces.Increasing the oxidation temperature leads to a smaller effective oxygensticking coefficient and thus a larger oxygen exposure needed to reachthe critical oxygen surface coverage for the surface phase transition. Thetemperature dependence of the phase transition demonstrates that thesurface phase transition is an activated process associated with breakingup the added Cu–O–Cu rows in the (2 × 1) reconstruction. The differencebetween the experimental observations and the theoretical phasediagram obtained from the first-principles thermodynamics calculationsreveals that the formation of both (2 × 1) and c(6 × 2) phases takesplace under metastable conditions of oxygen chemical potentials thatfavors Cu2O formation, demonstrating the existence of kinetic limitationsto the surface phase transition.
Acknowledgment
This work was supported by the U.S. Department of Energy, Office ofBasic Energy Sciences, Division of Materials Sciences and Engineeringunder award no. DE-FG02-09ER46600. The authors thankN.P. Guisingerfor helpwith the experiments. Use of the Center for NanoscaleMaterialswas supported by the U.S. Department of Energy, Office of Science, Of-fice of Basic Energy Sciences, under contract no. DE-AC02-06CH11357.This work used the Extreme Science and Engineering Discovery Envi-ronment (XSEDE), which is supported by National Science Foundationgrant number OCI-1053575.
References
[1] H. Over, Y.D. Kim, A.P. Seitsonen, S. Wendt, E. Lundgren, M. Schmid, P. Varga, A.Morgante, G. Ertl, Science 287 (2000) 1474.
[2] R. Westerstrom, J. Gustafson, A. Resta, A. Mikkelsen, J.N. Andersen, E. Lundgren, N.Seriani, F. Mittendorfer, M. Schmid, J. Klikovits, P. Varga, M.D. Ackermann, J.W.M.Frenken, N. Kasper, A. Stierle, Phys. Rev. B 76 (2007) 155410.
[3] J.A. Rodriguez, P. Liu, J. Hrbek, J. Evans, M. Perez, Angew. Chem. Int. Ed. 46 (2007)1329.
[4] T. Tabakova, V. Idakiev, J. Papavasiliou, G. Avgouropoulos, T. Loannides, Catal.Commun. 8 (2007) 101.
[5] C. Ammon, A. Bayer, G. Held, B. Richer, L. Schmidt, H. Steinruck, Surf. Sci. 507 (2002)845.
[6] P.J. Godowski, J. Onsgaard, A. Gagor, M. Kondys, Z.S. Li, Chem. Phys. Lett. 406 (2005)441.
[7] O. Ilinich, W. Ruettinger, X.S. Liu, R. Farrauto, J. Catal. 247 (2007) 112.[8] C. Stampfl, Catal. Today 105 (2005) 17.[9] C. Stampfl, M.V. Ganduglia-Pirovano, K. Reuter, M. Scheffler, Surf. Sci. 500 (2002)
368.[10] L. Guillemot, K. Bobrov, Phys. Rev. B 83 (2011) 075409.[11] K. Bobrov, L. Guillemot, Surf. Sci. 604 (2010) 1894.[12] K. Bobrov, L. Guillemot, Phys. Rev. B 78 (2008) 121408(R).[13] X. Duan, O. Warschkow, A. Soon, B. Delley, C. Stampfl, Phys. Rev. B 81 (2010)
075430.[14] L.D. Sun, M. Hohage, R. Denk, P. Zeppenfeld, Phys. Rev. B 76 (2007) 245412.[15] L.D. Sun, M. Hohage, P. Zeppendfeld, Phys. Rev. B 69 (2004) 045407.[16] F. Besenbacher, J.K. Norskov, Prog. Surf. Sci. 44 (1993) 5.[17] F.M. Chua, Y. Kuk, P.J. Silverman, Phys. Rev. Lett. 63 (1989) 386.[18] K. Kern, H. Niehaus, A. Schatz, P. Zeppendfeld, J. Goerge, G. Comsa, Phys. Rev. Lett. 67
(1991) 855.[19] D.J. Coulman, J. Wintterlin, J.V. Barth, G. Ertl, Surf. Sci. 240 (1990) 151.[20] D.J. Coulman, J. Wintterlin, R.J. Behm, G. Ertl, Phys. Rev. Lett. 64 (1990) 1761.[21] R. Feidenhans, F. Grey, M. Nielsen, F. Besenbacher, F. Jensen, E. Laegsgaard, I.
Stensgaard, K.W. Jacobsen, J.K. Norskov, R.L. Johnson, Phys. Rev. Lett. 65 (1990)2027.
[22] F. Jensen, F. Besenbacher, E. Lasgaard, Phys. Rev. B 41 (1990) 10233.[23] N. Hartmann, R.J. Madix, Surf. Sci. 488 (2001) 107.[24] J.P. Perdew, J.A. Chevary, S.H. Vosko, K.A. Jackson, M.R. Pederson, D.J. Singh, C.
Fiolhais, Phys. Rev. B 46 (1992) 6671.[25] G. Kresse, J. Furthmuller, Phys. Rev. B 54 (1996) 11169.[26] G. Kresse, J. Furthmuller, Comput. Mater. Sci. 6 (1996) 15.[27] G. Kresse, J. Hafner, Phys. Rev. B 49 (1994) 14251.[28] G. Kresse, D. Joubert, Phys. Rev. B 59 (1999) 1758.[29] P.E. Blochl, Phys. Rev. B 50 (1994) 17953.[30] H.J. Monkhorst, J.D. Pack, Phys. Rev. B 13 (1976) 5188.[31] M. Methfessel, A.T. Paxton, Phys. Rev. B 40 (1989) 3616.[32] N.W. Ashcroft, N.D. Mermin, Solid State Physics, Thomson Learning, 1976.[33] T. Kangas, K. Laasonen, Surf. Sci. 602 (2008) 3239.[34] M. Alatalo, S. Jaatinen, P. Salo, K. Laasonen, Phys. Rev. B 70 (2004) 245417.[35] S.Y. Liem, G. Kresse, J.H.R. Clarke, Surf. Sci. 415 (1998) 194.[36] D.R. Stull, H. Prophet, JANAF Thermochemical Tables, National Standard Reference
Data System, 1971.[37] W.A. Saidi, M.Y. Lee, L. Li, G.W. Zhou, A.J.H. McGaughey, Phys. Rev. B 86 (2012)
245429.[38] K. Reuter, M. Scheffler, Phys. Rev. B 68 (2003) 045407.[39] B. Hammer, L.B. Hansen, J.K. Norskov, Phys. Rev. B 59 (1999) 7413.[40] J.P. Perdew, K. Burke, M. Ernzerhof, Phys. Rev. Lett. 77 (1996) 3865.[41] C. Herring, in: W.E. Kingston (Ed.), Physics of Powder Metallurgy, McGrall-Hill
Books, New York, 1951.[42] J.P. Perdew, A. Zunger, Phys. Rev. B 23 (1981) 5048.[43] J. Tersoff, D.R. Hamann, Phys. Rev. B 31 (1985) 805.[44] J.Y. Ge, J.Q. Dai, Z.H. Zhang, J. Phys. Chem. 100 (1996) 11432.[45] S.Y. Liem, J.H.R. Clark, G. Kresse, Comput. Mater. Sci. 17 (2000) 133.[46] E. Lundgren, J. Gustafson, A. Mikkelsen, J.N. Andersen, A. Stierle, H. Dosch, M.
Todorova, J. Rogal, K. Reuter, M. Scheffler, Phys. Rev. Lett. 92 (2004) 046101.[47] A. Vlad, A. Stierle, M. Marsman, G. Kresse, I. Costina, H. Dosch, M. Schmid, P. Varga,
Phys. Rev. B 81 (2010) 115402.[48] R. Westerstrom, C.J. Weststrate, J. Gustafson, A. Mikkelsen, J. Schnadt, J.N. Andersen,
E. Lundgren, N. Seriani, F. Mittendorfer, G. Kresse, A. Stierle, Phys. Rev. B 80 (2009)125431.
[49] R. Westerstrom, C.J. Weststrate, A. Resta, A. Mikkelsen, J. Schnadt, J.N. Andersen, E.Lundgren, M. Schmid, N. Seriani, J. Harl, F. Mittendorfer, G. Kresse, Surf. Sci. 602(2008) 2440.
[50] G. Ketteler, D.F. Ogletree, H. Bluhm, H.J. Liu, E.L.D. Hebenstreit, M. Salmeron, J. Am.Chem. Soc. 127 (2005) 18269.
[51] R. Blume, H. Niehaus, H. Conrad, A. Bottcher, L. Aballe, L. Gregoratti, A. Barinov, M.Kiskinova, J. Phys. Chem. B 109 (2005) 14052.
[52] P. Dudin, A. Barinov, L. Gregoratti, M. Kriskinova, F. Esch, C. Dri, C. Africh, G. Comelli,J. Phys. Chem. B 109 (2005) 13649.
[53] M. Todorova, W.X. Li, M.V. Ganduglia-Pirovano, C. Stampfl, K. Reuter, M. Scheffler,Phys. Rev. Lett. 89 (2002) 096103.
[54] M.Y. Lee, A.J.H. McGaughey, Surf. Sci. 603 (2009) 3404.[55] M.Y. Lee, A.J.H. McGaughey, Surf. Sci. 604 (2010) 1425.[56] Z.H. Gu, P.B. Balburena, J. Phys. Chem. C 111 (2007) 9877.[57] K. Lahtonen, M. Hirsimaki, M. Lampimaki, M. Valden, J. Chem. Phys. 129 (2008)
124703.[58] G.W. Zhou, Phys. Rev. B 81 (2010) 195440.[59] J.A. Eastman, P.H. Fuoss, L.E. Rehn, P.M. Baldo, G.W. Zhou, D.D. Fong, L.J. Thompson,
Appl. Phys. Lett. 87 (2005) 051914.