oxygen consumption and heart rate responses to a …
TRANSCRIPT

OXYGEN CONSUMPTION AND HEART RATE RESPONSES TO A SIMULATED ICE HOCKEY GAME IN COMPETITIVE YOUTH PLAYERS WITH TYPE 1 DIABETES MELLITUS: NO EVIDENCE FOR ANY CARDIORESPIRATORY DYSFUNCTION
Deandra Elizabeth Filippo
A thesis submitted to the Faculty of Graduate Studies in partial fulfillment of the requirements for the degree of Master of Science
Graduate program in
Kinesiology and Health Science
York University
Toronto, Ontario.
August 2015
© Deandra E. Filippo, 2015

ii
Abstract
The objective of this study was to investigate oxygen consumption (VO2) and heart rate
(HR) response in competitive youth athletes without (ND) and with type 1 diabetes mellitus
(T1D) during a simulated hockey game (SHG). There were no significant differences in the nadir,
mean, peak %VO2max and %HRmax values across the 3 periods of the SHG between T1D and
ND (n=13) (p>0.05). Significant differences (p<0.05) for the within T1D and ND group analysis
are attributed to self-selected pacing during the play shifts and active recovery components of
the SHG. It is concluded that athletic adolescents with T1D achieve similar VO2max and HRmax
values plus exhibit similar VO2 and HR responses during a SHG when compared to matched ND.
Therefore adolescents with uncomplicated T1D can participate in sports; exercise and non-
exercise physical activity at the same level as their ND counterparts, and not be limited by
diabetes.
iii
Acknowledgements
The journey throughout this process did not come without its challenges, and I am
extremely grateful for the unwavering support provided from those around me.
I would like to express my sincere gratitude to my supervisor Dr. Roni Jamnik, whom
without this thesis would not have been possible. Words cannot describe how grateful I am for
the opportunities you have provided me with. Thank you for your ongoing support, your
patience, motivation, enthusiasm and immense knowledge. Your guidance and the confidence
you held in me have been key to my success. Along with Roni, I would like to extend my thanks
to Dr. Michael C. Riddell, both who have an inspiring passion for research. Thank you for
helping shape and clarify ideas as well as, provide insight and invaluable constructive criticism
during the project work.
I would also like to thank Lisa Miadovnik, who I had the pleasure of working/collecting
the data with. Thank you to the students from the York University Human Performance
Laboratory who volunteered to assist with the data collection, your help was invaluable and
made the process much more enjoyable. To all of my lab mates, thank you for always offering
your time and a helping hand. Chip and Robbie, thank you for assisting me whenever I have
asked for help, for all of your advice, and always assuring me that I will do great.
Finally, I would like to thank my family and friends who have been very encouraging,
understanding, and sympathetic throughout the ups and downs during the past couple of years.
Thanks you for always believing in me and for all of the love and support, it means the world!

iv
TABLE OF CONTENTS
Abstract ii
Acknowledgements iii
Table of Contents iv
List of Tables vi
List of Figures viii
Symbols and Definitions x
Chapter 1: Literature Review 1
1.0 Type 1 Diabetes Mellitus 1 1.1 Type 1 Diabetes and Physical Activity 2 1.2 Type 1 Diabetes and Metabolic Response to Non-Exercise and Exercise Physical Activity 4 1.3 Oxygen Uptake during Rest and Physical Activity 8 1.4 Oxygen Uptake and Type 1 Diabetes 9 1.5 Oxygen Uptake Kinetics 11 1.5.1 A Brief History of Oxygen Uptake Kinetics 12 1.5.2 Traditional Method of Measuring Oxygen Uptake Kinetics 13 1.6 Oxygen Uptake Kinetics and Type 1 Diabetes 17 1.7 Oxygen Uptake Kinetics and Exercise 19 1.8 High-Intensity Intermittent Exercise 20 1.9 High Intensity Intermittent Exercise and Type 1 Diabetes 21 1.10 Heart Rate Kinetics 23 1.11 Type 1 Diabetes and Hockey 25
Chapter 2: Oxygen Consumption and Heart Rate Responses to a Simulated Ice Hockey Game in Competitive Youth Players with Type 1 Diabetes Mellitus: No Evidence for any Cardiorespiratory Dysfunction 27
2.0 Purpose and Objective 28
2.1 Methods 28 2.1.1 Study Participants and Recruitment 29 2.1.2 Laboratory Physical and Physiological Fitness Assessment 30
2.1.3 Laboratory Simulation Hockey Game Protocol 34 2.1.4 Data and Statistical Analysis of the VO2 and HR Response 36
2.2 Results 37 2.2.1 Study Participants’ Characteristics 37 2.2.2 Laboratory Simulation Hockey Game Protocol 40 2.2.3 Raw Data 43
2.2.4 Averaged Nadir and Peak %VO2max and HRmax During the Play Shift Intervals 49

v
2.3 Discussion 60
2.4 Limitations 71
2.5 Implications 73
2.6 References 75 2.7 Appendices 90
Appendix A: Recruitment Poster 90 Appendix B: 2015 PAR-Q+ 91 Appendix C: Consent Forms 95 Appendix D: Simulation Hockey Game Protocol 101 Appendix E: Additional Tables and Figures 103

vi
LIST OF TABLES
Table 1. Summary of the studies investigating aerobic fitness measured via VO2max
values in children, non-athletic and athletic youth with and without T1D 10
Table 2. Anthropometric and physical plus physiological fitness profiles of competitive
youth ice hockey players with and without T1D (M ± SD) 38
Table 3. The mean breath-by-breath %VO2max and %HRmax for all 3 periods of the
simulation hockey game for competitive youth ice hockey players with and without
T1D (M ± SE) 43
Table 4. The mean breath-by-breath %VO2max and %HRmax between periods of a
simulation hockey game for competitive youth ice hockey players with and without
T1D (M ± SE) 46
Table 5. Comparison of the average oxygen consumption expressed relative to
VO2max at the beginning and end of each play shift and bench interval during a
60-minute simulation hockey game between competitive youth ice hockey players
with and without T1D (M ± SE) 51
Table 6. Comparison of the average heart rate expressed relative to HRmax at the
beginning and end of each play shift and bench interval during a 60-minute simulation
hockey game between competitive youth ice hockey players with and without T1D (M ± SE) 52
Table 7. Mean resting oxygen consumption expressed relative to VO2max and mean
resting heart expressed relative to HRmax between periods for competitive youth
ice hockey players with and without T1D (M ± SE) 56
Appendices:
Table A1. Anthropometric and physical plus physiological fitness profiles of
competitive youth ice hockey players with T1D 103
Table A2. Anthropometric and physical plus physiological fitness profiles of
competitive youth ice hockey players without T1D 104
Table A3. Comparison of the average nadir and peak oxygen consumption rate
expressed relative to VO2max, in response to a simulation hockey game between
individuals with and without T1D (M ± SD) 109
vii
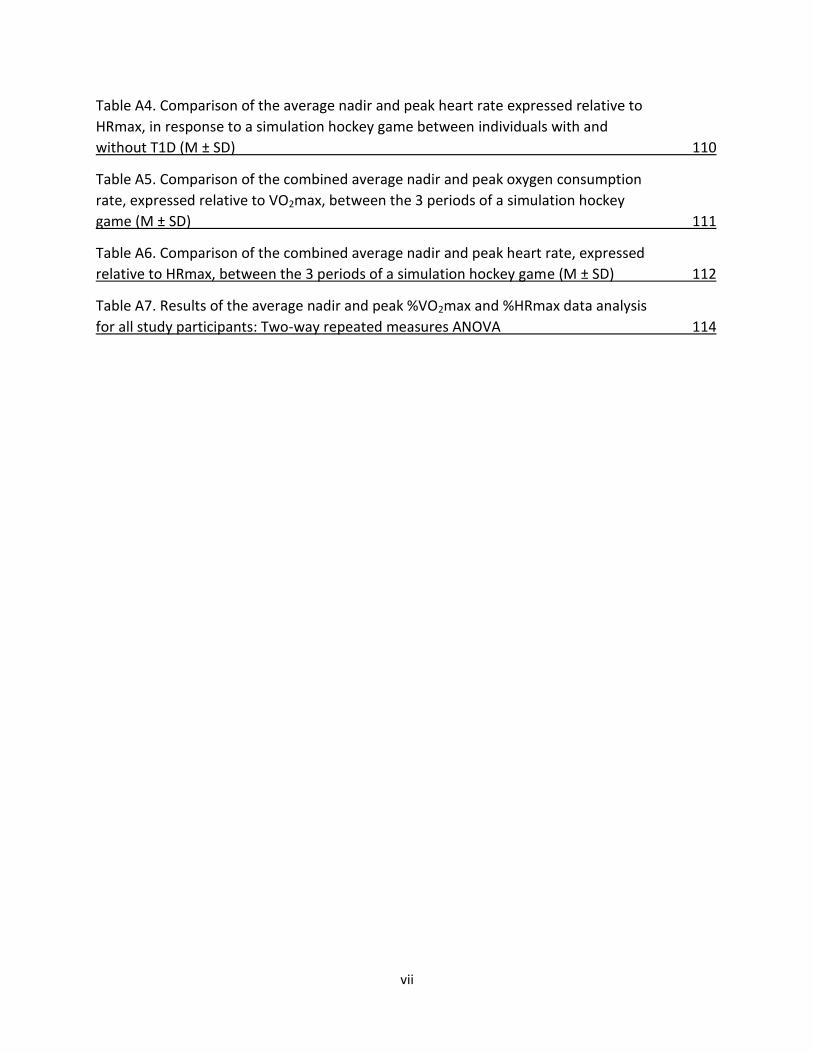
Table A4. Comparison of the average nadir and peak heart rate expressed relative to
HRmax, in response to a simulation hockey game between individuals with and
without T1D (M ± SD) 110
Table A5. Comparison of the combined average nadir and peak oxygen consumption
rate, expressed relative to VO2max, between the 3 periods of a simulation hockey
game (M ± SD) 111
Table A6. Comparison of the combined average nadir and peak heart rate, expressed
relative to HRmax, between the 3 periods of a simulation hockey game (M ± SD) 112
Table A7. Results of the average nadir and peak %VO2max and %HRmax data analysis
for all study participants: Two-way repeated measures ANOVA 114
viii
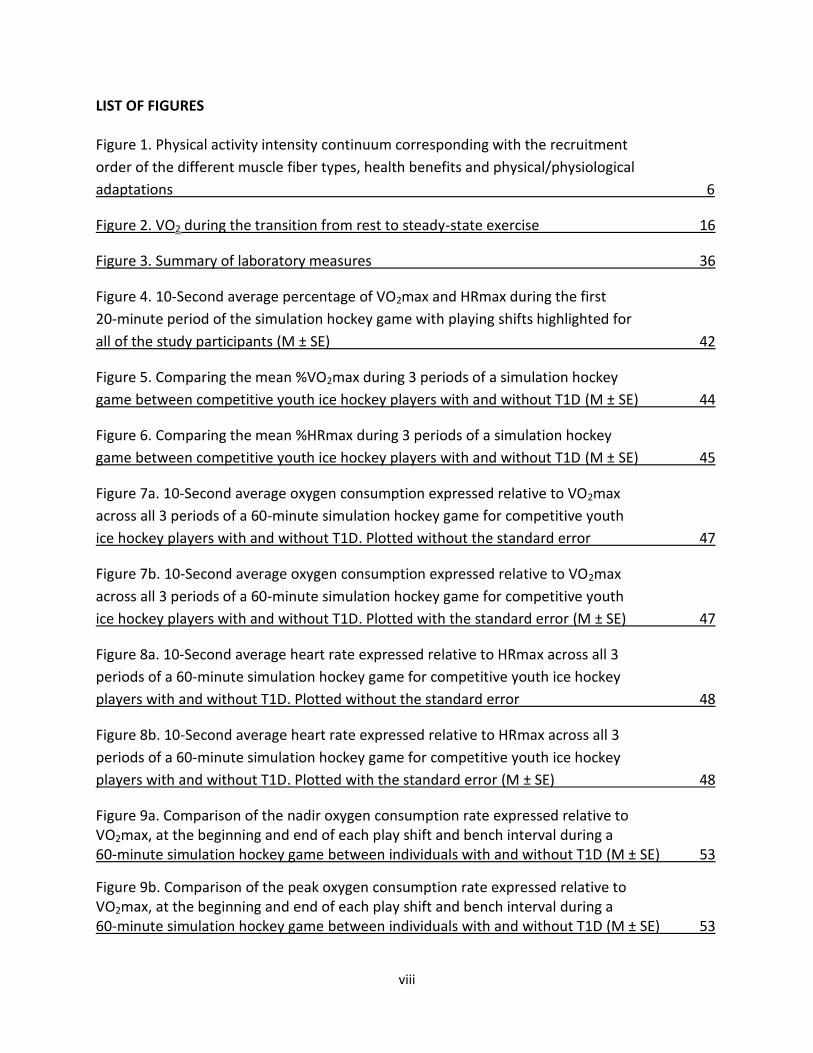
LIST OF FIGURES Figure 1. Physical activity intensity continuum corresponding with the recruitment
order of the different muscle fiber types, health benefits and physical/physiological
adaptations 6
Figure 2. VO2 during the transition from rest to steady-state exercise 16
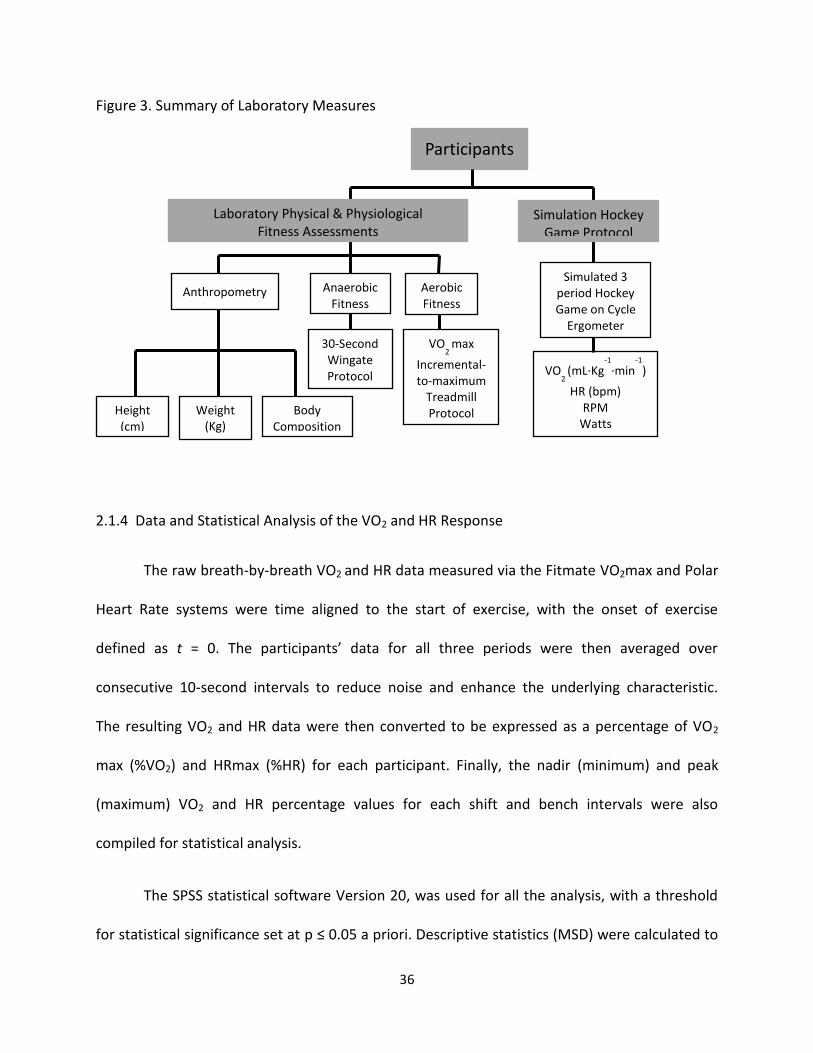
Figure 3. Summary of laboratory measures 36
Figure 4. 10-Second average percentage of VO2max and HRmax during the first
20-minute period of the simulation hockey game with playing shifts highlighted for
all of the study participants (M ± SE) 42
Figure 5. Comparing the mean %VO2max during 3 periods of a simulation hockey
game between competitive youth ice hockey players with and without T1D (M ± SE) 44
Figure 6. Comparing the mean %HRmax during 3 periods of a simulation hockey
game between competitive youth ice hockey players with and without T1D (M ± SE) 45
Figure 7a. 10-Second average oxygen consumption expressed relative to VO2max
across all 3 periods of a 60-minute simulation hockey game for competitive youth
ice hockey players with and without T1D. Plotted without the standard error 47
Figure 7b. 10-Second average oxygen consumption expressed relative to VO2max
across all 3 periods of a 60-minute simulation hockey game for competitive youth
ice hockey players with and without T1D. Plotted with the standard error (M ± SE) 47
Figure 8a. 10-Second average heart rate expressed relative to HRmax across all 3
periods of a 60-minute simulation hockey game for competitive youth ice hockey
players with and without T1D. Plotted without the standard error 48
Figure 8b. 10-Second average heart rate expressed relative to HRmax across all 3
periods of a 60-minute simulation hockey game for competitive youth ice hockey
players with and without T1D. Plotted with the standard error (M ± SE) 48
Figure 9a. Comparison of the nadir oxygen consumption rate expressed relative to VO2max, at the beginning and end of each play shift and bench interval during a 60-minute simulation hockey game between individuals with and without T1D (M ± SE) 53
Figure 9b. Comparison of the peak oxygen consumption rate expressed relative to VO2max, at the beginning and end of each play shift and bench interval during a 60-minute simulation hockey game between individuals with and without T1D (M ± SE) 53

ix
Figure 10a. Comparison of the nadir heart rate expressed relative to HRmax, at
the beginning and end of each play shift and bench interval during a 60-minute
simulation hockey game between individuals with and without T1D (M ± SE) 54
Figure 10b. Comparison of the peak heart rate expressed relative to HRmax, at
the beginning and end of each play shift and bench interval during a 60-minute
simulation hockey game between individuals with and without T1D (M ± SE) 54
Figure 11. T1D group differences in the average nadir and peak oxygen consumption
rate and the average nadir and peak heart rate, expressed relative to VO2max and HRmax
respectively, between periods in a 60-minute simulation hockey game (M ± SE) 58
Figure 12. ND group differences in the average nadir and peak oxygen consumption
rate and the average nadir and peak heart rate, expressed relative to VO2max and HRmax
respectively, between periods in a 60-minute simulation hockey game (M ± SE) 59
Appendices:
Figure A1. %VO2max for all study participants combined across all 3 periods of a
simulation hockey game. No differentiation between T1D and ND groups 105
Figure A2. %HRmax for study all participants with and without T1D across all 3 periods
of a simulation hockey game . No differentiation between T1D and ND groups 106
Figure A3. The 10-second averaged VO2 (ml·Kg-1·min-1) response across 3 periods
of a simulation hockey game comparing individual with and without T1D 107
Figure A4. The 10-second averaged HR (bpm) response across 3 periods of a
simulation hockey game comparing individual with and without T1D 108
Figure A5. The average nadir and peak %VO2max and %HRmax for all study participants during the 3 periods of a simulation hockey game (M ± SE) 113
x
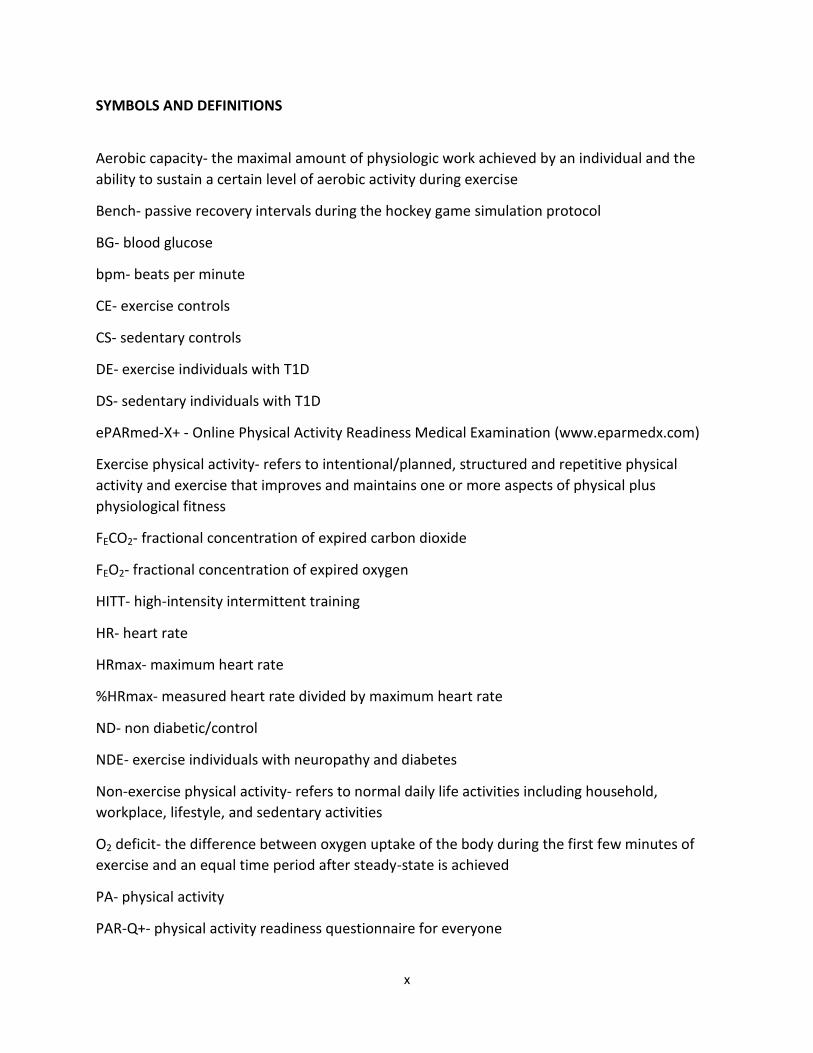
SYMBOLS AND DEFINITIONS
Aerobic capacity- the maximal amount of physiologic work achieved by an individual and the
ability to sustain a certain level of aerobic activity during exercise
Bench- passive recovery intervals during the hockey game simulation protocol
BG- blood glucose
bpm- beats per minute
CE- exercise controls
CS- sedentary controls
DE- exercise individuals with T1D
DS- sedentary individuals with T1D
ePARmed-X+ - Online Physical Activity Readiness Medical Examination (www.eparmedx.com)
Exercise physical activity- refers to intentional/planned, structured and repetitive physical
activity and exercise that improves and maintains one or more aspects of physical plus
physiological fitness
FECO2- fractional concentration of expired carbon dioxide
FEO2- fractional concentration of expired oxygen
HITT- high-intensity intermittent training
HR- heart rate
HRmax- maximum heart rate
%HRmax- measured heart rate divided by maximum heart rate
ND- non diabetic/control
NDE- exercise individuals with neuropathy and diabetes
Non-exercise physical activity- refers to normal daily life activities including household,
workplace, lifestyle, and sedentary activities
O2 deficit- the difference between oxygen uptake of the body during the first few minutes of
exercise and an equal time period after steady-state is achieved
PA- physical activity
PAR-Q+- physical activity readiness questionnaire for everyone

xi
Physical fitness- includes a set of attributes that can be measured such as strength, flexibility,
and aerobic endurance
Physiological fitness-the functional ability of the physiological responses that drive the body’s
response to exercise
RPM- revolutions per minute
SIT- sprint interval training
Shift- varying durations of vigorous-to-maximum cycling and active recovery repetitions during
the hockey game simulation protocol
T1D- type 1 diabetes
T2D- type 2 diabetes
VO2- oxygen consumption
VO2max- maximal oxygen consumption
%VO2max- measured oxygen consumption divided by maximal oxygen consumption multiple by
100 (aka oxygen consumption expressed relative to VO2max)
WC- waist circumference
1
CHAPTER 1
LITERATURE REVIEW
1.0 Type 1 Diabetes Mellitus
Type I Diabetes Mellitus (T1D), formerly known as insulin-dependent diabetes or
immune-mediated diabetes (Alberti & Zimmet, 1998; Weltman et al., 2009) has the highest
incidence rates in youth under the age of 14 years in Canada (Canadian Diabetes Association,
2012; DIAMOND Project Group, 2006). According to the Canadian Diabetes Association, T1D
affects approximately 300,000 Canadians (or 10% of diagnosed diabetes). It is a metabolic
disease that requires daily vigilant medical treatment and self-management to reduce the risk
of future complications associated with chronic unstable dysglycemia (Weltman, Saliba, Barrett,
& Weltman, 2009). The etiology of T1D is characterized by the autoimmune destruction of beta
cells of the pancreas, where the rate of cell damage is variable between individuals (Alberti &
Zimmet, 1998; Maahs, West, Lawrence, & Mayer-Davis, 2010; Shugart, Jackson, & Fields, 2010).
The destruction of these cells prohibits the pancreas from secreting insulin, resulting in
absolute insulin deficiency and forcing individuals to rely on the injection (or infusion) of
exogenous insulin to stabilize blood glucose (BG) levels (Maahs et al., 2010; Shugart et al.,
2010). Exogenous insulin administration is critical for survival in persons with T1D, to prevent
ketoacidosis, hypoglycemia, hyperglycemia and possibly death (Alberti & Zimmet, 1998).
It is well known that the early onset of T1D, and its long-term physiological effects,
increases the risk for the development of future disorders and diseases (Chu, Hamilton,
&Riddell, 2011; Jones & Poole, 2005), such as cardiovascular disease (Veves et al., 1997). T1D is

2
associated with a greater than 3-fold increased risk of cardiovascular disease compared to
individuals without T1D (ND) (Liese, Ma, Maahs, & Trilk, 2013). For this reason the importance
of habitual physical activity (PA) participation is advocated, given the evidence confirming PA to
be a behavioural factor that reduces the risk of cardiovascular disease, along with many other
chronic diseases and conditions (Liese et al., 2013). The Diabetes Control and Complications
Trial research group showed that keeping BG levels as close to the ND range as possible reduces
the risk of developing major long-term complications associated with T1D, including
retinopathy, neuropathy, and nephropathy (Diabetes Control and Complications Trial, 1995;
Jacobsen, Henriksen, Hother-Nielsen, Vach, & Beck-Nielson, 2009; Nathan et al., 2005). It is
therefore critical for individuals to manage and sustain a healthy BG range, which can be done
by partaking in a vigilant treatment plus self-management routine (Landt, Campaigne, James, &
Sperling, 1985; Sideraviciute, Gailiuniene, Visagurskiene, & Vizbaraite, 2006; Weltman et al.,
2009). By balancing insulin therapy and diet, most persons with T1D can manage their BG
reasonably well (Canadian Diabetes Association, 2012). However, participation in non-exercise
and exercise PA imposes additional and very unique challenges to the task of BG management
(Canadian Diabetes Association, 2012).
1.1 Type 1 Diabetes and Physical Activity
PA plays a critical role in both the prevention and management of multiple chronic
diseases and conditions, with T1D being one of them. Clinical guidelines for non-exercise and
exercise PA participation for persons with T1D are still evolving (Chimen et al., 2012; Liese et al.,

3
2013). A large proportion of the evidence-based PA guidelines for individuals with T1D are
grounded on understandings gained from studies investigating the benefits of PA interventions
on type 2 diabetes (T2D) (Chimen et al., 2012; Liese et al., 2013). Presently the amount of
evidence regarding the benefits of acute and chronic PA participation in T2D exceeds the
information that is available for T1D (Chimen et al., 2012). Nonetheless, the limited number of
studies and comprehensive reviews focusing on the health benefits of PA participation in
persons with T1D clearly demonstrate its advantages in this population.
Regular non-exercise (ie. climbing the stairs, household chores) and exercise PA
participation can confer the same health benefits in persons with and without T1D (Chu et al.,
2011; Guelfi, Jones, & Fournier, 2005). Specifically, in studies focused on T1D, PA has been
proven to: improve blood pressure (Chu et al., 2011), glucose uptake (Norris, Carroll, &
Cochrane, 1990), assist with weight management (Landt et al., 1985; Norris et al., 1990),
enhance cardiovascular plus peripheral vascular function (Landt et al., 1985; Mosher, Nash,
Perry, LaPerriere, & Goldberg, 1998), improve musculoskeletal fitness (Chu et al., 2011; Mosher
et al., 1998), improve the blood lipid profile (Campaigne, Landt, & Mellies, 1985; Laaksonen et
al., 2000), as well as, reduce stress, depression and the risks for developing cardiovascular plus
peripheral vascular diseases (Chu et al., 2011; Guelfi et al., 2005; Komatsu, Castro, Saraiva,
Chacra, & de Barros Neto, 2005; Sideraviciute et al., 2006; Veves et al., 1997; Zinker, 1999).
Additionally, and with specific reference to young persons with T1D, participation in PA
including competitive sports assists with social adaptation (Sideraviciute et al., 2006; Zinker,
1999). It provides more opportunity for social interaction and allows them to integrate with
their peers (Zinker, 1999). Therefore, regular non-exercise plus exercise PA is advocated and

4
should be a goal for youth with T1D, as it increases their sense of well-being, self-esteem,
mitigates long-term complications and improves overall quality of life (Rowland, Martha Jr,
Reiter, & Cunningham, 1992; Sideraviciute et al., 2006; Veves et al., 1997; Wasserman &
Zinman, 1994; Zinker, 1999).
Recent epidemiological data reveal that a significant number of youth with T1D do not
participate in, or meet the current global PA guidelines set-out for youth; 60 minutes of
moderate-to-vigorous PA per day (ParticipACTION, 2013; Liese et al., 2013). The
epidemiological data show that a large proportion of these youth spend an excessive amount of
time engaging in sedentary activities such as watching TV (Liese et al., 2013). Currently, there is
very little data that describe the types of activities youth with T1D participate in, and, if they
differ from those of their ND counterparts (Liese et al., 2013). The limited number of studies
investigating youth with T1D reveal that their overall physical plus physiological fitness levels
are in the low range (Liese et al., 2013), when compared to ND individuals matched for age and
levels of PA (Chimen et al., 2012).
1.2 Type 1 Diabetes and Metabolic Responses to Non-Exercise and Exercise Physical Activity
Both non-exercise and exercise PA present a unique challenge for persons with T1D, as
it further complicates daily BG regulation. The regulation of insulin release during PA in ND is
met by a synchronized metabolic response (Gallen, 2005; Landt et al., 1985; Wasserman
&Zinman, 1994; Zinker, 1999), where the increased energy demand and BG during exercise are
matched by the release of insulin from the beta cells of the pancreas and increased glucose

5
utilization rate by the exercising muscles (Gallen, 2005; Landt et al., 1985; Zinker, 1999). For BG
levels to remain constant during exercise, glucagon is released from the pancreas to increase
hepatic glucose production (Chu et al., 2011). This homeostatic response is what persons with
T1D lack, and it can be particularly problematic for the athlete with T1D (Gallen, 2005; Landt et
al., 1985; Wasserman & Zinman, 1994; Zinker, 1999). The inability of athletes with T1D to
automatically regulate insulin delivery increases the risk for severe hyperglycemia or
hypoglycemia, both during and post exercise. It is critical for athletes with T1D to pay close
attention to insulin administration before, during and after PA participation. With an
inadequate amount of insulin, active persons with T1D will experience a decrease in insulin-
mediated glucose uptake by the muscles, along with the exercise induced release of glucose
from the liver (Riddell & Perkins, 2006; Toni, Reali, Barni, Lenzi, & Festini, 2006; Tonoli et al.,
2012) which leads to rising BG levels during and post exercise resulting in hyperglycemia
(Riddell & Perkins, 2006; Toni et al., 2006; Tonoli et al., 2012). Hyperglycemia will persist
following exercise unless insulin is administered. If the exercise intensity is high, requiring
vigorous-to-maximum effort (Figure 1), individuals may experience a further increase in
hyperglycaemia and ketoacidosis, especially if the individual has poor glycemic control (Jain,
McVie, & Bocchini, 2006; Riddell & Perkins, 2006; Toni et al., 2006; Tonoli et al., 2012).
Ketoacidosis occurs from an increased production of ketones; when glucose can no longer be
used as a fuel source due to insulin deficiency, body fuel is then derived from fat releasing
ketones (Jain et al., 2006; Riddell &Perkins, 2006). Hyperglycaemia and ketoacidosis may result
in dehydration and decreased blood pH, which will impair athletic performance and cause
severe illness (Jain et al., 2006; Riddell &Perkins, 2006). A chronically sustained hyperglycaemic
6
state is a major risk factor for complications leading to blindness, neuropathy, and other
vascular problems (Jain et al., 2006; Riddell & Perkins, 2006; Toni et al., 2006; Tonoli et al.,
2012).
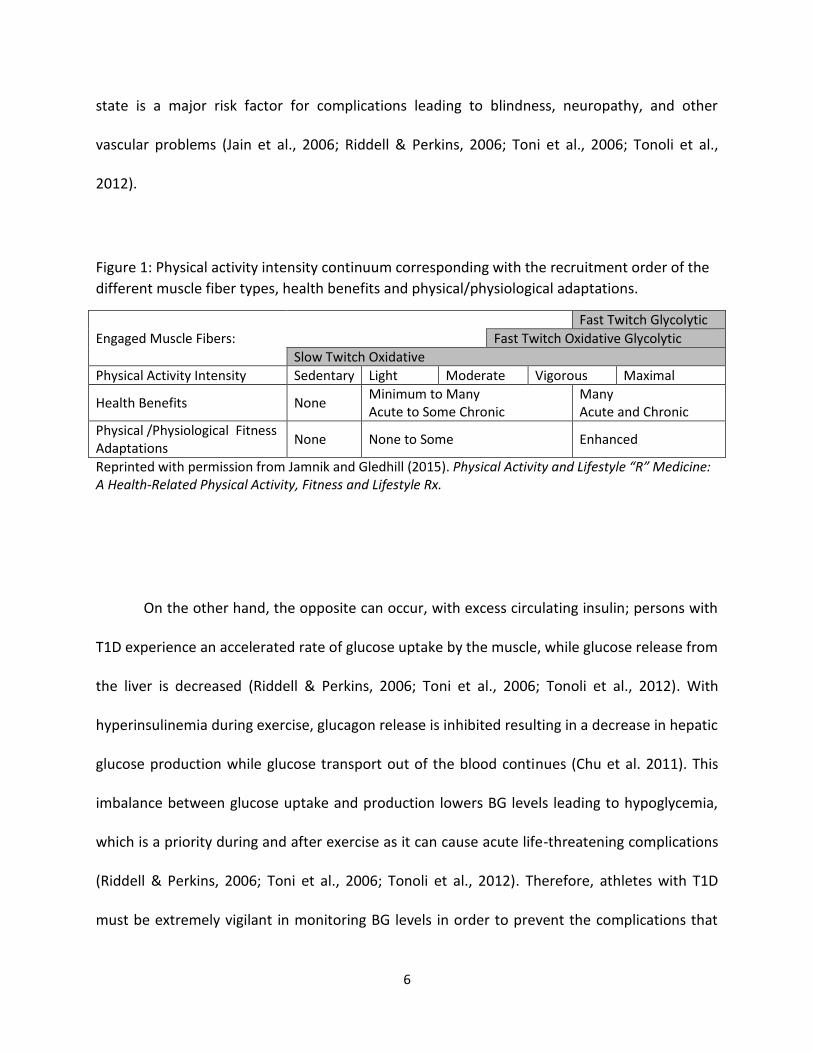
Figure 1: Physical activity intensity continuum corresponding with the recruitment order of the
different muscle fiber types, health benefits and physical/physiological adaptations.
Engaged Muscle Fibers:
Fast Twitch Glycolytic
Fast Twitch Oxidative Glycolytic
Slow Twitch Oxidative
Physical Activity Intensity Sedentary Light Moderate Vigorous Maximal
Health Benefits None Minimum to Many Acute to Some Chronic
Many Acute and Chronic
Physical /Physiological Fitness Adaptations
None None to Some Enhanced
Reprinted with permission from Jamnik and Gledhill (2015). Physical Activity and Lifestyle “R” Medicine: A Health-Related Physical Activity, Fitness and Lifestyle Rx.
On the other hand, the opposite can occur, with excess circulating insulin; persons with
T1D experience an accelerated rate of glucose uptake by the muscle, while glucose release from
the liver is decreased (Riddell & Perkins, 2006; Toni et al., 2006; Tonoli et al., 2012). With
hyperinsulinemia during exercise, glucagon release is inhibited resulting in a decrease in hepatic
glucose production while glucose transport out of the blood continues (Chu et al. 2011). This
imbalance between glucose uptake and production lowers BG levels leading to hypoglycemia,
which is a priority during and after exercise as it can cause acute life-threatening complications
(Riddell & Perkins, 2006; Toni et al., 2006; Tonoli et al., 2012). Therefore, athletes with T1D
must be extremely vigilant in monitoring BG levels in order to prevent the complications that
7
occur from poor BG control. Despite the risks that non-exercise and exercise PA pose on this
population and the lack of understanding regarding the possible limitations on exercise
tolerance induced by unstable BG control, the literature still supports habitual non-exercise and
exercise PA participation (Gallen, 2005; Komatsu et al., 2005; Veves et al., 1997).
For many parents of children with T1D, there is a large concern around the topic of low
blood glucose (i.e. hypoglycaemia) and particularly the strong link between hypoglycaemia and
PA (Barnard, Thomas, Royle, Noyes, & Waugh, 2010; Frier, 2008; Robertson, Adolfsson,
Scheiner, Hanas, & Riddell, 2009). Persons with T1D and their families are aware of the adverse
effects of hypoglycemia and recognize that these episodes are potentially life threatening, as
well as a source of social embarrassment (Barnard et al, 2010). As a result, parents and their
children who have T1D may develop fear and anxiety towards the occurrence of hypoglycemic
episodes and attempt to take measures to avoid hypoglycemia (Barnard et al., 2010). Di Battista
et al. (2009) showed that social anxiety towards hypoglycemia is common in adolescents with
T1D (mean age 15.9 ± 1.44 years), which interferes with their behaviour and quality of life. Fear
of hypoglycemia is an important and highly prevalent barrier to the involvement in non-exercise
and exercise PA in youth with T1D (Liese et al., 2013). While awareness can reduce the levels of
fear, it is important to further investigate the physiological responses of young persons with
T1D to both non-exercise and exercise PA. The outcomes of this focussed research will provide
diabetes professionals, parents and persons with T1D with the information that is essential for
safe and effective PA participation (Robertson et al., 2009; Wild et al., 2007).
8
1.3 Oxygen Uptake during Rest and Physical Activity
Skeletal muscles are responsible for facilitating movement and the capacity to carry out
physical work (Jones & Poole, 2005). As such, the human body possesses a remarkable ability to
alter its metabolic requirements in response to various energetic challenges, predominantly via
oxidative metabolism (Poole, Kindig, Behnke, & Jones, 2004). Humans are rarely in situations of
metabolic steady-state, rather, they engage in activities involving sudden transitions from one
metabolic rate to another (Jones &Poole, 2005). The study of oxygen uptake (VO2) and VO2
kinetics encompasses the physiological mechanisms responsible for the transition between
metabolic rates during non-exercise and exercise PA (Poole et al., 2004). The rate of change
during transitions between energy demands is a fundamental parameter of metabolic capacity,
ultimately impacting exercise performance and tolerance (Poole et al., 2004). Aerobic or
cardiorespiratory fitness, defined here as the ability and the efficiency of the body to extract
oxygen from the atmosphere, transport it to the working muscles, and utilize the oxygen at the
muscular and cellular level during prolonged moderate-to-high-to-maximum intensity exercise,
is influenced by many factors including chronic disease, and therefore has been extensively
examined and described by many. It is well known that by measuring the rate of VO2 during
exercise, cardiorespiratory fitness can be evaluated (Gist, Fedewa, Dishman, & Cureton, 2014;
Jones & Poole, 2005). Maximum oxygen uptake (VO2max or VO2peak) is considered to be the
best net index of how efficiently the heart, lungs and muscles (Astrand, 1971; Komatsu et al.,
2005; Veves et al., 1997) function together when subjected to varying energy demands.
Physiologically, VO2max represents the maximal rate at which the body can re-synthesize ATP

9
oxidatively (aka aerobically), providing an upper limit for endurance performance in athletes,
sedentary, and patient populations (Jones & Poole, 2005).
In the literature, the term VO2peak is also frequently used. This term may be defined as
the highest VO2 value achieved during an aerobic or cardiovascular fitness test. It is different
from VO2max and it is therefore important to highlight its distinction. Although VO2peak
describes the highest VO2 value achieved during a cardiovascular fitness test, it does not
necessarily define the maximum VO2 value attainable by an individual (Whipp, n.d.). Achieving a
true VO2max depends on the determination of a particular criterion, where VO2 no longer
increases, or only increases by a trivial amount, despite a further increase in work rate (Whipp,
n.d.). VO2max tests involve high-intensity exercise and are designed to bring individuals to the
limit of tolerance (Whipp, n.d.). An individual may not be able to achieve a true VO2max as a
result of the inability to perform high-intensity exercise. As a result, the VO2peak is used as the
measure of cardiovascular fitness instead of VO2max.
1.4 Oxygen Uptake and Type 1 Diabetes
The limitations associated with the pathology of T1D on exercise performance and/or
tolerance are still not well understood. The majority of research regarding T1D and exercise
centres around the glucoregulatory responses (Guelfi, Ratnam, Smythe, Jones, & Fournier,
2007; Herbst, Bachran, Kapellen, & Holl, 2006; Metcaf et al., 2014; Zinman, Zuniga-Guajardo, &
Kelly, 1984), whereas cardio respiratory or aerobic fitness has been inconsistently reported
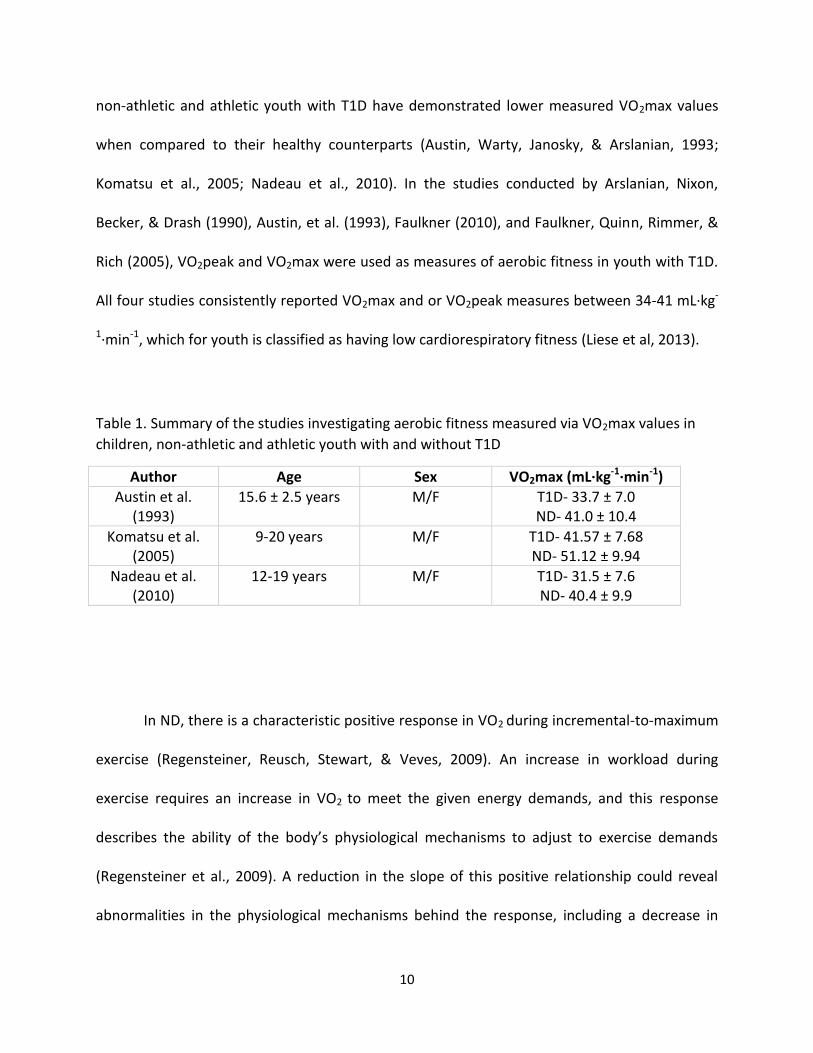
(Komatsu et al., 2005). As summarized in Table 1, studies evaluating aerobic fitness in children,
10
non-athletic and athletic youth with T1D have demonstrated lower measured VO2max values
when compared to their healthy counterparts (Austin, Warty, Janosky, & Arslanian, 1993;
Komatsu et al., 2005; Nadeau et al., 2010). In the studies conducted by Arslanian, Nixon,
Becker, & Drash (1990), Austin, et al. (1993), Faulkner (2010), and Faulkner, Quinn, Rimmer, &
Rich (2005), VO2peak and VO2max were used as measures of aerobic fitness in youth with T1D.
All four studies consistently reported VO2max and or VO2peak measures between 34-41 mL∙kg-
1∙min-1, which for youth is classified as having low cardiorespiratory fitness (Liese et al, 2013).
Table 1. Summary of the studies investigating aerobic fitness measured via VO2max values in
children, non-athletic and athletic youth with and without T1D
Author Age Sex VO2max (mL∙kg-1∙min-1)
Austin et al. (1993)
15.6 ± 2.5 years M/F T1D- 33.7 ± 7.0 ND- 41.0 ± 10.4
Komatsu et al. (2005)
9-20 years M/F T1D- 41.57 ± 7.68 ND- 51.12 ± 9.94
Nadeau et al. (2010)
12-19 years M/F T1D- 31.5 ± 7.6 ND- 40.4 ± 9.9
In ND, there is a characteristic positive response in VO2 during incremental-to-maximum
exercise (Regensteiner, Reusch, Stewart, & Veves, 2009). An increase in workload during
exercise requires an increase in VO2 to meet the given energy demands, and this response
describes the ability of the body’s physiological mechanisms to adjust to exercise demands
(Regensteiner et al., 2009). A reduction in the slope of this positive relationship could reveal
abnormalities in the physiological mechanisms behind the response, including a decrease in

11
oxygen delivery, cardiac function, and/or an irregularity of muscle oxidative metabolism
(Regensteiner et al., 2009). In cardiorespiratory and vascular disease, it has been demonstrated
that a decrease in the slope of VO2 indicates abnormalities or insufficiencies in cardiac output
and gas exchange (Regensteiner et al., 2009). Specific to T1D, Austin et al. (1993) and Komatsu
et al. (2005) reported that physiological fitness, as measured by VO2peak, is associated with
glycemic control, where Austin et al. (1993) concluded that a lower fitness predicted higher
glycated hemoglobin (HbA1c) levels. It is still unclear in the literature how VO2max (or VO2peak)
and HbA1c levels are related; whether a lower measured aerobic fitness elevates HbA1c levels,
or higher HbA1c levels contributes to a lower fitness. Other studies investigating the
mechanisms behind the impaired functional aerobic fitness observed in this population have
linked it to idiopathic structural and functional changes within the cardiac and skeletal muscle
(Hilsted, Galbo, & Christensen, 1979; Jones & Poole, 2005; Mildenberger et al., 1984; Nadeau et
al., 2010; Vered et al., 1984; Veves et al., 1997; Williams et al., 2011). It is possible that along
with the lower VO2max or VO2peak observed in individuals with T1D, the rate of VO2 during
exercise could also be impaired.
1.5 Oxygen Uptake Kinetics
How well an individual physiologically copes with the demands of exercise depends, in
part, upon the rate of oxygen uptake, or VO2 kinetics (Jones & Poole, 2005). The rapid increase
in VO2 at the onset of and during incremental exercise (deemed as O2 kinetics) requires the
coordination between the respiratory, cardiovascular, and muscular systems to transport

12
oxygen from the atmosphere, plus circulate, deliver, and utilize it at the cellular level (Jones &
Poole, 2005; Whipp, 1994; Wasserman & Whipp 1972). The difference in the rate of VO2
kinetics delineates ranges in athletic performance, where trained individuals have faster VO2
kinetics compared to healthy untrained individuals, who sequentially have faster VO2 kinetics
than persons with chronic diseases or conditions (Jones & Poole, 2005).
1.5.1 A Brief History of Oxygen Uptake Kinetics
The pioneers of the study of VO2 kinetics have made major contributions within the field
and are inherently responsible for setting the foundation of VO2 kinetics (Jones & Poole, 2005).
Since Krogh and Lindhard (1913) first reported on the fast cardiovascular responses seen at the
onset of exercise, the dynamics of the VO2 response has been described and studied extensively
(Xu & Rhodes, 1999). In the 1920s, Hill and colleagues were the first to demonstrate the
exponential nature of the VO2 response at the beginning of exercise in humans (Hill, Long, &
Lupton, 1924; Jones & Poole, 2005). The energy and supply demand model proposed by Hill et
al. (1924) suggested that running performance was determined by three factors: energy
demand (VO2 required), VO2 max, and sustained aerobic capacity; and is the foundation on
which recent models are built (Jones & Poole, 2005). Later on, Whipp and Wasserman had the
advantage of newer technology (breath-by-breath measurements of ventilation and pulmonary
gas exchange) to establish the 3-phase VO2 response at the beginning of exercise, validate the
physiological mechanisms responsible, and describe the relationship between VO2 kinetics and
exercise intensity (Jones & Poole, 2005). Lamarra and Wasserman developed the equations
used to measure breath-by-breath alveolar gas exchange that are still used today (Jones &
13
Poole, 2005). With the advances in technology and the manufacture of reliable gas analysis
systems for the measurement of VO2, it is now possible to plot and model the kinetics of the
VO2 response.
1.5.2 Traditional Method of Measuring Oxygen Uptake Kinetics
During steady-state exercise, VO2 increases linearly as a function of work rate (Whipp,
1994; Xu & Rhodes, 1999). This response during the transition from rest to steady-state
exercise has been described by Whipp, Ward, Lamara, Davies, and Wasserman (1982) to
include three phases (Barstow & Mole, 1991). The initial phase is defined as the early rapid
response or “cardiodynamic stage”, the second phase is characterized by the slower
exponential increase of the response and described as the “fundamental stage,” and the third
phase refers to the “slow component” representing steady-state (Barstow & Mole, 1991; Carter
et al., 2000; Jones & Poole, 2005; Whipp, 1994). All three of the phases are associated with to
specific physiological mechanisms reflecting the initial increase of pulmonary VO2 in the lungs,
the increase of muscle VO2 via mean tissue gas exchange, and the utilization of oxygen at the
muscle level for the metabolic requirements of the body during steady-state exercise (Whipp,
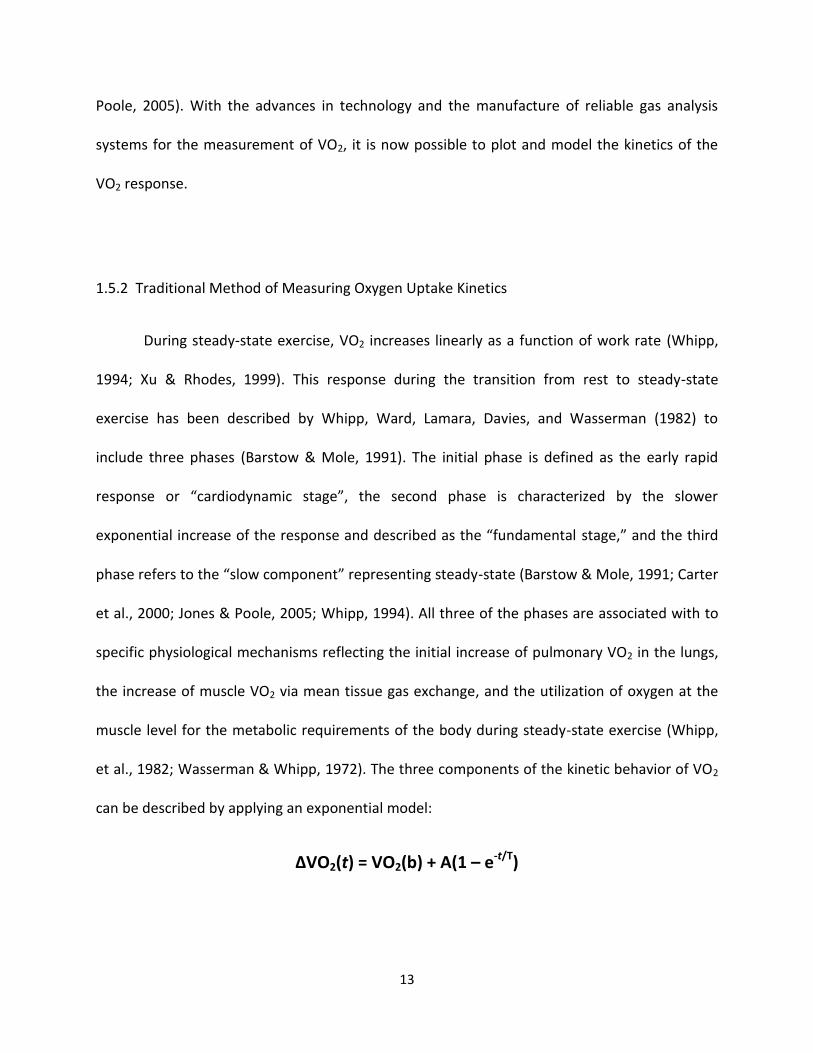
et al., 1982; Wasserman & Whipp, 1972). The three components of the kinetic behavior of VO2
can be described by applying an exponential model:
ΔVO2(t) = VO2(b) + A(1 – e-t/T)

14
Where ΔVO2(t) is the increase in VO2 at time (t); VO2(b) is the baseline VO2; A is the response
(steady-state) amplitude; 1 – e is the base for the natural logarithm; and T is the time constant
(Carter, Pringle, Barstow, & Doust, 2006; Jones & Poole, 2005; Whipp, 1994). This first-order
exponential model calculates the rate of change (or slope of the line) of VO2 at a specified time,
reflecting the efficiency of the physiological mechanisms that drive VO2, such as the adequate
functioning of the O2 transport chain (Jones & Poole, 2005; Whipp, 1994).
At the start of moderate-intensity exercise which is 40-60% of VO2max or 55-69% of
maximal heart rate (HRmax) (Guelfi, Jones, & Fournier, 2007), VO2 initially increases rapidly and
then steady-state is achieved within 1.5-3 minutes (Zoladz et al., 2013). The time constant
(defined as the characteristic transition time representing the speed at which a particular
system can respond to change) of the VO2 increase observed at the start of exercise varies
between individuals (Grassi, Porcelli, Salvadego, & Zoladz, 2011; Zoladz et al., 2013). The faster
the VO2 kinetics, the greater the exercise tolerance and fitness level of the individual; therefore
endurance trained athletes have a significantly shorter time constant 10-20 seconds, and
deconditioned persons plus persons with chronic diseases or conditions have a substantially
longer time constant (40-60 seconds) (Jones & Poole, 2005; Zoladz et al., 2013). Endurance
trained athletes will have a smaller O2 deficit (Figure 2), accompanied by less disturbance in
muscle metabolic stability (ie. lower acid-based disturbance) (Grassi et al., 2011; Jones & Poole,
2005; Zoladz et al., 2013). Unfit or unhealthy individuals will have a very slow response with
time constants between 20-45 seconds and 40-60 seconds, respectively (Jones & Poole, 2005;
Zoladz et al., 2013). As a result, these individuals will experience a larger O2 deficit (Jones &
Poole, 2005; Poole, Barstow, McDonough, & Jones, 2008; Zoladz et al., 2013) and mandate a

15
greater degree of intramuscular disturbance (decreased pH, ADPfree, and inorganic phosphate,
as well as greater depletion of phosphocreatine) (Jones & Poole, 2005; Poole et al., 2008).
These factors predispose individuals to reduced exercise performance and tolerance (Jones &
Poole, 2005; Zoladz et al., 2013). Thus pathological conditions, such as T1D, may alter the
efficiency of the VO2 kinetic response. Given that glycemic control and changes in cardiac
muscle function affect VO2max, these factors may also affect the VO2 kinetics in T1D, incurring
a significantly slowed VO2 response to exercise. It is essential to characterize the behaviour of
the VO2 response to PA in persons with T1D to facilitate the investigation of the underlying
causes of exercise intolerance, and to develop therapeutic strategies to improve physical plus
physiological fitness and quality of life (Poole et al., 2008).

16
Figure 2. VO2 during the transition from rest to steady-state exercise
A B
(Powers & Howley, 2011)
Panel A. The shaded area illustrates the O2 deficit, representing the lag in VO2 at the start of exercise. Panel B. Comparing the differences in the time course of VO2 from rest to steady-state exercise between trained and untrained individuals. In untrained individuals, the time to reach steady-state VO2 is slower compared with trained individuals; as a result, untrained individuals have a greater O2 deficit.
Oxy
gen
Up
take
Exercise Time Resting VO2
O2 deficit
Steady-state VO2
Oxy
gen
Up
take
Exercise Time Resting VO2
O2 deficit
Steady-state VO2
Trained
Untrained

17
1.6 Oxygen Uptake Kinetics and Type 1 Diabetes
In the healthy population, limitations in highan individual’s VO2 kinetics during exercise
could be a result of either inadequate blood flow to working tissues limiting oxygen transfer, or
the inertia of oxidative metabolism (Regensteiner et al., 2009). In diseased states like
cardiovascular disease or perhaps diabetes, oxygen delivery is compromised and the VO2
kinetics are restricted by oxygen delivery to working muscles (Regensteiner et al., 2009).
Currently, there are limited (or no) studies conducted on the VO2 kinetics during exercise in
T1D, specifically in youth with T1D. However, there have been a handful of studies that have
investigated the VO2 kinetics in premenopausal women with T2D (Ananey et al., 2011; Bauer,
Reush, Levi, & Regensteiner, 2007; Brandenburg et al., 1999, Regensteiner et al., 1998). These
studies reported that VO2peak or VO2max are consistently reduced in premenopausal women
with T2D, and that the VO2 kinetics in this population adjust more slowly compared with
healthy controls matched for age, body mass, and activity levels during the onset of
submaximal cycling exercise (Ananey et al., 2011; Bauer et al., 2007; Brandenburg et al., 1999,
Regensteiner et al., 1998). Although the participants were matched for activity level, the
authors of the aforementioned investigations may not have matched for intensity or physical
plus physiological fitness levels. The participants may have performed the same activities, but it
is possible that the women with T2D and the ND worked at different intensities. The ND could
have been working at higher intensities, which could account for the discrepancies found in
VO2max and VO2peak between the investigations.
18
Similar to T1D, the cause of exercise intolerance in T2D is still not well understood
(Regensteiner et al., 1998). Regensteiner et al. (1998) assessed the dynamics of VO2 kinetics in
response to constant-load exercise in premenopausal women with T2D, and found there was a
reduction in the cardiopulmonary response at the beginning of exercise. Regensteiner et al.
(1998) noted that along with a possible compromised cardiac response to exercise in the
participants with T2D, their VO2 kinetics could additionally be affected by inadequate skeletal
muscle oxygen diffusion, mitochondrial density, or mitochondrial oxygen utilization. Ananey et
al. (2011) investigated whether cardiac output responses to constant-load cycling at light versus
moderate versus vigorous intensities were related to the VO2 kinetics during cycling exercise in
women with uncomplicated T2D. The investigators observed that there was no cardiac
dysfunction within the cohort with T2D and suggested that the slowed VO2 kinetic response is
partly attributed to uneven distribution and slowed dynamic adaptations of blood flow to the
exercising muscles (Ananey et al., 2011). Ananey et al. (2011) also noted that the reduced VO2
kinetics of the participants with T2D during submaximal exercise might suggest a greater
reliance on the anaerobic system causing increased fatigue and contributing to exercise
intolerance. It is possible, although not highlighted in the manuscript, that the slower VO2
kinetics observed in the cohort with T2D is a function of the lower baseline fitness levels. As
previously discussed, individuals with T1D have been shown to have a lower VO2max or
VO2peak and exercise tolerance than ND matched for age, body mass and PA level, and similar
to T2D, this reduced cardiorespiratory fitness may not just be attributed to deconditioning. It is
also important to note that while the PA levels may be the same between individuals with and
without T2D, the intensities of the exercise may differ, which could account for differences in

19
VO2max. Drawing from the evidence gained from the T2D exercise research, one could presume
that a lower VO2max or peak in T1D could also be attributed to a reduction in the dynamics of
VO2 kinetics.
1.7 Oxygen Uptake Kinetics and Exercise
Traditionally, research focussed on the dynamic behaviour of VO2 use submaximal effort
constant-load incremental exercise for their investigations. In numerous studies of VO2 kinetics,
constant-load exercise was performed at moderate-to-vigorous intensity workloads below the
lactate threshold. This approach was employed because it controls the rate of progression in
workloads and assures a steady-state VO2 (Regensteiner et al., 1998). Wasserman & Whipp
(1972) investigated the effect of various work intensities on the VO2 kinetics in 6 healthy
volunteer using an exercise protocol that involved participants cycling at a constant-load for 6
minutes at a given workload to achieve a steady-state VO2. Brandenburg et al. (1999) and
Regensteiner et al (1998) also used constant-load exercise on cycle ergometers in their studies
of VO2 kinetics in premenopausal women with T2D. It is important to note that not all PA
encountered throughout the day is at a steady-state. Many activities incorporate brief,
intermittent bouts of high intensity activity interspersed with rest periods, similar to the short
sprints inherent in multiple team and field sports and spontaneous play of children (Bigger,
Fleiss, Rolnitzky, & Steinman, 1993; Robertson et al., 2009). It is imperative to understand the
physiological response of active youth with T1D to multiple forms of non-exercise and exercise
PA to ensure safe participation and optimize sport performance.

20
1.8 High-Intensity Intermittent Exercise
Many sports, like hockey in particular, are defined by short, high-intensity intermittent
bouts of activity (Montgomery, 1988). High-intensity intermittent training (HITT) is
characterized by brief bouts of vigorous-to-maximum effort. These short periods of high-
intensity activity cannot be maintained for very long, and therefore are separated by intervals
of light intensity PA (Burgomaster, Heigenhauser, & Gibala, 2006; Gibala et al., 2009). High-
intensity exercise occurs at 80-100% of VO2max or greater than 75% of HRmax (Guelfi et al.,
2007).
HITT has been proven in the literature to be an effective strategy for inducing skeletal
muscle oxidative and metabolic adaptations similar to the changes seen with chronic moderate-
to-vigorous intensity endurance training (Burgomaster et al., 2006; Burgomaster et al., 2008;
Gibala et al., 2009; Harmer et al., 2008). This has been the focus of the majority of research in
this area. Gibala et al. (2006) reported that sprint interval training (SIT) involving 4-6 bouts of 30
second “all out” cycling at approximately 250% of the workload that elicited the VO2peak,
induced improvements in muscle oxidative capacity (reflected by the maximum activity of
cytochrome C oxidase and COX subunit protein content), muscle buffering capacity and exercise
performance (measured by total cycling time and mean power output) to the same extent as
did traditional continuous moderate-to-vigorous intensity training involving 90-120 minutes of
continuous cycling at approximately 65% of VO2peak. In another study, Burgomaster et al.
(2008) showed that a low volume of SIT involving 4-6 30 second “all out” Wingate tests, elicited
similar adaptations in specific mitochondrial markers for skeletal muscle carbohydrate and lipid
21
metabolism and metabolic control (reduced glycogen and phosphocreatine utilization)
compared with traditional continuous moderate-to-vigorous intensity endurance training
involving 40-60 minutes of continuous cycling at approximately 65% VO2peak. Along with the
myocellular adaptations, HITT and SIT are also associated with increases in VO2max or peak and
work tolerance (Burgomaster et al., 2008; Burgomaster, Hughes, Heigenhauser, Bradwell, &
Gibala, 2005; Gibala et al., 2006). In the aforementioned studies (Gibala et al., 2006 and
Burgomaster et al., 2008) the researchers included participants who had no health
complications and were recreationally active or untrained, respectively. One study in particular
investigated the muscle oxidative adaptations to HITT in young adults with T1D (Harmer et al.,
2008). The findings demonstrate that during intense exercise, HITT increased muscle oxidative
capacity and reduced muscular metabolic destabilization (reducing lactate accumulation,
glycogenolytic and glycolytic rates, and attenuated ATP degradation) in T1D. The participants
did not experience any adverse effects due to HITT and Harmer et al. (2008) concluded that
HITT is well tolerated by persons with T1D.
1.9 High-Intensity Intermittent Exercise and Type 1 Diabetes
Recently, the glucoregulatory response to HITT in T1D has been investigated and this
type of exercise has been associated with higher BG concentrations. Studies reported that brief
high-intensity bouts could attenuate the typical drop in BG concentration, both during and after
moderate intensity exercise in T1D (Guelfi et al., 2005; Bussau, Ferreira, Jones, & Fournier,
2006; Bussau, Ferreira, Jones, & Fournier, 2007; Robertson et al., 2009). Bussau et al. (2006)
22
investigated the repercussions of a 10-second maximal cycling sprint following 20 minutes of
moderate-intensity cycling exercise in males with T1D aged 21 ± 3.5 years. When the
investigators introduced a 10-second cycling sprint at the end of the 20-minute workout, the
decline in BG was no longer apparent for 2 hours following cessation of the activity. The
investigators discovered that adding a short maximal sprint counters the rapid fall in glucose
associated with continuous moderate-intensity exercise, and thus, provides another means to
attenuate or offset the risk of hypoglycemia in active persons with T1D independent of pre-
exercise dietary or insulin adjustments. Bussau et al. (2006) proposed that the mechanisms
responsible for attenuating the exercise-mediated decrease in BG concentration and the
stabilization of BG after exercise is consequence of the elevated levels of counterregulatory
hormones including catecholamines, growth hormone, plus cortisol and lactate levels. When
persons with T1D participate in intermittent high-intensity exercise, BG levels fall less rapidly
and remain more stable following the activity in comparison to sustained light-to-moderate-
intensity exercise (American Diabetes Association, 2004).
Most team and individual sports have a HITT component. Guelfi et al. (2007)
demonstrated the glucoregulatory behavior in response to a bike protocol simulating activity
patterns of team sports. The protocol involved, 30 minutes of continuous exercise at 40% of
VO2peak, interspersed with 4 maximal sprint efforts every 2 minutes. Currently, this is one of
the only studies that investigated a HITT protocol tailored to simulate a game situation in T1D.
More research is required on this type of activity for persons with T1D, as it will assist in
creating detailed, evidenced-based guidelines for safe participation in regular intermittent high-
23
intensity exercise and sports. To date, no study has evaluated the cardiorespiratory responses
to such exercise in individuals with T1D.
1.10 Heart Rate Kinetics
The heart rate (HR) response during PA is closely related to the rate of change of VO2
and like VO2 kinetics, HR may also be described mathematically as an exponential function
(Stirling, Zakynthinaki, Refoyo, &Sampedro, 2008). Measuring the HR kinetics during exercise is
frequently used as a simple way of assessing the degree of adaptation to a submaximal effort
exercise bout and evaluating the functional circulatory capacity (Bunc, Heller, & Leso, 1988).
During constant-load submaximal effort exercise the kinetics of the HR response can be
separated into distinct physiological phases, similar to what has been observed with the VO2
kinetics (Bunc, Heller, Leso, &Sprynarova, 1986). The initial phase of the HR response during
exercise is designated as the “fast” component, while the second is deemed the “slow”
component (Bunc et al., 1986). In a study by Bunc et al. (1988), the investigators used a mono-
exponential model to determine the behaviour in HR at the onset of constant-load sub-maximal
effort exercise on a cycle ergometer. The investigators confirmed, using healthy endurance
trained and untrained males, that the kinetics of HR can be characterized by applying the same
type of model used to describe VO2 kinetics (i.e. a fast and slow component) and concluded
that the change in HR during submaximal steady-state exercise can help assess the functional
capacity and training state of individuals (Bunc et al., 1988). Since the basic response patterns
for VO2 and HR kinetics are similar in response to incremental steady-state submaximal exercise

24
(Stirling et al. 2008), Ananey et al. (2011), and Regensteiner et al. (1998) adapted the
mathematical models developed for VO2 kinetics to apply to HR in their T2D studies.
Comparable to VO2 kinetics, the HR dynamics at the start of exercise are faster with a
more advanced state of training, and thus trained individuals have faster HR kinetics in
comparison to untrained individuals (Bunc et al., 1988). Like VO2 kinetics, there is also a lack of
research analysing the HR kinetics in persons with T1D or T2D. Currently two studies have
measured HR kinetics in T2D, and found conflicting results (Ananey et al., 2011; Regensteiner et
al., 1998). Along with VO2 kinetics, Regensteiner et al. (1998) examined the HR kinetics of
premenopausal women with uncomplicated T2D and found that compared to the ND, the T2D
had slower HR kinetics during constant-load cycling exercise. Regensteiner et al. (1998)
attributed a possible impaired cardiac response to the slower HR kinetics observed in the
women with T2D. In contrast, Ananey et al. (2011) found no differences in the HR kinetics
between middle-aged women with uncomplicated T2D and ND at any time point during the
constant-load cycling exercise. Thus, more research is needed to confirm if HR kinetics during
exercise are impaired in diabetes, and if a reduction in HR kinetics influences the VO2 kinetic
response. Investigating both VO2 and HR kinetics in active youth with T1D will provide a more
profound understanding of the limitations to exercise performance and tolerance induced by
diabetes.

25
1.11 Type 1 Diabetes and Hockey
The sport of ice hockey is both physically demanding and multifactorial (Burr et al.,
2008), as it involves full body contact, moderate-to-vigorous and vigorous-to-maximum or
high-intensity intermittent skating with frequent changes in velocity and duration
(Montgomery, 1988). Research is needed for hockey athletes because of its high-intensity
intermittent nature, which demands its athletes to possesses high levels of muscular strength,
power, endurance, aerobic power, anaerobic power and anaerobic-aerobic power
(Montgomery, 1988). A typical hockey player will spend 15-20 minutes of a 60-minute game on-
ice, performing at high-intensities in shifts that last 30-80 seconds interspersed with 4-5 minute
passive rest periods in between (Montgomery, 1988). During on-ice hockey shifts, peak HR
exceeds 90% of HRmax, with average on-ice values of approximately 85% or more of HRmax
(Montgomery, 1988). Top performance in this sport necessitates an efficient aerobic system to
be able to recover quickly between shifts and to meet the energy demands throughout the
duration of a game (Montgomery, 1988).
Traditionally the VO2max of hockey players is tested using continuous, incremental to
maximum protocols (Montgomery, 2006). No studies have reported on the VO2 and HR kinetics
during sport-specific exercise in T1D, leaving a large gap in this specific area. Studies need to be
conducted that examine sport-specific intermittent exercise to characterize the behaviour of
the aerobic (cardiovascular) system in response to this type of activity, where changes in effort
and metabolic requirements frequently fluctuate, to provide insight into two basic questions: A)
How the aerobic system of athletes with T1D responds across a full game has yet to be
26
characterized; and B) Are their cumulative VO2 and HR kinetics delayed in comparison to their
healthy counterparts, and does this in turn impair or hinder their performance in the sport? It is
important to indicate the differences between T1D and their healthy counterparts in order to
understand their limitations and help these athletes achieve their full athletic potential.
Due to the lack of research examining HITT in persons with diabetes, research-based guidelines
specific to hockey players with T1D do not exist. This creates yet another challenge for young
athletes with T1D and their families in terms of insulin therapy and BG management. It forces
them to discover their own strategies for BG management through trial and error or by
modifying the recommendations provided from other continuous moderate-to-vigorous
intensity sports. This may have severe consequences for the athlete with T1D if proper
precautions are not taken, and the possibility of life threatening situations could prematurely
end their participation in ice-hockey due to uncertainty and fear. Future research is required to
further understand how hockey players with T1D respond throughout an entire game. This
knowledge will assist in the development of detailed, evidence-based guidelines enabling
athletes with T1D to safely enjoy the benefits of regular non-exercise and exercise PA and to
assist with the training of these athletes to achieve their full athletic potential and
performance.
27
CHAPTER 2
Contributions of the authors include: Deandra Filippo- Data analysis and manuscript writing, Robert Gumieniak, Chip Rowan and Justin Sanderson- Data collection, Lisa Miadovnik- Recruitment and data collection, Michael Riddell- Secondary supervisor, Veronica Jamnik- Supervisor

28
2.0 PURPOSE AND OBJECTIVE
The purpose of the present study was to investigate the effects of a laboratory
simulated hockey game on the VO2 and HR response in young, competitive athletes with T1D.
While the principle objective is to determine whether the VO2 and HR response differs between
T1D and healthy controls, it will be interesting to observe any general trends that may occur
across the three periods of the games.
Hypothesis
We hypothesized that the game VO2 and game HR response, and %VO2max and
%HRmax will be lower in the young hockey players with T1D compared to their healthy
counterparts.
2.1 METHODS
Experimental data were collected in conjunction with another study conducted by
Miadovnik (2013). All protocols were reviewed and approved by the Human Participants
Review Sub-Committee at York University’s Office of Research Ethics. Throughout the study
there were no adverse events to report on.

29
2.1.1 Study Participants and Recruitment
Study participants were recruited through word of mouth techniques in the Greater
Toronto Area. Recruitment targeted rep-level hockey players between the ages of 13-21 years,
who were diagnosed with T1D at least 1 year prior. Recruitment flyers were distributed to
endocrinologist and diabetes clinics, posted in various arenas and hockey-centered fitness
facilities throughout the Toronto area, and postings were made online through social networks
including Facebook and Twitter. As well, parents of youth who participated in a T1D-focused
sports camp were contacted via email. Interested individuals were questioned regarding
pubertal level and age of diabetes diagnosis. Based on parental or guardian report, if the study
participants had not commenced puberty, were newly diagnosed with T1D, played hockey at a
non-competitive level, played goalie, or were diagnosed with nervous system dysfunctions or
retinopathy, they were excluded from the study. A teammate who does not have T1D was
selected to function as a matched control participant. The control participants were similar in
age, sex, height, body mass, and physical activity level. All study participants underwent
identical measures. A schematic overview of the laboratory measures is presented in Figure 3.
A total of 18 competitive, youth hockey players participated in the investigation; 12
males and 6 females with and an age range of 13-17 (mean 14.7 ± 1.58). To screen for
contraindications to completing vigorous exercise, all study participants completed evidence-
based 2013 PAR-Q+ and ePAR-med-X+ PA participation questionnaires (www.eparmedx.com).
Minor assent forms were sent to study participants under 16 years, along with consent forms to
parents or guardians, and study participants over the age of 16 were directly supplied with

30
informed consent forms. All forms were emailed to the study participants before visiting the
laboratory, and were collected during their initial visit. All participants had a minimum of two
visits to the laboratory.
2.1.2 Visit One: Laboratory Physical and Physiological Fitness Assessments
Anthropometric Data. Wearing light clothing and no shoes, body mass was measured
using a digital scale (Seca Alpha, Germany). Height was measured without footwear using a
wall-mounted stadiometer. BMI was calculated by dividing body mass in kilograms by height in
meters squared. Waist circumference was measured using the National Institute of Health
protocol, where the measuring tape is positioned horizontally on the skin, on the top border of
the iliac crest. Bioelectrical impedance analysis (Tanita scale, model TBF-612, Arlington Heights,
lll) was used to determine body fat percentage. Skinfold measurements were taken in
accordance with the Canadian Physical Activity, Fitness and Lifestyle Approach (Gledhill &
Jamnik, 2003 and the Physical Activity and Lifestyle “R” Medicine (Gledhill & Jamnik, 2012).
Markings were made at the following skinfold sites: biceps, triceps, subscapula, iliac crest and
medial calf, and measurements were made using Harpenden fat callipers.
Anaerobic and Aerobic Fitness. To participate in both the anaerobic and aerobic fitness
assessment, individuals with T1D were required to have a BG level between 5-15 mmol/L. BG
was measured with the individual’s own hand held device. Individuals were allowed one
attempt to correct BG levels if they were below the threshold by administering 16 grams of
carbohydrate (4 tablets of Dex4). In contrast, if participants were above the BG threshold they
31
were instructed to consume water and take insulin if they deem that appropriate. Participants
were asked to take a subsequent BG reading 15-30 minutes after their initial check and testing
proceeded only if the BG levels were corrected. If the participants did not achieve the target
range within 15-30 minutes, the laboratory testing was re-scheduled for another day.
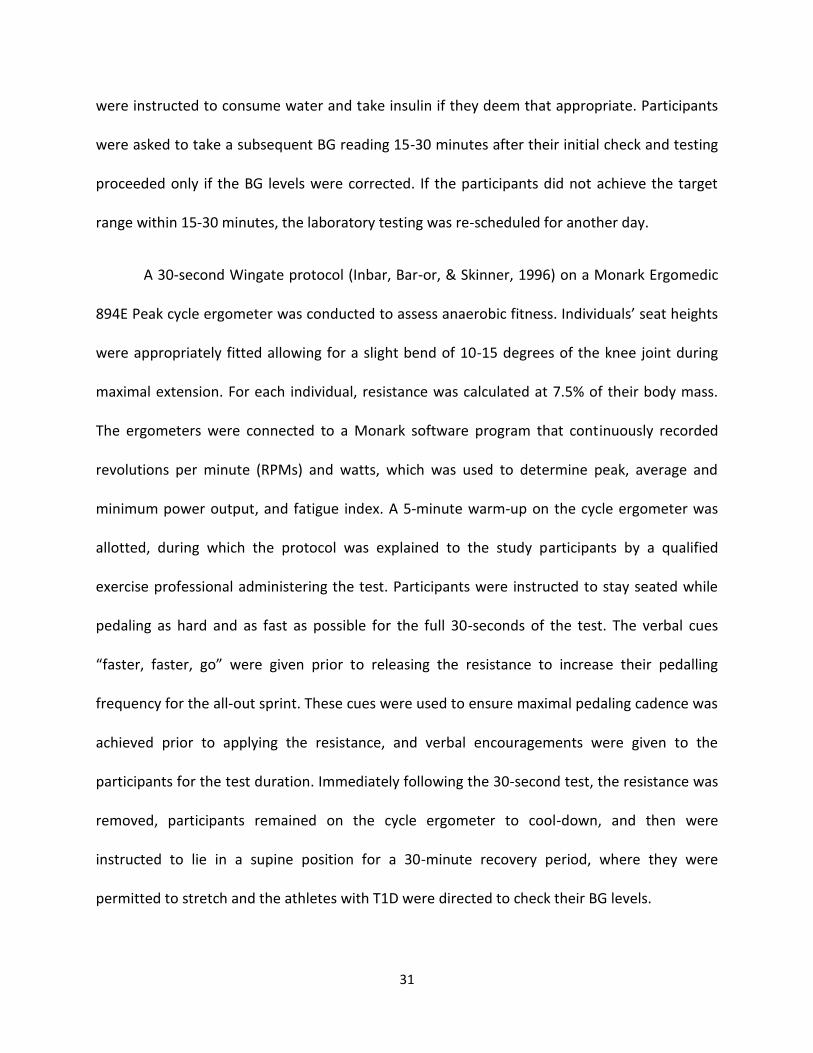
A 30-second Wingate protocol (Inbar, Bar-or, & Skinner, 1996) on a Monark Ergomedic
894E Peak cycle ergometer was conducted to assess anaerobic fitness. Individuals’ seat heights
were appropriately fitted allowing for a slight bend of 10-15 degrees of the knee joint during
maximal extension. For each individual, resistance was calculated at 7.5% of their body mass.
The ergometers were connected to a Monark software program that continuously recorded
revolutions per minute (RPMs) and watts, which was used to determine peak, average and
minimum power output, and fatigue index. A 5-minute warm-up on the cycle ergometer was
allotted, during which the protocol was explained to the study participants by a qualified
exercise professional administering the test. Participants were instructed to stay seated while
pedaling as hard and as fast as possible for the full 30-seconds of the test. The verbal cues
“faster, faster, go” were given prior to releasing the resistance to increase their pedalling
frequency for the all-out sprint. These cues were used to ensure maximal pedaling cadence was
achieved prior to applying the resistance, and verbal encouragements were given to the
participants for the test duration. Immediately following the 30-second test, the resistance was
removed, participants remained on the cycle ergometer to cool-down, and then were
instructed to lie in a supine position for a 30-minute recovery period, where they were
permitted to stretch and the athletes with T1D were directed to check their BG levels.

32
Aerobic fitness was assessed following the 30-minute rest period provided BG levels
were stable and above 5mmol/L. Appropriate measures were taken if the BG values were
below this level. A modified Astrand and Pollock (1978) incremental-to-maximum effort
treadmill protocol was administered where both VO2max and HRmax were determined. Polar
heart rate monitors were worn by the participants to obtain peak or maximum exercise HR.
Participants were familiarized with the testing protocol and equipment during a brief warm up
of walking on the treadmill. The protocol design incorporated multiple incremental 2-minute
stages, where running speed and incline were progressively adjusted to increase intensity. All
participants started the first stage at 3.5 mph (5.6 kph) at 0% incline, then proceeded to 5 mph
(8.1 kph) at 0% incline, and then followed by 6.0 mph (9.7 kph) at 0% incline. Following the first
3 stages the speed was adjusted based on individual running biomechanics, therefore some
participants may have stayed at a speed of 6.0 mph (9.7 kph), while others were increased to
6.5 (10.5 kph), 7 (11.3 kph), or 7.5 mph (12.1 kph). Once a comfortable running speed between
6.0 (9.7 kph) and 7.5 mph (12.1 kph) was determined, the speed was kept constant and the
intensity was increased by adjusting the incline for the duration of the test. The incline was
increased by 2% for all of the following 2-minute stages. Verbal motivation was given to the
participants to run for as many continuous stages as possible. When continuous running was no
longer possible for the participant, the speed was adjusted to a walking speed for 2 minutes,
marking the beginning of the discontinuous workloads to maximal (or supramaximal- see
below) effort. During the discontinuous portion, participants ran at the speed determined
during the continuous portion, while the incline was raised 2% higher than the previous
workload. Each discontinuous stage lasted 2 minutes and was separated by 2 minutes of active

33
recovery (walking), this pattern continued for the duration of the test until VO2max was
attained, that is the VO2 remained the same or dropped with increasing workloads (Gledhill,
Cox, & Jamnik, 1994; Howley, Bassett, & Welch, 1995). Supramaximal testing represents high
intensity exercise, specifically performed by an individual at workloads greater than that
required to elicit VO2max (Crisafulli et al., 2004). Supramaximal workloads are widely used to
confirm the attainment of VO2max during cardiovascular exercise testing (Astorino, White, &
Dalleck, 2009).
Indirect calorimetry, specifically open circuit spirometry, was used for the determination
of VO2 and VO2max or VO2peak. Open circuit spirometry requires an individual to inhale air
from the atmosphere and exhale air through a mouth-piece attached to a two-way valve (Ewald
Koegal Co, San Antonio Texas), while wearing a nose plug. The two-way valve was attached to a
hose, which was then connected to a 120L Tissotgasometer (Warren E Collins LTD. Braintree,
Massachusetts). During the last 30 seconds of each incremental stage the fractional
concentration of expired oxygen (FEO2) and carbon dioxide (FECO2), along with the volume of air
expired was measured. Oxygen consumption (VO2) and carbon dioxide production (VCO2) was
calculated for each workload using the recorded measurements (FEO2, FECO2, volume of air
expired). Rapid response gas analyzers (Applied Electrochemistry, Model S-3A and CD-3S,
Sunnyvale, California) were used to analyze the oxygen and carbon dioxide concentrations of
the expired air. At the end of each incremental stage Rating of Perceived Exertion on a scale of
6 to 20 (Borg, 1982) and HR were recorded. The VO2max test was terminated only if the
participant could no longer complete a workload as a result of volitional fatigue, or if the
qualified exercise professionals indicated that the participant reached their VO2max .

34
2.1.3 Visit Two: Laboratory Simulation Hockey Game Protocol
Design. The “play” intervals during the laboratory simulated hockey game were based
on the duration and intensity of HR monitored during play intervals throughout regular hockey
games. Individuals wore a coded polar HR monitor during a regular on-ice hockey game. The
recorded HR values were then examined to identify HR fluctuations throughout the games.
Each sustained increase, or dip, in HR was analyzed for duration and intensity, as the HR was
assumed to indicate a hockey shift involving skating sprints and stops during play, or a bench
period between shifts respectively. A standardized laboratory-exercise protocol (Appendix D)
was developed from the on-ice game information.
The simulation hockey game protocol consisted of three 20-minute periods of
intermittent high-intensity exercise separated by a 10-minute break period. Participants
exercised on a Monark Ergomedic 894E Peak cycle ergometers, the same ergometer was used
for the Wingate test, which were hooked up to laptop computers to measure RPMs and power
output in Watts. Resistance was set at 5.25% of the participant’s body mass, or 70% of their
Wingate resistance. The participants were verbally prompted to accelerate and decelerate their
pedalling frequency using the cues “go,” “whistle” and “bench.” The term “go” was used to
direct the participant to sprint on the ergometer with the same exertion they would during a
hockey shift. “Whistle” signified a stoppage in play and the participants were permitted to sit
stationary or pedal lightly with no resistance. Lastly, “bench” was used to indicate a prolonged
break between shifts, during which participants rested without pedalling on the cycle
ergometer.

35
Laboratory Game Simulation Procedures. Upon entering the laboratory, participants
were instructed to treat the simulated hockey exercise similar to how they would during a
regular game. Appropriate measures were taken to ensure BG levels were in the appropriate
range before commencing game simulation. Whole BG concentration was measured with the
individual’s own hand held device. Study participants were permitted one attempt to correct
BG levels if they were below threshold by administering 16 grams of carbohydrate (4 tablets of
Dex4), or consume a snack of choice with the same carbohydrate content. If participants were
above the BG threshold upon entering the laboratory they were instructed to consume water
and take insulin if deemed appropriate. A second BG reading was taken 15-30 minutes after
their initial check. Participation in the laboratory hockey game simulation proceeded only if the
individuals’ BG levels were corrected, if the individuals’ BG levels were not within the safe
range the laboratory protocol was re-scheduled for another day.
Before commencing the game simulation protocol, the participants were weighed and
fitted with a Polar heart rate monitor and Fitmate VO2 max system (Image Monitoring). During
the protocol HR, VO2, RPMs and Watts were continuosly monitored and recorded. At the end of
each period, participants were given a 10-minute break where they were permitted to get off
the cycle ergometer, walk around and stretch. At this time the individual with T1D checked
their BG levels, and if at any time BG levels approached unsafe levels, 4 dextrose tablets were
administered orally (16 grams of carbohydrate). The hockey game simulation protocol was
followed by a cool-down.
36
Figure 3. Summary of Laboratory Measures
2.1.4 Data and Statistical Analysis of the VO2 and HR Response
The raw breath-by-breath VO2 and HR data measured via the Fitmate VO2max and Polar
Heart Rate systems were time aligned to the start of exercise, with the onset of exercise
defined as t = 0. The participants’ data for all three periods were then averaged over
consecutive 10-second intervals to reduce noise and enhance the underlying characteristic.
The resulting VO2 and HR data were then converted to be expressed as a percentage of VO2
max (%VO2) and HRmax (%HR) for each participant. Finally, the nadir (minimum) and peak
(maximum) VO2 and HR percentage values for each shift and bench intervals were also
compiled for statistical analysis.
The SPSS statistical software Version 20, was used for all the analysis, with a threshold
for statistical significance set at p ≤ 0.05 a priori. Descriptive statistics (MSD) were calculated to
Participants
VO2
(mL∙Kg-1
∙min-1
)
HR (bpm) RPM
Watts
Anthropometry
Height (cm)
Weight (Kg)
Body Composition
Laboratory Physical & Physiological Fitness Assessments
Simulation Hockey Game Protocol
Anaerobic Fitness
30-Second Wingate Protocol
VO2
max
Incremental-to-maximum
Treadmill Protocol
Aerobic Fitness
Simulated 3 period Hockey Game on Cycle
Ergometer

37
summarize the participants’ anthropometric and physical plus physiological fitness
characteristics. Independent samples t-tests were performed to assess any differences between
the T1D and their matched controls for the various anthropometric, physical and physiologic
variables where appropriate. Data collection errors in the Fitmate VO2max system resulted in
incomplete data sets for 5 participants; therefore 13 participants were included in the final
statistical analysis of VO2 and HR. An initial two-way repeated measures analysis of variance
(ANOVA) was conducted using the group means of the raw %VO2 and %HR data to determine
any group differences across the three periods. Prior to the analysis, the individual participants’
raw VO2 and HR data was converted to be expressed as a percentage of VO2 max and HRmax.
Lastly, the mean differences of VO2 and HR, expressed as the mean nadir (minimum) and mean
peak (maximum) values of percent VO2max and HRmax, were assessed using a two-way
repeated measures analysis of variance (ANOVA) to determine if the VO2 and HR response
differed across the three simulated hockey periods, and between the T1D and their matched
controls. Sphericity tests were evaluated, and if necessary, the Greenhouse-Geiser method was
used to adjust the degrees of freedom. The Bonferroni post-hoc comparison was used to locate
specific pairwise differences between the three hockey game simulation periods.
2.2 RESULTS
2.2.1 Study Participants’ Characteristics
In total, 12 males and 6 females participated in laboratory physical and physiological
fitness assessments and simulated hockey game. Nine of the participants had T1D and each of

38
the nine had a control (ND) that was matched in age, sex, and physical plus physiological fitness
level. All participants played competitive ice hockey; 4 at the A- level, 6 at the AA- level, and 8
at the AAA- level, with the AAA- being the most competitive level. Descriptive statistics of the
anthropometric and physical and physiological fitness profiles of the ice hockey players are
reported in Table 1. According to an independent samples t-test, there were no significant
differences between the T1D and ND groups in any of the anthropometric and physical plus
physiological fitness measurements (p < 0.05). Participants’ age ranged from 13 to 17 years
with a mean age of 14.7 ± 1.58. The mean relative VO2 max was 55.6 ± 5.7 mL·kg-1·min-1 (range
43.3-64.1) and the mean HRmax was 196.9 ± 6.6 bpm (range 186-209). Given the small number
of female study participants no statistical analyses on sex differences were conducted.
Table 2. Anthropometric and Physical plus Physiological Fitness Profiles of Competitive Youth
Ice Hockey Players With and Without T1D (M ± SD).
T1D (n = 9) ND (n = 9) P value
Age (yrs) 14.7 ± 1.58 14.7 ± 1.58 1.00
Height (cm) 169.3 ± 7.7 170.1 ± 8.5 .841
Weight (kg) 67.1 ± 8.6 66.2 ± 10.4 .850
WC (cm) 77.0 ± 5.3 78.0 ± 6.1 .740
Skinfolds (mm) 64.8 ± 22.6 52.2 ± 11.9 .185
VO2max (mL·kg-1·min-1) 54.6 ± 5.3 56.7 ± 6.2 .453
HRmin (bpm) 53.8 ± 5.7 52.4 ± 8.4 .699
HRmax (bpm) 196.7 ± 8.1 197.2 ± 5.2 .864
Peak Power (Watts) 670.1 ± 148.9 716.1 ± 192.1 .579
Peak Power (Watts/kg) 9.9 ± 1.4 10.7 ± 1.6 .318
Fatigue (%) 46.4 ± 8.9 48.4 ± 9.6 .719 *Significant difference between T1D and ND groups p < 0.05

39
Traditionally, VO2 kinetics has been analyzed by plotting and modeling the VO2 response
using an exponential equation. In this investigation we chose to use a different approach,
because of experimental conditions and technological limitations, as the traditional method
was designed for investigating the VO2 kinetic response during constant-load exercise. The
specific exponential equation (ΔVO2(t) = VO2(b) + A(1 – e-t/T)) could not be applied to the HITT
exercise performed in the present study, as the equation assumes that from baseline, VO2
increases exponentially until a steady-state is achieved. The simple exponential function y = ex
is used to model a relationship in which a constant change in the independent variable (in this
case time) gives the same proportional change in the dependent variable (VO2). The simulation
hockey game protocol was not a constant-load situation; within the 7 play shifts, the duration
of the bouts of play and active rests continually varied. As well, the play shifts performed were
not long enough in duration to achieve a steady-state VO2. Moreover, it was deemed unlikely
that VO2 increased at the same rate during each play shift in each shift as there was a different
amount of work being accomplished with each simulated play shift (e.g. 30s of work vs 10s vs
40s). As such, VO2 could not be compared across the play shifts. Therefore, we chose to analyse
the VO2 and HR response simply by plotting and representing the data as a percentage of
measured VO2max and HRmax and using the nadir, mean and peak values from the play shifts
to identify a possible unique response.

40
2.2.2 Laboratory Simulation Hockey Game Protocol
The study participants with T1D attended the laboratory sessions along with their paired
ND teammate. The pairs completed the simulation hockey game protocol in tandem which
consisted of three 20-minute periods, each separated by 10 minute of non-exercise rest. During
rest, all participants were allowed to walk around. As well, the participants with T1D were
directed to check their BG and consume dextrose tablets if required.
Prior to starting the simulation hockey game protocol, two participants with T1D had BG
levels below the 5 mmol/L safety cut-off, and therefore were treated with either 16 grams of
dextrose or a self-supplied snack (comparable to what they would consume during an ice
hockey game their BG was low). The single attempt to correct BG was successful for both
participants and the hockey game simulation protocol proceeded. During the simulation hockey
game, one participant with T1D required dextrose supplementation because of low BG levels
(<5 mmol/L). VO2 and HR recordings were completed for 13 individuals (7 T1D, and 6 ND). One
participant in the T1D group was unable to complete the first period of the simulation hockey
game resulting in incomplete recordings for this individual and their paired ND control. For
three other individuals, incomplete data recordings were due to limitations of the equipment,
where the Fitmate VO2 system stopped recording part way through a 20-minute period, or
failed to record VO2 and HR entirely. VO2 and HR data from 13 completed recordings for period
1 of the simulation hockey game are represented in Figure 4. During the initial shift, it was
observed that VO2 and HR increased rapidly from approximately 20% to 80% and approximately
55% to 90% respectively during the first 80 seconds of period 1. In each of the subsequent shifts

41
within the period VO2 ranged from 50% to 80% of VO2max, and HR ranged from 75% to 90% of
HRmax.
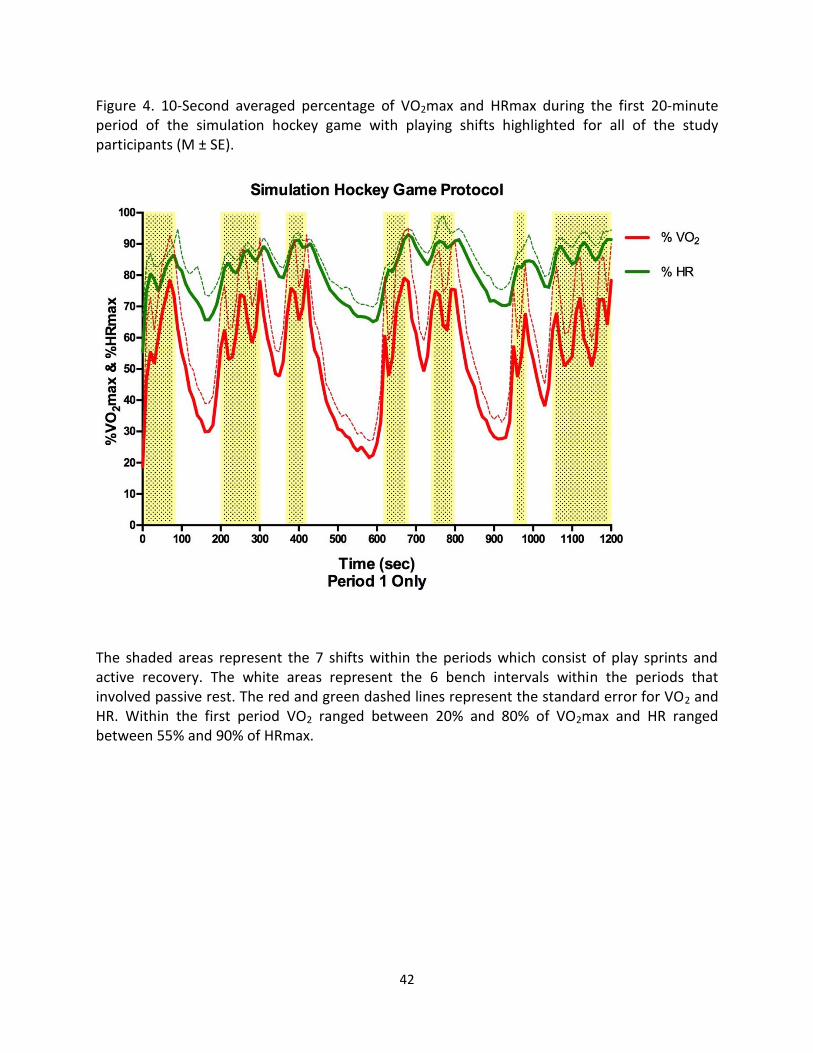
42
Figure 4. 10-Second averaged percentage of VO2max and HRmax during the first 20-minute period of the simulation hockey game with playing shifts highlighted for all of the study participants (M ± SE).
The shaded areas represent the 7 shifts within the periods which consist of play sprints and active recovery. The white areas represent the 6 bench intervals within the periods that involved passive rest. The red and green dashed lines represent the standard error for VO2 and HR. Within the first period VO2 ranged between 20% and 80% of VO2max and HR ranged between 55% and 90% of HRmax.

43
2.2.3 Raw Data
An initial two-way ANOVA with repeated measures on the mean breath-by-breath
%VO2max and %HRmax was conducted. Table 3 contains the mean breath-by-breath %VO2max
and %HRmax between the two groups for all 3 periods of the simulation hockey game. Figure 5
illustrates the comparison of %VO2max between the individuals with and without T1D. There
was no significant difference in the mean %VO2max between the groups during the simulation
hockey game (F(1.11) = 0.06, p > 0.05). Figure 6 illustrates the % HRmax comparison between
the individuals with and without T1D. The analysis of %HRmax indicated that there were no
significant differences in the mean %HRmax between the two groups of participants (F(1,11) =
0.06, p > 0.05).
Table 3. The mean breath-by-breath %VO2max and %HRmax for all 3 periods of the simulation
hockey game for competitive youth ice hockey players with and without T1D (M ± SE).
% VO2max % HRmax
T1D (n=7) ND (n=6) T1D (n=7) ND (n=6)
Period 1 55.6 ± 3.5 57.1 ± 3.8 82.3 ± 1.0 82.0 ± 1.1
Period 2 52.6 ± 4.1 53.0 ± 4.4 82.5 ± 1.1 82.3 ± 1.2
Period 3 54.2 ± 4.4 56.4 ± 4.7 82.2 ± 1.3 81.5 ± 1.4 There were no significant differences between groups p < 0.05

44
Figure 5. Comparing the mean %VO2max during 3 periods of a simulation hockey game between competitive youth ice hockey players with and without T1D (M ± SE).
There are no significant differences (p > 0.05) in the mean %VO2max between the T1D and ND groups. Mean values and standard error bars are included. During the 3 periods all of the participants are working at approximately 55% of their VO2max.

45
Figure 6. Comparing the mean %HRmax during periods of a simulation hockey game between
competitive youth ice hockey players with and without T1D (M ± SE).
There are no significant differences (p > 0.05) in the mean %HRmax between the T1D and ND groups. Mean values and standard error bars are included. During the 3 periods all of the participants are working at approximately 82% of their HRmax.

46
In addition to the between groups analysis, a within group between periods analysis was
also conducted for the mean breath-by-breath %VO2max and %HRmax data. Table 4
summarizes the mean and standard error for %VO2max and %HRmax between the 3 periods for
the groups individually. Figure 7 illustrates the mean %VO2max displayed in 10-second averaged
intervals across the 3 simulation hockey periods. There was no significant difference observed
in the mean %VO2max between the 3 periods for both groups (F(2,22) = 3.29, p > 0.05). Figure 8
illustrates the mean %HRmax displayed in 10-second averaged intervals across the 3 simulation
hockey periods. There was no significant difference observed in the mean %HRmax between
the 3 periods for both groups (F(1.19,13.12) = 0.27, p > 0.05). Both the T1D and ND groups
worked at approximately 55% and 82% of their VO2max and HRmax respectively, throughout
the 60-minute simulation hockey game.
Table 4.The mean breath-by-breath %VO2max and %HRmax between periods of a simulation
hockey game for competitive youth ice hockey players with and without T1D (M ± SE).
%VO2max
Mean ± SE
T1D(n=7) Period 1 55.6 ± 3.5
Period 2 52.6 ± 4.1
Period 3 54.2 ± 4.4
ND (n=6) Period 1 57.1 ± 3.8
Period 2 53.0 ± 4.4
Period 3 56.4 ± 4.7
%HRmax
T1D(n=7) Period 1 82.3 ± 1.0
Period 2 82.5 ± 1.1
Period 3 82.2 ± 1.3
ND (n=6) Period 1 82.0 ± 1.1
Period 2 82.3 ± 1.2
Period 3 81.5 ± 1.4
There were no significant differences between periods p > 0.05

47
Figure 7a. 10-Second average oxygen consumption expressed relative to VO2max across all 3 periods of a 60-minute simulation hockey game for competitive youth ice hockey players with and without T1D. Plotted without the standard error.
There are no differences in %VO2max between periods 1, 2 and 3 for the T1D and ND groups (p > 0.05). The %VO2max is fairly consistent between periods 1, 2 and, and ranges between 20% and 90% for both groups. It is evident that the individuals with and without T1D are able to perform a longer duration of HITT without fatiguing. Figure 7b. 10-Second average oxygen consumption expressed relative to VO2max across all 3 periods of a 60-minute simulation hockey game for competitive youth ice hockey players with and without T1D. Plotted with the standard error (M ± SE).
The standard error is represented by the dashed black and red lines for the T1D and ND groups respectively. There are no differences in %VO2max between periods 1, 2 and 3 for the T1D and ND groups (p > 0.05). The %VO2max is fairly consistent between periods 1, 2 and, and ranges between 20% and 90% for both groups. It is evident that the individuals with and without T1D are able to perform a longer duration of HITT without fatiguing.

48
Figure 8a. 10-Second average heart rate expressed relative to HRmax across all 3 periods of a 60-minute simulation hockey game for competitive youth ice hockey players with and without T1D. Plotted without the standard error.
There are no differences in %HRmax between periods 1, 2 and 3 for the T1D and ND groups. It is illustrated that the %HRmax remains consistent between periods 1, 2 and 3. %HRmax ranges between 60% and 90% for both groups of participants. Figure 8b. 10-Second average heart rate expressed relative to HRmax across all 3 periods of a 60-minute simulation hockey game for competitive youth ice hockey players with and without T1D. Plotted with the error bars (M ± SE).
The standard error is represented by the dashed blue and orange lines for the T1D and ND groups respectively. There are no differences in %HRmax between periods 1, 2 and 3 for the T1D and ND groups. It is illustrated that the %HRmax remains consistent between periods 1, 2 and 3. %HRmax ranges between 60% and 90% for both groups of participants.

49
2.2.4 Averaged Nadir and Peak %VO2max and %HRmax During the Play Shift Intervals
Further analyses were conducted on the means of the nadir and peak %VO2max and
%HRmax values for each play shift and bench intervals using the 10-second averaged data. A
two-way ANOVA with repeated measures was used to determine if significant mean differences
in the resting (resting VO2 expressed as a percentage of VO2max), average nadir and the
average peak values of %VO2max and %HRmax were present between the T1D and ND groups
at rest and during play shift and bench intervals. In addition, the two-way ANOVA with
repeated measures was used to reveal any significant mean differences in the rest, average
nadir and the average peak values of %VO2max and %HRmax across the 3 periods for the T1D
and ND groups individually.
Table 5 summarizes the means and standard errors for the average nadir and the
average peak %VO2max from the pairwise comparison between the T1D and ND groups. There
are no significant differences in either of the average nadir and the average peak %VO2max
between the T1D and ND individuals at rest, or during any of the 7 play shift and 6 bench
intervals during the 3 periods (Figure 9). The individuals with T1D are able to achieve similar
high range %VO2max values, 70-90% of VO2max, compared with the ND during the 7 play shift
intervals across all 3 periods.
Table 6 summarizes the means and standard errors for the average nadir and the
average peak %HRmax from the pairwise comparison between the T1D and ND groups. The
analyses indicated that there were no significant differences in both the average nadir and the
average peak %HRmax between the T1D and ND groups at rest, or during any of the 7 play shift
and 6 bench intervals within the 3 periods (Figure 10). Across the 3 periods similar %HRmax

50
high values, 80-95% of HRmax, between the T1D and ND individuals were reached during the 7
play shift intervals.

51
Table 5. Comparison of the average oxygen consumption expressed relative to VO2max at the
beginning and end of each play shift and bench interval during a 60-minute simulation hockey
game between competitive youth ice hockey players with and without T1D (M ± SE).
Period 1 Period 2 Period 3
T1D (n=7) ND (n=6) T1D (n=7) ND (n=6) T1D (n=7) ND (n=6)
Rest 0.19 ± 0.027 0.18 ± 0.181 0.30 ± 0.049 0.24 ± 0.243 0.20 ± 0.028 0.18 ± 0.177
Shift 1
High 0.80 ± 0.052 0.85 ± 0.057 0.76 ± 0.055 0.78 ± 0.059 0.78 ± 0.055 0.77 ± 0.059
Low 0.41 ± 0.050 0.47 ± 0.054 0.40 ± 0.037 0.42 ± 0.040 0.37 ± 0.038 0.38 ± 0.041
Bench 1
High 0.66 ± 0.052 0.62 ± 0.056 0.67 ± 0.038 0.62 ± 0.042 0.60 ± 0.048 0.65 ± 0.052
Low 0.26 ± 0.029 0.28 ± 0.031 0.27 ± 0.030 0.25 ± 0.033 0.23 ± 0.015 0.23 ± 0.016
Shift 2
High 0.77 ± 0.050 0.83 ± 0.054 0.74 ± 0.059 0.76 ± 0.064 0.80 ± 0.050 0.83 ± 0.054
Low 0.48 ± 0.029 0.48 ± 0.031 0.48 ± 0.030 0.40 ± 0.033 0.45 ± 0.015 0.51 ± 0.016
Bench 2
High 0.66 ± 0.053 0.72 ± 0.057 0.62 ± 0.053 0.64 ± 0.057 0.63 ± 0.061 0.68 ± 0.065
Low 0.45 ± 0.027 0.40 ± 0.029 0.38 ± 0.035 0.38 ± 0.038 0.37 ± 0.037 0.41 ± 0.040
Shift 3
High 0.83 ± 0.038 0.87 ± 0.041 0.78 ± 0.062 0.81 ± 0.067 0.82 ± 0.041 0.86 ± 0.044
Low 0.60 ± 0.037 0.61 ± 0.040 0.47 ± 0.040 0.55 ± 0.043 0.54 ± 0.040 0.59 ± 0.043
Bench 3
High 0.65 ± 0.049 0.66 ± 0.053 0.56 ± 0.049 0.66 ± 0.053 0.64 ± 0.056 0.72 ± 0.061
Low 0.19 ± 0.017 0.18 ± 0.019 0.17 ± 0.021 0.17 ± 0.023 0.18 ± 0.019 0.17 ± 0.021
Shift 4
High 0.77 ± 0.052 0.89 ± 0.056 0.74 ± 0.060 0.80 ± 0.065 0.79 ± 0.056 0.84 ± 0.061
Low 0.44 ± 0.038 0.49 ± 0.041 0.36 ± 0.052 0.40 ± 0.056 0.39 ± 0.044 0.40 ± 0.048
Bench 4
High 0.68 ± 0.049 0.69 ± 0.052 0.64 ± 0.050 0.66 ± 0.053 0.65 ± 0.059 0.69 ± 0.063
Low 0.48 ± 0.039 0.46 ± 0.043 0.41 ± 0.021 0.45 ± 0.023 0.38 ± 0.026 0.46 ± 0.028
Shift 5
High 0.81 ± 0.038 0.84 ± 0.041 0.83 ± 0.051 0.79 ± 0.055 0.81 ± 0.040 0.87 ± 0.043
Low 0.63 ± 0.038 0.54 ± 0.041 0.55 ± 0.048 0.53 ± 0.052 0.57 ± 0.061 0.60 ± 0.066
Bench 5
High 0.64 ± 0.055 0.66 ± 0.060 0.59 ± 0.060 0.65 ± 0.065 0.64 ± 0.054 0.66 ± 0.059
Low 0.23 ± 0.022 0.25 ± 0.024 0.20 ± 0.019 0.22 ± 0.020 0.21 ± 0.022 0.21 ± 0.024
Shift 6
High 0.71 ± 0.065 0.67 ± 0.070 0.76 ± 0.062 0.77 ± 0.067 0.74 ± 0.057 0.76 ± 0.061
Low 0.37 ± 0.048 0.46 ± 0.052 0.50 ± 0.042 0.44 ± 0.045 0.45 ± 0.048 0.49 ± 0.052
Bench 6
High 0.61 ± 0.041 0.58 ± 0.044 0.62 ± 0.043 0.65 ± 0.047 0.65 ± 0.064 0.67 ± 0.069
Low 0.35 ± 0.032 0.36 ± 0.034 0.37 ± 0.034 0.39 ± 0.037 0.35 ± 0.036 0.38 ± 0.038
Shift 7
High 0.80 ± 0.039 0.84 ± 0.043 0.81 ± 0.045 0.86 ± 0.049 0.85 ± 0.049 0.87 ± 0.053
Low 0.47 ± 0.032 0.43 ± 0.035 0.46 ± 0.034 0.46 ± 0.037 0.45 ± 0.044 0.47 ± 0.048
There were no significant differences between groups p > 0.05
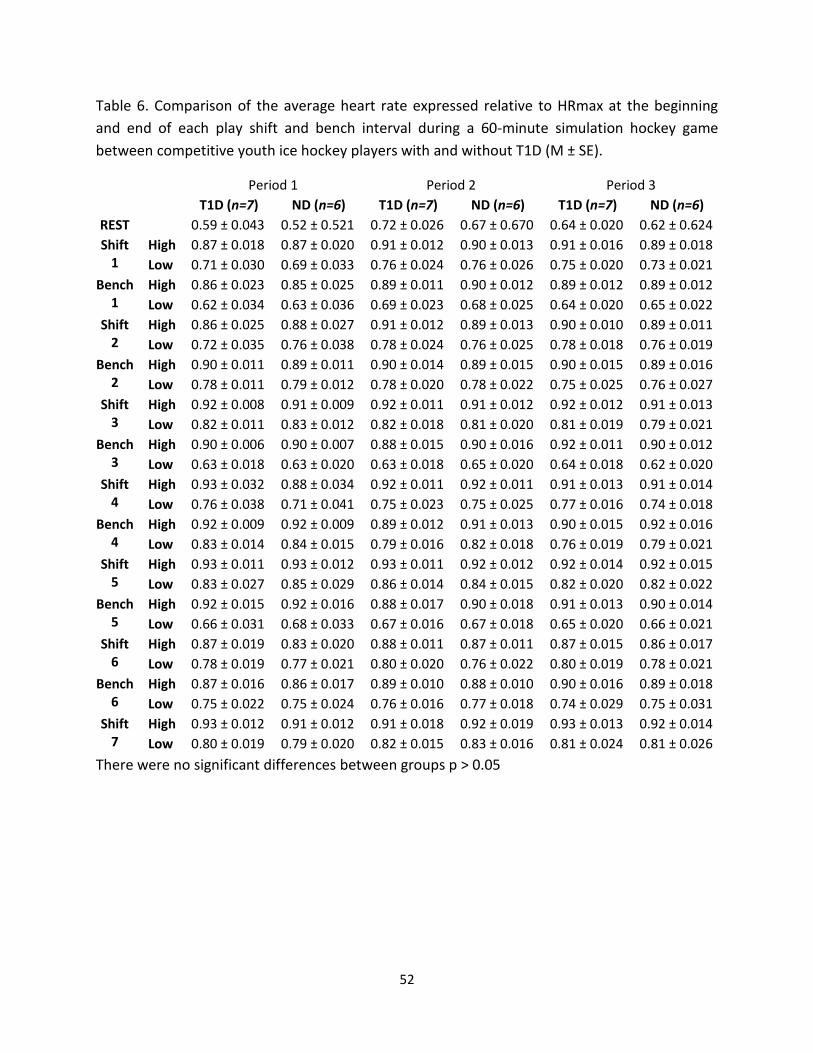
52
Table 6. Comparison of the average heart rate expressed relative to HRmax at the beginning
and end of each play shift and bench interval during a 60-minute simulation hockey game
between competitive youth ice hockey players with and without T1D (M ± SE).
Period 1 Period 2 Period 3
T1D (n=7) ND (n=6) T1D (n=7) ND (n=6) T1D (n=7) ND (n=6)
REST 0.59 ± 0.043 0.52 ± 0.521 0.72 ± 0.026 0.67 ± 0.670 0.64 ± 0.020 0.62 ± 0.624
Shift 1
High 0.87 ± 0.018 0.87 ± 0.020 0.91 ± 0.012 0.90 ± 0.013 0.91 ± 0.016 0.89 ± 0.018
Low 0.71 ± 0.030 0.69 ± 0.033 0.76 ± 0.024 0.76 ± 0.026 0.75 ± 0.020 0.73 ± 0.021
Bench 1
High 0.86 ± 0.023 0.85 ± 0.025 0.89 ± 0.011 0.90 ± 0.012 0.89 ± 0.012 0.89 ± 0.012
Low 0.62 ± 0.034 0.63 ± 0.036 0.69 ± 0.023 0.68 ± 0.025 0.64 ± 0.020 0.65 ± 0.022
Shift 2
High 0.86 ± 0.025 0.88 ± 0.027 0.91 ± 0.012 0.89 ± 0.013 0.90 ± 0.010 0.89 ± 0.011
Low 0.72 ± 0.035 0.76 ± 0.038 0.78 ± 0.024 0.76 ± 0.025 0.78 ± 0.018 0.76 ± 0.019
Bench 2
High 0.90 ± 0.011 0.89 ± 0.011 0.90 ± 0.014 0.89 ± 0.015 0.90 ± 0.015 0.89 ± 0.016
Low 0.78 ± 0.011 0.79 ± 0.012 0.78 ± 0.020 0.78 ± 0.022 0.75 ± 0.025 0.76 ± 0.027
Shift 3
High 0.92 ± 0.008 0.91 ± 0.009 0.92 ± 0.011 0.91 ± 0.012 0.92 ± 0.012 0.91 ± 0.013
Low 0.82 ± 0.011 0.83 ± 0.012 0.82 ± 0.018 0.81 ± 0.020 0.81 ± 0.019 0.79 ± 0.021
Bench 3
High 0.90 ± 0.006 0.90 ± 0.007 0.88 ± 0.015 0.90 ± 0.016 0.92 ± 0.011 0.90 ± 0.012
Low 0.63 ± 0.018 0.63 ± 0.020 0.63 ± 0.018 0.65 ± 0.020 0.64 ± 0.018 0.62 ± 0.020
Shift 4
High 0.93 ± 0.032 0.88 ± 0.034 0.92 ± 0.011 0.92 ± 0.011 0.91 ± 0.013 0.91 ± 0.014
Low 0.76 ± 0.038 0.71 ± 0.041 0.75 ± 0.023 0.75 ± 0.025 0.77 ± 0.016 0.74 ± 0.018
Bench 4
High 0.92 ± 0.009 0.92 ± 0.009 0.89 ± 0.012 0.91 ± 0.013 0.90 ± 0.015 0.92 ± 0.016
Low 0.83 ± 0.014 0.84 ± 0.015 0.79 ± 0.016 0.82 ± 0.018 0.76 ± 0.019 0.79 ± 0.021
Shift 5
High 0.93 ± 0.011 0.93 ± 0.012 0.93 ± 0.011 0.92 ± 0.012 0.92 ± 0.014 0.92 ± 0.015
Low 0.83 ± 0.027 0.85 ± 0.029 0.86 ± 0.014 0.84 ± 0.015 0.82 ± 0.020 0.82 ± 0.022
Bench 5
High 0.92 ± 0.015 0.92 ± 0.016 0.88 ± 0.017 0.90 ± 0.018 0.91 ± 0.013 0.90 ± 0.014
Low 0.66 ± 0.031 0.68 ± 0.033 0.67 ± 0.016 0.67 ± 0.018 0.65 ± 0.020 0.66 ± 0.021
Shift 6
High 0.87 ± 0.019 0.83 ± 0.020 0.88 ± 0.011 0.87 ± 0.011 0.87 ± 0.015 0.86 ± 0.017
Low 0.78 ± 0.019 0.77 ± 0.021 0.80 ± 0.020 0.76 ± 0.022 0.80 ± 0.019 0.78 ± 0.021
Bench 6
High 0.87 ± 0.016 0.86 ± 0.017 0.89 ± 0.010 0.88 ± 0.010 0.90 ± 0.016 0.89 ± 0.018
Low 0.75 ± 0.022 0.75 ± 0.024 0.76 ± 0.016 0.77 ± 0.018 0.74 ± 0.029 0.75 ± 0.031
Shift 7
High 0.93 ± 0.012 0.91 ± 0.012 0.91 ± 0.018 0.92 ± 0.019 0.93 ± 0.013 0.92 ± 0.014
Low 0.80 ± 0.019 0.79 ± 0.020 0.82 ± 0.015 0.83 ± 0.016 0.81 ± 0.024 0.81 ± 0.026
There were no significant differences between groups p > 0.05

53
Figure 9a. Comparison of the nadir oxygen consumption rate expressed relative to VO2max, at the beginning and end of each play shift and bench interval during a 60-minute simulation hockey game between individuals with and without T1D (M ± SE).
The filled circles and squares represent the nadir %VO2max for the T1D and ND groups respectively. There are no significant differences in %VO2max between the T1D and ND group observed in the 7 play shift and 6 bench intervals during any of the 3 periods (p > 0.05). The nadir %VO2max is similar between individuals with and without T1D. Nadirs range from 30-60% of VO2max for the individuals with and without T1D during the 7 play shifts for the 3 periods.
Figure 9b. Comparison of the peak oxygen consumption rate expressed relative to VO2max, at the beginning and end of each play shift and bench interval during a 60-minute simulation hockey game between individuals with and without T1D (M ± SE).
The open circles and squares represent the peak %VO2max for the T1D and ND groups respectively. There are no significant differences in %VO2max between the T1D and ND group observed in the 7 play shift and 6 bench intervals during any of the 3 periods (p > 0.05). The peak %VO2max is similar between individuals with and without T1D. Peaks range from 70-90% of VO2max for the individuals with and without T1D during the 7 play shifts for the 3 periods.
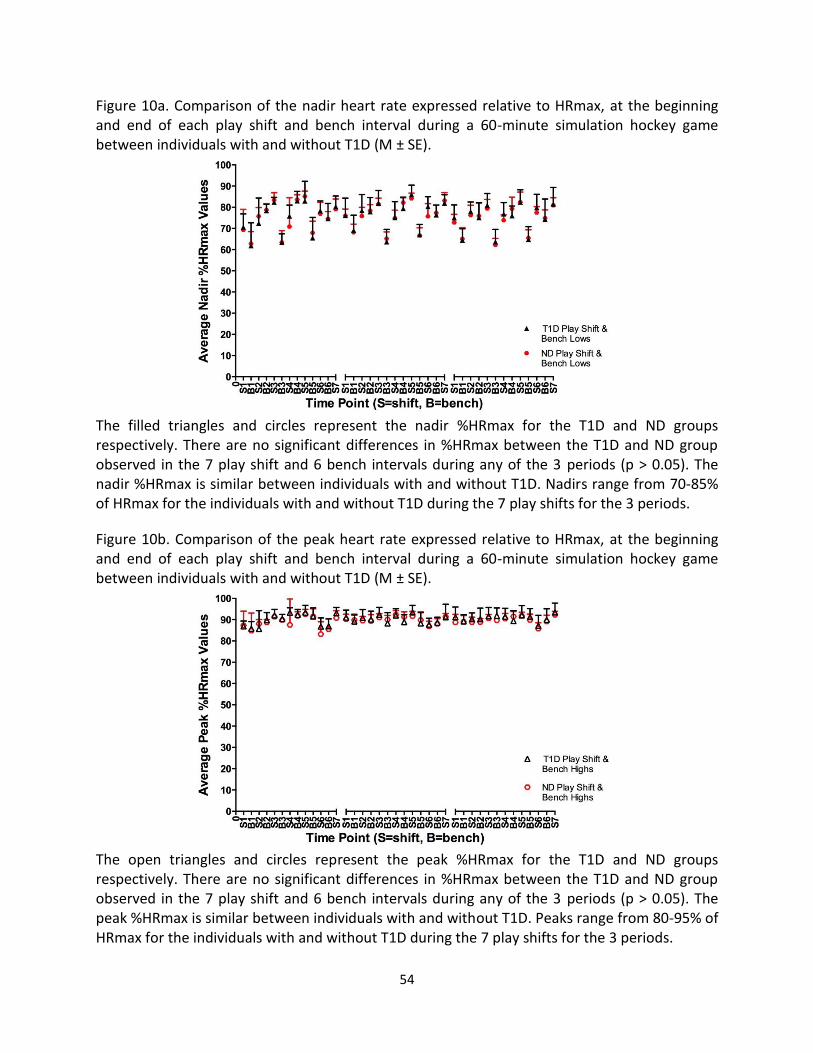
54
Figure 10a. Comparison of the nadir heart rate expressed relative to HRmax, at the beginning and end of each play shift and bench interval during a 60-minute simulation hockey game between individuals with and without T1D (M ± SE).
The filled triangles and circles represent the nadir %HRmax for the T1D and ND groups respectively. There are no significant differences in %HRmax between the T1D and ND group observed in the 7 play shift and 6 bench intervals during any of the 3 periods (p > 0.05). The nadir %HRmax is similar between individuals with and without T1D. Nadirs range from 70-85% of HRmax for the individuals with and without T1D during the 7 play shifts for the 3 periods.
Figure 10b. Comparison of the peak heart rate expressed relative to HRmax, at the beginning and end of each play shift and bench interval during a 60-minute simulation hockey game between individuals with and without T1D (M ± SE).
The open triangles and circles represent the peak %HRmax for the T1D and ND groups respectively. There are no significant differences in %HRmax between the T1D and ND group observed in the 7 play shift and 6 bench intervals during any of the 3 periods (p > 0.05). The peak %HRmax is similar between individuals with and without T1D. Peaks range from 80-95% of HRmax for the individuals with and without T1D during the 7 play shifts for the 3 periods.

55
Looking at the T1D and ND groups separately, there were some significant differences in
the average nadir and the average peak %VO2max and %HRmax values between the three
periods for both groups. The Bonferroni post hoc analysis revealed that there were no
significant differences between the periods in the mean resting %VO2max (resting VO2
expressed as a percentage of VO2max) for the T1D and ND groups, however the mean resting
%HRmax (resting HR expressed as a percentage of HRmax) was shown to be significantly
different in both of the groups (Table 7). For the T1D group the mean resting expressed as a
%HRmax, was significantly lower in period 1 compared with period 2 (p < 0.01), was
significantly higher in period 2 compared to period 3 (p < 0.01), but no differences were
observed between periods 1 and 3 (p = 0.756). In the ND group the mean resting %HRmax
during period 1 was significantly lower from period 2 (p < 0.01), and no differences were
revealed between periods 2 and 3 (p = 0.137), as well as periods 1 and 3 (p = 0.135).

56
Table 7. Mean resting oxygen consumption expressed relative to VO2max and mean resting
heart expressed relative to HRmax between periods for competitive youth ice hockey players
with and without T1D (M ± SE).
Resting %VO2max
Mean ± SE
T1D(n=7) Period 1 19.4 ± 2.698
Period 2 29.9 ± 4.883
Period 3 20.4 ± 2.795
ND (n=6) Period 1 18.1 ± 2.915
Period 2 24.3 ± 5.274
Period 3 17.7 ± 3.019
Resting %HRmax
T1D(n=7) Period 1 58.5 ± 4.307 +
Period 2 71.7 ± 2.574 +‡
Period 3 63.6 ± 2.020 ‡
ND (n=6) Period 1 52.1 ± 4.652 +
Period 2 67.0 ± 2.780 +
Period 3 62.4 ± 2.181
+ p < 0.01Significant difference between periods 1 and 2
‡ p < 0.01 Significant difference between periods 2 and 3
† p < 0.01 Significant difference between periods 1 and 3

57
Figures 11 and 12 depict the differences in the average nadir and average peak
%VO2max values during each play shift and bench intervals for the T1D and ND groups
respectively between the three periods. During the simulation hockey game protocol there
were significant differences in average nadir %VO2max values between the periods for the T1D
group during the 3rd play shift and bench intervals 2 and 4 respectively (p < 0.05). For this same
group, significant differences in the average peak %VO2max values were noted between
periods in the 2nd and 4th play shifts, plus the 3rd bench interval (p < 0.05). In the ND group
significant differences in the average peak %VO2max values were noted during the 2nd play shift
(p < 0.05). The differences observed in the average nadir and the average peak %VO2max values
for both the T1D and ND groups are likely due to the participants’ self-selected pacing
throughout the play shifts and active rest intervals throughout the simulation hockey game.
Specific group differences in the average nadir and the average peak %HRmax values for
each play shift and bench interval between the 3 periods are illustrated in Figures 11 and 12.
The analysis revealed that the average nadir %HRmax values were significantly different
between the periods in the T1D group during the 1st and 4th bench intervals, and the average
peak %HRmax values were only different between periods during the 4th bench interval (p <
0.05). In the ND group, the average nadir %HRmax values were shown to be significantly
different during the 3rd bench interval, however there were no significant differences in the
average peak %HRmax values between any of the periods in this group (p < 0.05). Similar to the
%VO2max, the differences observed in the average nadir and the average peak %HRmax values
for both the T1D and ND groups are likely due to individuals’ self-selected pacing during the
play shifts and active rest intervals throughout the simulation hockey game.

58
Figure 11. T1D group differences in the average nadir and peak oxygen consumption rate and
the average nadir and peak heart rate, expressed relative to VO2max and HRmax respectively,
between periods in a 60-minute simulation hockey game (M ± SE).
A C
B D
+ p < 0.05 Significant difference between periods 1 and 2
‡ p < 0.05 Significant difference between periods 2 and 3
† p < 0.05 Significant difference between periods 1 and 3
Average nadir and peak %VO2max and % HRmax values for all participants with T1D (n=7) for a 60 minute hockey game simulation protocol between periods. Some significant differences were shown in some of the play shift and bench intervals. Panel A. Shows the differences in average peak %VO2 values for all play shift and bench intervals between periods. Panel B. Shows the differences in average nadir %VO2max values for all play shift and bench intervals between periods. Panel C. Shows the differences in average peak %HRmax values for all play shift and bench intervals between periods. Panel D. Shows the differences in average nadir %HRmax values for all play shift and bench intervals between periods. The differences observed in the average nadir and peak %VO2max and %HRmax values for the participants with T1D are most likely due to the individuals’ self-selected pacing during the play shifts and active intervals rest during each period.

59
Figure 12. ND group differences in the average nadir and peak oxygen consumption rate and
the average nadir and peak heart rate, expressed relative to VO2max and HRmax respectively,
between periods in a 60-minute simulation hockey game (M ± SE).
A C
B D
+ p < 0.05 Significant difference between periods 1 and 2
‡ p < 0.05 Significant difference between periods 2 and 3
† p < 0.05 Significant difference between periods 1 and 3
Average nadir and peak %VO2max and %HRmax values for all ND participants (n=6) for a 60-minute hockey game simulation protocol between periods. Some significant differences were shown in some of the play shift and bench intervals. Panel A. Shows the differences in average peak %VO2max values for all play shift and bench intervals between periods. Panel B. Shows the differences in average nadir %VO2max values for all play shift and bench intervals between periods. Panel C. Shows the differences in average peak %HRmax values for all play shift and bench intervals between periods. Panel D. Shows the differences in average nadir %HRmax values for all play shift and bench intervals between periods. The differences observed in the average nadir and peak %VO2max and %HRmax values for the ND are most likely due to the individuals’ self-selected pacing during the play shifts and active rest intervals during each period.
60
2.3 DISCUSSION
The primary purpose of this study was to examine and compare the VO2 and HR
responses in a simulation hockey game protocol between a population of young, competitive
athletes with and without T1D. The study outcomes revealed that highly active youth with
uncomplicated T1D whose glycaemia is well controlled have similar physical plus physiological
fitness levels and exercise tolerances to their matched ND controls in response to HITT.
Remarkably, there were no significant differences in the VO2max, or in the average nadir, mean
and average peak %VO2max and %HRmax responses between the T1D and ND groups during
the simulation hockey game. Some significant differences were noted in the average nadir and
average peak %VO2max and %HRmax responses between the three periods for both the T1D
and ND groups individually. These observed differences during the simulation hockey game
were not consistent between the periods and were observed in both groups. Therefore, we can
postulate that the random differences observed during the simulation hockey game (HITT) were
not due to diabetes related influence on the response, but more likely due to self-selected
pacing differences between the participants during the play shift intervals.
The results of this study build on those previously published supporting no differences in
the maximal aerobic capacity between T1D and ND populations. Mosher et al. 1998, reported
that physically inactive adolescents with T1D (17.2 ± 1.2yrs) have similar VO2max values when
compared with physically inactive ND adolescents (19.4 ± 1.3yrs). The investigators measured
VO2 before and after implementing a 12-week exercise training program, and found that both
groups improved their cardiovascular endurance with no differences in VO2max between
individuals with and without T1D, pre and post training (T1D: Pre- 40.5 ± 5.8, Post- 44.8 ± 5.2

61
mL·kg-1·min-1 compared with ND: Pre- 41.6 ± 6.7, Post- 46.6 ± 7.2 mL·kg-1·min-1). Mosher et al.
(1998) found that adolescents with T1D respond similarly to an aerobic exercise training
program in comparison with ND, which may suggest that the VO2 kinetics would respond to
training in a similar way. Unfortunately the investigators did not measure the VO2 kinetics and
HR responses so the influence of training on the rate of change for VO2 was not determined.
Veves et al. (1997) investigated groups of participants with complicated and
uncomplicated T1D. Five groups of participants aged 30-40 years were included in the study.
Three exercise groups: a control group (CE), a group with T1D (DE), and a neuropathy group
with T1D (NDE), who all performed greater than 10 hrs/wk of endurance exercise. Two
sedentary groups one control group without T1D(CS) and one group with T1D (DS). The
investigators found that the participants with T1D had similar aerobic capacities to ND
individuals with similar exercise histories (CE- 56.8 ± 9.1 vs. DE- 54.0 ± 8.1 mL·kg-1·min-1, CS-
38.7 ± 6.0 vs. DS- 36.7 ± 9.6 mL·kg-1·min-1). The NDE group had a significantly lower VO2max
(42.0 ± 11.6 mL·kg-1·min-1) in comparison with the CE and DE groups. HRmax was also measured
and there were no differences between CE- 184 ± 12 vs. DE- 186 ± 3 bpm and CS- 187 ± 11 vs.
DS- 181 ± 3 bpm. The authors concluded that in the absence of neuropathy, individuals with
uncomplicated T1D are able to reach the same VO2max and HRmax as similarly trained ND. Our
results are in line with this since none of our participants with T1D had neuropathy.
In the present investigation, the measured VO2max values for the ND and T1D groups
were 56.7 ± 8.4 mL·kg-1·min-1and 54.6 ± 5.3 mL·kg-1·min-1respectively. These VO2max values in
this investigation are similar to the athletic groups CE- 56.8 ± 9.1 and DE- 54.0 ± 8.1 mL·kg-1·min-
62
1 found in the investigation by Veves et al. (1997) despite the age difference in the study
participant cohorts. The HRmax of the athletic groups in Veves at al. (1997) study are
substantially lower CE- 184 ± 12 and DE- 186 ± 3 bpm, than those found in the present
investigation ND- 197.2 ± 5.2 and T1D- 196.7 ± 8.1 bpm, but this could be partially attributed to
the protocol that Veves et al. employed to attain the VO2max values. It is generally assumed
that the T1D population have significantly lower aerobic fitness levels compared to the healthy
ND population. However, it seems that with equivalent exercise histories persons with
uncomplicated T1D are able to achieve similar high range VO2max and HRmax values as their
ND counterparts, indicating comparable exercise capacities and trainability responses.
It is important to note that studies have reported more consistently that individuals with
T1D have lower exercise tolerances in comparison with ND (Chu et al., 2011; Komatsu et al.,
2005; Masuda & Sato, 1989; Metcaf et al., 2014; Nadeau et al., 2010; Poortmans et al., 1986;
Riddell & Perkins, 2006; Robertson et al., 2009; Wanke et al., 1992; Williams et al., 2011). A
possible explanation for this inconsistency in the literature may be due to of the select
population investigators recruited. Many fail to assess the habitual non-exercise plus exercise
physical activity patterns in young persons with T1D prior to study commencement, as well as
focus on non-athletic populations. Consequently, their conclusions regarding lower aerobic
endurance and exercise tolerance in individuals with T1D may not be related to diabetes per se,
but in fact due to a lower physical plus physiological fitness level to begin with (Brandenburg et
al., 1999). Mentioned previously, the investigators Arslanian et al., (1990), Austin et al., (1993),
Faulkner (2010), Komatsu et al., (2005) and Wanke et al., (1992) reported low VO2 measures
ranging from 34- 41 mL·kg-1·min-1 in youth with T1D. (Arslanian: T1D- 34.9 ± 8.6 vs ND- 38.6±

63
9.9 mL·kg-1·min-1; Austin: T1D- 33.7 ± 7.0 vs ND- 41.0 ± 10.4 mL·kg-1·min-1 [matched for age,
BMI, and Tanner stage]; Faulkner: T1D- 34.7 ± 8.9 vs T2D- 25.4 ± 5.9 mL·kg-1·min-1; Komatsu:
T1D- 41.57 ± 7.68 vs ND- 51.12 ± 9.94 mL·kg-1·min-1; Wanke: T1D- 2.56 ± 0.71 vs ND- 3.17 ± 0.77
L·min-1). With one exception, there was no mention of PA histories or matching participants for
PA levels in any of these studies, therefore it is assumed that these investigators failed to assess
habitual exercise and non-exercise PA patterns in their participants. Faulkner (2010) was the
only investigator to report previous PA levels for the participants, but did not include a control
group and compared VO2max between youth with T1D and T2D. Faulkner (2010) employed the
Physical Activity Recall, which obtains information on participants’ recent PA participation for
the previous 7 days. Using a 7-day recall towards assessing exercise history is insufficient to
understand a participants long-term non-exercise plus exercise physical activity habits and
properly categorize their physical plus physiological fitness levels. The athletes with T1D who
participated in the present investigation were matched for physical plus physiological fitness
levels, with the ND recruited from the same hockey team. Therefore, the PA levels did not differ
between pairs in terms of frequency and intensity of training and game schedule. This may be
one reason why a difference in VO2max was not observed between the two groups.
To avoid some of the inherent weaknesses in the previous investigations, the present
investigation employed the following:
1) Matched controls for age, sex, height, body mass, and non-exercise plus exercise PA
levels. We recruited the participants from the same ice-hockey team to ensure no
difference in habitual exercise. This was essential, as if it was found that the participants

64
with T1D had lower VO2max, VO2 and HR responses it would undoubtedly be diabetes
related. Previous investigators may not have matched for physical plus physiological
fitness levels, and consequently, would not have been founded on a select, athletic
population.
2) Directly measured VO2 and HR and documented the responses during the simulation
hockey game (HITT) to identify any abnormalities in the rate of the response of
individuals with T1D at any time point during exercise.
3) Used elite athletic participants who already possessed a high aerobic capacity and were
familiar with strenuous, high-intensity exercise. Therefore, fatigue or exercise
incapability due to deconditioning or low exercise tolerance possibly confounding the
results was avoided.
4) Carefully considered the protocol design, which simulated a 60 minute ice-hockey game.
Recording HR during an on-ice game allowed for a more accurate/comprehensive idea
of the intensity and energy demand required by the athletes during a real-life game.
This approach enabled us to design a high-intensity intermittent laboratory protocol
incorporating the appropriate frequency, intensity and duration of hockey shifts (sprints
vs. active recovery) and bench times. One limitation of the laboratory protocol was that
even though the participants were instructed to approach the simulation hockey game
as they would a real-life ice-hockey game, the protocol could not simulate the same
motivation and adrenaline that the individuals would experience during an actual on-ice
game.

65
Another relevant finding reported by Veves et al. (1997) was that the VO2max of the
NDE group was lower (42.0 ± 11.6 mL·kg-1·min-1) compared with the CE and DE groups, and
similar to those of the sedentary CS (38.7 ± 6.0 mL·kg-1·min-1) and DS (36.7 ± 9.6 mL·kg-1·min-1)
groups. These findings indicate that with additional diabetic related complications exercise
capacity is decreased. While this is true, many studies have proven that PA and exercise can
reduce diabetes related comorbidities and improve quality of life (Chu et al., 2011; Komatsu et
al., 2005; Mosher et al., 1998; Rowland et al., 1992; Sideraviciute et al., 2006; Veves et al.,
1997; Wasserman & Zinman, 1994; Zinker, 1999). In addition, studies that have investigated the
effects of exercise programs on the VO2max of children and adolescents with T1D, have
reported significant increases in aerobic fitness (Campaigne, et al., 1984; Mosher et al., 1998).
Some studies have reported increases in peak aerobic fitness (VO2peak) as much as 27% in
individuals with T1D (Chimen et al., 2012), which indicates that individuals with T1D can
improve cardiorespiratory function similar to ND with exercise training. These findings reaffirm
the significance of PA and exercise as a beneficial component for long-term physical plus
physiological fitness and health for individuals with T1D.
This is the first study to characterize the VO2 and HR responses in youths with
uncomplicated T1D in response to a HITT protocol. We chose a simulated hockey game because
of the sport’s unique high-intensity and intermittent nature and its popularity among Canadian
youth. The high-intensity bursts of activity, the prolonged duration of a full-length game, and
the need for rapid recovery between shifts demands strength, power, and high anaerobic and
aerobic fitness. Regensteiner et al. (1998), Brandenburg et al. (1999), Bauer et al. (2007), and
Ananey et al. (2011) are the only authors who have published data on VO2 and HR kinetics of a

66
diabetic population in response to constant-load exercise. These studies involved measuring
the VO2 and HR kinetics of persons with T2D during constant-load exercise above and below the
lactate threshold. Regensteiner et al. (1998) characterized the VO2 and HR kinetic response in
premenopausal women with T2D during constant-load exercise and found that they had a
reduced response compared to both their lean and overweight controls. The authors concluded
that the impaired cardiac response observed at the onset of exercise compromised oxygen
delivery attributing to the limited response rate, but Regensteiner et al. (1998) did not exclude
the possibility of an additional defect in skeletal muscle oxygen diffusion or mitochondrial
oxygen utilization. Brandenburg et al. (1999), in response to Regensteiner’s findings, examined
if VO2max and VO2 kinetics would improve with exercise training in untrained premenopausal
women with T2D before and after 3 months of supervised training. Before training the women
with T2D had the lowest VO2max and slowest VO2 kinetics. Brandenburg et al. (1999) found
that after the exercise program the women with T2D benefited more from the exercise training
than the controls. Ananey et al. (2011) investigated whether an abnormal cardiac output
response was related to VO2 kinetics in middle-aged women with uncomplicated T2D. All the
participants were sedentary (< 1 hr/wk of moderate-intensity exercise) for at least 3 months
before the study commenced, which was determined via the Low-Level PA Recall
questionnaire. The results showed that the VO2peak was significantly lower in the participants
with T2D compared with both their overweight and lean controls. The participants with T2D
had a slowed dynamic response in VO2 during light and moderate intensity exercise, but this
occurred in the absence of a reduced cardiac output response during exercise; HR kinetics had a
similar response. To explain the slowed VO2 kinetics observed in the T2D group, the

67
investigators proposed that it was attributable to blood flow and the arteriovenous oxygen
difference (a-v O2). Blood flow could be limited by poor cardiac output and/or impaired
vasodilation, whereas a-v O2 reflects the interaction between blood flow and myocyte VO2.
Consequently, due to the slow rise in oxygen consumption by the contracting muscles, there is
a slower increase in a-v O2, subsequently impairing the VO2 kinetic response.
The present investigation was the first to examine the dynamic response of VO2 and HR
during HITT, specifically a simulation hockey game. Since the exponential equations for
calculating kinetics cannot be applied to HITT, we characterized the VO2 and HR response in
athletic youths with and without T1D by calculating the average nadir, mean, and average peak
%VO2max and %HRmax for every play shift and bench intervals. Some differences were
observed between the 3 periods in both the T1D and ND groups. Looking at Figures 11 and 12,
the differences between the play shifts and bench intervals appear to be random and
inconsistent across periods 1, 2 and 3. Since the differences were observed in both groups, it is
doubtful that the response is attributed to diabetes related exercise intolerance. Therefore, the
differences in the average nadir and average peak %VO2max and %HRmax values are most
likely attributed to the athletes’ self-selected pacing during the simulation hockey game.
The T1D group had similar average nadir and average peak %VO2max and %HRmax
responses in comparison with the ND group throughout the simulation hockey game; no
differences between the responses were evident. This is a select population given that they
were highly active individuals with well-controlled glycemia, and did not possess any diabetes
related comorbidities. It seems that within this elite-athletic population, the VO2 response is

68
not hindered. During the simulation hockey game, the individuals with T1D were able to reach
similar peaks in %VO2max and %HRmax during the exercise play shifts (Figures 9 and 10) as the
ND participants. This suggests that individuals with T1D are not physiologically limited by
diabetes during HITT and are able to uptake, deliver, and utilize oxygen efficiently. The
paralleled HR response between the groups with and without T1D gives no indication of
cardiovascular impairment during this type of exercise. These findings also suggest, there is no
sign of diabetes related fatigue, or reduced aerobic endurance due to abnormalities in the
function and rate of oxygen transportation or diffusion. On the basis of the Fick equation for
VO2, VO2 is influenced by a combination of cardiovascular and peripheral factors. In the absence
of physiological data, a limitation of the current study, the effect of T1D on the VO2 and HR
response to HITT is difficult to explain. Understanding the physiological mechanisms that
control the dynamic response of VO2 in T1D is important, as a reduction in this response may be
linked to increased fatigue during exercise.
In addition to understanding the physiological significance of the VO2 response in
individuals with T1D, it is also essential to recognize the clinical significance (Brandenburg et al.,
1999). If youth with T1D are discouraged from participating in sport and exercise due to lack of
knowledge and apprehension, they are more likely to avoid PA leading to low exercise
tolerance. Sequentially this may contribute to an individual’s perception of their ability to
initiate or to perform exercise and non-exercise PA as being more difficult (Brandenburg et al.,
1999). Ultimately this could dissuade individuals from adopting a more physically active
lifestyle. Increasing the awareness on the positive effects of exercise on T1D and improving the
initial experience to exercise are necessary to encourage participation and reduce the
69
unwillingness to engage in PA and exercise. Understanding the magnitude and causes of any
exercise impairment is crucial to improving performance and preventing increasing disability in
this population.
The focus of VO2 and HR responses to HITT in persons with T1D is relatively new, and
greatly revolves around the glucoregulatory response (Bussau, Ferreira, Jones, & Fournier,
2006; Bussau, Ferreira, Jones, & Fournier, 2007; Guelfi et al., 2005; Guelfi et al., 2007;
Robertson et al., 2009). These investigations have consistently shown that HITT is well tolerated
by individuals with uncomplicated T1D. Guelfi et al. (2007) revealed that males and females
with T1D (22.6 ± 5.7 years) performed a superior amount of total work during HITT compared
with continuous moderate-intensity exercise. This was reflected by the greater response of VO2
and HR during HITT; the average rate of VO2 consumption during HITT corresponded to 55% of
VO2peak in comparison with 40% during moderate-intensity exercise. In the current study the
participants with T1D frequently reached 60-100% of their VO2max and HRmax during the
simulation hockey game protocol. This shows that there is a significant amount of aerobic work
being done during HITT and that this type of exercise is not solely reliant on the anaerobic
system.
In the same investigation conducted by Guelfi et al. (2007), the participants acted as
their own controls. Guelfi et al. (2007) created a 30-minute HITT protocol (cycling at 40%
VO2peak, interspersed with 4-second maximal sprint efforts performed every 2 minutes) based
on other researchers investigations on time-motion analyses of various intermittent sports
(soccer, hockey, gaelic football) and spontaneous play in children. The present investigation is

70
the first to show T1D in a full-length simulation hockey game protocol based on HR response
collected during an on-ice hockey game. Building on the previous research regarding T1D and
HITT, this study now shows that the VO2 and HR response of athletic youth with T1D are not
limited by diabetes while performing HITT. Like their healthy counterparts, they have the
aerobic fitness level to perform long durations of intermittent high-intensity activity. This is very
important, as it proves that youth with uncomplicated T1D have the ability to be just as
competitive in sports as healthy ND individuals.
The results of the current investigation suggest that similar training status and exercise
histories play a great role in the determination of aerobic fitness in youth with uncomplicated
T1D. It is concluded that athletic adolescents with T1D achieve similar VO2max and HRmax
values, plus exhibit similar VO2 and HR responses during a simulated hockey game when
compared to their ND counterparts. The results indicate that adolescents with uncomplicated
T1D can participate in sports, exercise and non-exercise PA at the same level as their ND
counterparts, and not be limited by diabetes. Along with previous studies, this investigation
reaffirms the benefits of being an active individual with T1D; as it increases physical and
physiological fitness, and may prevent further disability, and ultimately influences quality of life.
This investigation offers a more optimistic view as it suggests that diabetes itself does not affect
the exercising capacity in trained individuals, and underscores that athletic youth with
uncomplicated T1D have the exercise capacity and potential to participate safely in competitive
sport, exercise and non-exercise PA.

71
2.4 LIMITATIONS
Currently there are no investigations that have focused on the VO2 and HR response of
youth with T1D during HITT protocol. This is the first study of its kind and consequently it is
difficult to draw comparisons with previous investigations and findings as there is no access to
detailed literature in the area. As well, research focused in the area of T1D, HITT and VO2
kinetics is still novel. It is necessary to establish a method that investigators can employ for
analysing VO2 kinetics during HITT. This would be extremely advantageous for future research
in intermittent PA and exercise, not only in persons with T1D, but also in persons with various
chronic diseases and conditions.
The participants involved in the present investigation were recruited from a select
population. The individuals represented a male and female population ranging from 13-17
years with a high aerobic fitness levels (mean VO2max = 55.6 mL·kg-1·min-1), who all competed
in high level competitive hockey. Therefore, generalizations to other active T1D populations
may not be appropriate. It would be beneficial to conduct the study with a larger sample size,
as well as include an equal number of males and females in the sample to compare any possible
sex-related differences. It also would be advantageous to include a sedentary control and
sedentary diabetic group for a more comprehensive understanding of the VO2 and HR response
during HITT.
Additionally, the small number of study participants in this study may not allow for
generalizations to be made to all individuals with T1D. For instance, these findings cannot be
generalized to individuals with T1D with poor glycemic control and/or diabetes related

72
comorbidities. Not only would these individuals possess a lower exercise tolerance, but the
nature of HITT may not be well tolerated by individuals with complicated T1D. It has been
recommended that individuals with diabetes related conditions, like proliferative retinopathy or
nephropathy, avoid PA that can result in high arterial blood pressure such as lifting heavy
weights and performing high intensity sprints (Robertson et al., 2009). A separate study looking
at individuals with T1D with poor glycemic control and/or diabetes related comorbidities would
be meaningful to identify the types of exercise that would be well tolerated and beneficial to
their health.
A final limitation is that all performance measurements were conducted in a laboratory
setting, and as such, generalizations to on-ice game situations may be limited. Despite
employing the Cosmed Fitmate (a reliable and accurate VO2 system) to measure and record VO2
and HR, the device could have predicted some erroneous values. As well, due to failure of the
Fitmate system, some data were lost. There were incidences where the Fitmate started
recording the data late, stopped recording before the protocol was completed, or failed to
record the data entirely. As a result, differences in the VO2 and HR responses may have been
missed. It would have been ideal for the participants whose data were lost to be scheduled to
perform the laboratory protocol on a subsequent day so that their data could have been
included in the analysis.

73
2.5 IMPLICATIONS
Exploring this relatively novel area of research has enhanced the understanding of the
VO2 and HR responses during HITT in highly active persons with uncomplicated T1D. The
behaviour of the VO2 and HR response have been characterized in the present investigation and
have demonstrated that active youth with uncomplicated T1D and well controlled glycemia
have a similar VO2 and HR response to healthy active ND youths. The results of this study
provide individuals with T1D, parents, and clinicians with T1D with more insight regarding the
cardiovascular response and the limitations associated with PA participation. With an in-depth,
comprehensive understanding of persons with T1D and their response to various types of PA
and exercise, perceived barriers like fear or apprehension can be assuaged, thereby
encouraging youth with T1D to increase their participation in both recreational and high-level
competitive sports. It is not unheard of to see great athletes with T1D making a successful
career for themselves in sport like: Jay Cutler, quarterback for the NFL’s Chicago Bears, Brandon
Morrow and Dustin McGowan for MLB’s Toronto Blue Jays, and Bobby Clarke, Captain of the
NHL’s Philadelphia Flyers. Clarke had a 15-year career with many accomplishments, playing in
over 1,000 regular season games, scoring 358 goals, and winning 2 Stanley cups (Macleod,
2015). Clarke has been an inspiration to many young hockey players with T1D, specifically Max
Domi, who is an up-incoming NHL star (Macleod, 2015). Domi was a first-round draft pick in
2014, is a top prospect for the NHL’s Arizona Coyotes, and participated in the World Junior
Championship on Team Canada, finishing as the tournaments best forward. It is important to
have respected figures paving the way for individuals with T1D in highly competitive and elite
domains.

74
Further research is essential within this subject area to amalgamate highly accurate,
evidence-based guidelines for persons with complicated and uncomplicated T1D who engage in
exercise and sports characterized by intermittent high-intensity activity. It would be valuable to
investigate the VO2 and HR response to HITT in a population of middle age athletes with
complicated and uncomplicated T1D. As well, conducting a longitudinal study following highly
active youth with T1D would provide insight into understanding the possible repercussions of
age and long-term T1D on the physical plus physiological fitness levels in these individuals. The
more knowledge acquired on athletes with T1D and their response to exercise, the better
coaches and exercise trainers can assist and properly train athletic youth with T1D. With an
increase in available information, young athletes with T1D will no longer have to be
apprehensive of exercise and non-exercise PA, showing them that with the proper regimen,
discipline and care, their bodies can perform at the same level as their normal healthy
counterparts. Ultimately research in this domain could assist in attenuating the apprehension
associated with T1D and exercise plus non-exercise PA, and may foster greater participation of
youth with T1D in competitive sport. Athletic figures like Clarke and Domi prove that individuals
with T1D are not only able to live normal lives, but may also live extraordinary ones.

75
2.6 REFERENCES
Alberti, K. G. M. M., & Zimmet, P. Z. (1998). Definition, diagnosis and classification of diabetes
mellitus and its complications part 1 : Diagnosis and classification of diabetes mellitus
provisional report of a WHO consultation. Diabetes Medicine, 15(7), 539-553.
American Diabetes Association. (2004). Physical activity/exercise and diabetes. Diabetes Care,
27(S1), S58-62.
Ananey, O. M., Malone J., Warmington, S., O’shea, D., Green, S., & Egana, M. (2011). Cardiac
ouput is not related to the slowed O2 uptake kinetics in type 2 diabetes. Medicine &
Science in Sports & Exercise, 43(6), 935-942.
Arslanian, S., Nixon, P. A., Becker, D., Drash, A. L. (1990). Impact of physical fitness and glycemic
control on in vivo insulin action in adolescents with IDDM. Diabetes Care, 13(1), 9-15.
Austin, A., Warty, V., Janosky, J., & Arslanian, S. (1993). The relationship of physical fitness to
lipid and lipoprotein(a) levels in adolescents with IDDM. Diabetes Care, 16(2), 421-425.
Astorino, T. A., White, A. C., & Dalleck, L. C. (2009). Supramaximal testing to confirm attainment
of VO2max in sedentary men and women. International Journal of Sports Medicine, 30(4),
279-284.
Astrand, P. O. (1971). Definitions, testing procedures, accuracy and reproducibility. Acta
Paediatrica Scandinavica, 60(Suppl. 217), 9.

76
Barnard, K., Thomas, S., Royle, P., Noyes, K., & Waugh, N. (2010). Fear of hypoglycemia in
parents of young children with type 1 diabetes: A systematic review. BMC Pediatrics,
10(50).
Barstow, T. J., & Mole, P. A. (1991). Linear and nonlinear characteristics of oxygen uptake
kinetics during heavy exercise. Journal of Applied Physiology, 71(6), 2099–2106.
Bauer, T. A., Reusch, J. E., Levi, M., & Regensteiner, J. G. (2007). Skeletal muscle deoxygenation
after the onset of moderate exercise suggests slowed microvascualr blood flow kinetics in
type 2 diabetes. Diabetes Care, 30(11), 2880-2885.
Bigger, J. T., Fleiss, J. L., Rolnitzky, L. M., & Steinman, R. C. (1993). Frequency domain measures
of heart period variability to assess risk late after myocardial infarction. Journal of the
American College of Cardiology, 21(3), 729–736.
Borg, G. A. (1982). Psychophysical bases of percieved exertion. Medicine & Science in Sport &
Exercise, 14(5), 377-381.
Brandenburg, S. L., Reush, J. E. B., Bauer, T.A., Jeffers, B. W., Hiatt, W. R., & Regensteiner, J. G.
(1999). Effects of exercise training on oxygen uptake kinetic responses in women with type
2 diabetes. Diabetes Care, 22(10), 1640-1646.
Bunc, V., Heller, J., & Leso, J. (1988). Kinetics of heart rate responses to exercise. Journal of
Sports Sciences, 6(1), 39–48.

77
Bunc, V., Heller, J., Leso, J., & Sprynorova, S. (1986). Changes of the HR during a physical work
load. 2nd Symposium on Control of Heart Rhythm, Simolenice, 14-18 April (1986).
Burgomaster, K. A, Heigenhauser, G. J. F., & Gibala, M. J. (2006). Effect of short-term sprint
interval training on human skeletal muscle carbohydrate metabolism during exercise and
time-trial performance. Journal of Applied Physiology, 100(6), 2041–2047.
Burgomaster, K. A, Howarth, K. R., Phillips, S. M., Rakobowchuk, M., Macdonald, M. J., McGee,
S. L., & Gibala, M. J. (2008). Similar metabolic adaptations during exercise after low volume
sprint interval and traditional endurance training in humans. The Journal of Physiology,
586(1), 151–160.
Burgomaster, K. A, Hughes, S. C., Heigenhauser, G. J. F., Bradwell, S. N., & Gibala, M. J. (2005).
Six sessions of sprint interval training increases muscle oxidative potential and cycle
endurance capacity in humans. Journal of Applied Physiology, 98(6), 1985–1990.
Burr, J. F., Jamnik, R. K., Baker, J., Macpherson, A., Gledhill, N., & McGuire, E. J. (2008).
Relationship of physical fitness test results and hockey playing potential in elite-level ice
hockey players. Journal of Strength and Conditioning Research, 22(5), 1535–1543.
Bussau, V. A., Ferreira, L. D., Jones, T. W., & Farnier, P. A. (2006). The 10-s maximal sprint: A
novel approach to counter an exercise-mediated fall in glycemia in individuals with type 1
diabetes. Diabetes Care, 29(3) 601-606.

78
Bussau, V. A., Ferreira, L. D., Jones, T. W., & Farnier, P. A. (2007). A 10-s sprint performed prior
to moderate-intensity exercise prevents early post-exercise fall in glycemia in individuals
with type 1 diabetes. Diabetologia, 50(9), 1815-1818.
Campaigne, B. N., Landt, K. W., & Mellies, M. J. (1985). The Effects of Physical Training on Blood
Lipid Profiles in Adolescents with Insulin-Dependent Diabetes Mellitus. Physician and
Sportsmedicine, 13(12), 83–89.
Canadian Diabetes Association. Diabetes and You, 2012. On-line at
http://www.diabetes.ca/diabetes-and-you
Carter, H., Jones, A. M., Barstow, T. J., Burnley, M., Williams, C. A., Doust, J. H., & Jonathan, H.
(2000). Oxygen uptake kinetics in treadmill running and cycle ergometry : A comparison.
Journal of Applied Physiology, 89(3), 899–907.
Carter, H., Pringle, J. S. M., Barstow, T. J., & Doust, J. H. (2006). Oxygen uptake kinetics during
supra VO2max treadmill running in humans. International Journal of Sports Medicine,
27(2), 149–157.
Chimen, M., Kennedy, A., Nirantharakumar, K., Pang, T. T., Andrews, R., & Narendran, P. (2012).
What are the benefits of physical activity in type 1 diabetes mellitus? A literature review.
Diabetologia, 55(3), 542-551.
Chu, L., Hamilton, J., & Riddell, M. C. (2011). Clinical Management of the Physically Active
Patient with Type 1 Diabetes. The Physician and Sportsmedicine, 39(2), 64–77.
79
Crisafulli, A., Carta, C., Melis, F., Tocco, F., Frongia, F., Santoboni, U. M., ... Concu, A. (2004).
Haemodynamic responses following intermittent supramaximal exercise in athletes.
Experimental Physiology, 89(6), 665-674.
Di Batista, A. M., Hart, A., Greco, L., & Gloizer, J., (2009). Type 1 diabetes among adolescents:
Reduced diabetes self-care caused by social fear and fear of hypoglecemia. The Diabetes
Educator, 35(3), 465-475.
Diabetes Control and Complications Trial Research Group. (1995). The relationship of glycemic
exposure (HbA1c) to the risk of development and progression of retinopathy in the
diabetes control complications trial. Diabetes, 44(8), 968-983.
DIAMOND Project Group. (2006). Incidence and trends of childhood Type 1 diabetes worldwide
1990–1999. Diabetic Medicine : A Journal of the British Diabetic Association, 23(8), 857 –
866.
Faulkner, M. S. (2010). Cardiovascular fitne and quality of life in adolescents with type 1 and
type 2 diabetes. Journal for Specialiss in Pediatric Nursing, 15(4), 307-316.
Faulkner, M. S., Quinn, L., Rimmer, J. H., & Rich, B. H. (2005). Cardiovascular endurance and
heart rate variability in adolescents with type 1 and type 2 diabtes. Biological Research for
Nursing, 7(1), 16-29.
Frier, B. M. (2008). How hypoglycemia can affect the life of a person with diabetes.
Diabetes/Metabolism Research and Reviews, 24(2), 87-92.

80
Gallen, I. (2005). The management of insulin treated diabetes and sport. Practical Diabetes
International, 22(8), 307–312.
Gibala, M. J., Little, J. P., van Essen, M., Wilkin, G. P., Burgomaster, K. A., Safdar, A., …
Tarnopolsky, M. A. (2006). Short-term sprint interval versus traditional endurance training:
similar initial adaptations in human skeletal muscle and exercise performance. The Journal
of Physiology, 575(3), 901–911.
Gibala, M. J., McGee, S. L., Garnham, A. P., Howlett, K. F., Snow, R. J., & Hargreaves, M. (2009).
Brief intense interval exercise activates AMPK and p38 MAPK signaling and increases the
expression of PGC-1alpha in human skeletal muscle. Journal of Applied Physiology, 106(3),
929–934.
Gist, N. H., Fedewa, M. V, Dishman, R. K., & Cureton, K. J. (2014). Sprint interval training effects
on aerobic capacity: A systematic review and meta-analysis. Sports Medicine, 44(2), 269–
279.
Gledhill, N., Cox, D., & Jamnik, R. (1994). Endurance athlete’s stroke volume does not plateau:
Major advantage in diastolic function. Medicine & Science in Sport & Exercise, 29(9), 1116-
1121.
Gledhill, N., & Jamnik, V. Canadian Physical Activity and Lifestyle Approach. Ottawa: Canadian
Society for Exercise Physiology. 3rd ed. 2003.

81
Grassi, B., Porcelli, S., Salvadego, D., & Zoladz, J. A. (2011). Slow VO₂ kinetics during moderate-
intensity exercise as markers of lower metabolic stability and lower exercise tolerance.
European Journal of Applied Physiology, 111(3), 345–355.
Guelfi, K. J., Ratnam, N., Smythe, G. A., Jones, T. W., & Fournier, P. A. (2007). Effect of
intermittent high-intensity compared with continuous moderate exercise on glucose
production and utilization in individuals with type 1 diabetes. American Journal of
Physiology. Endocrinology and Metabolism, 292(3), E865–70.
Guelfi, K., Jones, T., & Fournier, P. (2005). The decline in blood glucose levels is less with
intermittent high-intensity compared with moderate exercise in individuals with type 1
diabetes. Diabetes Care, 28(6), 1289–1294.
Guelfi, K., Jones, T., & Fournier, P. (2007). New insights into managing the risk of hypoglycaemia
associated with intermittent high-intensity exercise in individuals with type 1 diabetes
mellitus. Sports Medicine, 37(11), 937–946.
Harmer, A., Chisholm, D., McKenna, M., Hunter, S., Ruell, P., Naylor, J., … Flack, J. (2008). Sprint
training increases muscle oxidative metabolism during high-intensity exercise in patients
with type 1 diabetes. Diabetes Care, 31(11), 2097–2102.
Herbst, A., Bachran, R., Kapellen, T., & Holl, R. W. (2006). Effects of regular physical activity on
control of glycemia in pediatric patients with type 1 diabetes mellitus. Archives of
Pediatrics & Adolescent Medicine, 160(6), 573-577.

82
Hill, A. V., Long, C. N. H., & Lupton, H. (1924). Muscular execise, lactid acid, and supply and
utilization of oxygen. Prcedings of the Royal Society of London B Biological Sciences, 97, 84-
96.
Hilsted, J., Galbo, H., & Christensen, N. J. (1979). Impaired cardiovascular responses to graded
exercise in diabetic autonomic neuropathy. Diabetes, 28(4), 313–319.
Howley, E. T., Bassett, D. R. Jr., & Welch, H. G. (1995). Critera for maximal oxygen uptake:
Review and Commentary. Medicine & Science in Sport & Exercise, 14(5), 1292-1301.
Inbar, O., Bar-or, O., Skinner, J.S. The Wingate Anaerobic Test. Champaign, IL: Human Kinetics
Publishers, 1996.
Jacobsen, I. B., Henriksen, J. E., Hother-Nielsen, O., Vach, W., Beck-Nielsen, H. (2009). Evidence-
based insulin treatment in type 1 diabetes mellitus. Diabetes Research and Clinical Pratice,
86(1), 1-10.
Jain, S., McVie, P., Bocchini, J. (2006). Hyperketonemia (ketosis), oxidative stress and type 1
diabetes. Pathophysiology, 13(3), 163-170.
Jamnik, V., & Gledhill, N. Physical Activity and Lifestyle “R” Medicine: A Health-Related Physial
Activity, Fitness and Lifstyle Rx. Toronto: York University, 2015.
Jones, A. M., & Poole, D. C. (2005). Oxygen Uptake Kinetics in Sport, Exercise and Medicine.
Abingdon, Oxon, UK: Routledge.

83
Komatsu, W. R., Castro, M. L., Saraiva, G. L., Chacra, A. R., & de Barros Neto, T. L. (2005).
Aerobic exercise capacity in normal adolescents and those with type 1 diabetes mellitus.
Pediatric Diabetes, 6(3), 145–149.
Krogh, A., & Lindhard, J. (1913). The regulation of respiration and circulation during the initial
stages of muscular work. The Journal of Physiology, 47(1-2), 112-136.
Laaksonen, D. E., Atalay, M., Niskanen, L. K., Mustonen, J., Sen, C. K., Lakka, T. A., & Uusitupa,
M. I. (2000). Aerobic exercise and the lipid profile in type 1 diabetic men: A randomized
controlled trial. Medicine and Science in Sports and Exercise, 32(9), 1541–1548.
Landt, K. W., Campaigne, B. N., James, F. W., & Sperling, M. A. (1985). Effects of Exercise
Training on Insulin Sensitivity in Adolescents with Type I Diabetes. Diabetes Care, 8(5),
461–465.
Liese, A. D., Ma, X., Maahs, D. M., & Trilk, J. L. (2013). Physical activity, sedentary behavirs,
physical fitness, and their relationship to health outcomes in youth with type 1 and type 2
diabetes: A review of the eidemiological literature. Journal of Sport and Health Sciences,
2(1), 21-38.
Maahs, D. M., West, N. A., Lawrence, J. M., & Mayer-Davis, E. J. (2010). Chapter 1 :
Epidemiology of Type 1 Diabetes. Endocrinology and Metabolism Clinics of North America,
39(3), 481–491.

84
Macleod, R. (2015, January 15). Max Domi undaunted by diabetes: “It’s” actually been a
blessing in diguise. The Globe & Mail. Retrieved from
http://www.theglobeandmail.com/sports/hockey/max-domi-undaunted-by-diabetes-its-
actually-been-a-blessing-in-disguise/article22454630/
Masuda, I., & Sato, I. (1989). Exercise Testing, Clinical, and Angiographic Characteristics of
Anginal Patients With and Without Diabetes Mellitus. Angiology, 40(7), 656–665.
Metcalf, K. M., Singhvi, A., Tsalikian, E., Tansey, M. J., Zimmerman, M. B., Esliger, D. W., & Janz,
K. F. (2014). Effects of moderate-to-vigorous intensity physical activity on overnight and
next-day hypoglycemia in active adolescents with type 1 diabetes. Diabetes Care, 37(5),
1272-1278.
Miadovnik, L. (2013). Effects of sport-specific, intermittent high-intensity exericse on nocturnal
heart rate variability and glycemia in elite athletes with type 1 diabetes.(Masters thesis).
York University, Toronto, ON.
Mildenberger, R. R., Bar-Shlomo, B., Druck, M. N., Jablonsky, G., Morch, J. E., David Hilton, J., …
McLaughlin, P. R. (1984). Clinically unrecognized ventricular dysfunction in young diabetic
patients. Journal of the American College of Cardiology, 4(2), 234–238.
Montgomery, D. L. (2006). Physiological profile of professional hockey players-a longitudinal
comparison. Applied Physiology, Nutrition, and Metabolism, 31(3), 181–185.
Montgomery, D. L. (1988). Physiology of Ice Hockey. Sports Medicine, 5(2), 99–126.

85
Mosher, P. E., Nash, M. S., Perry, A. C., LaPerriere, A. R., Goldberg, R. B. (1998). Aerobic circuit
exercise training: Effect on adolescents with well-controlled insulin-deoendent diabetes
mellitus. Archives of Physical Medicine and Rehabilitation, 79(6), 652-657.
Nadeau, K. J., Regensteiner, J. G., Bauer, T. a, Brown, M. S., Dorosz, J. L., Hull, A., … Reusch, J. E.
B. (2010). Insulin resistance in adolescents with type 1 diabetes and its relationship to
cardiovascular function. The Journal of Clinical Endocrinology and Metabolism, 95(2), 513–
521.
Nathan, D. M., Cleary, P. A., Backlund, J. Y., Genuth, S. M., Lachin, J. M., Orchard, T. J., …
Diabetes Control and Complications Trial/Epidemiology of Diabetes Interventions and
Complications Study Research Group. Intensive diabetes treatment and cardiovascular
disease in patients with type 1 diabetes. New England Journal of Medicine, 353(25), 2643-
2653.
Norris, R., Carroll, D., & Cochrane, R. (1990). The effects of aerobic and anaerobic training on
fitness, blood pressure, and psychological stress and well-being. Journal of Psychosomatic
Research, 34(4), 367–375.
Poole, D. C., Barstow, T. J., McDonough, P., & Jones, A. M. (2008). Control of oxygen uptake
during exercise. Medicine and Science in Sports and Exercise, 40(3), 462–474.
Poole, D. C., Kindig, C. A., Behnke, B. J., & Jones, A. M. (2004). Oxygen uptake (VO2) kinetics in
different species: A brief review. Equine and Comparative Exercise Physiology, 2(1), 1-15.
86
Poortmans, J. R., Saerens, P., Edelman, R., Vertongen, F., & Dorchy, H. (1986). Influence of the
degree of metabolic control on physical fitness in type I diabetic adolescents. International
Journal of Sports Medicine, 7(4), 232–235.
Powers, S. K., & Howley, E.T. (2011). Exercise physiology: Theory and application to fitness and
performance. New York: McGraw-Hill Humanities/Social Sciences/Languages.
Regensteiner, J. G., Bauer, T. A., Reusch, J. E. B., Brandenburg, S. L., Sippel, J. M., Vogelsong, A.
M., … Hiatt, W. R. (1998). Abnormal oxygen uptake kinetics in women with tyoe 2 diabetes
mellitus. Journal of applied physiology, 85(1), 310-317.
Regensteiner, J. G., Reusch, J. E. B., Stewart, K. J., & Veves, A. (Eds.). (2009). Diabetes and
Exercise. New York, NY: Human Press.
Riddell, M. C., & Perkins, B. A. (2006). Type 1 Diabetes and Vigorous Exercise : Applications of
Exercise Physiology to Patient Management. Canadian Journal of Diabetes, 30(416), 63–71.
Robertson, K., Adolfsson, P., Scheiner, G., Hanas, R., & Riddell, M. C. (2009). Exercise in children
and adolescents with diabetes. Pediatric Diabetes, 10(S12), 154-168.
Rowland, T. W., Martha Jr, P. M., Reiter, E., & Cunningham, L. N. (1992). The Influence of
Diabetes Mellitus on Cardiovascular Function in Children and Adolescents. International
Journal of Sports Medicine, 13(5), 431–435.
Shugart, C., Jackson, J., & Fields, K. B. (2010). Diabetes in sports. Sports Health, 2(1), 29–38.
87
Sideraviciute, S., Gailiuniene, A., Visagurskiene, K., & Vizbaraite, D. (2006). The effect of long-
term swimming program on body composition , aerobic capacity and blood lipids in 14 –
19-year aged healthy girls and girls with type 1 diabetes mellitus. Medicina, 42(8), 661–
666.
Stirling, J. R., Zakynthinaki, M., Refayo, I., & Sampedro, J. (2008). A model of heart rate kinetics
in response to exercise. Journal of Nonlinear Mathematical Physics, 15(3), 426-436.
Toni, S., Reali, M. F., Barni, F., Lenzi, L., & Festini, F. (2006). Managing insulin therapy during
exercise in Type 1 diabetes mellitus. Acta Biomedica, 77, 34–40.
Tonoli, C., Heyman, E., Roelands, B., Buyse, L., Cheung, S. S., Berthoin, S., & Meeusen, R. (2012).
Effects of Different Types of Acute and Chronic ( Training ) Exercise on Glycaemic Control
in Type 1 Diabetes Mellitus. Sports Health, 42(12), 1059–1080.
Vered, A., Battler, A., Segal, P., Liberman, D., Yerushalmi, Y., Berezin, M., & Neufeld, H. N.
(1984). Exercise-induced left ventricular dysfunction in young men with asymptomatic
diabetes mellitus (diabetic cardiomyopathy). The American Journal of Cardiology, 54(6),
633–637.
Veves, A., Saouaf, R., Donaghue, V. M., Mullooly, C. A., Kistler, J. A., Giurini, J. M., … Fielding, R.
A. (1997). Aerobic exercise capacity remains normal despite impaired endothelial function
in the micro- and macrocirculation of physically active IDDM patients. Diabetes, 46(11),
1846–1852.

88
Wanke, T., Formanek, D., Auinger, M., Zwick, H., & Irsigler, K. (1992). Pulmonary gas exchange
and oxygen uptake during exercise in patients with type 1 diabetes mellitus. Diabetic
Medicine, 9(3), 252–257.
Wasserman, D. H., & Zinman, B. (1994). Exercise in Individuals With IDDM. Diabetes Care, 17(8),
924–937.
Wasserman, K., & Whipp, B. J. (1972). Oxygen uptake kinetics work for various intensities of
constant-load. Journal of Applied Physiology, 33(3), 351–356.
Weltman, N. Y., Saliba, S. A, Barrett, E. J., & Weltman, A. (2009). The use of exercise in the
management of type 1 and type 2 diabetes. Clinics in Sports Medicine, 28(3), 423–439.
Whipp, B. J. (n.d.). The peak versus maximum oxygen uptake issue. Retrieved from
http://www.fitdirectory.ca/media/attach/2014/health-literacy-learning-read-reading-
learn/028_BJW%20-%20Vo2%20Peak%20vs%20Max%20final%202.pdf
Whipp, B. J. (1994). The slow component of O2 uptake kinetics during heavy exercise. Medicine
and Science in Sports and Exercise, 26(11), 1319–1326.
Whipp, B, J., Ward, S. A., Lamara, N., Davies, J. A., & Wasserman, K. (1982). Parameters of
ventilatory and gas exchange dynamics during exercise. Journal of Applied Physiology:
Respiratory, Environmental and Exercise Physiology, 52(6), 1506-1513.
Wild, D., von Maltzahn, R., Brohan, E., Christensen, T., Clauson, P., & Gonder-Frederick, L.
(2007). A critical review of the literature on fear of hypoglycemia in diabetes: Implications
89
for diabetes management and patient education. Patient Education & Counselling, 68(1),
10-15.
Williams, B. K., Guelfi, K. J., Jones, T. W., & Davis, E. A. (2011). Lower cardiorespiratory fitness in
children with Type 1 diabetes. Diabetic Medicine : A Journal of the British Diabetic
Association, 28(8), 1005–1007.
Xu, F., & Rhodes, E. C. (1999). Oxygen Uptake Kinetics During Exercise. Sports Medicine, 27(5),
313–327.
Zinker, B. A. (1999). Nutrition and exercise in individuals with Diabetes. Clinics in Sports
Medicine, 18(3), 585–606.
Zinman, B., Zuniga-Guajardo, S., & Kelly, D. (1984). Comparison of the acute and long-term
effects of exercise on glucose control in type 1 diabetes. Diabetes Care, 7(6), 515-519.
Zoladz, J. A., Grassi, B., Majerczak, J., Szkutnik, Z., Korostyński, M., Karasiński, J., … Korzeniewski,
B. (2013). Training-induced acceleration of O(2) uptake on-kinetics precedes muscle
mitochondrial biogenesis in humans. Experimental Physiology, 98(4), 883–898.

90
2.7 APPENDICES
APPENDIX A : RECRUITMENT POSTER

91
APPENDIX B: 2015 PAR-Q+

92

93

94

95
APPENDIX C: CONSENT FORMS
Minor Assent Form
Study Name: Assessing the impact of intermittent high-intensity exercise on subsequent glucose management and
autonomic function in elite-level youth athletes with type 1 diabetes
Researchers: Dr. Michael Riddell, Dr. Veronica Jamnik
Lisa Miadovnik, MSc Candidate, Kinesiology & Health Science, York University
Purpose of the Research:This will be the first study completed and published on type 1 diabetic hockey players.
Because of the unique glycemic response reported in hockey players, we want to see how this type of exercise
impacts later glucose management. We also want to see how hockey-type exercise impacts overnight autonomic
function. Autonomic function refers to how the nervous system functions and can be measured by looking at heart
rate variability. A Holter monitor is used to assess heart rate variability, which is basically the variation in the time
interval between heartbeats. Since a healthy nervous system constantly changes how it stimulates the heart, a healthy
person will have high heart rate variability. Our overall goal is to determine the effects that hockey and hockey-type
exercise have on your blood sugar management and heart rate variability afterwards. We also want to see if blood
sugar levels impact heart rate variability. This research will be presented to graduate students and professors at a
seminar held at York University. We also aim to have it published in an academic journal, and presented at various
professional conferences on diabetes.
What You Will Be Asked to Do in the Research: This study will require 2 trips to the Human Performance
Laboratory at York University. All participants will complete an initial fitness assessment in the laboratory which
will take roughly 1.5 hours. This assessment will include measurement of height, weight, skinfolds/body fat, and 2
maximal exertion cardiorespiratory tests. On this visit, each participant will be required to complete a 30-second
Wingate anaerobic cycling test, and a 15-20 minute aerobic (VO2 max) test performed on a motorized treadmill.
Participants will also be required to visit the lab on a 2nd
occasion which will last 2.5-3 hours. During this visit, the
participants will complete an exercise protocol on a cycle ergometer which mimics the work done by the legs during
a hockey game. This protocol will involve 45 minutes of intermittent cycling, which will take place over a 60 minute
time frame (to simulate a game). Participants will wear a polar heart rate strap, and a FitmateTM
VO2 device which
will continuously measure the amount of oxygen you’re using – or how hard you’re working. Following the
completion of this protocol, all equipment will be removed and a Holter Monitor TM
will be placed on the participant.
This monitor will be worn for 30 minutes in exercise recovery, while lying down in a dark, quiet room.
The Holter Monitor TM
is a small electronic device, worn on the hip. Connected to it are 5 wires with gel pads that
are stuck to the front of the chest cavity. These gel pads pick up electrical activity of the heart, and transmit the
information to the monitor, where the information is recorded. This monitor is to be worn on 3 occasions, from
12:00 AM or earlier, until 6:00 AM or later. One occasion will be after completing the lab exercise protocol as
mentioned above. A second occasion will be after a hockey game, and a third occasion will be after a low-activity
day. Individuals will be asked to record the activities they partake in on each of these 3 days. It is important that
minimal physical activity is performed on the low-activity day.
All of the above requirements apply to both participants with diabetes, and their control (non-diabetic)
participants. All procedures listed above are non-invasive.
Participants with diabetes will have the additional requirement of wearing a Medtronic iPro2, blinded continuous
glucose monitor (CGM), for the 3 days when they assess their nocturnal heart rate variability. Scheduling will be
designed so that all 3 data collection nights (ie after the hockey game, after the lab exercise protocol, and after the
low-activity day) occur within a 5-day span. While wearing the CGM, participants will also be asked to manually
check their blood sugar using their own glucose monitoring device at least once every 9 hours, and record all
carbohydrate consumption and insulin administrations on the provided sheets.
Risks and Discomforts: Because this strenuous exercise is known to induce hyperglycemia during exercise,
participants may suffer post-exercise hypoglycemia afterward. Participants will receive coaching on how to reduce

96
the incidence of hypoglycemia by exercise specialists such as Dr. Riddell - for example, reduce onboard insulin to
zero during exercise, restrict insulin after exercise, and monitor blood glucose levels closely after exercise so that if
levels start to drop, glucose can be consumed. Participants are also exposed to the typical risk of injury that is
associated with exercise, including fatigue, lightheadedness, loss of consciousness, abnormal blood pressure, chest
discomfort, leg gramps, nausea, and in rare cases, heart rhythm disturbances or heart attacks. Because all
participants are elite athletes who are accustomed to intense exericse, the likelihood of experiencing the above side
effects are quite small. Additionally, exercise will be supervised by qualified professionals to limit the risks to the
participants, and a consent form will be read and signed by the dependent's parent or guardian prior to initiating the
study. PAR-Q+ and if necessary, ePAR-medX evaluations will also be completed prior to exercise to insure
participants are all eligible to partake in exercise, and understand the associated risks.
Benefits of the Research and Benefits to You: You will have the opportunity to participate in unique fitness
testing procedures that are common to many elite and national-level athletes. You will also have access to your
CGM data upon study completion, to observe the impact of hockey on your blood sugar management.
Voluntary Participation: Your participation in the study is completely voluntary and you may choose to stop
participating at any time. Your decision not to volunteer will not influence the nature of the relationship you may
have with the researchers or study staff, or the nature of your relationship with York University either now, or in the
future.
Withdrawal from the Study: You can stop participating in the study at any time, for any reason, if you so decide.
Your decision to stop participating, or to refuse to answer particular questions, will not affect your relationship with
the researchers, York University, or any other group associated with this project. If you choose to withdraw from the
study, all associated data collected will be immediately destroyed if you choose.
Confidentiality: All information you supply during the research will be held in confidence and unless you
specifically indicate your consent, your name will not appear in any report or publication of the research. Data will
be collected via hand-written notes, and converted into electronic documents where possible. All collected
information will be coded to preserve your anonymity. Your data will be safely stored in a password-protected
computer in a locked facility and only research staff will have access to this information. Confidentiality will be
provided to the fullest extent possible by law. Collected data will be kept for a maximum of 5 years, after which
time it will be destroyed.
Questions About the Research? If you have questions about the research in general or about your role in the
study, please feel free to contact Lisa Miadovnik or the Graduate Supervisor - Dr. Michael Riddell either by
telephone (listed above) or by e-mail. This research has received approval by the Human Participants Review Sub-
Committee, York University’s Ethics Review Board and conforms to the standards of the Canadian Tri-Council
Research Ethics guidelines. If you have any questions about this process or about your rights as a participant in the
study, please contact the Sr. Manager & Policy Advisor for the Office of Research Ethics, 5th
Floor, York Research
Tower, York University.
Legal Rights and Signatures:
I _____________________, consent to participate in “Assessing the impact of intermittent high-intensity exercise
on subsequent glucose management and autonomic function in elite-level youth with type 1 diabetes” conducted by
Lisa Miadovnik, Supervised by Dr. Michael Riddell & Dr. Veronica Jamnik. I have understood the nature of this
project and wish to participate. I am not waiving any of my legal rights by signing this form. My signature below
indicates my consent.
Signature Date
Participant
Signature Date
Principal Investigator

97
Parental Consent Form
Study Name: Assessing the impact of intermittent high-intensity exercise on subsequent glucose management and
autonomic function in elite-level youth athletes with type 1 diabetes
Researchers: Dr. Michael Riddell, Dr. Veronica Jamnik
Lisa Miadovnik, MSc Candidate, Kinesiology & Health Science, York University,
Purpose of the Research: This research aims to be the first-ever study completed and published on type 1 diabetic
hockey players. Given the unique glycemic response reported in hockey players, we aim to assess the impact of this
type of exercise on subsequent glucose management. We also aim to assess the acute effects of hockey-type exercise
on nocturnal autonomic function. Autonomic function refers to how the nervous system functions and can be
measured by looking at heart rate variability. A Holter monitor is used to assess heart rate variability, which is
basically the variation in the time interval between heartbeats. Since a healthy nervous system constantly changes
how it stimulates the heart, a healthy person will have high heart rate variability. Our overall purpose is to determine
the nocturnal effects of hockey and hockey-type exercise on blood sugar management and heart rate variability, and
to determine whether the two markers are correlated. This research will be presented to peers at a graduate seminar
held at York University. We also aim to have it published in a scholarly journal, and presented at various
professional conferences on diabetes. All participants will remain anonymous.
What You Will Be Asked to Do in the Research: This study will require 2 trips to the Human Performance
Laboratory at York University. All participants will require an initial fitness assessment in the laboratory which will
take roughly 1.5 hours. This assessment will include measurement of height, weight, skinfolds/body fat, and 2
maximal exertion cardiorespiratory tests. On this visit, each participant will be required to complete a 30-second
Wingate anaerobic cycling test, and a 15-20 minute aerobic (VO2 max) test performed on a motorized treadmill.
Participants will also be required to visit the lab on a 2nd
occasion which will last 2.5-3 hours. During this visit, the
participants will complete an exercise protocol on a cycle ergometer which mimics the work done by the legs during
a hockey game. This protocol will involve 45 minutes of intermittent cycling, which will take place over a 60 minute
time frame (to simulate a game). Participants will be fitted with a polar heart rate strap, and a FitmateTM
VO2 device
which will continually assess the volume of oxygen utilized by the exercising individual. Following the completion
of this protocol, individuals will be asked to lay down for 30 minutes to assess heart rate variability in recovery. This
monitor will be worn for 30 minutes in exercise recovery, while lying down in a dark, quiet room.
The Holter Monitor TM
is a small electronic device, worn on the hip. Connected to it are 5 wires with gel pads that
are stuck to the front of the chest cavity. These gel pads pick up electrical activity of the heart, and transmit the
information to the monitor, where the information is recorded. This monitor is to be worn on 3 occasions, from
12:00 AM or earlier, until 6:00 AM or later. One occasion will be after completing the lab exercise protocol as
mentioned above. A second occasion will be after a hockey game, and a third occasion will be after a low-activity
day. Individuals will be asked to record the activities they partake in, on each of these 3 days. It is important that
minimal physical activity is performed on the low-activity day.
All of the above requirements apply to both participants with diabetes, and their control (non-diabetic)
participants. All procedures listed above are non-invasive.
Participants with diabetes will have the additional requirement of wearing a Medtronic iPro2, blinded continuous
glucose monitor (CGM), for the 3 days when they assess their nocturnal heart rate variability. As such, scheduling
will be designed such that all 3 data collection nights (ie after the hockey game, after the lab exercise protocol, and
after the low-activity day) occur within a 5-day span. While wearing the CGM, participants will also be asked to
manually check their blood sugar using their own glucose monitoring device at least once every 9 hours, and record
all carbohydrate consumption and insulin administrations on the provided sheets.
Risks and Discomforts: Because exercise of this intensity is known to induce hyperglycemia during exercise,
participants may suffer post-exercise hypoglycemia afterward. Participants will receive coaching on how to reduce
the incidence of hypoglycemia by exercise specialists such as Dr. Riddell - for example, reduce onboard insulin to
zero during exercise, restrict insulin after exercise, and monitor blood glucose levels closely after exercise so that if

98
levels start to drop, glucose can be consumed. Participants are also exposed to the typical risk of injury that is
associated with exercise, including fatigue, episodes of transient lightheadedness, loss of consciousness, abnormal
blood pressure, chest discomfort, leg gramps, nausea, and in rare cases, heart rhythm disturbances or heart attacks.
Because all participants are elite athletes who are accustomed to intense exericse, the likelihood of experiencing the
above side effects are quite small. Additionally, exercise will be supervised by qualified professionals to reduce
potential risks to the participants, and a consent form will be read and signed by the dependent's parent or guardian
prior to initiating the study. PAR-Q+ and if necessary, ePAR-medX evaluations will also be completed prior to
exercise to insure participants are all eligible to partake in exercise, and understand the associated risks.
Benefits of the Research and Benefits to You: Participants will have the opportunity to experience unique fitness
testing procedures that are common to many elite and national-level athletes. They will also have access to their
CGM data upon study completion, to observe the impact of hockey on their blood sugar management. This
information will be available as a result of their participation in this study.
Voluntary Participation: Participation in the study is completely voluntary and individuals may choose to stop
participating at any time. The decision not to volunteer will not influence the nature of the ongoing relationship you
may have with the researchers or study staff, or the nature of your relationship with York University either now, or
in the future.
Withdrawal from the Study: You or your dependent can stop participating in the study at any time, for any
reason, if you so decide. Your decision to stop participating, or to refuse to answer particular questions, will not
affect your relationship with the researchers, York University, or any other group associated with this project. In the
event you withdraw from the study, all associated data collected will be immediately destroyed if you choose.
Confidentiality: All information supplied during the research will be held in confidence and unless consent is
specifically indicated, names will not appear in any report or publication of the research. Data will be collected via
hand-written notes, and converted into electronic documents where possible. All collected information will be coded
to preserve your anonymity. Data will be safely stored in a password-protected computer in a locked facility and
only research staff will have access to this information. Confidentiality will be provided to the fullest extent possible
by law. Collected data will be kept for a maximum of 5 years, after which time it will be destroyed.
Questions About the Research? If you have questions about the research in general or about your role in the
study, please feel free to contact Lisa Miadovnik or the Graduate Supervisor - Dr. Michael Riddell either by
telephone (listed above) or by e-mail. This research has received approval by the Human Participants Review Sub-
Committee, York University’s Ethics Review Board and conforms to the standards of the Canadian Tri-Council
Research Ethics guidelines. If you have any questions about this process, or about your rights as a participant in the
study, please contact the Sr. Manager & Policy Advisor for the Office of Research Ethics, 5th
Floor, York Research
Tower, York University.
Legal Rights and Signatures:
I _____________________, provide my consent for my dependent to participate in “Assessing the impact of
intermittent high-intensity exercise on subsequent glucose management and autonomic function in elite-level youth
with type 1 diabetes” conducted by Lisa Miadovnik, Supervised by Dr. Michael Riddell & Dr. Veronica Jamnik. I
have understood the nature of this project and wish my dependent to participate. I am not waiving any of my legal
rights by signing this form. My signature below indicates my consent.
Signature Date
Participant
Signature Date
Principal Investigator
99
Informed Consent Form
Study Name: Assessing the impact of intermittent high-intensity exercise on subsequent glucose management and
autonomic function in elite-level youth athletes with type 1 diabetes
Researchers: Dr. Michael Riddell, Dr. Veronica Jamnik
Lisa Miadovnik, MSc Candidate, Kinesiology & Health Science, York University
Purpose of the Research: This research aims to be the first-ever study completed and published on type 1 diabetic
hockey players. Given the unique glycemic response reported in hockey players, we aim to assess the impact of this
type of exercise on subsequent glucose management. We also aim to assess the acute effects of hockey-type exercise
on nocturnal autonomic function. Autonomic function refers to how the nervous system functions and can be
measured by looking at heart rate variability. A Holter monitor is used to assess heart rate variability, which is
basically the variation in the time interval between heartbeats. Since a healthy nervous system constantly changes
how it stimulates the heart, a healthy person will have high heart rate variability. Our overall purpose is to determine
the nocturnal effects of hockey and hockey-type exercise on blood sugar management and heart rate variability, and
to determine whether the two markers are correlated. This research will be presented to peers at a graduate seminar
held at York University. We also aim to have it published in a scholarly journal, and presented at various
professional conferences on diabetes. All participants will remain anonymous.
What You Will Be Asked to Do in the Research: This study will require 2 trips to the Human Performance
Laboratory at York University. All participants will require an initial fitness assessment in the laboratory which will
take roughly 1.5 hours. This assessment will include measurement of height, weight, skinfolds/body fat, and 2
maximal exertion cardiorespiratory tests. On this visit, each participant will be required to complete a 30-second
Wingate anaerobic cycling test, and a 15-20 minute aerobic (VO2 max) test performed on a motorized treadmill.
Participants will also be required to visit the lab on a 2nd
occasion which will last 2.5-3 hours. During this visit, the
participants will complete an exercise protocol on a cycle ergometer which mimics the work done by the legs during
a hockey game. This protocol will involve 45 minutes of intermittent cycling, which will take place over a 60 minute
time frame (to simulate a game). Participants will be fitted with a polar heart rate strap, and a FitmateTM
VO2 device
which will continually assess the volume of oxygen utilized by the exercising individual. Following the completion
of this protocol, individuals will be asked to lay down for 30 minutes to assess heart rate variability in recovery. This
monitor will be worn for 30 minutes in exercise recovery, while lying down in a dark, quiet room.
The Holter Monitor TM
is a small electronic device, worn on the hip. Connected to it are 5 wires with gel pads that
are stuck to the front of the chest cavity. These gel pads pick up electrical activity of the heart, and transmit the
information to the monitor, where the information is recorded. This monitor is to be worn on 3 occasions, from
12:00 AM or earlier, until 6:00 AM or later. One occasion will be after completing the lab exercise protocol as
mentioned above. A second occasion will be after a hockey game, and a third occasion will be after a low-activity
day. Individuals will be asked to record the activities they partake in, on each of these 3 days. It is important that
minimal physical activity is performed on the low-activity day.
All of the above requirements apply to both participants with diabetes, and their control (non-diabetic)
participants. All procedures listed above are non-invasive.
Participants with diabetes will have the additional requirement of wearing a Medtronic iPro2, blinded continuous
glucose monitor (CGM), for the 3 days when they assess their nocturnal heart rate variability. As such, scheduling
will be designed such that all 3 data collection nights (ie after the hockey game, after the lab exercise protocol, and
after the low-activity day) occur within a 5-day span. While wearing the CGM, participants will also be asked to
manually check their blood sugar using their own glucose monitoring device at least once every 9 hours, and record
all carbohydrate consumption and insulin administrations on the provided sheets.
Risks and Discomforts: Because exercise of this intensity is known to induce hyperglycemia during exercise,
participants may suffer post-exercise hypoglycemia afterward. Participants will receive coaching on how to reduce
the incidence of hypoglycemia by exercise specialists such as Dr. Riddell - for example, reduce onboard insulin to
zero during exercise, restrict insulin after exercise, and monitor blood glucose levels closely after exercise so that if
levels start to drop, glucose can be consumed. Participants are also exposed to the typical risk of injury that is

100
associated with exercise, including fatigue, episodes of transient lightheadedness, loss of consciousness, abnormal
blood pressure, chest discomfort, leg gramps, nausea, and in rare cases, heart rhythm disturbances or heart attacks.
Because all participants are elite athletes who are accustomed to intense exericse, the likelihood of experiencing the
above side effects are quite small. Additionally, exercise will be supervised by qualified professionals to reduce
potential risks to the participants, and a consent form will be read and signed by the dependent's parent or guardian
prior to initiating the study. PAR-Q+ and if necessary, ePAR-medX evaluations will also be completed prior to
exercise to insure participants are all eligible to partake in exercise, and understand the associated risks.
Benefits of the Research and Benefits to You: Participants will have the opportunity to experience unique fitness
testing procedures that are common to many elite and national-level athletes. They will also have access to their
CGM data upon study completion, to observe the impact of hockey on their blood sugar management. This
information will be available as a result of their participation in this study.
Voluntary Participation: Participation in the study is completely voluntary and individuals may choose to stop
participating at any time. The decision not to volunteer will not influence the nature of the ongoing relationship you
may have with the researchers or study staff, or the nature of your relationship with York University either now, or
in the future.
Withdrawal from the Study: You can stop participating in the study at any time, for any reason, if you so decide.
Your decision to stop participating, or to refuse to answer particular questions, will not affect your relationship with
the researchers, York University, or any other group associated with this project. In the event you withdraw from the
study, all associated data collected will be immediately destroyed if you choose.
Confidentiality: All information you supply during the research will be held in confidence and unless you
specifically indicate your consent, your name will not appear in any report or publication of the research. Data will
be collected via hand-written notes, and converted into electronic documents where possible. All collected
information will be coded to preserve your anonymity. Your data will be safely stored in a password-protected
computer in a locked facility and only research staff will have access to this information. Confidentiality will be
provided to the fullest extent possible by law. Collected data will be kept for a maximum of 5 years, after which
time it will be destroyed.
Questions About the Research? If you have questions about the research in general or about your role in the
study, please feel free to contact Lisa Miadovnik or the Graduate Supervisor - Dr. Michael Riddell either by
telephone (listed above) or by e-mail. This research has received approval by the Human Participants Review Sub-
Committee, York University’s Ethics Review Board and conforms to the standards of the Canadian Tri-Council
Research Ethics guidelines. If you have any questions about this process, or about your rights as a participant in the
study, please contact the Sr. Manager & Policy Advisor for the Office of Research Ethics, 5th
Floor, York Research
Tower, York University.
Legal Rights and Signatures:
I _____________________, provide my consent to participate in “Assessing the impact of intermittent high-
intensity exercise on subsequent glucose management and autonomic function in elite-level youth with type 1
diabetes” conducted by Lisa Miadovnik, Supervised by Dr. Michael Riddell & Dr. Veronica Jamnik. I have
understood the nature of this project and wish to participate. I am not waiving any of my legal rights by signing this
form. My signature below indicates my consent.
Signature Date
Participant
Signature Date
Principal Investigator

101
APPENDIX D: Simulation Hockey Game Protocol (Miadovnik, 2013)
Name: Date: Resistance: Pre-Weight: Post-Weight: Pre-BG:
Shift Cosmed Time
On Ice Play – Whistle – Play
Off Ice/ Bench
BG Check
1 0:00 20 –20– 40 1:20 Period 1 RPM/HR/VO2
Period 2 RPM/HR/VO2
Period 3 RPM/HR/VO2
2 3:10 20 – 30 – 20 – 30 – 15 5:05 Period 1 RPM/HR/VO2
Period 2 RPM/HR/VO2
Period 3 RPM/HR/VO2
3 6:00 30 – 20 – 10 7:00 Period 1 RPM/HR/VO2
Period 2 RPM/HR/VO2
Period 3 RPM/HR/VO2
4 10:10 10 – 20 – 40 11:20 Period 1 RPM/HR/VO2
Period 2 RPM/HR/VO2
Period 3 RPM/HR/VO2
5 12:10 30 – 20 – 20 13:20 Period 1 RPM/HR/VO2
Period 2 RPM/HR/VO2
Period 3 RPM/HR/VO2
6 15:40 10 – 20 – 10 16:20 Period 1 RPM/HR/VO2
Period 2 RPM/HR/VO2
Period 3 RPM/HR/VO2
7 17:20 20 – 40– 20 – 40 – 20 – 10– 10 20:00

102
Period 1 RPM/HR/VO2
Period 2 RPM/HR/VO2
Period 3 RPM/HR/VO2

103
APPENDIX E: ADDITIONAL TABLES AND GRAPHS
Table A1. Anthropometric and physical plus physiological fitness profiles of competitive youth ice hockey players with T1D
Age (yrs)
Sex Height (cm)
Weight (Kg)
WC (cm)
Skinfolds (mm)
Hockey Level
VO2 max (mL·kg-
1·min-1)
HR min (bpm)
HR max (bpm)
Peak Power (Watts)
Peak Power (Watts/kg)
Fatigue (%)
T1D 1 13 F 158 53.3 71 53.8 AA 56.2 67 202 471.9 8.9 46.4
T1D 2 17 M 175 73 79 56.6 Jr. A 49.8 51 192 735.3 10.1 51.7
T1D 3 14 M 167 58.7 74 57.7 AAA 59 51 190 647.4 11.0 48.0
T1D 4 17 F 167 64.4 74 95.3 A 51.8 57 209 567.0 8.8 39.3
T1D 5 13 F 157 64.1 74 102.7 AA 43.3 48 186 460.0 7.2 43.1
T1D 6 15 M 178 76.6 84 63 A 58.9 54 197 747.4 9.8 39.0
T1D 7 15 M 176 80.6 86.7 53.2 AAA 59.3 51 188 910.1 11.3 65.0
T1D 8 13 M 171 67.7 77 AAA 56.9 50 202 786.9 11.6 50.1
T1D 9 15 M 175 65.1 73.1 35.9 AAA 56 55 204 705.1 10.8 38.6
Mean ± SD
14.7 ± 1.58
169.3 ± 7.7
67.1 ± 8.6
77.0 ± 5.3
64.8 ± 22.6
54.6 ± 5.3 53.8 ± 5.7
196.7 ± 8.1
670.1 ± 148.9
9.9 ± 1.4 46.4 ± 8.9

104
Table A2. Anthropometric and physical plus physiological fitness profiles of competitive youth ice hockey players without T1D
Age (yrs)
Sex Height (cm)
Weight (Kg)
WC (cm)
Skinfolds (mm)
Hockey Level
VO2 max (mL·kg-
1·min-1)
HR min (bpm)
HR max (bpm)
Peak Power (Watts)
Peak Power (Watts/kg)
Fatigue (%)
ND 1 13 F 163 55.5 74 55.8 AA 52.7 65 204 484.8 8.7 38.1
ND 2 17 M 174 75.6 83 62.4 AA 62.4 44 194 886.1 11.7 56.3
ND 3 14 M 170 68.5 77 70.8 AAA 63.3 52 193 770.9 11.3 54.5
ND 4 17 F 170 57.3 73 49.9 A 54.8 59 201 528.5 9.2 33.8
ND 5 13 F 154 51.2 72 52.8 AA 46.5 63 189 487.0 9.5 39.0
ND 6 15 M 167 71.4 83 53.2 AA 52.2 43 201 635.4 8.9 54.5
ND 7 15 M 184 82.2 89 39.2 AAA 61.1 53 195 1019.0 12.4 54.3
ND 8 13 M 176 73.1 79 AAA 64.1 50 195 860.5 11.8
ND 9 15 M 173 61.3 71 33.5 AAA 53 43 203 772.3 12.6 56.7
Mean ± SD
14.7 ±1.58
170.1 ±8.5
66.2 ±10.4
78.0 ±6.1
52.2 ±11.9
56.7 ±6.2 52.4 ±8.4
197.2 ±5.2
716.1 ±192.1
10.7 ± 1.6 48.4 ±9.6
ND represents the non-diabetic hockey players with corresponding numbers to their T1D counterpart

105
Figure A1. %VO2max for all study participants combined across all 3 periods of a simulation hockey game. No differentiation between T1D and ND groups.
A
B
The above graphs illustrate the mean VO2 response expressed as a percentage of %VO2max for all study participants during each shift and bench interval between the 3 periods. The shaded areas represent the shift intervals and the white areas represent the bench intervals. The VO2 response across the 3 periods is consistent, and during the shifts the participants achieved peak VO2 values ranging between 50-80% of VO2max. Panel A. Includes the mean %VO2max along with the standard errors for all participants (M ± SE).
0 100 200 300 400 500 600 700 800 900 1000 1100 1200
0
10
20
30
40
50
60
70
80
90
100
Time (sec)
%V
O2m
ax
Period 1
Period 2
Period 3
0 100 200 300 400 500 600 700 800 900 1000 1100 1200
0
10
20
30
40
50
60
70
80
90
100
Time (sec)
%V
O2m
ax
Period 1
Period 2
Period 3
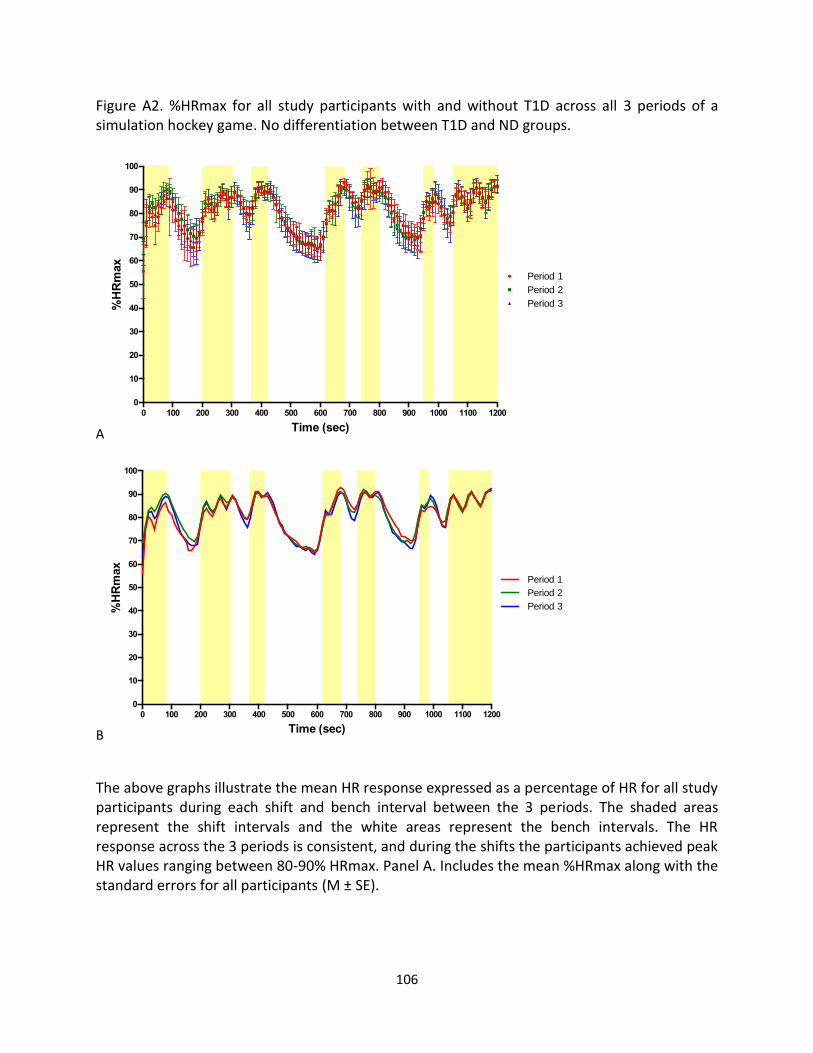
106
Figure A2. %HRmax for all study participants with and without T1D across all 3 periods of a simulation hockey game. No differentiation between T1D and ND groups.
A
B
The above graphs illustrate the mean HR response expressed as a percentage of HR for all study participants during each shift and bench interval between the 3 periods. The shaded areas represent the shift intervals and the white areas represent the bench intervals. The HR response across the 3 periods is consistent, and during the shifts the participants achieved peak HR values ranging between 80-90% HRmax. Panel A. Includes the mean %HRmax along with the standard errors for all participants (M ± SE).
0 100 200 300 400 500 600 700 800 900 1000 1100 1200
0
10
20
30
40
50
60
70
80
90
100
Time (sec)
%H
Rm
ax
Period 1
Period 2
Period 3
0 100 200 300 400 500 600 700 800 900 1000 1100 1200
0
10
20
30
40
50
60
70
80
90
100
Time (sec)
%H
Rm
ax
Period 1
Period 2
Period 3

107
Figure A3. The 10-second averaged VO2 (ml·Kg-1·min-1) response across 3 periods of a simulation hockey game comparing individuals with and without T1D
The VO2 response between the T1D and ND group are similar. It seems that the ND individuals were able to reach greater VO2 values during the shifts, but these differences were not significant. During the shifts the participants’ VO2 ranged between 30-50 ml·Kg-1·min-1.
0
0
1 0
2 0
3 0
4 0
5 0
6 0
4 8 0 0
VO
2 (
ml/
kg
/min
-1)
T y p e 1 D ia b e t ic
N o n D ia b e t ic
P e r io d 3P e r io d 2P e r io d 1
T1D ND

108
Figure A4. The 10-second averaged HR (bpm) response across 3 periods of a simulation hockey game comparing individuals with and without T1D
The HR response is paralleled between the T1D and ND groups during all 3 periods. During the shifts the HR for both groups ranged between 150-190 bpm.
0
5 0
1 0 0
1 5 0
2 0 0
4 8 0 0
HR
(b
pm
)
T y p e 1 D ia b e t ic
N o n D ia b e t ic
P e r io d 1 P e r io d 2 P e r io d 3
T1D ND

109
Table A3. Comparison of the average nadir and peak oxygen consumption rate expressed relative to VO2max, in response to a simulation hockey game between individuals with and without T1D (M ± SD). Period 1 Period 2 Period 3
T1D (n=7) ND (n=6) T1D (n=7) ND (n=6) T1D (n=7) ND (n=6)
Rest 0.19 ± 0.08 0.18 ± 0.07 0.30 ± 0.14 0.24 ± 0.12 0.20 ± 0.09 0.18 ± 0.05
Shift 1
High 0.80 ± 0.13 0.85 ± 0.15 0.76 ± 0.15 0.78 ± 0.14 0.78 ± 0.15 0.77 ± 0.14
Low 0.41 ± 0.15 0.47 ± 0.11 0.40 ± 0.10 0.42 ± 0.09 0.37 ± 0.10 0.38 ± 0.11
Bench 1
High 0.66 ± 0.09 0.62 ± 0.18 0.67 ± 0.07 0.62 ± 0.13 0.60 ± 0.11 0.65 ± 0.13
Low 0.26 ± 0.09 0.28 ± 0.06 0.27 ± 0.08 0.25 ± 0.08 0.23 ± 0.05 0.23 ± 0.02
Shift 2
High 0.77 ± 0.13 0.83 ± 0.13 0.74 ± 0.17 0.76 ± 0.14 0.80 ± 0.15 0.83 ± 0.11
Low 0.48 ± 0.12 0.48 ± 0.06 0.48 ± 0.15 0.40 ± 0.11 0.45 ± 0.12 0.51 ± 0.15
Bench 2
High 0.66 ± 0.12 0.72 ± 0.16 0.62 ± 0.12 0.64 ± 0.16 0.63 ± 0.16 0.68 ± 0.16
Low 0.45 ± 0.07 0.40 ± 0.07 0.38 ± 0.10 0.38 ± 0.09 0.37 ± 0.08 0.41 ± 0.12
Shift 3
High 0.83 ± 0.09 0.87 ± 0.11 0.78 ± 0.18 0.81 ± 0.15 0.82 ± 0.13 0.86 ± 0.08
Low 0.60 ± 0.09 0.61 ± 0.11 0.47 ± 0.10 0.55 ± 0.11 0.54 ± 0.09 0.59 ± 0.12
Bench 3
High 0.65 ± 0.10 0.66 ± 0.16 0.56 ± 0.13 0.66 ± 0.13 0.64 ± 0.17 0.72 ± 0.13
Low 0.19 ± 0.06 0.18 ± 0.03 0.17 ± 0.06 0.17 ± 0.05 0.18 ± 0.06 0.17 ± 0.04
Shift 4
High 0.77 ± 0.16 0.89 ± 0.11 0.74 ± 0.18 0.80 ± 0.14 0.79 ± 0.17 0.84 ± 0.12
Low 0.44 ± 0.12 0.49 ± 0.07 0.36 ± 0.14 0.40 ± 0.14 0.39 ± 0.13 0.40 ± 0.10
Bench 4
High 0.68 ± 0.14 0.69 ± 0.11 0.64 ± 0.15 0.66 ± 0.10 0.65 ± 0.15 0.69 ± 0.16
Low 0.48 ± 0.11 0.46 ± 0.09 0.41 ± 0.06 0.45 ± 0.06 0.38 ± 0.04 0.46 ± 0.09
Shift 5
High 0.81 ± 0.11 0.84 ± 0.09 0.83 ± 0.12 0.79 ± 0.16 0.81 ± 0.12 0.87 ± 0.08
Low 0.63 ± 0.10 0.54 ± 0.11 0.55 ± 0.11 0.53 ± 0.14 0.57 ± 0.16 0.60 ± 0.16
Bench 5
High 0.64 ± 0.10 0.66 ± 0.19 0.59 ± 0.13 0.65 ± 0.19 0.64 ± 0.15 0.66 ± 0.14
Low 0.23 ± 0.06 0.25 ± 0.05 0.20 ± 0.05 0.22 ± 0.05 0.21 ± 0.07 0.21 ± 0.04
Shift 6
High 0.71 ± 0.16 0.67 ± 0.18 0.76 ± 0.14 0.77 ± 0.19 0.74 ± 0.16 0.76 ± 0.14
Low 0.37 ± 0.15 0.46 ± 0.10 0.50 ± 0.13 0.44 ± 0.08 0.45 ± 0.12 0.49 ± 0.14
Bench 6
High 0.61 ± 0.14 0.58 ± 0.06 0.62 ± 0.12 0.65 ± 0.11 0.65 ± 0.17 0.67 ± 0.17
Low 0.35 ± 0.11 0.36 ± 0.04 0.37 ± 0.11 0.39 ± 0.06 0.35 ± 0.11 0.38 ± 0.07
Shift 7
High 0.80 ± 0.11 0.84 ± 0.10 0.81 ± 0.14 0.86 ± 0.08 0.85 ± 0.14 0.87 ± 0.12
Low 0.47 ± 0.09 0.43 ± 0.07 0.46 ± 0.09 0.46 ± 0.09 0.45 ± 0.13 0.47 ± 0.09
No differences between T1D and ND groups

110
Table A4. Comparison of the average nadir and peak heart rate expressed relative to HRmax, in response to a simulation hockey game between individuals with and without T1D (M ± SD). Period 1 Period 2 Period 3
T1D (n=7) ND (n=6) T1D (n=7) ND (n=6) T1D (n=7) ND (n=6)
REST 0.59 ± 0.13 0.52 ± 0.09 0.72 ± 0.08 0.67 ± 0.05 0.64 ± 0.06 0.62 ± 0.04
Shift 1
High 0.87 ± 0.03 0.87 ± 0.07 0.91 ± 0.04 0.90 ± 0.02 0.91 ± 0.05 0.89 ± 0.04
Low 0.71 ± 0.06 0.69 ± 0.10 0.76 ± 0.08 0.76 ± 0.03 0.75 ± 0.06 0.73 ± 0.04
Bench 1
High 0.86 ± 0.03 0.85 ± 0.08 0.89 ± 0.03 0.90 ± 0.03 0.89 ± 0.03 0.89 ± 0.03
Low 0.62 ± 0.11 0.63 ± 0.06 0.69 ± 0.07 0.68 ± 0.04 0.64 ± 0.05 0.65 ± 0.05
Shift 2
High 0.86 ± 0.09 0.88 ± 0.02 0.91 ± 0.04 0.89 ± 0.02 0.90 ± 0.03 0.89 ± 0.02
Low 0.72 ± 0.12 0.76 ± 0.04 0.78 ± 0.08 0.76 ± 0.04 0.78 ± 0.05 0.76 ± 0.05
Bench 2
High 0.90 ± 0.04 0.89 ± 0.01 0.90 ± 0.04 0.89 ± 0.03 0.90 ± 0.05 0.89 ± 0.02
Low 0.78 ± 0.03 0.79 ± 0.03 0.78 ± 0.05 0.78 ± 0.03 0.75 ± 0.07 0.76 ± 0.06
Shift 3
High 0.92 ± 0.03 0.91 ± 0.01 0.92 ± 0.04 0.91 ± 0.02 0.92 ± 0.04 0.91 ± 0.02
Low 0.82 ± 0.02 0.83 ± 0.04 0.82 ± 0.06 0.81 ± 0.03 0.81 ± 0.06 0.79 ± 0.04
Bench 3
High 0.90 ± 0.02 0.90 ± 0.01 0.88 ± 0.05 0.90 ± 0.02 0.92 ± 0.04 0.90 ± 0.01
Low 0.63 ± 0.04 0.63 ± 0.06 0.63 ± 0.06 0.65 ± 0.03 0.64 ± 0.06 0.62 ± 0.03
Shift 4
High 0.93 ± 0.02 0.88 ± 0.12 0.92 ± 0.03 0.92 ± 0.02 0.91 ± 0.03 0.91 ± 0.03
Low 0.76 ± 0.05 0.71 ± 0.14 0.75 ± 0.08 0.75 ± 0.04 0.77 ± 0.05 0.74 ± 0.03
Bench 4
High 0.92 ± 0.03 0.92 ± 0.02 0.89 ± 0.04 0.91 ± 0.02 0.90 ± 0.05 0.92 ± 0.02
Low 0.83 ± 0.05 0.84 ± 0.02 0.79 ± 0.05 0.82 ± 0.02 0.76 ± 0.05 0.79 ± 0.06
Shift 5
High 0.93 ± 0.03 0.93 ± 0.02 0.93 ± 0.03 0.92 ± 0.02 0.92 ± 0.05 0.92 ± 0.02
Low 0.83 ± 0.09 0.85 ± 0.03 0.86 ± 0.05 0.84 ± 0.03 0.82 ± 0.06 0.82 ± 0.05
Bench 5
High 0.92 ± 0.04 0.92 ± 0.04 0.88 ± 0.05 0.90 ± 0.04 0.91 ± 0.04 0.90 ± 0.03
Low 0.66 ± 0.10 0.68 ± 0.06 0.67 ± 0.05 0.67 ± 0.04 0.65 ± 0.06 0.66 ± 0.04
Shift 6
High 0.87 ± 0.04 0.83 ± 0.06 0.88 ± 0.03 0.87 ± 0.03 0.87 ± 0.05 0.86 ± 0.03
Low 0.78 ± 0.05 0.77 ± 0.06 0.80 ± 0.05 0.76 ± 0.06 0.80 ± 0.06 0.78 ± 0.03
Bench 6
High 0.87 ± 0.03 0.86 ± 0.05 0.89 ± 0.03 0.88 ± 0.03 0.90 ± 0.05 0.89 ± 0.03
Low 0.75 ± 0.07 0.75 ± 0.04 0.76 ± 0.05 0.77 ± 0.04 0.74 ± 0.10 0.75 ± 0.04
Shift 7
High 0.93 ± 0.03 0.91 ± 0.04 0.91 ± 0.06 0.92 ± 0.02 0.93 ± 0.04 0.92 ± 0.02
Low 0.80 ± 0.05 0.79 ± 0.05 0.82 ± 0.04 0.83 ± 0.04 0.81 ± 0.08 0.81 ± 0.04
No differences between T1D and ND groups

111
Table A5. Comparison of the combined average nadir and peak oxygen consumption rate, expressed relative to VO2max, between the 3 periods of a simulation hockey game (M ± SD). COMBINED (n=13)
Period 1 Period 2 Period 3
Rest 0.19 ± 0.07 0.27 ± 0.13 0.19 ± 0.07
Shift 1
High 0.82 ± 0.14 0.77 ± 0.14 0.78 ± 0.14
Low 0.44 ± 0.13 0.41 ± 0.09‡ 0.37 ± 0.10‡
Bench 1
High 0.64 ± 0.13 0.65 ± 0.10 0.63 ± 0.12
Low 0.27 ± 0.07 0.26 ± 0.08 0.23 ± 0.04
Shift 2
High 0.80 ± 0.13 0.75 ± 0.15‡ 0.81 ± 0.13‡
Low 0.48 ± 0.09 0.44 ± 0.13 0.48 ± 0.14
Bench 2
High 0.69 ± 0.14 0.63 ± 0.13 0.65 ± 0.16
Low 0.43 ± 0.07 0.38 ± 0.09 0.39 ± 0.10
Shift 3
High 0.85 ± 0.10 0.79 ± 0.16 0.84 ± 0.11
Low 0.60 ± 0.09+ 0.51 ± 0.11+‡ 0.56 ± 0.11‡
Bench 3
High 0.65 ± 0.12 0.61 ± 0.13 0.68 ± 0.15
Low 0.18 ± 0.04 0.17 ± 0.05 0.18 ± 0.05
Shift 4
High 0.83 ± 0.15 0.77 ± 0.16‡ 0.82 ± 0.15‡
Low 0.46 ± 0.10 0.38 ± 0.13 0.40 ± 0.11
Bench 4
High 0.69 ± 0.12 0.65 ± 0.13 0.67 ± 0.15
Low 0.47 ± 0.10 0.42 ± 0.06 0.42 ± 0.08
Shift 5
High 0.82 ± 0.10 0.81 ± 0.13 0.84 ± 0.11
Low 0.59 ± 0.11 0.54 ± 0.12 0.58 ± 0.16
Bench 5
High 0.65 ± 0.14 0.62 ± 0.16 0.65 ± 0.14
Low 0.24 ± 0.21 0.21 ± 0.06 0.05 ± 0.06
Shift 6
High 0.69 ± 0.17 0.76 ± 0.16 0.75 ± 0.14
Low 0.46 ± 0.12 0.48 ± 0.11 0.47 ± 0.12
Bench 6
High 0.60 ± 0.11 0.63 ± 0.11 0.66 ± 0.16
Low 0.36 ± 0.08 0.38 ± 0.09 0.36 ± 0.09
Shift 7
High 0.82 ± 0.10 0.83 ± 0.12 0.86 ± 0.13
Low 0.45 ± 0.08 0.46 ± 0.09 0.46 ± 0.11 + p < 0.05 Significant difference between periods 1 and 2 ‡ p < 0.05 Significant difference between periods 2 and 3 † p < 0.05 Significant difference between periods 1 and 3
Some significant differences were observed in the combined average %VO2max values during some of the play shift and bench intervals. During play shift 1, the average %VO2max low was significantly higher in period 2 compared with period 3. During play shift 2, the average %VO2max high was significantly lower in period 2 compared with period 3. During play shift 3, the average %VO2max low was significantly greater in period 1 compared to period 3, period 2 was significantly lower than period 3, and no significant differences were observed between periods 1 and 3. Lastly, during play shift 4 the average %VO2max high was significantly lower in period 2 compared with period 3.

112
Table A6. Comparison of the combined average nadir and peak heart rate, expressed relative to
HRmax, between the 3 periods of a simulation hockey game (M ± SD).
COMBINED (n=13)
P1 P2 P3
REST 0.56 ± 0.11+ 0.70 ± 0.07+‡ 0.63 ± 0.05‡
Shift 1
High 0.87 ± 0.05+ 0.91 ± 0.03 0.90 ± 0.04
Low 0.70 ± 0.08 0.76 ± 0.06 0.74 ± 0.05
Bench 1
High 0.85 ± 0.06 0.89 ± 0.03 0.89 ± 0.03
Low 0.62 ± 0.09 0.69 ± 0.06 0.65 ± 0.05
Shift 2
High 0.87 ± 0.06 0.90 ± 0.03 0.90 ± 0.03
Low 0.74 ± 0.09 0.77 ± 0.06 0.77 ± 0.05
Bench 2
High 0.89 ± 0.03 0.90 ± 0.04 0.90 ± 0.04
Low 0.79 ± 0.03 0.78 ± 0.05 0.75 ± 0.06
Shift 3
High 0.92 ± 0.02 0.92 ± 0.03 0.91 ± 0.03
Low 0.83 ± 0.03 0.82 ± 0.05 0.80 ± 0.05
Bench 3
High 0.90 ± 0.02 0.89 ± 0.04 0.91 ± 0.03
Low 0.63 ± 0.05 0.64 ± 0.05‡ 0.63 ± 0.05‡
Shift 4
High 0.91 ± 0.09 0.92 ± 0.03 0.91 ± 0.03
Low 0.74 ± 0.10 0.75 ± 0.06 0.76 ± 0.04
Bench 4
High 0.92 ± 0.02 0.90 ± 0.03 0.90 ± 0.04
Low 0.83 ± 0.04† 0.81 ± 0.04 0.78 ± 0.05†
Shift 5
High 0.93 ± 0.03 0.93 ± 0.03 0.92 ± 0.04
Low 0.84 ± 0.07 0.85 ± 0.04 0.82 ± 0.05
Bench 5
High 0.92 ± 0.04 0.89 ± 0.04 0.91 ± 0.03
Low 0.67 ± 0.08 0.67 ± 0.04 0.65 ± 0.05
Shift 6
High 0.85 ± 0.05 0.87 ± 0.03 0.87 ± 0.04
Low 0.78 ± 0.05 0.78 ± 0.06 0.79 ± 0.05
Bench 6
High 0.86 ± 0.04 0.88 ± 0.03 0.90 ± 0.04
Low 0.75 ± 0.06 0.77 ± 0.04 0.75 ± 0.07
Shift 7
High 0.92 ± 0.03 0.91 ± 0.05 0.93 ± 0.03
Low 0.80 ± 0.05 0.83 ± 0.04 0.81 ± 0.06
+ p < 0.05 Significant difference between periods 1 and 2 ‡ p < 0.05 Significant difference between periods 2 and 3 † p < 0.05 Significant difference between periods 1 and 3
Some significant differences were observed in the combined average %HRmax values during some of the play shift and bench intervals. At rest, %HRmax was significantly lower in period 1 compared to period 2, period 2 was significantly greater than period 3, and no differences were observed between period 1 and period 3. During play shift 1, the average %HRmax low was significantly lower in period 1 than period 2. During bench 3, the average %HRmax low was significantly greater in period 2 then period 3. Lastly, during bench 4 the average %HRmax low was significantly greater in period 1 compared with period 3.

113
Figure A5. The average nadir and peak %VO2max and %HRmax for all study participants during the 3 period of a simulation hockey game (M ± SE).
A C
B D
+ p < 0.05 Significant difference between periods 1 and 2
‡ p < 0.05 Significant difference between periods 2 and 3
† p < 0.05 Significant difference between periods 1 and 3
Some significant differences were observed during some of the play shift and bench intervals. Panel A. Shows the differences in the average nadir %VO2max values for all play shift and bench intervals between periods. Panel B. Shows the differences in the average peak %VO2max values for all play shift and bench intervals between periods. Panel C. Shows the differences in the average nadir %HRmax values for all play shift and bench intervals between periods. Panel D. Shows the differences in the average peak %HRmax values for all play shift and bench intervals between periods.

114
Table A7. Results of the average nadir and peak %VO2max and %HRmax data analysis for all
study participants: Two-way repeated measures ANOVA
%VO2max Highs Type lll Sum of Squares
df Mean Square F Sig.
Rest
Period 579.214 2 289.607 4.247 .028
Period*Diabetes 31.747 2 15.873 .233 .794
Error(Period) 1500.100 22 68.186
Diabetes Between-Subject Effect
102.525 1 102.525 .753 .404
S1
Period 217.336 1.072 202.725 .870 .377
Period*Diabetes 50.158 1.072 46.786 .201 .679
Error(Period) 2746.719 11.793 232.14
Diabetes Between-Subject Effect
37.306 1 37.306 .103 .754
B1
Period 20.782 2 10.393 .266 .769
Period*Diabetes 177.716 2 88.858 2.278 .126
Error(Period) 858.337 22 39.015
Diabetes Between-Subject Effect
17.540 11 17.540 .047 .833
S2
Period 278.616 2 139.308 3.475 .049
Period*Diabetes 45.804 2 22.902 .571 .573
Error(Period) 882.056 22 40.093
Diabetes Between-Subject Effect
111.260 1 111.260 .218 .650
B2
Period 243.013 2 121.506 3.217 .059
Period*Diabetes 43.808 2 21.904 .580 .568
Error(Period) 830.987 22 37.772
Diabetes Between-Subject Effect
178.550 1 178.550 .312 .588
S3
Period 250.528 2 125.264 1.987 .161
Period*Diabetes 3.679 2 1.839 .029 .971
Error(Period) 1386.681 22 63.031
Diabetes Between-Subject
132.005 1 132.005 .321 .555

115
Effect
B3
Period 346.140 2 173.070 3.549 .046
Period*Diabetes 131.203 2 65.601 1.345 .281
Error(Period) 1072.744 22 48.761
Diabetes Between-Subject Effect
374.387 1 374.387 .810 .387
S4
Period 264.138 1.239 213.154 2.211 .158
Period*Diabetes 65.490 2 32.745 .548 .508
Error(Period) 1314.296 13.631 96.419
Diabetes Between-Subject Effect
581.906 1 581.906 1.062 .325
B4
Period 85.915 2 42.958 1.359 .278
Period*Diabetes 5.719 2 2.859 .090 .914
Error(Period) 695.641 22 31.620
Diabetes Between-Subject Effect
55.939 1 55.939 .109 .747
S5
Period 69.634 2 34.817 .684 .515
Period*Diabetes 152.480 2 76.240 1.498 .245
Error(Period) 1119.463 22 50.885
Diabetes Between-Subject Effect
25.158 1 25.158 .086 .775
B5
Period 73.890 2 36.945 .471 .630
Period*Diabetes 25.230 2 12.615 .161 .852
Error(Period) 1725.470 22 78.431
Diabetes Between-Subject Effect
126.167 1 126.167 .245 .630
S6
Period 389.281 2 194.640 1.961 .165
Period*Diabetes 59.908 2 29.954 .302 .742
Error(Period) 2183.545 22 99.252
Diabetes Between-Subject Effect
.782 1 .782 .001 .971
B6
Period 291.690 2 145.845 2.237 .131
Period*Diabetes 69.108 2 34.554 .530 .596

116
Error(Period) 1434.437 22 65.202
Diabetes Between-Subject Effect
7.240 1 7.240 .018 .896
S7
Period 100.619 2 50.309 1.017 .378
Period*Diabetes 17.243 2 8.622 .174 .841
Error(Period) 1088.730 22 49.488
Diabetes Between-Subject Effect
146.521 1 146.521 .459 .512
%VO2max Lows Type lll Sum of Squares
df Mean Square F Sig.
S1
Period 265.294 1.219 132.647 3.308 .085
Period*Diabetes 30.11 1.219 24.626 .374 .692
Error(Period) 882.166 13.405 65.808
Diabetes Between-Subject Effect
87.185 1 87.185 .299 .596
B1
Period 112.733 2 56.366 2.595 .097
Period*Diabetes 14.961 2 7.480 .344 .712
Error(Period) 477.952 22 21.725
Diabetes Between-Subject Effect
.115 1 .115 .001 .973
S2
Period 132.388 2 66.194 1.115 .346
Period*Diabetes 267.557 2 133.778 2.253 .129
Error(Period) 1306.218 22 59.374
Diabetes Between-Subject Effect
2.940 1 2.940 .009 .927
B2
Period 156.986 2 78.493 2.755 .086
Period*Diabetes 161.833 2 80.916 2.840 .080
Error(Period) 626.830 22 28.492
Diabetes Between-Subject Effect
1.908 1 1.908 .011 .919
S3
Period 5757.152 1.350 287.576 14.076 .001
Period*Diabetes 77.732 1.350 57.570 1.902 .189
Error(Period) 449.475 14.852 30.263

117
Diabetes Between-Subject Effect
186.157 1 186.157 .675 .429
B3
Period 14.550 1.169 12.448 .557 .496
Period*Diabetes 5.709 1.169 4.884 .218 .686
Error(Period) 287.526 12.858 22.362
Diabetes Between-Subject Effect
1.670 11 52.332 .032 .861
S4
Period 497.907 2 248.954 3.783 .039
Period*Diabetes 33.846 2 16.923 .257 .776
Error(Period) 1447.883 22 65.813
Diabetes Between-Subject Effect
111.521 1 111.521 .377 .552
B4
Period 160.548 2 80.274 3.794 .038
Period*Diabetes 158.564 2 79.282 3.747 .040
Error(Period) 465.536 22 21.161
Diabetes Between-Subject Effect
112.095 1 112.095 .770 .399
S5
Period 154.798 2 77.399 1.534 .238
Period*Diabetes 215.386 2 107.693 2.134 .142
Error(Period) 1110.168 22 50.462
Diabetes Between-Subject Effect
58.027 1 58.027 .138 .717
B5
Period 84.662 2 42.332 2.767 .085
Period*Diabetes 14.561 2 7.280 .476 .628
Error(Period) 336.599 22 15.300
Diabetes Between-Subject Effect
11.694 1 11.694 .194 .668
S6
Period 4.573 2 2.286 .034 .966
Period*Diabetes 185.611 2 92.805 1.394 269
Error(Period) 1464.463 22 66.566
Diabetes Between-Subject Effect
3.398 1 3.398 .011 .919
B6
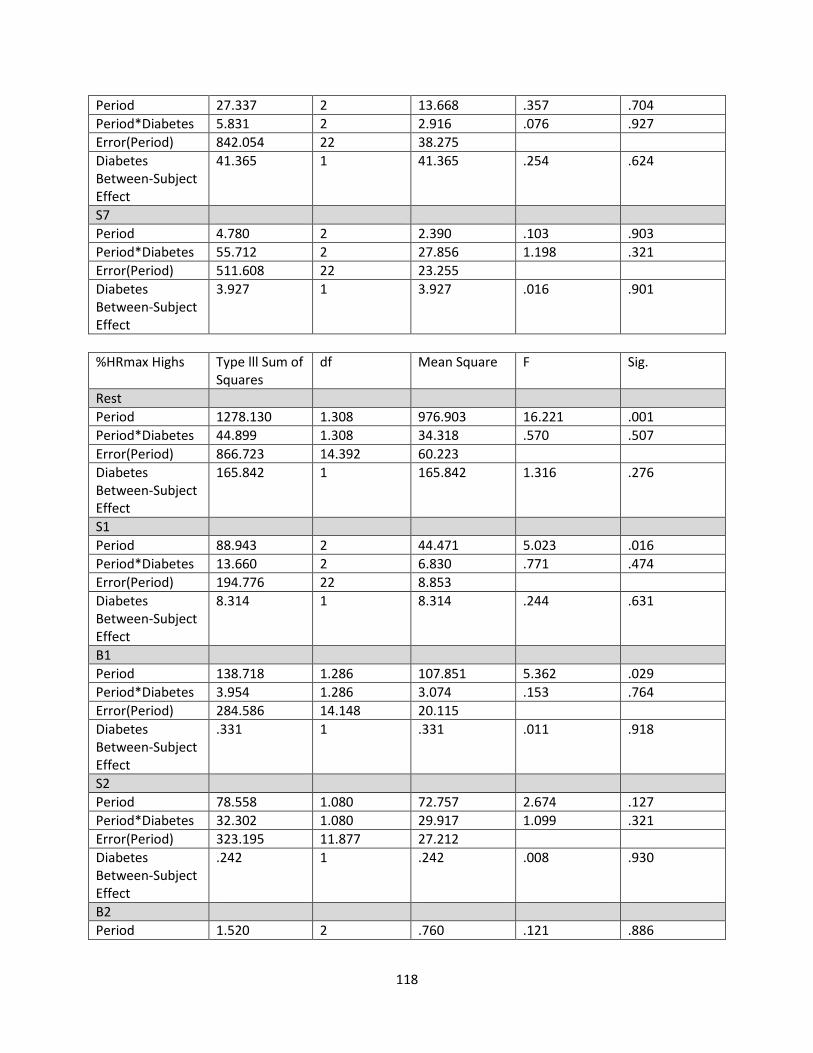
118
Period 27.337 2 13.668 .357 .704
Period*Diabetes 5.831 2 2.916 .076 .927
Error(Period) 842.054 22 38.275
Diabetes Between-Subject Effect
41.365 1 41.365 .254 .624
S7
Period 4.780 2 2.390 .103 .903
Period*Diabetes 55.712 2 27.856 1.198 .321
Error(Period) 511.608 22 23.255
Diabetes Between-Subject Effect
3.927 1 3.927 .016 .901
%HRmax Highs Type lll Sum of Squares
df Mean Square F Sig.
Rest
Period 1278.130 1.308 976.903 16.221 .001
Period*Diabetes 44.899 1.308 34.318 .570 .507
Error(Period) 866.723 14.392 60.223
Diabetes Between-Subject Effect
165.842 1 165.842 1.316 .276
S1
Period 88.943 2 44.471 5.023 .016
Period*Diabetes 13.660 2 6.830 .771 .474
Error(Period) 194.776 22 8.853
Diabetes Between-Subject Effect
8.314 1 8.314 .244 .631
B1
Period 138.718 1.286 107.851 5.362 .029
Period*Diabetes 3.954 1.286 3.074 .153 .764
Error(Period) 284.586 14.148 20.115
Diabetes Between-Subject Effect
.331 1 .331 .011 .918
S2
Period 78.558 1.080 72.757 2.674 .127
Period*Diabetes 32.302 1.080 29.917 1.099 .321
Error(Period) 323.195 11.877 27.212
Diabetes Between-Subject Effect
.242 1 .242 .008 .930
B2
Period 1.520 2 .760 .121 .886

119
Period*Diabetes .940 2 .470 .075 .928
Error(Period) 137.922 22 6.269
Diabetes Between-Subject Effect
10.913 1 10.913 .456 .514
S3
Period 2.836 2 1.418 .429 .656
Period*Diabetes .704 2 .352 .107 .899
Error(Period) 72.659 22 3.303
Diabetes Between-Subject Effect
9.478 1 9.478 .546 .514
B3
Period 15.791 2 7.895 1.384 .272
Period*Diabetes 26.444 22 13.222 2.318 .122
Error(Period) 125.492 2 5.704
Diabetes Between-Subject Effect
.669 1 .669 .045 .836
S4
Period 17.873 1.055 16.943 .323 .592
Period*Diabetes 63.027 1.055 59.749 1.140 .311
Error(Period) 608.256 11.604 52.420
Diabetes Between-Subject Effect
45.500 1 45.500 1.313 .276
B4
Period 27.250 1.349 20.198 1.416 .264
Period*Diabetes 16.955 1.349 12.567 .881 .395
Error(Period) 211.707 14.841 14.265
Diabetes Between-Subject Effect
17.727 1 17.727 1.565 .237
S5
Period 6.981 2 3.491 1.066 .361
Period*Diabetes 3.576 2 1.788 .546 .587
Error(Period) 72.026 22 3.274
Diabetes Between-Subject Effect
9.221 1 9.221 .387 .546
B5
Period 40.675 2 20.337 1.489 .248
Period*Diabetes 13.856 2 6.928 .507 .609
Error(Period) 300.525 22 13.660
Diabetes Between-Subject
2.442E-005 1 2.442E-005 .000 .999

120
Effect
S6
Period 36.018 2 18.009 2.413 .113
Period*Diabetes 13.919 22 6.960 .932 .409
Error(Period) 164.197 2 7.464
Diabetes Between-Subject Effect
35.783 1 35.783 1.047 .328
B6
Period 71.756 2 35.878 3.369 .053
Period*Diabetes .925 2 .463 .043 .958
Error(Period) 234.276 22 10.649
Diabetes Between-Subject Effect
9.146 1 9.146 .420 .530
S7
Period 15.860 2 7.930 .857 .438
Period*Diabetes 10.822 2 5.411 .585 .566
Error(Period) 203.535 22 9.252
Diabetes Between-Subject Effect
10.621 1 10.621 .440 .521
%HRmax Lows Type lll Sum of Squares
df Mean Square F Sig.
S1
Period 247.048 2 123.524 4.614 .021
Period*Diabetes 7.296 2 3.648 .136 .873
Error(Period) 588.995 22 26.772
Diabetes Between-Subject Effect
14.441 1 14.441 .180 .679
B1
Period 266.600 1.325 201.202 5.218 .030
Period*Diabetes 5.547 1.325 4.186 .109 .815
Error(Period) 562.024 14.575 38.560
Diabetes Between-Subject Effect
.744 1 .744 .008 .930
S2
Period 78.526 1.126 69.765 .983 .352
Period*Diabetes 66.645 1.126 59.210 .834 .392
Error(Period) 879.000 12.381 70.994
Diabetes Between-Subject Effect
1.395 1 1.395 .021 .887
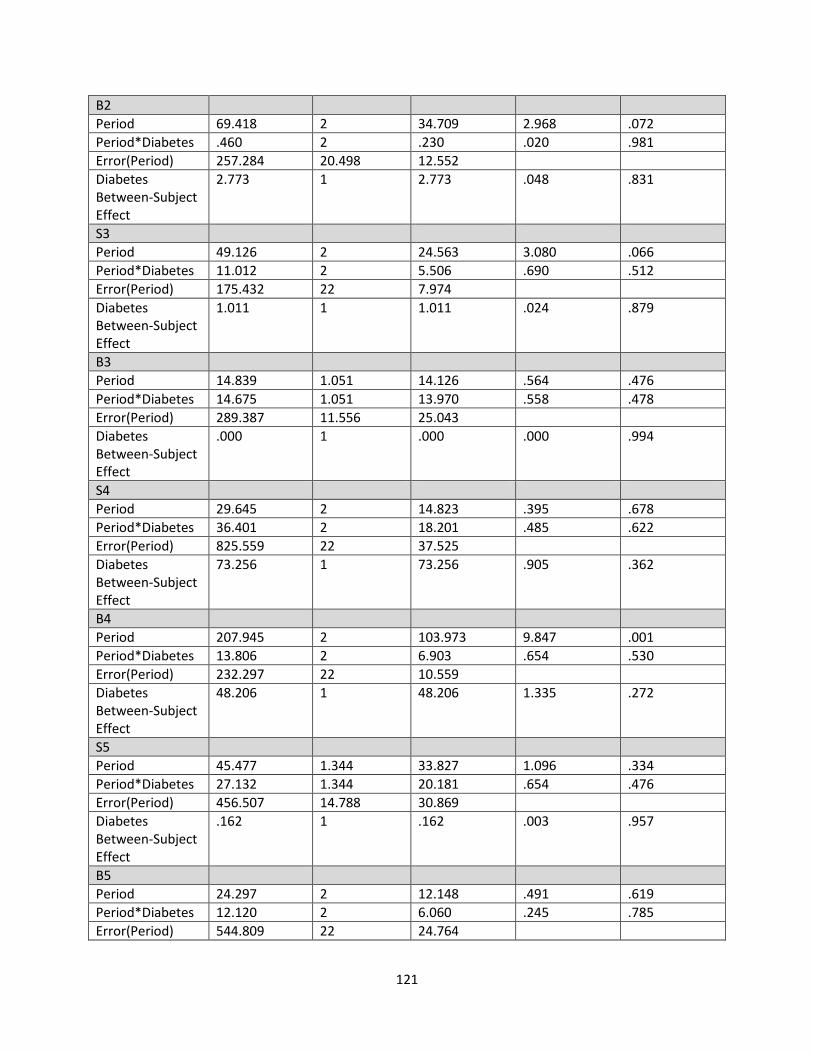
121
B2
Period 69.418 2 34.709 2.968 .072
Period*Diabetes .460 2 .230 .020 .981
Error(Period) 257.284 20.498 12.552
Diabetes Between-Subject Effect
2.773 1 2.773 .048 .831
S3
Period 49.126 2 24.563 3.080 .066
Period*Diabetes 11.012 2 5.506 .690 .512
Error(Period) 175.432 22 7.974
Diabetes Between-Subject Effect
1.011 1 1.011 .024 .879
B3
Period 14.839 1.051 14.126 .564 .476
Period*Diabetes 14.675 1.051 13.970 .558 .478
Error(Period) 289.387 11.556 25.043
Diabetes Between-Subject Effect
.000 1 .000 .000 .994
S4
Period 29.645 2 14.823 .395 .678
Period*Diabetes 36.401 2 18.201 .485 .622
Error(Period) 825.559 22 37.525
Diabetes Between-Subject Effect
73.256 1 73.256 .905 .362
B4
Period 207.945 2 103.973 9.847 .001
Period*Diabetes 13.806 2 6.903 .654 .530
Error(Period) 232.297 22 10.559
Diabetes Between-Subject Effect
48.206 1 48.206 1.335 .272
S5
Period 45.477 1.344 33.827 1.096 .334
Period*Diabetes 27.132 1.344 20.181 .654 .476
Error(Period) 456.507 14.788 30.869
Diabetes Between-Subject Effect
.162 1 .162 .003 .957
B5
Period 24.297 2 12.148 .491 .619
Period*Diabetes 12.120 2 6.060 .245 .785
Error(Period) 544.809 22 24.764

122
Diabetes Between-Subject Effect
7.740 1 7.740 .126 .729
S6
Period 6.949 2 3.475 .274 .763
Period*Diabetes 17.936 2 8.969 .707 .504
Error(Period) 279.188 22 12.690
Diabetes Between-Subject Effect
77.590 1 77.590 1.432 .257
B6
Period 46.074 2 23.037 .702 .506
Period*Diabetes 2.160 2 1.080 .033 .968
Error(Period) 722.244 22 32.829
Diabetes Between-Subject Effect
2.684 1 2.684 .060 .811
S7 2
Period 53.277 2 1.212 1.212 .317
Period*Diabetes 9.902 22 .225 .225 .800
Error(Period) 483.353 1 .010
Diabetes Between-Subject Effect
.372 .010 .920