oxygen control for an industrial pilot-scale fed-batch … · fed-batch filamentous fungal...
TRANSCRIPT

Oxygen Control for an Industrial Pilot-scale
Fed-batch Filamentous Fungal Fermentation
L. Bodizs1, M. Titica2,∗, N. Faria3,
B. Srinivasan1,∗∗, D. Dochain2 and D. Bonvin1
1Ecole Polytechnique Federale de Lausanne,Lausanne, Switzerland
2CESAME, Universite Catholique de Louvain,Louvain-la-Neuve, Belgium
3Novozymes A/S, Bagsvaerd, Denmark
Abstract
Industrial filamentous fungal fermentations are typically operated in fed-batch mode.Oxygen control represents an important operational challenge due to the varyingbiomass concentration. In this study, oxygen control is implemented by manipu-lating the substrate feed rate, i.e. the rate of oxygen consumption. It turns outthat the setpoint for dissolved oxygen represents a trade-off since a low dissolvedoxygen value favors productivity but can also induce oxygen limitation. This paperaddresses the regulation of dissolved oxygen using a cascade control scheme thatincorporates auxiliary measurements to improve the control performance. The com-putation of an appropriate setpoint profile for dissolved oxygen is solved via processoptimization. For that purpose, an existing morphologically structured model is ex-tended to include the effects of both low levels of oxygen on growth and mediumrheological properties on oxygen transfer. Experimental results obtained at the in-dustrial pilot-scale level confirm the efficiency of the proposed control strategy butalso illustrate the shortcomings of the process model at hand for optimizing thedissolved oxygen setpoints.
Key words: Bioprocesses, Filamentous fungal fermentation, Rheologicalproperties, Oxygen control, Dissolved oxygen setpoint, Cascade control.
1 ∗ M. Titica is currently with Universite de Nantes, CRTT, BP 406, 44602 Saint-Nazaire, Cedex, France.2 ∗∗ B. Srinivasan is currently with Ecole Polytechnique de Montreal, Montreal,Canada.
Preprint submitted to Elsevier Science 25 January 2007

1 Introduction
Filamentous fungi are among the most frequently used cell factories in thefermentation industry. Their success is due to the relatively well-establishedfermentation technology and the versatility of strains available, thus allowingthe production of a wide variety of products: primary metabolites, antibiotics,enzymes, and proteins [1].
Traditionally, filamentous fungal fermentations are operated in fed-batch mode,with the feed rates being manipulated manually. As a result of the filamentousstructure of the biomass, its concentration is considerably higher than in otherbiological processes. High biomass concentration induces high viscosity, whichmakes oxygen transfer difficult [2]. In addition, other factors such as the initialproperties of the biomass (inoculum) can lead to situations with insufficientoxygen and lower performance of the microorganisms. The goal of this workis to propose an oxygen control strategy that ensures high productivity andlimits the risk of running into oxygen limitation.
Usually, the level of dissolved oxygen (DO) is controlled by manipulating theairflow or the stirrer speed. However, when applied to large-scale industrialreactors, which is the ultimate goal of this work, this strategy often leads tounacceptable power consumption. Additionally, this culture is rather shearsensitive because of the filamentous structure of the microorganisms. Hence,in these cases, the dissolved oxygen concentration can be controlled by limit-ing its consumption [3], [4], [5]. This is achieved by manipulating the substratefeed rate, i.e. the feed of the substance being oxidized. Both manual and PIDcontrol have been used for regulating the dissolved oxygen concentration, butthe range in which this concentration could be confined is fairly wide. One wayto cope with this difficulty is to operate with a sufficiently high setpoint foroxygen concentration so that, despite these large variations, oxygen limitationdoes not occur. However, this policy corresponds to feeding less substrate,which reduces production and is economically unacceptable. Hence, the ob-jective is to control oxygen concentration tightly at a reasonably low setpointso that oxygen limitation can be avoided without sacrificing production. Con-sequently, the objective of this project is twofold: i) optimization to determinea setpoint profile that maximizes production, and ii) control to follow thissetpoint while avoiding oxygen limitation.
The first objective is addressed by solving a model-based optimization prob-lem. A first-principles model of the filamentous fungal (α-amylase producingstrain of Aspergillus oryzae) fermentation process is proposed in [6], whilea data-driven model is described in [7]. Here, the former is utilized. Thisfirst-principles model is morphologically structured and provides a descriptionof biomass, glucose and enzyme concentrations of submerged cultures of fil-
2
amentous fungi without oxygen limitation. However, since oxygen dynamicsare crucial in the operation of fed-batch cultivations, the influence of dissolvedoxygen limitation on the biomass and enzyme production needs to be incor-porated. These effects are included in the model, which is fitted and validatedon experimental data from fed-batch fermentations provided by Novozymes,Denmark.
The control objective is met by a cascade-type controller. The poor perfor-mance of standard PID control can be attributed to the fact that it only usesinformation on the controlled variable, though much more information is avail-able via auxiliary measurements such as the oxygen uptake rate (OUR) andcarbon dioxide evolution rate (CER). Hence, the idea to incorporate some ofthese measurements in the control algorithm. By analyzing the structure ofthe process model, a simple cascade control scheme is proposed, whereby theouter-loop oxygen controller provides the setpoint for the OUR/CER signalthat is controlled in the inner loop.
Experimental results show that the setpoint chosen by model-based optimiza-tion is not appropriate for the real process. Though the model was fitted andvalidated on experimental data, its extrapolative power remains poor due toplant-model mismatch. However, the cascade controller is quite effective inkeeping the dissolved oxygen in a tight range.
The paper is organized as follows. Section 2 describes the process under consid-eration and its operation in industry. Section 3 details a first-principles modelof filamentous fungal fermentation and develops oxygen transfer relationships.Oxygen control is considered in Section 4, with optimization to determine theDO setpoint and cascade control for its regulatation. Section 5 presents exper-imental results carried out in a pilot plant at Novozymes. Finally, conclusionsare provided in Section 6.
2 Process Description and Industrial Practice
2.1 Fungal Fermentation
The process studied in this paper is the α-amylase production by Aspergillusoryzae. The same substrate is consumed for both biomass growth and enzymeproduction. The main difficulty with this process is oxygen limitation in theliquid phase. This depletion is usually caused by high biomass concentration,which, due to its filamentous structure, increases the viscosity and makesoxygen transfer difficult.
3

2.2 Current Operation
The fermentation at Novozymes Pilot Plant, (Bagsvaerd, Denmark) is carriedout in a 2500 L stirred vessel. pH is controlled through dosing ammonia (g) andphosphoric acid. The fermenter is aerated at the constant rate of 1 vvm andagitation speed of 275 rpm. Temperature and pressure are kept at a constantlevel by the process control system DeltaV, from Fisher Rosemount.
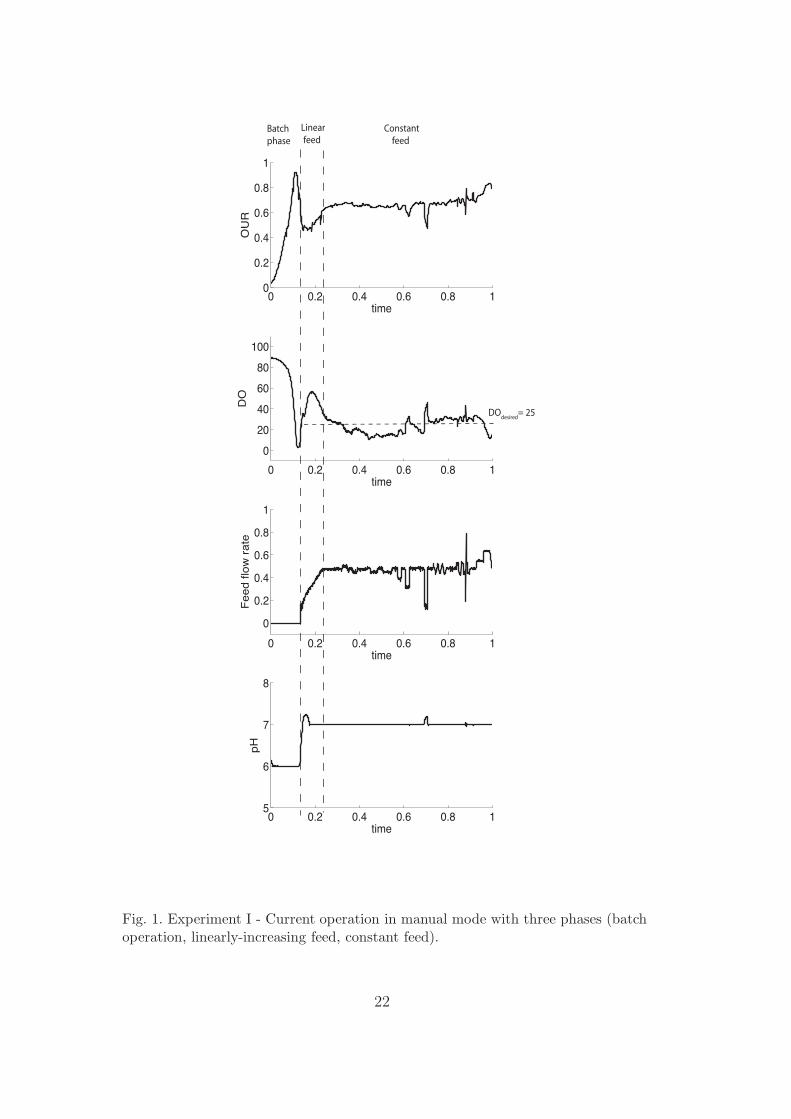
The typical way of operating the fermentation process is presented in Figure 1.For the sake of confidentiality, the experimental results have been normalizedand thus no measurement units are presented. The substrate feeding policytakes into account the problem of oxygen limitation and consists of:
(1) a batch or growth phase, during which the substrate concentration isreduced from a high initial value to its operational range,
(2) a linearly-increasing feed rate whose role is to avoid oxygen limitation inthe early phase of the fed-batch, and
(3) a ’constant’ feed rate that is chosen in order to exactly fill the reactor inthe remaining operation time and keep the dissolved oxygen around thedesired value DOdesired = 25.
As can be seen in Figure 1, the range of dissolved oxygen is fairly wide (20-40%). Also, towards the end of the batch, increasing the feed rate causesoxygen limitation. A larger feed rate means more biomass, higher viscosityand thus reduced oxygen transfer. This phenomenon has been encounteredand analyzed by the biologists in Novozymes. It can be explained as follows.Once under oxygen limitation, the biomass changes morphology, whereby theviscosity of the medium increases significantly. However, this increase in vis-cosity reduces oxygen transfer even more. This positive feedback effect leadsto lower and lower oxygen levels and eventually to the death of the microor-ganisms. Hence, if tight oxygen control is not ensured, the risk of running intooxygen limitation is very high.
2.3 Measurements
The measurements available are the volume V , the viscosity η, the dissolvedoxygen pressure DO, the aeration rate Qg, the amount of oxygen consumed∆[O2], and the amount of carbon dioxide produced ∆[CO2].
The volume is calculated from weight measurements, assuming constant den-sity throughout the fermentation. The viscosity is determined by a viscosime-ter Hydramotion, York England. DO is determined by an electrode Ingold,from Mettler Toledo. The oxygen and carbon dioxide concentrations in the
4

exhaust gases are determined by a mass spectrometer VG Prima dB, fromThermo.
The oxygen uptake rate OUR and the carbon dioxide evolution rate CER aredetermined from gas analysis. The inlet flow rate is measured, as are the massfractions of oxygen and carbon dioxide in the inlet and the outlet flows. Byusing these quantities and a nitrogen (inert) balance, the volumetric outputgas flow rate Gout can be determined as follows:
Gout yN2,out = Gin yN2,in (1)
Gout = Gin1 − yO2,in − yCO2,in
1 − yO2,out − yCO2,out − yW,out(2)
where
Gout – volumetric output gas flow rate (nL/h)yN2,out – output mass fraction of nitrogenGin – volumetric input gas flow rate (nL/h)yN2,in – input mass fraction of nitrogenyO2,in – input mass fraction of oxygenyO2,out – output mass fraction of oxygenyCO2,out – output mass fraction of carbon dioxideyW,out – output mass fraction of water
The output water mass fraction can be be calculated from the dilution ofoxygen measurement, by purging the reactor without reaction [8]:
yW,out = yO2,in − yO2,out (3)
Once the output gas flow rate has been computed, OUR and CER can bedetermined from balance equations without accumulation terms:
OUR =Gin yO2,in − Gout yO2,out
V
ρ
MO2
(4)
CER =Gout yCO2,out − Gin yCO2,in
V
ρ
MCO2
(5)
5
where ρ is the average density of the gas flow, while MO2 and MCO2 are themolecular weights for oxygen and carbon dioxide, respectively.
Note that, in general, an acceptable approximation is to simply considerOUR ≈ OTR, since the solubility of oxygen is very low [9]. Typically, thesame does not hold for CER and CTR since the solubility of carbon diox-ide depends on the physical and chemical properties of the medium, such astemperature and pH. However, since here the fermentor is operated at con-stant temperature, pressure and pH in the fed-batch phase (Figure 1), it canbe assumed that the rate at which CO2 is formed by microbial metabolismcorresponds to the carbon dioxide transfer rate and thus CER ≈ CTR.
3 Filamentous Fungal Fermentation Model
In this section, the influence of dissolved oxygen is incorporated within thekinetic equations using Monod expressions, and an additional state – for dis-solved oxygen – is introduced in the model.
3.1 Morphology and Rate Expressions
Growth kinetics. The morphologically structured model proposed by [6] isbased on the division of the biomass into three different compartments:
• Active region (Xa) - responsible for the uptake of substrate and growth ofthe hyphal elements. It is assumed that only the active region is responsiblefor enzyme production.
• Extension region (Xe) - responsible for new cell wall generation and exten-sion.
• Hyphal region (Xh) - the degenerated part of the hyphal elements that isinactive.
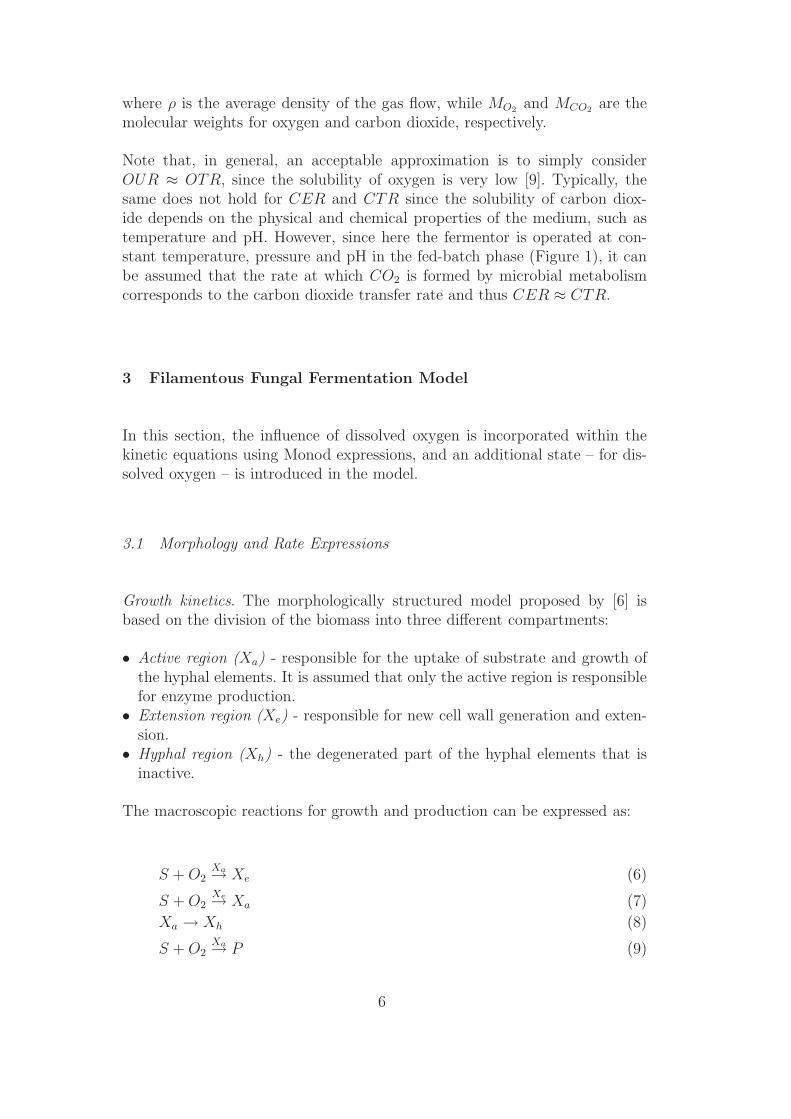
The macroscopic reactions for growth and production can be expressed as:
S + O2Xa→ Xe (6)
S + O2Xe→ Xa (7)
Xa → Xh (8)
S + O2Xa→ P (9)
6

where S stands for the substrate (glucose), O2 for the dissolved oxygen andP for the product (α-amylase).
The corresponding kinetic expressions read:
Branching (Equation (6)):
q1 = xaDO
DO + KDO
k1s
at(s + Ks1)(10)
Growth of the active region (Equation (7)):
q2 = atxeDO
DO + KDO
k2s
s + Ks2(11)
Differentiation (Equation (8)):
q3 = k3xa (12)
The specific growth rate of total biomass is:
µ =q2
xt
(13)
where xt = xe + xa + xh represents the total biomass concentration, xe, xa
and xh are the concentrations of the extension, active and hyphal zones, re-spectively, s and DO are the substrate and dissolved oxygen concentrations,at represents the number of tips per unit mass of the extension zones. Theparameter at is described as a function of µ (see [6,10] for details concerningthe morphological model). The kinetic expressions and the model parametersare presented in Appendix A.
Specific rate of enzyme production. Enzyme production in filamentous fungiis a classical example of growth-associated product formation. The enzymeproduction is subject to glucose (substrate) inhibition and oxygen limitation:
rps =
µ0s
Ks + s + s2
KI
+ kcs
s + Kcor
DO
DO + KDO(14)
7
The expression used in [6] describes the substrate inhibition by an exponentialdecrease in the specific production rate of the enzyme when the substrateconcentration exceeds a certain threshold value. In this study, the expressionof the specific rate of enzyme production is modified by using a Haldaneexpression to describe the substrate inhibition. This modification has beenmotivated by the application of an extremum-seeking controller to this process[11]. The parameter kc quantifies the constitutive level of enzyme productionat high glucose concentrations (during the batch phase).
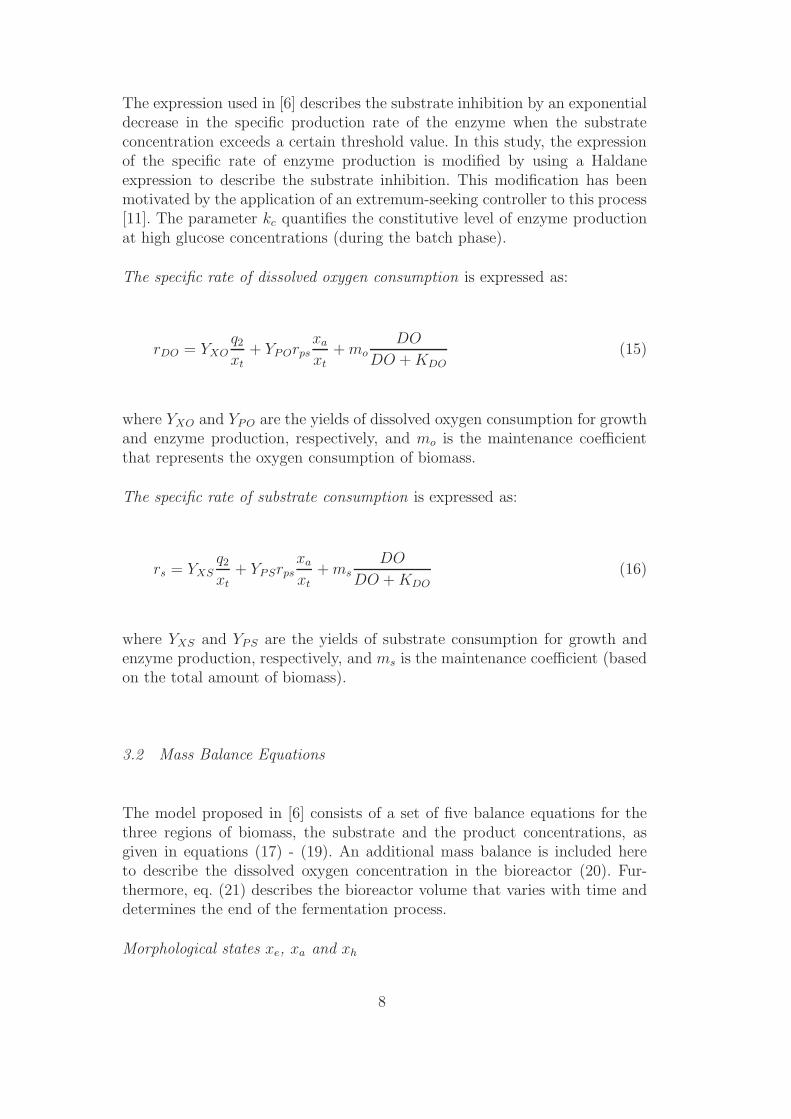
The specific rate of dissolved oxygen consumption is expressed as:
rDO = YXOq2
xt+ YPOrps
xa
xt+ mo
DO
DO + KDO(15)
where YXO and YPO are the yields of dissolved oxygen consumption for growthand enzyme production, respectively, and mo is the maintenance coefficientthat represents the oxygen consumption of biomass.
The specific rate of substrate consumption is expressed as:
rs = YXSq2
xt+ YPSrps
xa
xt+ ms
DO
DO + KDO(16)
where YXS and YPS are the yields of substrate consumption for growth andenzyme production, respectively, and ms is the maintenance coefficient (basedon the total amount of biomass).
3.2 Mass Balance Equations
The model proposed in [6] consists of a set of five balance equations for thethree regions of biomass, the substrate and the product concentrations, asgiven in equations (17) - (19). An additional mass balance is included hereto describe the dissolved oxygen concentration in the bioreactor (20). Fur-thermore, eq. (21) describes the bioreactor volume that varies with time anddetermines the end of the fermentation process.
Morphological states xe, xa and xh
8

xe = q1 − FVxe, xe(0) = xe0
xa = q2 − q1 − q3 − FV
xa, xa(0) = xa0
xh = q3 − FVxh, xh(0) = xh0
(17)
Glucose s
s = −rsxt +F
V(sf − s), s(0) = s0 (18)
Enzyme p
p = rpsxa − FV
p, p(0) = p0 (19)
Dissolved oxygen DO
DO = −rDOxt + kLa(DO∗ − DO) − F
VDO, DO(0) = DO0 (20)
Volume V
V = F − Fevap, V (0) = V0 (21)
In these equations, F represents the substrate feeding rate, sf is the substrateconcentration in the feed, Fevap is the evaporation rate, kLa the specific gas-liquid mass transfer coefficient for oxygen, and DO∗ the oxygen saturationconcentration.
The model parameters and their numerical values are given in Appendix A.The parameters related to the microscopic morphology (10)-(11) are takenfrom [6]. The kinetic parameters for the Haldane expression (14) are identifiedby fitting the model to simulated data generated by the model in [6]. Theyield coefficients YXS, YPS, YXO, YPO are identified from experimental dataprovided by Novozymes. The data used for model fitting include both on-linemeasurements (DO, viscosity, OUR, CER, and V ) and off-line measurements(p and xt).
9

3.3 Modeling Oxygen Transfer
The effect of oxygen on growth and production is crucial due to the positivefeedback effect mentioned in Section 2.2. Hence, it is necessary to understandand model the factors that affect oxygen transfer. This will be done via anempirical model that relates kLa to the state variables xt and DO. This linkwill be established through the viscosity and consists of various steps:
(1) Estimation of kLa. In stirred bioreactors, the oxygen transfer coefficient,kLa, depends on the impeller characteristics and the rheological proper-ties of the fermentation medium. The value of kLa can be determinedexperimentally by the dynamic OTR method (oxygen transfer rate mea-surement) that gives an average kLa value for the bioreactor [12]. On-line measurements of oxygen transfer rate (OTR), viscosity, and DO areavailable, as well as off-line measurement of the total biomass xt. ThekLa-value is calculated as:
kLa = γOTR
(DO∗ − DO)(22)
where γ is a proportionality factor.(2) Calibration of kLa as a function of viscosity. An empirical relationship
between kLa and viscosity is determined experimentally. Under maxi-mum air flow rate and constant agitation speed, the substrate feed rateis varied in such a way that oxygen limitation occurs. kLa is estimatedas mentioned above and viscosity is measured. The relationship can beapproximated by the linear equation (Figure 2):
kLa = c0 − c1η (23)
where η represents the on-line measurement of viscosity, and c0 and c1
are linear regression coefficients (R2 = 0.94).(3) Calibration of viscosity as a function of xt and DO. The use of eq. (23) in
the dynamic model (17) - (21) requires knowledge of viscosity. For a givenstirrer speed, the viscosity of the filamentous suspension is influenced bytwo main factors: the biomass concentration and the fibrous structureof the biomass. Due to the lack of quantification of the fibrous struc-ture, the viscosity is simply regressed with available experimental data.A linear relationship between viscosity and biomass concentration is ad-equate to represent experimental observations (data not shown). This isalso in agreement with literature data for fermentations of Penicilliumchrysogenum and Aspergillus niger [12]. Nevertheless, this relation canbe improved by introducing the effect of dissolved oxygen to give:
η = η0 + aXxt − aDODO (24)
10

where η0, aX , and aDO are linear regression coefficients (R2 = 0.84).A negative effect of DO on the viscosity is found. This effect can beexplained intuitively by the behavior of the filamentous organisms con-sidered in this paper. Following a decrease in the DO level, the microor-ganisms react by ’reaching out for air’, that is changing their fibrousstructure so as to increase the zone of the reaction mass from where theycan absorb oxygen. As a consequence, viscosity increases (see Section2.2). Also, when the level of DO is high, there is enough ’air to breathe’within the immediate neighborhood, so there is no need to stretch anyfurther, thereby keeping viscosity low. The performance of the viscositymodel is shown in Figure 3.
In summary, by combining equations (23) and (24), it is possible to modelthe oxygen transfer coefficient kLa in terms of total biomass and dissolvedoxygen. The accuracy of the DO prediction using equation (20) to model thedynamics of DO and equations (23) and (24) to express kLa in terms of xt
and DO is presented in Figures 4 and 5 for two different data sets. It is seenthat the oxygen model performs satisfactorily.
The simulated behavior of the reactor is presented in Figure 6. It can beobserved that the substrate concentration is much higher at the beginning, inthe batch phase, than later on, in the fed-batch phase. This strategy favorsbiomass growth in the batch phase and production in the fed-batch phase. It isalso observed that, in the fed-batch phase, the amount of inactive biomass Xh
increases. As a consequence, the viscosity of the medium increases, leadingto a decrease of the oxygen transfer rate (kLa decreases). This decrease, inturn, reduces the dissolved oxygen concentration, which might lead to oxygenlimitation.
4 Oxygen Control
4.1 Setpoint Computation for Dissolved Oxygen
The model given in the previous section can be used to determine the dissolvedoxygen profile that would maximize the bioreactor performance while avoidingoxygen limitation. This optimization problem can be formulated mathemati-cally as follows [13]:
11

minF (t),tf
tf (25)
s.t. (10) − (21), (23), (24)
p(tf )V (tf ) ≥ [p(tf )V (tf )]min
V (tf) ≤ Vmax
Fmin ≤ F (t) ≤ Fmax
where tf is the final time, [p(tf)V (tf)]min is the minimum amount of enzyme tobe produced, Vmax is the maximum volume, Fmin and Fmax are the minimumand maximum feed rates, respectively.
Note that this optimization can be performed once before the beginning ofthe batch or repeated several times during the batch. If the optimization isrepeated, the available measurements can be used in the optimization via asoftware sensor that estimates the current states (Figure 7). In this study, asoftware sensor based on open-loop model prediction is used [14]. This softwaresensor is based on the model used for optimization, except that the equationscorresponding to the measured states DO and V are discarded since the statevalues are known from measurements. Furthermore, kLa is computed as inequation (22).
Usually, the goal of such an optimization is to compute the control inputsdirectly [15]. In this study, however, not the feed rate profile F (t) but thedissolved oxygen profile DO(t) is sought. This profile is used as referenceprofile for the cascade controller to be discussed in the next subsection. Thestrategy is illustrated in Figure 7.
4.2 Cascade Control
A cascade control structure is chosen since it has been observed experimentallyat Novozymes that simple output controllers for DO control do not performwell. Hence, additional measurements are sought to improve the control per-formance. The auxiliary measurements that are available for this process arepH , pressure, viscosity, V , OUR and CER. Since pH and pressure have notbeen incorporated in the model and the viscosity sensor is not always reliable,the idea is to develop a control strategy that uses the OUR, CER and Vmeasurements.
An interesting feature can be taken from the oxygen dynamics. The feed ratehas two main effects on the dissolved oxygen concentration: (i) an immedi-ate effect through dilution (the last term on the right-hand side of eq. (20))since increasing F decreases DO, and (ii) integral effect through oxygen con-sumption (first term) since increasing F increases the amount of substrate in
12
the reactor and thus also its consumption, which in turn decreases DO. Fur-thermore, the influence of F on the oxygen transfer between the gaseous andthe liquid phases (second term) is quite negligible compared to the other twoterms.
If the DO level is controlled through dilution only (the last term on the right-hand side of eq. (20)), the resulting change in the amount of substrate mayitself induce a change in DO, which gives rise to oscillations and poor perfor-mance. This is typical of systems where the zero dynamics play an importantrole in process performance [16].
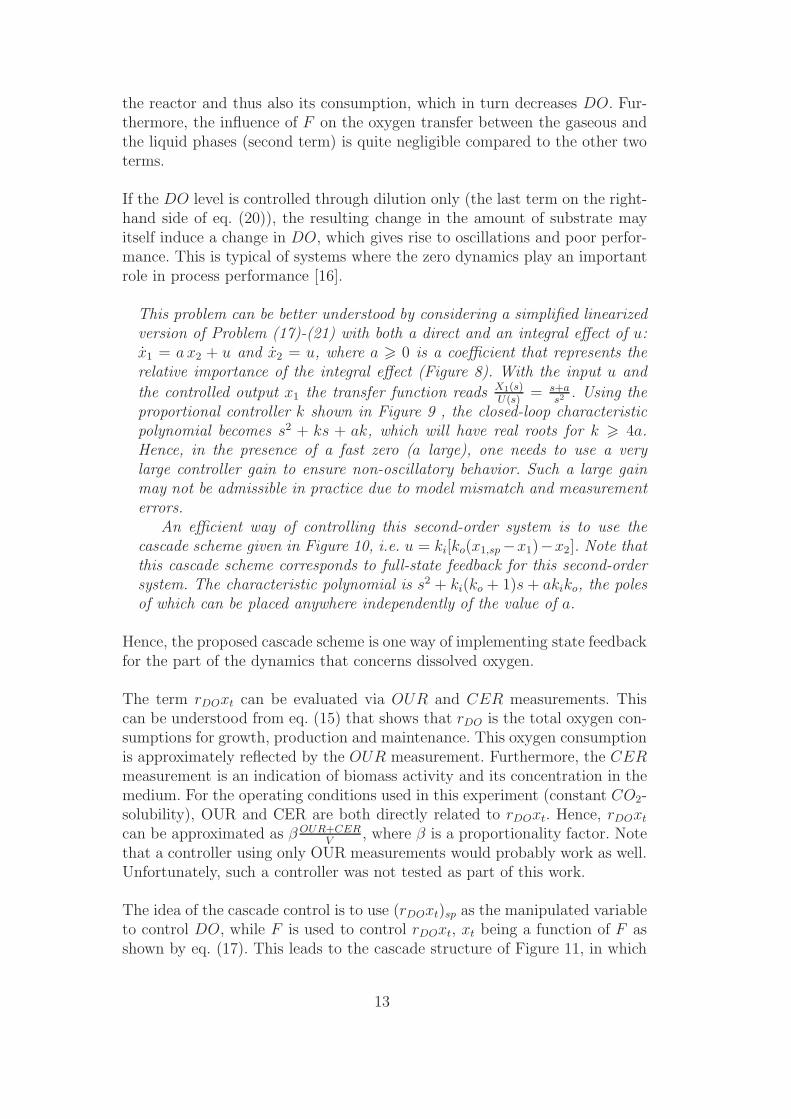
This problem can be better understood by considering a simplified linearizedversion of Problem (17)-(21) with both a direct and an integral effect of u:x1 = a x2 + u and x2 = u, where a � 0 is a coefficient that represents therelative importance of the integral effect (Figure 8). With the input u and
the controlled output x1 the transfer function reads X1(s)U(s)
= s+as2 . Using the
proportional controller k shown in Figure 9 , the closed-loop characteristicpolynomial becomes s2 + ks + ak, which will have real roots for k � 4a.Hence, in the presence of a fast zero (a large), one needs to use a verylarge controller gain to ensure non-oscillatory behavior. Such a large gainmay not be admissible in practice due to model mismatch and measurementerrors.
An efficient way of controlling this second-order system is to use thecascade scheme given in Figure 10, i.e. u = ki[ko(x1,sp−x1)−x2]. Note thatthis cascade scheme corresponds to full-state feedback for this second-ordersystem. The characteristic polynomial is s2 + ki(ko + 1)s + akiko, the polesof which can be placed anywhere independently of the value of a.
Hence, the proposed cascade scheme is one way of implementing state feedbackfor the part of the dynamics that concerns dissolved oxygen.
The term rDOxt can be evaluated via OUR and CER measurements. Thiscan be understood from eq. (15) that shows that rDO is the total oxygen con-sumptions for growth, production and maintenance. This oxygen consumptionis approximately reflected by the OUR measurement. Furthermore, the CERmeasurement is an indication of biomass activity and its concentration in themedium. For the operating conditions used in this experiment (constant CO2-solubility), OUR and CER are both directly related to rDOxt. Hence, rDOxt
can be approximated as β OUR+CERV
, where β is a proportionality factor. Notethat a controller using only OUR measurements would probably work as well.Unfortunately, such a controller was not tested as part of this work.
The idea of the cascade control is to use (rDOxt)sp as the manipulated variableto control DO, while F is used to control rDOxt, xt being a function of F asshown by eq. (17). This leads to the cascade structure of Figure 11, in which
13
the role of the inner loop is to regulate the substrate consumption based onOUR and CER measurements, while the outer loop gives the setpoint for thisconsumption.
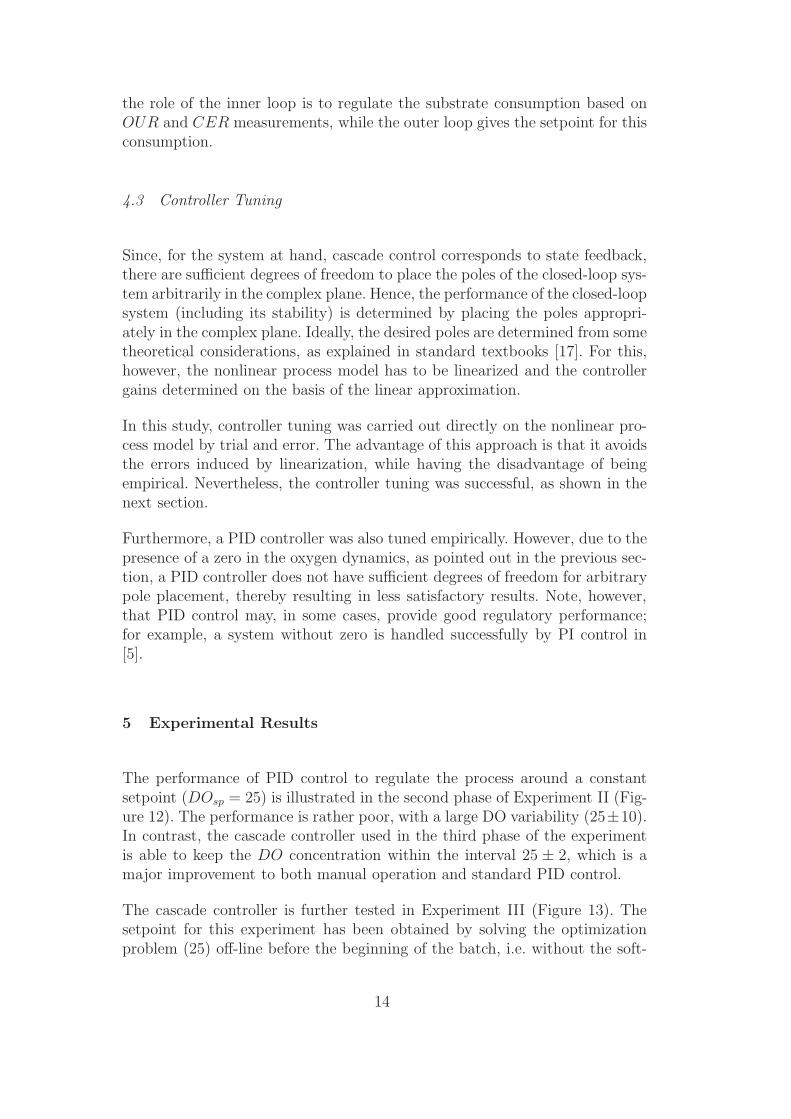
4.3 Controller Tuning
Since, for the system at hand, cascade control corresponds to state feedback,there are sufficient degrees of freedom to place the poles of the closed-loop sys-tem arbitrarily in the complex plane. Hence, the performance of the closed-loopsystem (including its stability) is determined by placing the poles appropri-ately in the complex plane. Ideally, the desired poles are determined from sometheoretical considerations, as explained in standard textbooks [17]. For this,however, the nonlinear process model has to be linearized and the controllergains determined on the basis of the linear approximation.
In this study, controller tuning was carried out directly on the nonlinear pro-cess model by trial and error. The advantage of this approach is that it avoidsthe errors induced by linearization, while having the disadvantage of beingempirical. Nevertheless, the controller tuning was successful, as shown in thenext section.
Furthermore, a PID controller was also tuned empirically. However, due to thepresence of a zero in the oxygen dynamics, as pointed out in the previous sec-tion, a PID controller does not have sufficient degrees of freedom for arbitrarypole placement, thereby resulting in less satisfactory results. Note, however,that PID control may, in some cases, provide good regulatory performance;for example, a system without zero is handled successfully by PI control in[5].
5 Experimental Results
The performance of PID control to regulate the process around a constantsetpoint (DOsp = 25) is illustrated in the second phase of Experiment II (Fig-ure 12). The performance is rather poor, with a large DO variability (25±10).In contrast, the cascade controller used in the third phase of the experimentis able to keep the DO concentration within the interval 25 ± 2, which is amajor improvement to both manual operation and standard PID control.
The cascade controller is further tested in Experiment III (Figure 13). Thesetpoint for this experiment has been obtained by solving the optimizationproblem (25) off-line before the beginning of the batch, i.e. without the soft-
14

ware sensor given in Figure 7. Since the resulting DO-profile is nearly constant,it is approximated by a constant value for ease of implementation [13]. Thecontroller works satisfactorily for most of the time. However, the oscillatorybehavior typical of oxygen limitation starts after 0.75 time units. Since thisphenomenon of oxygen limitation is highly nonlinear, the linear cascade con-troller is unable to bring the fermentation back to normal operation.
The on-line reoptimized DO setpoint given in Figure 7 is used in the secondphase of Experiment IV (Figure 14). Unfortunately, the optimization providessetpoints that are well below DOsp = 20%, already known from ExperimentIII to lead to oxygen limitation. Since this is considered unacceptable, a safeand constant setpoint is used in the third phase of this experiment. In thisthird phase, several external perturbations act on the system, ranging fromsensor failure at time 0.55 to manual setpoint changes at time 0.7.
These experiments have demonstrated that, even though the model has beenfitted to give good one-step ahead prediction and fairly reasonable multi-stepsimulations, the setpoints provided by solving optimization problem (25) off-line (Experiment III) or on-line (Experiment IV) are in the region of oxygenlimitation. This observation can be explained by the plant-model mismatchpresent in the oxygen dynamics. However, these experiments have shown thatthe cascade controller is able to follow the desired DO setpoint more accuratelythan traditional PID control.
Unfortunately, though the regulatory performance of the controller is excellent,the transients exhibit some overshoot. This is mainly due to input saturationnot being accounted for in the control design. Other strategies, such as con-trolling OUR, could be applied since they give a more reliable indication ofbiomass activity than DO early in the batch.
6 Conclusions
The main outcome of this study is the cascade controller for dissolved oxygen.The proposed scheme efficiently regulates the DO level, but a proper setpointneeds to be chosen to keep the process away from oxygen limitation. Theadvantage of the proposed control strategy is that it is simple to apply andnot specific to the strain of microorganism studied in this paper. Thus, it isapplicable to a wide variety of fungal fermentations.
A mechanistic model of enzyme production by filamentous fungal fermentationhas been extended to include rheological considerations. The effect of mediumviscosity on the oxygen dynamics is described by empirically modeling thedependence of the mass transfer coefficient kLa on viscosity and that of vis-
15
cosity on biomass and dissolved oxygen concentration. The resulting model isused to determine the optimal DO setpoint, while the insight gained from themodel is also used to design a cascade controller. This study has also indicatedseveral model shortcomings. The most important one is that the effect of pHis completely discarded. As a consequence, the model predicts feasible opera-tion at low dissolved oxygen values that could not be verified experimentally.Also, the model-based optimization is not capable of computing reliable DOsetpoints.
In future experiments, one could focus on determining experimentally the bestsetpoint for dissolved oxygen, e.g. using extremum-seeking techniques [11].
Acknowledgements: This paper presents the results of the Knowledge-drivenBatch Production (BatchPro) European Project HPRN-CT-2000-00039. Theauthors would like to thank F. Lei and H. Jorgensen from Novozymes, Bagsvaerd,Denmark, for their suggestions and for making possible to carry out the ex-perimental work.
References
[1] M. McIntyre, C. Muller, J. Dynesen, J. Nielsen, Metabolic engineering of themorphology of Aspergillus, Adv. Biochem. Eng./Biotech. 73 (2001) 104–128.
[2] Z. J. Li, V. Shukla, A. P. Fordyce, A. G. Pedersen, K. S. Wenger, M. R. Marten,Fungal morphology and fragmentation behavior in fed-batch Aspergillus oryzaefermentation at the production scale, Biotech. Bioeng. 70 (2000) 300–312.
[3] R. Oliveira, R. Simutis, S. F. de Azevedo, Design of a stable adaptive controllerfor driving aerobic fermentation processes near maximum oxygen transfercapacity, J. Process Contr. 14 (2004) 617–626.
[4] L. Simon, M. N. Karim, Identification and control of dissolved oxygen inhybridoma cell culture in a shear sensitive environment, Biotechnol. Prog. 17(2001) 634–642.
[5] J. D. Chung, Design of metabolic feed controllers: Application to high-densityfermentations of Pichia pastoris, Biotech. Bioeng. 68 (2000) 298–307.
[6] T. Agger, B. Spohr, M. Carlsen, J. Nielsen, Growth and product formationof aspergillus oryzae during submerged cultivations: Verification of amorphologically structured model using fluorescent probes, Biotech. Bioeng.57 (1998) 321–329.
[7] J. K. Rasmussen, S. B. Jorgensen, Experimental investigation of data-drivenmodelling for control of fed-batch cultivation, in: IFAC World Congress, Prague,Czech Republic, 2005.
16

[8] C. Herwig, On-line exploitation tools for the quantitative analysis of metabolicregulations in microbial cultures, Ph.D. thesis, Ecole Polytechnique Federale deLausanne (2001).
[9] A. G. Pedersen, kLa characterization of industrial fermentors, in: 4th
International Conference on Bioreactor and Bioprocess Fluid Dynamics,Edinburgh, UK, 1997.
[10] L. Bodizs, B. Srinivasan, D. Bonvin, Optimal feeding strategy for bioreactorswith biomass death, in: Proc. CAB9, Nancy, France, 2004.
[11] M. Titica, D. Dochain, M. Guay, Adaptive extremum-seeking control of enzymeproduction in filamentous fungal fermentation, in: Proc. CAB9, Nancy, France,2004.
[12] A. Moser, Bioprocess Technology. Kinetics and Reactors., Springer-Verlag,1988.
[13] M. Titica, L. Bodizs, F. Lei, B. Srinivasan, D. Dochain, D. Bonvin, Modelingand optimization of fed-batch filamentous fungal fermentation, in: BatchProSymposium, Poros, Greece, 2004, pp. 55–65.
[14] D. Dochain, State and parameter estimation in chemical and biochemicalprocesses : A tutorial, J. Process Contr. 13 (2003) 801–818.
[15] B. Srinivasan, S. Palanki, D. Bonvin, Dynamic optimization of batch processes:I. Characterization of the nominal solution, Comp. Chem. Eng. 27 (2003) 1–26.
[16] P. Mullhaupt, B. Srinivasan, J. Levine, D. Bonvin, Cascade control of thetoycopter, in: ECC’99, Karlsruhe, Germany, 1999.
[17] D. E. Seborg, T. F. Edgar, D. A. Mellichamp, Process Dynamics and Control,Wiley, 1989.
17

A Kinetic Expressions and Model Parameters for the Fed-batchFilamentous Fermentation Model
k1 =kbran · 104
π4(d · 10−4)2(1 − w)fρ
(A.1)
at =
(1
2
(1
2d · 10−4
)3 4π
3(1 − w)ρ
)−1
(A.2)
k2 = ktip,max · 10−4π
4
(d · 10−4
)2(1 − w)fρ (A.3)
d =1.1 +
√1.21 + 135ktip,maxfsxe
(s+Ks2)(xe+xa+xh)
2(A.4)
18

Table A.1Model parameter values
Parameter Value Measurement unit
aDO 0.04 kg/(m s %)
ax 0.094 kg DW kg/(g m s)
β 1 L / mmol
γ 1 1 / mmol
c0 67.2 h−1
c1 4.3816 m s/(kg h)
DO∗ 100 %
η0 4.185 kg/(m s)
f 80 %
Fevap 1.25 L/h
k3 0.08 h−1
kbran 0.0017 tip / (µm h)
kc 8 FAU kg DW/(L g h)
Kcor 10−6 g/L
KI 1.5 · 10−3 g glucose/L
KDO 2.5 %
KS 0.0211 g glucose /L
Ks1 0.003 g glucose /L
Ks2 0.006 g glucose /L
ktip,max 49 µm / (tip h)
mo 0.01 % kg DW/(g h)
ms 0.01 kg DW g glucose /(g L h)
µ0 227 FAU kg DW/(L g h)
ρ 1 g/cm3
sf 430 g glucose / L
w 0.67 g/kg DW
YXS 1.75 g glucose kg DW / L g
YPS 1.88 · 10−4 g glucose / FAU
YXO 57 % kg DW / g
YPO 35 % L / FAU
19

B Variables used in the Fed-batch Filamentous Fermentation Model
at – number of tips per unit mass (tips/(kg DW))aDO – regression coefficient (kg/(m s %))ax – regression coefficient (kg DW kg/(g m s))β – proportionality coefficient (L/mmol)γ – proportionality coefficient (1/mmol)CER – Carbon Evolution Rate (mmol/(L h))c0 – regression coefficient (h−1)c1 – regression coefficient (m s/ (kg h) )d – hyphal diameter (µ m)∆[CO2] – change in carbon dioxide concentration over the reactor (%)∆[O2] – change in oxygen concentration over the reactor (%)DO – dissolved oxygen concentration (%)DO∗ – equilibrium dissolved oxygen concentration (%)η – viscosity (kg/(m s))η0 – regression coefficient (kg/(m s))f – fraction of the active region (%)F – feed flow rate (L/h)FAU – 1 FAU is the amount of enzyme that hydrolyzes 5.26 g starch/h at30 ◦CFevap – evaporation rate (L/h)k1 – specific branching frequency (tips/(kg DW h))k2 – maximal tip extension rate (kg DW/(tips h))k3 – rate constant (h−1)kbran – specific branching frequency determined by image analysis (tip/(µm h))kc – constitutive α-amylase production rate (FAU kg DW/(L g h))Kcor – correction constant for the product formation (g glucose/L)KDO – limit value of dissolved oxygen concentration, below which oxygenlimitation occurs (%)KI – Haldane parameter (g glucose/L)kLa – specific gas-liquid mass transfer coefficient (1/(L h))KS – Haldane parameter (g glucose/L)Ks1 – saturation constant for branching (g glucose /L)Ks2 – saturation constant for tip extension (g glucose /L)ktip,max – maximal tip extension rate determined by image analysis (µm /(tip h))mo – maintenance coefficient (% kg DW/(g h))ms – maintenance coefficient (kg DW g glucose /(g L h))µ0 – Haldane parameter (FAU kg DW/(L g h))OUR – Oxygen Uptake Rate (mmol/(L h))p – α-amylase concentration (FAU / L)pref – reference pressure (atm)
20
q1 – rate of branching (g/(kg DW h))q2 – growth rate of the active region (g/(kg DW h))q3 – rate of hyphal cell formation (g/(kg DW h))R – universal gas constant (L atm/(mmol K))rDO – oxygen consumption rate (kg DW/(g h))rps – specific α-amylase formation rate (FAU kg DW/(L g h))rs – substrate consumption rate (kg DW g glucose /(g L h))ρ – hyphal density (g/cm3)s – substrate concentration (g glucose / L)sf – feed substrate concentration (g glucose / L)Tref – reference temeprature (K)V – volume (L)w – hyphal water content (g/kg DW)xa – concentration of active region (g/kg DW)xe – concentration of extension zone (g/kg DW)xh – concentration of hyphal region (g/kg DW)YPO – stoichiometric coefficient for oxygen consumption for product forma-tion (% L / FAU)YXO – stoichiometric coefficient for oxygen consumption for growth (% kgDW / g)YPS – yield coefficient for α-amylase on substrate (g glucose / FAU)YXS – stoichiometric coefficient for the uptake of substrate (g glucose kgDW / L g)
21
0 0.2 0.4 0.6 0.8 10
0.2
0.4
0.6
0.8
1
OU
R
time
0 0.2 0.4 0.6 0.8 1
0
20
40
60
80
100
time
DO
0 0.2 0.4 0.6 0.8 1
0
0.2
0.4
0.6
0.8
1
time
Fe
ed
flo
w r
ate
0 0.2 0.4 0.6 0.8 15
6
7
8
time
pH
Batchphase
Constantfeed
DOdesired
= 25
Linearfeed
Fig. 1. Experiment I - Current operation in manual mode with three phases (batchoperation, linearly-increasing feed, constant feed).
22

0.5 0.55 0.6 0.65 0.7 0.75 0.8 0.85 0.9 0.95 10.3
0.4
0.5
0.6
0.7
0.8
0.9
1
Viscosity
kL
A
Fig. 2. Relationship between kLa and viscosity during a fed-batch fermentationprocess. As expected, kLa decreases with increasing viscosity.
0 0.1 0.2 0.3 0.4 0.5 0.6 0.7 0.8 0.9 10
0.1
0.2
0.3
0.4
0.5
0.6
0.7
0.8
0.9
1
time
Vis
cosi
ty
Fig. 3. Evolution of viscosity during fed-batch operation. Measured value (- -) andcalculated value using eq. (24 (–)).
23

Fig. 4. Dissolved oxygen evolution during fed-batch operation - Data Set 1. Mea-sured (- -) and predicted (–) values as a function of time.
Fig. 5. Dissolved oxygen evolution during fed-batch operation - Data Set 2. Mea-sured (- -) and predicted (–) values as a function of time.
24

0 0.2 0.4 0.6 0.8 10
0.2
0.4
0.6
0.8
1
Bio
mass
time
xe
xa
xh
0 0.2 0.4 0.6 0.8 10
0.2
0.4
0.6
0.8
1
time
Subst
rate
0 0.2 0.4 0.6 0.8 10
0.2
0.4
0.6
0.8
1
time
Pro
duct
0 0.2 0.4 0.6 0.8 10
20
40
60
80
100
time
DO
0 0.2 0.4 0.6 0.8 10
0.2
0.4
0.6
0.8
1
time
k LA
0 0.2 0.4 0.6 0.8 10
0.2
0.4
0.6
0.8
1
time
η
0 0.2 0.4 0.6 0.8 10
0.2
0.4
0.6
0.8
1
time
Feed flo
w r
ate
0 0.2 0.4 0.6 0.8 10
0.2
0.4
0.6
0.8
1
time
Volu
me
Fig. 6. Simulated states, viscosity and transfer coefficient for an arbitrary feed flowrate.
25

ProcessControllerDO
sp F
DO, CER, OUR, V
Open-loopsoftware sensor
Optimizationx
Fig. 7. Computation of DOsp by model-based reoptimization.
u x1
x1
+ +
ax
2
(1)
(2)∫∫
Fig. 8. Illustration of direct (1) and integral (2) effects using a second-order numer-ical example.
x1 = ax
2 + ux
1,sp ux
1
+ -x
2x2 = uk
Fig. 9. Output control for the second-order numerical example.
x1 = ax
2 + u
ki
x1,sp u
x1
+ - + -x
2
x2,sp
x2 = uk
o
Fig. 10. Cascade control for the second-order numerical example.
ProcessPPIDO
sp FDO
+ - + -r
DOx
t
(rDO
xt)
sp
Fig. 11. Cascade control of dissolved oxygen. The oxygen consumption rDOxt isapproximated as β OUR+CER
V based on the measurements of OUR, CER and V.
26

0 0.2 0.4 0.6 0.8 10
0.2
0.4
0.6
0.8
1O
UR
time
0 0.2 0.4 0.6 0.8 1
0
20
40
60
80
100
DO
time
0 0.2 0.4 0.6 0.8 1
0
0.2
0.4
0.6
0.8
1
Fee
d flo
w r
ate
time
Batchphase
PIDcontrol
Cascadecontrol
DOsp
= 25
Fig. 12. Experiment II - Batch phase followed by PID control and cascade control.
27

0 0.2 0.4 0.6 0.8 10
0.2
0.4
0.6
0.8
1O
UR
time
0 0.2 0.4 0.6 0.8 1
0
20
40
60
80
100
time
DO
0 0.2 0.4 0.6 0.8 1
0
0.2
0.4
0.6
0.8
1
time
Fee
d flo
w r
ate
Batchphase
Cascadecontrol
DOsp
= 20
Fig. 13. Experiment III - Batch phase followed by cascade control. The DO setpoint,which has been obtained to optimize the bioreactor performance, is lower than inExperiment II.
28

0 0.2 0.4 0.6 0.8 10
0.2
0.4
0.6
0.8
1
OU
R
time
0 0.2 0.4 0.6 0.8 1
0
20
40
60
80
100
time
DO
0 0.2 0.4 0.6 0.8 1
0
0.2
0.4
0.6
0.8
1
time
Fee
d flo
w r
ate
Batchphase
Cascade control -Reoptimized
setpoint
Cascade control -Constant setpoint
DOsp
= 25
Fig. 14. Experiment IV - Batch phase followed by cascade control using first areoptimized and then a constant DO setpoint. Note that the curve correspondingto the setpoint is hidden behind the measurement curve. The perturbations in thethird phase are due to sensor failure and attempted manual setpoint changes.
29