oxygen declines and the shoaling of the hypoxic boundary...
TRANSCRIPT
Oxygen declines and the shoaling of the hypoxic boundary in the
California Current
Steven J. Bograd,1 Carmen G. Castro,2 Emanuele Di Lorenzo,3 Daniel M. Palacios,1,4
Helen Bailey,1 William Gilly,5 and Francisco P. Chavez6
Received 31 March 2008; accepted 30 April 2008; published 28 June 2008.
[1] We use hydrographic data from the CaliforniaCooperative Oceanic Fisheries Investigations program toexplore the spatial and temporal variability of dissolvedoxygen (DO) in the southern California Current System(CCS) over the period 1984–2006. Large declines in DO(up to 2.1 mmol/kg/y) have been observed throughout thedomain, with the largest relative DO declines occurringbelow the thermocline (mean decrease of 21% at 300 m).Linear trends were significant (p < 0.05) at the majority ofstations down to 500 m. The hypoxic boundary (�60 mmol/kg)has shoaled by up to 90 m within portions of the southernCCS. The observed trends are consistent with advection oflow-DO waters into the region, as well as decreased verticaloxygen transport following near-surface warming andincreased stratification. Expansion of the oxygenminimum layer could lead to cascading effects on benthicand pelagic ecosystems, including habitat compression andcommunity reorganization. Citation: Bograd, S. J., C. G.
Castro, E. Di Lorenzo, D. M. Palacios, H. Bailey, W. Gilly, and
F. P. Chavez (2008), Oxygen declines and the shoaling of the
hypoxic boundary in the California Current, Geophys. Res. Lett.,
35, L12607, doi:10.1029/2008GL034185.
1. Introduction
[2] Dissolved oxygen (DO) concentrations in the oceanare dependent on a number of physical and biologicalprocesses, including circulation, ventilation, air-sea ex-change, production and respiration. Climate-driven changesin these processes should therefore be reflected in oceanicDO observations [Deutsch et al., 2005]. In particular,models driven by increasing greenhouse gases predict adecline in midwater oceanic DO as a result of enhancedstratification and reduced ventilation [Sarmiento et al.,1998; Keeling and Garcia, 2002]. These changes will havea significant impact on the biological pump locally, whilechanges in large-scale circulation will act to spread andmodify the oxygen signal. Spreading of low-oxygen waters
could also greatly impact many higher trophic level species,depending on their oxic requirements. Although long timeseries of DO are relatively scarce, the few regions wherethey are available have seen a systematic decline [Emersonet al., 2004; Whitney et al., 2007]. Additional regionalobservations of long-term oxygen trends are critical toevaluating the causes and implications of climate-drivenoxygen changes.[3] Here we use historical hydrographic data from the
California Cooperative Oceanic Fisheries Investigations(CalCOFI) program [Bograd et al., 2003] to explore thespatial and temporal variability of DO in the CaliforniaCurrent, within and offshore of the Southern CaliforniaBight (SCB). The SCB is affected by a confluence of watermasses from the subarctic Pacific, via the California Cur-rent; from the northeastern tropical Pacific, via the Califor-nia Undercurrent [Lynn and Simpson, 1987]; and fromlateral shifts in the boundary of the North Pacific Subtrop-ical Gyre. The California Current is also a highly productiveregion, and has undergone significant changes in lowertrophic production on seasonal [Mackas et al., 2006],interannual [Bograd and Lynn, 2001], and decadal[McGowan et al., 2003] time scales related to large-scaleclimate forcing. The long historical time series of DOobservations within this eastern boundary current providea unique opportunity to investigate the relative role ofphysical and biological processes in controlling oxygen
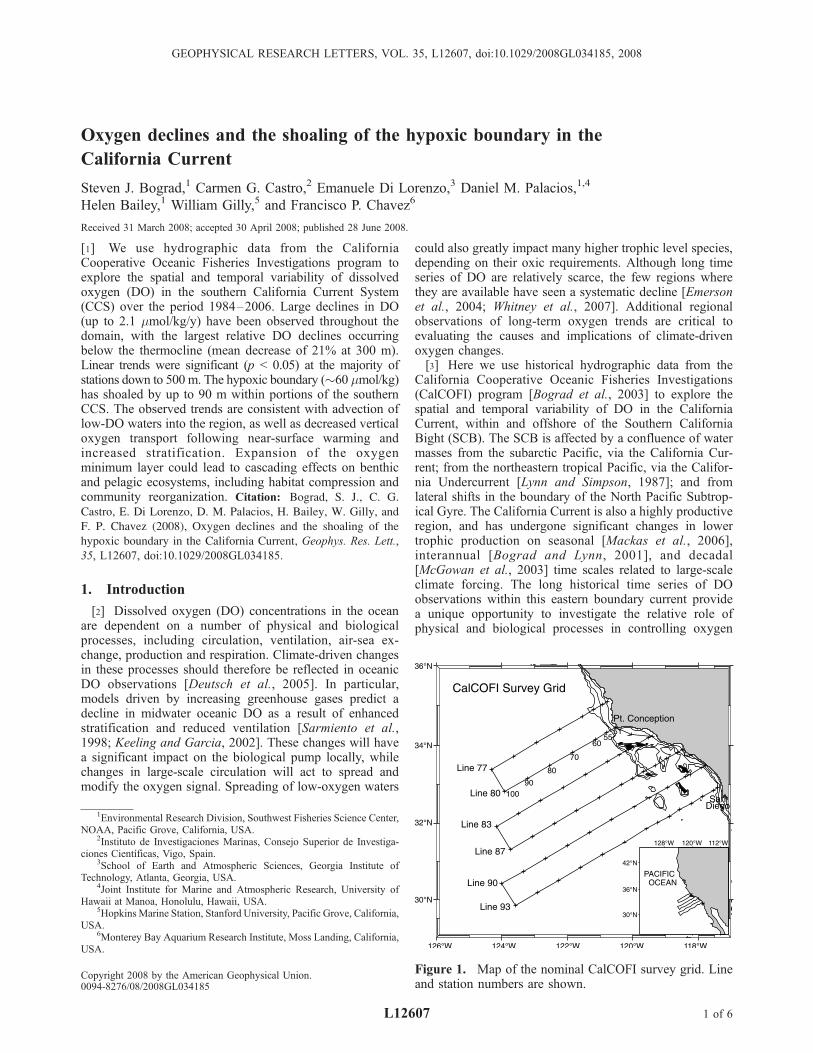
Figure 1. Map of the nominal CalCOFI survey grid. Lineand station numbers are shown.
GEOPHYSICAL RESEARCH LETTERS, VOL. 35, L12607, doi:10.1029/2008GL034185, 2008
1Environmental Research Division, Southwest Fisheries Science Center,NOAA, Pacific Grove, California, USA.
2Instituto de Investigaciones Marinas, Consejo Superior de Investiga-ciones Cientıficas, Vigo, Spain.
3School of Earth and Atmospheric Sciences, Georgia Institute ofTechnology, Atlanta, Georgia, USA.
4Joint Institute for Marine and Atmospheric Research, University ofHawaii at Manoa, Honolulu, Hawaii, USA.
5Hopkins Marine Station, Stanford University, Pacific Grove, California,USA.
6Monterey Bay Aquarium Research Institute, Moss Landing, California,USA.
Copyright 2008 by the American Geophysical Union.0094-8276/08/2008GL034185
L12607 1 of 6
changes, particularly in the context of a warming ocean[Keeling and Garcia, 2002].
2. Data and Methods
[4] The CalCOFI program has maintained quarterly sur-veys on a geographically fixed grid offshore of southern
California since 1984 (Figure 1). Although CalCOFI sam-pling has occurred since 1949, here we only consider thepost-1984 period, when implementation of a consistentsampling protocol limited systematic errors [ScrippsInstitution of Oceanography (SIO), 2007]. Routine Cal-COFI station occupations (on 66 standard stations;
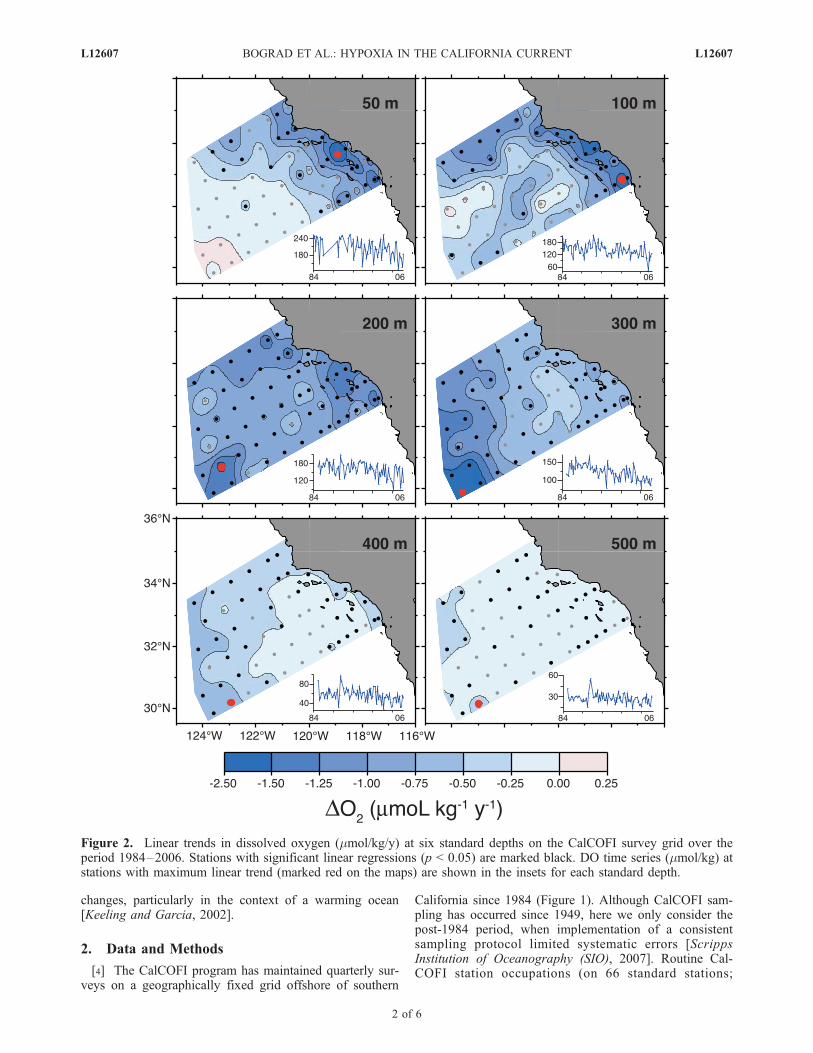
Figure 2. Linear trends in dissolved oxygen (mmol/kg/y) at six standard depths on the CalCOFI survey grid over theperiod 1984–2006. Stations with significant linear regressions (p < 0.05) are marked black. DO time series (mmol/kg) atstations with maximum linear trend (marked red on the maps) are shown in the insets for each standard depth.
L12607 BOGRAD ET AL.: HYPOXIA IN THE CALIFORNIA CURRENT L12607
2 of 6
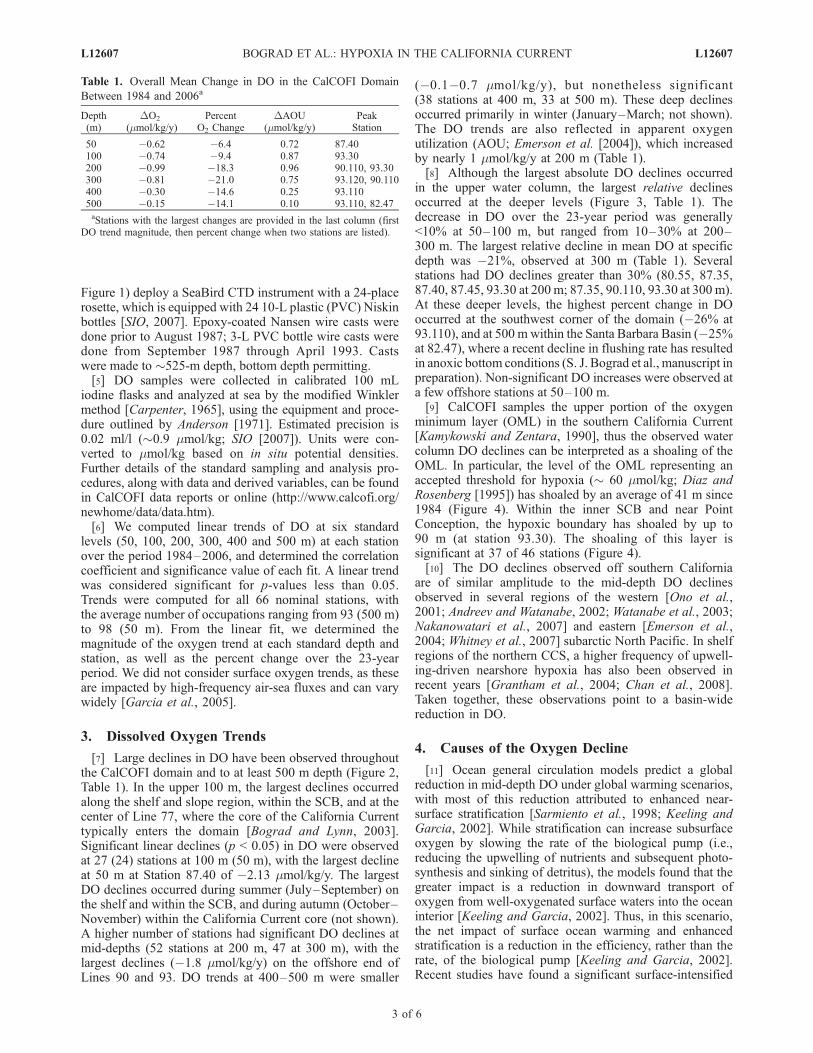
Figure 1) deploy a SeaBird CTD instrument with a 24-placerosette, which is equipped with 24 10-L plastic (PVC) Niskinbottles [SIO, 2007]. Epoxy-coated Nansen wire casts weredone prior to August 1987; 3-L PVC bottle wire casts weredone from September 1987 through April 1993. Castswere made to �525-m depth, bottom depth permitting.[5] DO samples were collected in calibrated 100 mL
iodine flasks and analyzed at sea by the modified Winklermethod [Carpenter, 1965], using the equipment and proce-dure outlined by Anderson [1971]. Estimated precision is0.02 ml/l (�0.9 mmol/kg; SIO [2007]). Units were con-verted to mmol/kg based on in situ potential densities.Further details of the standard sampling and analysis pro-cedures, along with data and derived variables, can be foundin CalCOFI data reports or online (http://www.calcofi.org/newhome/data/data.htm).[6] We computed linear trends of DO at six standard
levels (50, 100, 200, 300, 400 and 500 m) at each stationover the period 1984–2006, and determined the correlationcoefficient and significance value of each fit. A linear trendwas considered significant for p-values less than 0.05.Trends were computed for all 66 nominal stations, withthe average number of occupations ranging from 93 (500 m)to 98 (50 m). From the linear fit, we determined themagnitude of the oxygen trend at each standard depth andstation, as well as the percent change over the 23-yearperiod. We did not consider surface oxygen trends, as theseare impacted by high-frequency air-sea fluxes and can varywidely [Garcia et al., 2005].
3. Dissolved Oxygen Trends
[7] Large declines in DO have been observed throughoutthe CalCOFI domain and to at least 500 m depth (Figure 2,Table 1). In the upper 100 m, the largest declines occurredalong the shelf and slope region, within the SCB, and at thecenter of Line 77, where the core of the California Currenttypically enters the domain [Bograd and Lynn, 2003].Significant linear declines (p < 0.05) in DO were observedat 27 (24) stations at 100 m (50 m), with the largest declineat 50 m at Station 87.40 of �2.13 mmol/kg/y. The largestDO declines occurred during summer (July–September) onthe shelf and within the SCB, and during autumn (October–November) within the California Current core (not shown).A higher number of stations had significant DO declines atmid-depths (52 stations at 200 m, 47 at 300 m), with thelargest declines (�1.8 mmol/kg/y) on the offshore end ofLines 90 and 93. DO trends at 400–500 m were smaller
(�0.1�0.7 mmol/kg/y), but nonetheless significant(38 stations at 400 m, 33 at 500 m). These deep declinesoccurred primarily in winter (January–March; not shown).The DO trends are also reflected in apparent oxygenutilization (AOU; Emerson et al. [2004]), which increasedby nearly 1 mmol/kg/y at 200 m (Table 1).[8] Although the largest absolute DO declines occurred
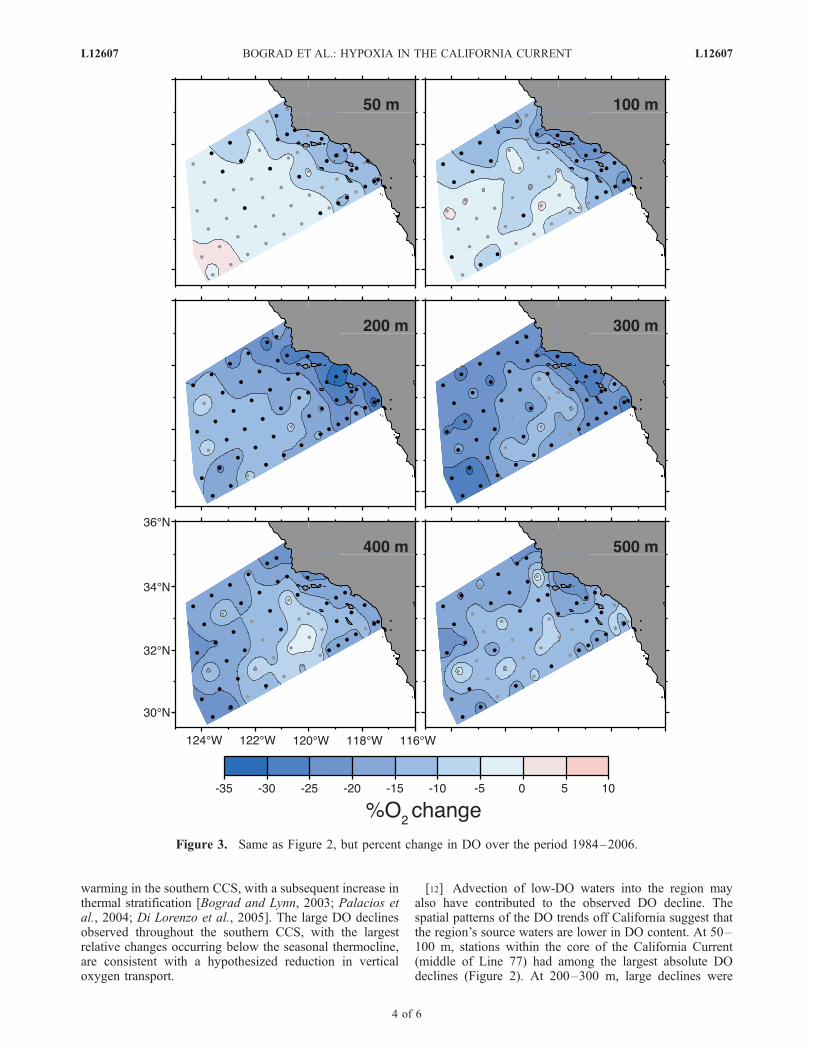
in the upper water column, the largest relative declinesoccurred at the deeper levels (Figure 3, Table 1). Thedecrease in DO over the 23-year period was generally<10% at 50–100 m, but ranged from 10–30% at 200–300 m. The largest relative decline in mean DO at specificdepth was �21%, observed at 300 m (Table 1). Severalstations had DO declines greater than 30% (80.55, 87.35,87.40, 87.45, 93.30 at 200 m; 87.35, 90.110, 93.30 at 300 m).At these deeper levels, the highest percent change in DOoccurred at the southwest corner of the domain (�26% at93.110), and at 500 mwithin the Santa Barbara Basin (�25%at 82.47), where a recent decline in flushing rate has resultedin anoxic bottom conditions (S. J. Bograd et al., manuscript inpreparation). Non-significant DO increases were observed ata few offshore stations at 50–100 m.[9] CalCOFI samples the upper portion of the oxygen
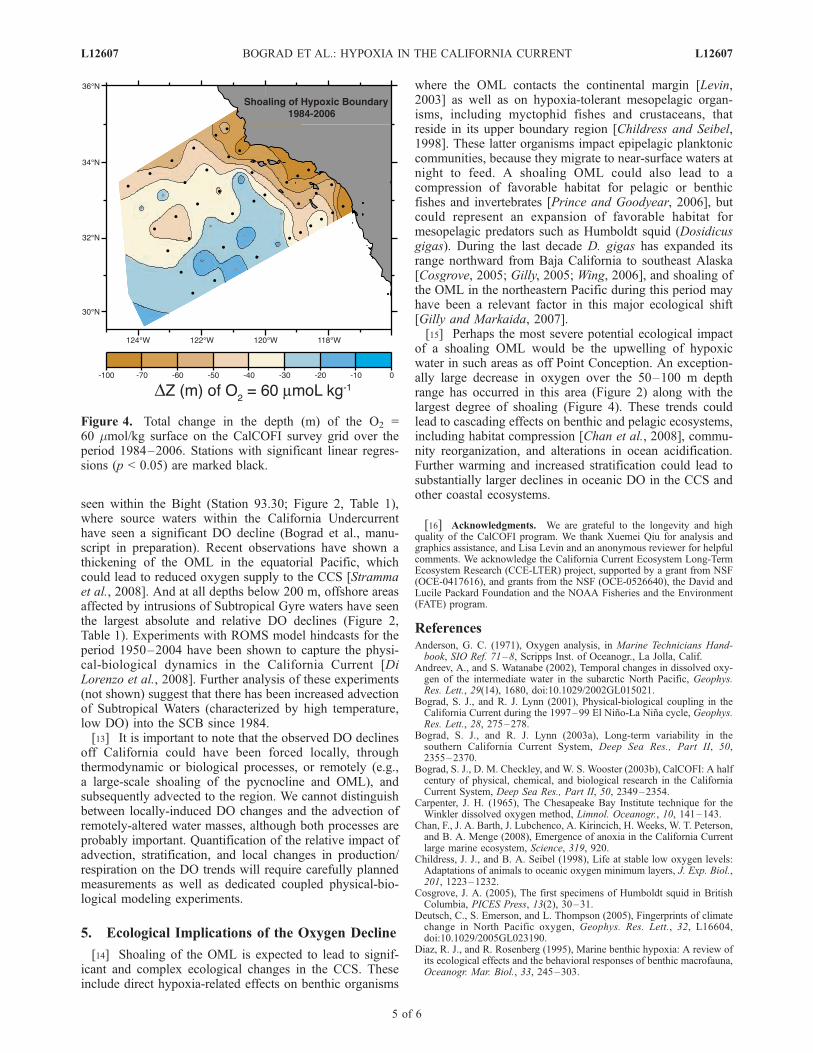
minimum layer (OML) in the southern California Current[Kamykowski and Zentara, 1990], thus the observed watercolumn DO declines can be interpreted as a shoaling of theOML. In particular, the level of the OML representing anaccepted threshold for hypoxia (� 60 mmol/kg; Diaz andRosenberg [1995]) has shoaled by an average of 41 m since1984 (Figure 4). Within the inner SCB and near PointConception, the hypoxic boundary has shoaled by up to90 m (at station 93.30). The shoaling of this layer issignificant at 37 of 46 stations (Figure 4).[10] The DO declines observed off southern California
are of similar amplitude to the mid-depth DO declinesobserved in several regions of the western [Ono et al.,2001; Andreev and Watanabe, 2002; Watanabe et al., 2003;Nakanowatari et al., 2007] and eastern [Emerson et al.,2004; Whitney et al., 2007] subarctic North Pacific. In shelfregions of the northern CCS, a higher frequency of upwell-ing-driven nearshore hypoxia has also been observed inrecent years [Grantham et al., 2004; Chan et al., 2008].Taken together, these observations point to a basin-widereduction in DO.
4. Causes of the Oxygen Decline
[11] Ocean general circulation models predict a globalreduction in mid-depth DO under global warming scenarios,with most of this reduction attributed to enhanced near-surface stratification [Sarmiento et al., 1998; Keeling andGarcia, 2002]. While stratification can increase subsurfaceoxygen by slowing the rate of the biological pump (i.e.,reducing the upwelling of nutrients and subsequent photo-synthesis and sinking of detritus), the models found that thegreater impact is a reduction in downward transport ofoxygen from well-oxygenated surface waters into the oceaninterior [Keeling and Garcia, 2002]. Thus, in this scenario,the net impact of surface ocean warming and enhancedstratification is a reduction in the efficiency, rather than therate, of the biological pump [Keeling and Garcia, 2002].Recent studies have found a significant surface-intensified
Table 1. Overall Mean Change in DO in the CalCOFI Domain
Between 1984 and 2006a
Depth(m)
DO2
(mmol/kg/y)Percent
O2 ChangeDAOU
(mmol/kg/y)PeakStation
50 �0.62 �6.4 0.72 87.40100 �0.74 �9.4 0.87 93.30200 �0.99 �18.3 0.96 90.110, 93.30300 �0.81 �21.0 0.75 93.120, 90.110400 �0.30 �14.6 0.25 93.110500 �0.15 �14.1 0.10 93.110, 82.47aStations with the largest changes are provided in the last column (first
DO trend magnitude, then percent change when two stations are listed).
L12607 BOGRAD ET AL.: HYPOXIA IN THE CALIFORNIA CURRENT L12607
3 of 6
warming in the southern CCS, with a subsequent increase inthermal stratification [Bograd and Lynn, 2003; Palacios etal., 2004; Di Lorenzo et al., 2005]. The large DO declinesobserved throughout the southern CCS, with the largestrelative changes occurring below the seasonal thermocline,are consistent with a hypothesized reduction in verticaloxygen transport.
[12] Advection of low-DO waters into the region mayalso have contributed to the observed DO decline. Thespatial patterns of the DO trends off California suggest thatthe region’s source waters are lower in DO content. At 50–100 m, stations within the core of the California Current(middle of Line 77) had among the largest absolute DOdeclines (Figure 2). At 200–300 m, large declines were
Figure 3. Same as Figure 2, but percent change in DO over the period 1984–2006.
L12607 BOGRAD ET AL.: HYPOXIA IN THE CALIFORNIA CURRENT L12607
4 of 6
seen within the Bight (Station 93.30; Figure 2, Table 1),where source waters within the California Undercurrenthave seen a significant DO decline (Bograd et al., manu-script in preparation). Recent observations have shown athickening of the OML in the equatorial Pacific, whichcould lead to reduced oxygen supply to the CCS [Strammaet al., 2008]. And at all depths below 200 m, offshore areasaffected by intrusions of Subtropical Gyre waters have seenthe largest absolute and relative DO declines (Figure 2,Table 1). Experiments with ROMS model hindcasts for theperiod 1950–2004 have been shown to capture the physi-cal-biological dynamics in the California Current [DiLorenzo et al., 2008]. Further analysis of these experiments(not shown) suggest that there has been increased advectionof Subtropical Waters (characterized by high temperature,low DO) into the SCB since 1984.[13] It is important to note that the observed DO declines
off California could have been forced locally, throughthermodynamic or biological processes, or remotely (e.g.,a large-scale shoaling of the pycnocline and OML), andsubsequently advected to the region. We cannot distinguishbetween locally-induced DO changes and the advection ofremotely-altered water masses, although both processes areprobably important. Quantification of the relative impact ofadvection, stratification, and local changes in production/respiration on the DO trends will require carefully plannedmeasurements as well as dedicated coupled physical-bio-logical modeling experiments.
5. Ecological Implications of the Oxygen Decline
[14] Shoaling of the OML is expected to lead to signif-icant and complex ecological changes in the CCS. Theseinclude direct hypoxia-related effects on benthic organisms
where the OML contacts the continental margin [Levin,2003] as well as on hypoxia-tolerant mesopelagic organ-isms, including myctophid fishes and crustaceans, thatreside in its upper boundary region [Childress and Seibel,1998]. These latter organisms impact epipelagic planktoniccommunities, because they migrate to near-surface waters atnight to feed. A shoaling OML could also lead to acompression of favorable habitat for pelagic or benthicfishes and invertebrates [Prince and Goodyear, 2006], butcould represent an expansion of favorable habitat formesopelagic predators such as Humboldt squid (Dosidicusgigas). During the last decade D. gigas has expanded itsrange northward from Baja California to southeast Alaska[Cosgrove, 2005; Gilly, 2005; Wing, 2006], and shoaling ofthe OML in the northeastern Pacific during this period mayhave been a relevant factor in this major ecological shift[Gilly and Markaida, 2007].[15] Perhaps the most severe potential ecological impact
of a shoaling OML would be the upwelling of hypoxicwater in such areas as off Point Conception. An exception-ally large decrease in oxygen over the 50–100 m depthrange has occurred in this area (Figure 2) along with thelargest degree of shoaling (Figure 4). These trends couldlead to cascading effects on benthic and pelagic ecosystems,including habitat compression [Chan et al., 2008], commu-nity reorganization, and alterations in ocean acidification.Further warming and increased stratification could lead tosubstantially larger declines in oceanic DO in the CCS andother coastal ecosystems.
[16] Acknowledgments. We are grateful to the longevity and highquality of the CalCOFI program. We thank Xuemei Qiu for analysis andgraphics assistance, and Lisa Levin and an anonymous reviewer for helpfulcomments. We acknowledge the California Current Ecosystem Long-TermEcosystem Research (CCE-LTER) project, supported by a grant from NSF(OCE-0417616), and grants from the NSF (OCE-0526640), the David andLucile Packard Foundation and the NOAA Fisheries and the Environment(FATE) program.
ReferencesAnderson, G. C. (1971), Oxygen analysis, in Marine Technicians Hand-book, SIO Ref. 71–8, Scripps Inst. of Oceanogr., La Jolla, Calif.
Andreev, A., and S. Watanabe (2002), Temporal changes in dissolved oxy-gen of the intermediate water in the subarctic North Pacific, Geophys.Res. Lett., 29(14), 1680, doi:10.1029/2002GL015021.
Bograd, S. J., and R. J. Lynn (2001), Physical-biological coupling in theCalifornia Current during the 1997–99 El Nino-La Nina cycle, Geophys.Res. Lett., 28, 275–278.
Bograd, S. J., and R. J. Lynn (2003a), Long-term variability in thesouthern California Current System, Deep Sea Res., Part II, 50,2355–2370.
Bograd, S. J., D. M. Checkley, and W. S. Wooster (2003b), CalCOFI: A halfcentury of physical, chemical, and biological research in the CaliforniaCurrent System, Deep Sea Res., Part II, 50, 2349–2354.
Carpenter, J. H. (1965), The Chesapeake Bay Institute technique for theWinkler dissolved oxygen method, Limnol. Oceanogr., 10, 141–143.
Chan, F., J. A. Barth, J. Lubchenco, A. Kirincich, H. Weeks, W. T. Peterson,and B. A. Menge (2008), Emergence of anoxia in the California Currentlarge marine ecosystem, Science, 319, 920.
Childress, J. J., and B. A. Seibel (1998), Life at stable low oxygen levels:Adaptations of animals to oceanic oxygen minimum layers, J. Exp. Biol.,201, 1223–1232.
Cosgrove, J. A. (2005), The first specimens of Humboldt squid in BritishColumbia, PICES Press, 13(2), 30–31.
Deutsch, C., S. Emerson, and L. Thompson (2005), Fingerprints of climatechange in North Pacific oxygen, Geophys. Res. Lett., 32, L16604,doi:10.1029/2005GL023190.
Diaz, R. J., and R. Rosenberg (1995), Marine benthic hypoxia: A review ofits ecological effects and the behavioral responses of benthic macrofauna,Oceanogr. Mar. Biol., 33, 245–303.
Figure 4. Total change in the depth (m) of the O2 =60 mmol/kg surface on the CalCOFI survey grid over theperiod 1984–2006. Stations with significant linear regres-sions (p < 0.05) are marked black.
L12607 BOGRAD ET AL.: HYPOXIA IN THE CALIFORNIA CURRENT L12607
5 of 6
Di Lorenzo, E., A. J. Miller, N. Schneider, and J. C. McWilliams (2005),The warming of the California Current System: Dynamics and ecosystemimplications, J. Phys. Oceanogr., 35, 336–362.
Di Lorenzo, E., et al. (2008), North Pacific Gyre Oscillation links oceanclimate and ecosystem change, Geophys. Res. Lett., 35, L08607,doi:10.1029/2007GL032838.
Emerson, S., Y. W. Watanabe, T. Ono, and S. Mecking (2004), Temporaltrends in apparent oxygen utilization in the upper pycnocline of the NorthPacific: 1980–2000, J. Oceanogr., 60, 139–147.
Garcia, H. E., T. P. Boyer, S. Levitus, R. A. Locarnini, and J. Antonov(2005), On the variability of dissolved oxygen and apparent oxygenutilization content for the upper world ocean: 1955 to 1998, Geophys.Res. Lett., 32, L09604, doi:10.1029/2004GL022286.
Gilly, W. F. (2005), Spreading and stranding of Humboldt squid, in Eco-system Observations for the Monterey Bay National Marine Sanctuary,report, pp. 20–22, Monterey Bay Natl. Mar. Sanctuary, Monterey, Calif.
Gilly, W. F., and U. Markaida (2007), Perspectives on Dosidicus gigas in achanging world, in The Role of Squid in Open Ocean Ecosystems, editedby R. J. Olson and J. W. Young, Rep. 24, pp. 81–90, Global OceanEcosyst. Dyn., Honolulu, Hawaii.
Grantham, B. A., F. Chan, K. J. Mielsen, D. S. Fox, J. A. Barth, A. Huyer,J. Lubchenco, and B. A. Menge (2004), Upwelling-driven nearshorehypoxia signals ecosystem and oceanographic changes in the northeastPacific, Nature, 429, 749–754.
Kamykowski, D. Z., and S. J. Zentara (1990), Hypoxia in the world oceanas recorded in the historical data set, Deep Sea Res., Part A, 37, 1861–1874.
Keeling, R. F., and H. E. Garcia (2002), The change in oceanic O2 inven-tory associated with recent global warming, Proc. Natl. Acad. Sci. U. S.A., 99, 7848–7853.
Levin, L. A. (2003), Oxygen minimum zone benthos: Adaptation and com-munity response to hypoxia, Oceanogr. Mar. Biol., 41, 1–45.
Lynn, R. J., and J. J. Simpson (1987), The California Current System: Theseasonal variability of its physical characteristics, J. Geophys. Res.,92(C12), 12,947–12,966.
Mackas, D. L., W. T. Peterson, M. D. Ohman, and B. E. Lavaniegos (2006),Zooplankton anomalies in the California Current System before and dur-ing the warm ocean conditions of 2005, Geophys. Res. Lett., 33, L22S07,doi:10.1029/2006GL027930.
McGowan, J. A., S. J. Bograd, R. J. Lynn, and A. J. Miller (2003), Thebiological response to the 1977 regime shift in the California Current,Deep Sea Res., Part II, 50, 2582–3567.
Nakanowatari, T., K. I. Ohshima, and M. Wakatsuchi (2007), Warming andoxygen decrease of intermediate water in the northwestern North Pacific,originating from the Sea of Okhotsk, 1955–2004, Geophys. Res. Lett.,34, L04602, doi:10.1029/2006GL028243.
Ono, T., T. Midorikawa, Y. W. Watanabe, K. Tadokoro, and T. Saino(2001), Temporal increases of phosphate and apparent oxygen utilizationin the subsurface waters of the western subarctic Pacific from 1968 to1998, Geophys. Res. Lett., 28, 3285–3288.
Palacios, D. M., S. J. Bograd, R. Mendelssohn, and F. B. Schwing (2004),Long-term and seasonal trends in stratification in the California Current,1950–1993, J. Geophys. Res., 109, C10016, doi:10.1029/2004JC002380.
Prince, E. D., and C. P. Goodyear (2006), Hypoxia-based habitat compres-sion of tropical pelagic fishes, Fish. Oceanogr., 15, 451–464.
Sarmiento, J. L., T. M. C. Hughes, R. J. Stouffer, and S. Manabe (1998),Simulated response of the ocean carbon cycle to the anthropogenic cli-mate warming, Nature, 393, 245–248.
Scripps Institution of Oceanography (SIO) (2007), Data report, CalCOFIcruise 0501, CC Ref. 07-03, La Jolla, Calif.
Stramma, L., G. C. Johnson, J. Sprintall, and V.Mohrholz (2008), Expandingoxygen-minimum zones in the tropical oceans, Science, 320, 655–658.
Watanabe, Y. W., M. Wakita, N. Maeda, T. Ono, and T. Gamo (2003),Synchronous bidecadal periodic changes of oxygen, phosphate and tem-perature between the Japan Sea deep water and the North Pacific inter-mediate water, Geophys. Res. Lett., 30(24), 2273, doi:10.1029/2003GL018338.
Whitney, F. A., H. J. Freeland, and M. Robert (2007), Persistently decliningoxygen levels in the interior waters of the eastern subarctic Pacific, Prog.Oceanogr., 75, 179–199.
Wing, B. (2006), Unusual observations of fish and invertebrates from theGulf of Alaska, 2004–05, PICES Press, 14(2), 26–28.
�����������������������H. Bailey, S. J. Bograd, and D. M. Palacios, Environmental Research
Division, Southwest Fisheries Science Center, NOAA, 1352 LighthouseAvenue, Pacific Grove, CA 93950-2097, USA. ([email protected])C. G. Castro, Instituto de Investigaciones Marinas, Consejo Superior de
Investigaciones Cientıficas, Vigo, E-36208, Spain.F. P. Chavez, Monterey Bay Aquarium Research Institute, Moss Landing,
CA 95039, USA.E. Di Lorenzo, School of Earth and Atmospheric Sciences, Georgia
Institute of Technology, Atlanta, GA 30332, USA.W. Gilly, Hopkins Marine Station, Stanford University, Pacific Grove,
CA 93950, USA.
L12607 BOGRAD ET AL.: HYPOXIA IN THE CALIFORNIA CURRENT L12607
6 of 6