oxygen partial pressure and oxygen concentration ... · oxygen partial pressure and oxygen...
TRANSCRIPT

1 JOURNAL OF ASTM INTERNATIONAL
Journal of ASTM International, Month, 2016, Vol. X No. X PAPER ID: XXXXX
Available online at www.astm.org Susana A. Harper1, Alfredo Juarez2, Horacio Perez III3, David B. Hirsch4, Harold D. Beeson5 Oxygen Partial Pressure and Oxygen Concentration Flammability: Can They Be Correlated?
ABSTRACT: NASA possesses a large quantity of flammability data performed in
ISS airlock (30% Oxygen 526mmHg) and ISS cabin (24.1% Oxygen 760 mmHg)
conditions. As new programs develop, other oxygen and pressure conditions emerge.
In an effort to apply existing data, the question arises: Do equivalent oxygen partial
pressures perform similarly with respect to flammability? This paper evaluates how
material flammability performance is impacted from both the Maximum Oxygen
Concentration (MOC) and Maximum Total Pressures (MTP) perspectives. From
these studies, oxygen partial pressures can be compared for both the MOC and MTP
methods to determine the role of partial pressure in material flammability. This
evaluation also assesses the influence of other variables on flammability
performance. The findings presented in this paper suggest flammability is more
dependent on oxygen concentration than equivalent partial pressure.
KEYWORDS: partial pressure, gaseous oxygen, Maximum Oxygen Concentration (MOC),
normoxic, flammability, elevated oxygen, enriched oxygen, NASA STD 6001 Test 1,
propagation rate
1 Standard Test Project Manager, Materials ad Component Laboratories Office, NASA White Sands Test Facility,
Las Cruces New Mexico 2 Standard Test Lead Flammability Test Engineer, NASA Test and Evaluation Contract, NASA White Sands Test
Facility, Las Cruces New Mexico 3 Flammability Project Manager, Lockheed Martin, NASA Johnson Space Center, Houston, Texas 4 Standard Test Flammability Consultant, NASA White Sands Test Facility, Las Cruces New Mexico 5 Materials and Component Testing Laboratories Office Chief , NASA White Sands Test Facility, Las Cruces New
Mexico
https://ntrs.nasa.gov/search.jsp?R=20160001047 2018-07-27T02:27:17+00:00Z

2 JOURNAL OF ASTM INTERNATIONAL
Background To safely and successfully operate in enriched oxygen conditions, understanding material flammability is
critical for NASA, commercial space flight companies, and industry alike. Previous space programs have
acquired significant data in the Space Transportation System (STS) environment of 30% O2 at 70.3 kPa
(10.2 psia). This same environment is also currently being evaluated for the Crew Exploration Vehicle
(CEV). A significant amount of additional flammability data exists at the International Space Station
(ISS) worst-case cabin conditions of 24.1% O2 at 191.4 kPa (14.7 psia). In a desire to leverage existing
data, the question arises: Do materials perform similarly with respect to flammability as long as the partial
pressure of oxygen remains equivalent? This question is not only relevant to NASA and space programs.
In the oxygen related industry, the ability to apply existing flammability data to various manufacturing
and operating conditions would be beneficial. It is important that the question be thoroughly answered, as
the ability to apply existing data to alternate conditions could save significant resources both financially
and with respect to time and schedule. The purpose of this paper is to compile relevant data to examine
the dependence of flammability on partial pressure of oxygen and oxygen concentration.
Normoxic Conditions and Partial Pressure Normoxic conditions maintain an equivalent partial pressure of oxygen in the atmosphere as would be
found in that of air at sea level. This level of oxygen is important for human function, and therefore space
vehicles are designed to provide normoxic or close to normoxic conditions.
The concept of partial pressure depends on the ideal gas law (Eq. (1)):
PV = nRT (1)
Where P = pressure; V = volume; n = moles of a molecule; R = ideal gas constant; and T= Temperature. Assuming the ideal gas law, the partial pressure of oxygen pO2 is defined as the pressure that would be
exerted by nO2 moles of O2 alone in the same total volume V at the same temperature T (Eq. (2)).

3 JOURNAL OF ASTM INTERNATIONAL
pO2 V = nO2 RT (2)
Dividing the second equation by the first yields that the mole fraction of a given component in a mixture
times the total pressure will give you the component’s partial pressure (Eq. (3) and Eq. (4)).
nO2/n = pO2/P (3)
(nO2/n) * P = pO2 (4)
A similar calculation can be done for the pure component volume of a mixture. In an ideal gas mixture, a
component’s percentage by volume is equal to its mole fraction (Eq. (5) and Eq. (6)).
nO2/n = vO2/V (5)
(nO2/n)*V = vO2 (6)
Therefore, referring to a gas mixture by its volume percent (e.g., 21% volume O2) is the same as referring
to it by its mole percent (21 mole % O2). Assuming an ideal gas behavior, partial pressure can easily be
calculated from volume fraction (Eq. (7) and Eq. (8)) [1].
pO2 = (vO2/V)* P (7)
and conversely (vO2/V) = pO2/P (8)
Using this calculation, Table 1 outlines examples of normoxic environmental conditions that maintain
equivalent partial pressures across a range of conditions.
The STS and the currently in-design CEV have resided at the 30% O2 at 70.3 kPa (10.2 psia) point of the
normoxic curve. The ISS aims to operate at the 21% O2, 101.4 kPa (14.7 psia) point of the curve.
Nonetheless, it has obtained much of its data at 24.1% O2, 101.4 kPa (14.7 psia) conditions due to
sinusoidal fluctuations of oxygen with a mean of 21% O2 seen on the ISS. Future long duration habitation
modules might select to operate at lower pressure normoxic conditions to minimize time loss and health
risk associated with frequent depressurizations when frequently exiting habitats. In addition, low pressure
environments also provide structural design benefits for long-duration habitats. Use of Extravehicular
Activity (EVA) suits is another scenario in which a reduced pressure environment is desired. Off-nominal
4 JOURNAL OF ASTM INTERNATIONAL
situations can also arise in which lower pressure/higher oxygen concentration environments need to be
considered. Some examples may include vehicle leak emergency scenarios or decompression times before
an EVA. In all these cases, understanding how existing flammability data can be correlated to other
environments would prove useful. In doing so, care should be taken, as the relationships between material
flammability with oxygen concentration and partial pressure are complex. These relationships will be
examined in the following sections.
Test Method and Environmental Conditions: NASA STD-6001 Test 1 Maximum Oxygen
Concentration Self Extinguishment Thresholds
The test method used in this paper to examine flammability was the NASA STD- 6001 Upward Flame
Propagation Flammability Test 1 [2]. Materials slated for use in space vehicles are required to undergo
this test to evaluate a material’s ability to self-extinguish in less than 15 cm (6 in.) as well as to establish
its propensity to propagate to nearby materials. Samples (12 in. long and 2.5 in. wide) are subjected to an
overwhelming ignition source at their anticipated use conditions. After ignition, materials are evaluated to
determine if they self-extinguish in less than 15 cm (6 in.), indicating that they are not likely to create
sustained fires at the given test conditions. Also, paper is placed below the test apparatus during the test to
evaluate if any dripping material will ignite nearby materials, thereby to evaluate a material’s propagation
risk. The Maximum Oxygen Concentration (MOC) threshold, as the name suggests, establishes the MOC
for which a material will still pass the test pass/fail criteria. This threshold value can be used successfully
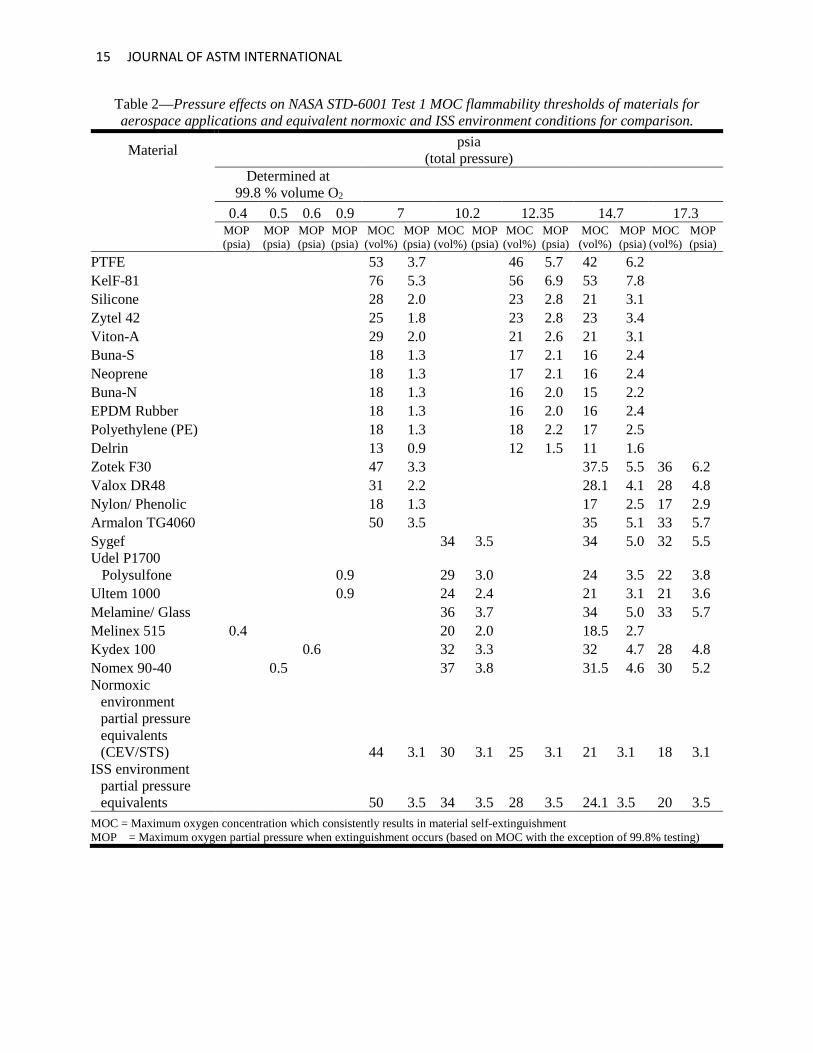
to compare materials performance across various conditions [3, 4]. The MOCs for various aerospace
materials have been previously determined across a large range of pressures (2.8–119.3 kPa
(0.4–17.3 psia)) [5, 6, 7]. Much of these preexisting data have been compiled in Table 2 to allow a
comprehensive analysis with respect to the effect of oxygen concentration, total pressure, and partial
pressure on overall self-extinguishing limits. From MOC limits, the corresponding oxygen partial
pressure limits were also calculated as Maximum Oxygen Partial pressure (MOP). The MOPs presented
at 6.2 kPa (0.9 psia) or below, however, were determined experimentally in a 99.8% oxygen environment

5 JOURNAL OF ASTM INTERNATIONAL
where pressure was increased until the threshold limit was obtained at which materials still passed
NASA-STD-6001 burn length criteria [7].
Oxygen Concentration, Total Pressure, and Partial Pressure Effects Findings Oxygen Concentration and Total Pressure Findings Maximum oxygen concentration data from Table 2 were plotted against total pressure in the
48.3–119.3 kPa (7–17.3 psia) range in Figure 1. Pressure data below 7 kPa (1 psia) were not plotted in
Figure 1, as only five of the 22 materials examined had data in this lower range. This plot can be used to
observe general effects of total pressure on MOC. Each material data set was fit with the equation that
provided the highest regression analysis coefficient of determination (R2). In the 48.3–119.3 kPa
(7–17.3 psia) pressure range, most materials were best described by either linear or power curve models.
Also, normoxic equivalent oxygen concentrations, all equaling a partial pressure of 21.3 kPa (3.09 psia) at
their respective set of conditions, were plotted with red stars and corresponding curve. Normoxic data
provide a comparison to the trends seen for the experimental flammability data for the various aerospace
materials. Seventeen of the 22 materials examined (77% of materials) exhibited very little dependence on
total pressure. For these 17 materials in the central pressure range of 48.3–119.3 kPa (7–17.3 psia), MOC
remained relatively constant despite pressure variations. The general slope of the normoxic equivalent
oxygen concentrations follows a steep decline while the general slopes of the tested materials’ MOCs
follow significantly shallower paths.
It is noteworthy that this contrasting trend from partial pressure dependent normoxic conditions to the
experimental material data suggests that propagation and self-extinguishment flammability is not driven
by the partial pressure of oxygen available. Oxygen concentration appears to be the major driver in
propagation and self-extinguishment behavior regardless of total pressure or partial pressure of oxygen.

6 JOURNAL OF ASTM INTERNATIONAL
Other relevant research reiterates these conclusions. These include flame spread rate testing that was
performed along normoxic conditions from 18% to 100% O2 by Olson and Miller [8]. In this work,
regardless of test variable modifications, the flame spread rate increased with higher oxygen
concentrations even though partial pressure of oxygen remained constant [8]. In addition, authors Yang,
Hamins, and Donneley [9] found that burn rates of poly(methyl methacrylate) (PMMA) spheres increased
significantly as O2 % volume was increased from 19.9% to 30% while little effect was observed with
increased pressures from 50.0–150 kPa (7.25–21.75 psia) .
Though not fully modeling normoxic partial pressure trends, a few of the materials tested for this study
(Kel-F®1, polytetrafluoroethene (PTFE), Zotek®2 F30, Armalon TG4060, and Nomex®3) exhibited higher
dependencies on total pressure. A possible theory to explain the oxygen concentration and pressure
dependence difference between these materials will be discussed in a later section.
In Figure 2, MOC self-extinguishment thresholds were again plotted against pressure with the inclusion
of threshold pressures obtained at 99.8 volume% oxygen for select materials [7]. These material data sets
with larger data ranges were again fit with equation models that provided the highest regression analysis
coefficient of determination (R2). Power equation models fit all trends very precisely. It is believed that if
additional high oxygen concentration data are obtained for other materials, they will likely show similar
power trends. Flammability trends found here echo trends seen in previous ignition studies by authors
Nakamura and Aoki [10, 11, 12], with the exception that a non-ignition zone is not identified in the
current study. From this larger range view of flammability performance, it was again shown that total
pressure had a minimal effect on propagation and self-extinguishment above approximately 41 kPa
(6 psia). Nonetheless, below 41 kPa (6 psia) the pressure effects became highly influential. It has been
proposed that different ignition models govern ignition mechanics in these two zones, with the pure 1 Kel-F® is a registered trademark of M.W. Kellogg Company, Jersey City, New Jersey. 2 Zotek® is a registered trademark of Zotefoams PLC, Surry, U.K. 3 Nomex® s a registered trademark of E.I. Du Pont de Nemours and Company, Wilmington, DE.

7 JOURNAL OF ASTM INTERNATIONAL
diffusion model governing in the 48.3–119.3 kPa (7–17.3 psia) range and the ignition in stagnation-point
flow field governing in the < 41 kPa (< 6 psia) range [13]. These proposed differing models for middle
and low pressure ignition and propagation would be consistent with the findings drawn from Figure 2 and
the corresponding data set.
Oxygen Partial Pressure Findings
From MOC testing, equivalent MOP pressures were calculated (presented in Table 2). The MOP
represents the threshold value for how much oxygen is necessary to propagate a flame yet self-extinguish
within the NASA-STD-6001 15 cm (6 in.) burn length criterion. MOP data were plotted against total
pressure in Figure 3 to examine partial pressure effects directly. The clearest observation is that the
required partial pressure of oxygen necessary to sustain propagation to the 15 cm (6-in.) criterion
decreases with decreasing total pressure for all 22 materials examined. Therefore, despite having equal
partial pressures, a lower pressure/higher oxygen concentration environment would pose a greater
flammability risk. These findings are consistent with partial pressure ignition data trends observed by
authors Nakamura and Aoki in which partial pressure of oxygen required for ignition of cellulose material
decreased as total pressure was decreased [10, 11, 12].
Equations were fit to data for materials possessing full-scale pressure data. Power equation models
described the data excellently with all coefficient of determination (R2) calculated at higher than
0.99 values. It is believed that if additional data are obtained for other materials in the low pressure/high
oxygen concentration ranges, they will likely show similar power trends.
With respect to how to apply existing data to alternate environmental conditions, the conclusion drawn
from these data is that lower oxygen concentration/higher pressure data (e.g., 21% O2, 101.4 kPa
(14.7 psia)) cannot be conservatively applied to higher oxygen concentration/lower pressure environments

8 JOURNAL OF ASTM INTERNATIONAL
(e.g., 30%, 70.3 kPa (10.2 psia)) despite equivalent partial pressures. Nonetheless, higher oxygen
concentration/lower pressure data (e.g., 30%, 70.3 kPa (10.2 psia)) can be conservatively applied to
evaluate the risk of lower oxygen concentration/higher pressure environments (e.g., 21% O2, 101.4 kPa
(14.7 psia)).
Discussion: Oxygen Molecular Collision Rate Competition for Reaction Sites
Oxygen molecular collision rate competition for reaction sites is proposed as a potential theory to help
describe the reported experimental trends. The major trends observed in examination of data are as
follows: Oxygen concentration is the major driver for material flammability with little effect from total
pressure in standard pressure ranges above 41 kPa (6 psia); decreasing amount of oxygen partial pressures
are needed to support propagation as total pressure is decreased; and certain materials such as Kel-F,
PTFE, Zotek F30, Armalon TG4060, and Nomex exhibited higher flammability pressure dependencies
than other materials.
Piloted ignition and combustion of a material are normally described as a series of three events: a material
heating time resulting in pyrolysis with corresponding generation of flammable gasses; an oxidizer and
flammable gas mixing time; and an induction or chemistry time [14]. Nonetheless, in trying to not only
explain rationale behind oxygen concentration as a primary flammability driver but also the rationale
behind why certain classes of materials might exhibit different dependencies on pressure, an additional
step may be proposed—one where the oxygen molecular collision rate competition for available reaction
sites may play a role.
At two different conditions along the normoxic curve, partial pressure of oxygen and a therefore
equivalent quantity of oxygen molecules are available. Nonetheless, the normoxic point that resides at the
higher oxygen concentration and lower total pressure possesses a smaller percentage of inert molecules.

9 JOURNAL OF ASTM INTERNATIONAL
In the test environment, molecules are continually colliding with the material surface. Conditions with
increased percentages of oxygen offer a higher chance of an oxidizer molecule coming into contact with a
reaction site versus the corresponding normoxic condition with fewer competing inert molecules. This
would explain why increased oxygen concentration escalates flammability despite equivalent partial
pressures of oxygen. The same rationale holds true for the observation that decreasing amounts of oxygen
partial pressures are needed to support propagation as total pressure is decreased. Decreased total pressure
means less molecules as a whole competing for reaction sites. With decreased competition from inert
molecules, it would make sense that less oxygen molecules are necessary to maintain similar flammability
performance.
Recall that the materials exhibiting higher flammability pressure dependencies were Kel-F, PTFE, Zotek
F30, Armalon TG4060, and Nomex. All of these more highly pressure dependent materials are highly
halogenated, with the exception of Nomex. Kel-F is a thermoplastic chlorofluoropolymer,
polychlorotrifluoroethene (PCTFE), with the molecular formula (CF2CClF)n. Polytetrafluoroethylene
(PTFE) is a fluoropolymer such as Teflon®1 with the molecular formula (C2F4)n. Zotek F is a closed cell
polyvinylidene fluoride (PVDF) based foam with the molecular formula (C2H2F2)n. Armalon TF 4060 is a
fluorocarbon fiberglass composite. Because of their saturated chains of highly electronegative
halogenated molecules (F, Cl), these materials are highly stable and possess few susceptible reaction sites.
Though Nomex is not a halogenated compound, its aramid structure provides a highly stable structure
with dense electron clouds that also offer few susceptible reaction sites.
If reaction sites are eliminated from the ignition initiation equation, then the oxygen molecule collision
rate competition for reaction sites may no longer play a significant role as proposed earlier. Therefore, a
material may directly follow the pyrolysis, mixing, and induction ignition model without an additional
1 Teflon® is registered trademark of E.I. Du Pont de Nemours and Company, Wilmington, DE.

10 JOURNAL OF ASTM INTERNATIONAL
oxidizer reaction site collision rate accelerating step [14]. In these cases, a material may exhibit a higher
pressure dependency (as was seen for Kel-F, PTFE, Zotek F30, Armalon TG4060, and Nomex) than what
was seen for its more reaction site rich material counterparts.
The proposal that an oxygen molecule reaction site collision rate competition step may supplement the
ignition sequence of pyrolysis, flammable gas mixing, and ignition induction appears to be successful in
describing reported experimental trends.
Conclusions
The desire to understand how to apply existing enriched oxygen environment flammability data to
alternate environmental conditions arises for NASA, commercial space flight companies, and industry
alike. The question as to whether data can be applied to alternate environments based on partial pressure
equivalents comes up frequently. Existing data from various sources have been compiled and examined
here to address this common question. Analysis of data generated a series of observations. Flammability
characteristics (per NASA-STD-6001 Test 1 MOC self-extinguishment thresholds, material ignition, and
burn rates) show a strong dependence on oxygen concentration with little relation to total pressures above
41 kPa (6 psia). Below 41 kPa (6 psia), MOCs and required oxygen partial pressures show increased
dependence on total pressure. Power equation models fit trends very precisely across pressure ranges
spanning 2.8–119.3 kPa (0.4–17.3 psia) for both MOC and partial pressure plots against total pressures. A
notable finding was that required partial pressure of oxygen necessary to sustain propagation decreases
with decreased total pressures. This directly implies an increased flammability risk at lower total pressure
conditions. This method of analysis may aid in the application of existing flammability data to alternate
environmental conditions, and may ultimately provide guidance as to the types of tests that should be
performed to yield the most useful results.

11 JOURNAL OF ASTM INTERNATIONAL
The conclusion drawn from these data is that lower concentration/higher pressure data (e.g., 21% O2,
101.4 kPa (14.7 psia)) cannot be conservatively applied to higher oxygen concentration/lower pressure
environments (e.g., 30%, 70.3 kPa (10.2 psia)) despite equivalent partial pressures. Nonetheless, higher
oxygen concentration/lower pressure data (e.g., 30%, 70.3 kPa (10.2 psia)) can be conservatively applied
to evaluate the risk of lower concentration higher pressure environments (e.g., 21% O2, 101.4 kPa
(14.7 psia)).
Certain materials (Kel-F, PTFE, Zotek F30, Armalon TG4060, and Nomex) exhibited higher
dependencies on total pressure and are believed to perform differently due to their limited amount of
susceptible reaction sites. A step for oxygen molecular collision rate competition for reaction sites was
suggested as an additional mechanism in the ignition sequence of pyrolysis, flammable gas mixing, and
ignition induction. This mechanism appears to be successful in describing reported experimental trends.
Future planned work includes additional testing in low pressure ranges as well as acquisition of burn rate
data of the presented materials at the various normoxic conditions.
References
1. Felder, R.M. and R.W. Rousseau (1986), Elementary Principles of Chemical Processes (2nd ed.).
Canada: John Wiley & Sons, Inc.
2. NASA-STD-6001B, Flammability, Offgassing, and Compatibility Requirements and Test
Procedures, Test 1, “Upward Flame Propagation,” National Aeronautics and Space Administration,
August 2011.
3. Hirsch, D.B. and H.D. Beeson, “Test Method to Determine Flammability of Aerospace Materials,”
Journal of Testing and Evaluation, Vol. 30, No.2, March 2002, pp. 156-159.
4. Hirsch, D.B., J.H. Williams, S.A. Harper, H.D. Beeson, and M.D. Pedley, “Oxygen Concentration
Flammability Thresholds of Selected Aerospace Materials Considered for the Constellation

12 JOURNAL OF ASTM INTERNATIONAL
Program,” Proceedings of the 2nd IAASS Conference “Space Safety in a Global World,” May 14-16,
2007, Chicago, USA (ESA SP-645, July 2007).
5. Hirsch, D.B., J.H. Williams, J.P. Haas, H.D. Beeson, G.A. Ruff, and M.D. Pedley, “Pressure Effects
on the Self-extinguishing Limits of Aerospace Materials,” presented at the International Conference
on Environmental Systems, 2009, 09-ICES-0267. 2009 SAE International.
6. Hirsch, D.B., J.H. Williams, and H.D. Beeson, “Pressure Effects on Oxygen Concentration
Flammability Thresholds of Material for Aerospace Applications,” Journal of Testing and
Evaluation, 2006.
7. Hirsch, D.B., J.H. Williams, S.A. Harper, H.D. Beeson, G.A Ruff, and M.D. Pedley, “Pressure
Flammability Thresholds of Selected Aerospace Materials,” presented at the International Conference
on Environmental Systems, 2010, 10-ICES-0231. 2010 SAE International.
8. Olson, S.L. and F.J. Miller, “Experimental Comparison of Opposed and Concurrent Flame Spread in
a Forced Convective Microgravity Environment,” Proceedings of the Combustion Institute 32 (2009)
2445-2452.
9. Yang, J.C., A. Hamins, and M.K. Donneley, “Reduced Gravity Combustion of Thermoplastic
Spheres,” Combustion and Flame, Vol. 120, Nos. ½, 61-74, January 2000.
10. Nakamura,Y. and A. Aoki, “Irradiated ignition of a solid material in reduced pressure atmosphere
with various oxygen concentrations for fire safety in space habitats,” Advances in Space Research (a
Cospar publication), 41(2008) 777-782.
11. Nakamura, Y., “Engineering of Pressurized Structure and Fire Safety for Space Habitation on Mars –
Needs of fundamental fire researches for space enclosure system,” Journal of Space Technology and
Science, Vol. 21, No. 2 (2005) 2.39-2.48.
12. Nakamura,Y. and A. Aoki, “Igniton of Solid Fuels at Low Pressure,” Selected paper at Proc. 25th
International Symposium Space Tech. Sci. (ISTS), ISTS 2006-h-25.
13. Nakamura, Y., “Analytical and Numerical Study on Irradiate Ignition of Solid Combustibles in Sub-
Atmospheric Pressure,” Journal of Thermal Science and Technology (2007) No. 07-0551.
13 JOURNAL OF ASTM INTERNATIONAL
14. McAllister, S., C. Fernandez-Pello, G.A. Ruff, and D. Urban, “Ignition Delay of Combustible
Materials in Normoxic Equivalent Environments,” presented at the International Conference on
Environmental Systems, 2009, 2009-01-2491. 2009 SAE International

14 JOURNAL OF ASTM INTERNATIONAL
Table 1—Normoxic Environmental Conditions. Oxygen Volume % 18 21 24.1 25 30 34 36 44 40 60 100 Total Pressure
kPa (psia) 118.6 (17.2)
101.4 (14.7)
88.3 (12.8)
85.5 (12.4)
71.0 (10.3)
62.7 (9.1)
59.3 (8.6)
48.3 (7.0)
53.1 (7.7)
35.9 (5.2)
21.4 (3.1)
Oxygen Partial Pressure kPa (psia)
21.3 (3.09)
21.3 (3.09)
21.3 (3.09)
21.3 (3.09)
21.3 (3.09)
21.3 (3.09)
21.3 (3.09)
21.3 (3.09)
21.3 (3.09)
21.3 (3.09)
21.3 (3.09)
15 JOURNAL OF ASTM INTERNATIONAL
Table 2—Pressure effects on NASA STD-6001 Test 1 MOC flammability thresholds of materials for aerospace applications and equivalent normoxic and ISS environment conditions for comparison.
Material psia (total pressure)
Determined at
99.8 % volume O2 0.4 0.5 0.6 0.9 7 10.2 12.35 14.7 17.3
MOP (psia)
MOP (psia)
MOP (psia)
MOP (psia)
MOC (vol%)
MOP (psia)
MOC (vol%)
MOP (psia)
MOC (vol%)
MOP (psia)
MOC (vol%)
MOP (psia)
MOC (vol%)
MOP (psia)
PTFE 53 3.7 46 5.7 42 6.2 KelF-81 76 5.3 56 6.9 53 7.8 Silicone 28 2.0 23 2.8 21 3.1 Zytel 42 25 1.8 23 2.8 23 3.4 Viton-A 29 2.0 21 2.6 21 3.1 Buna-S 18 1.3 17 2.1 16 2.4 Neoprene 18 1.3 17 2.1 16 2.4 Buna-N 18 1.3 16 2.0 15 2.2 EPDM Rubber 18 1.3 16 2.0 16 2.4 Polyethylene (PE) 18 1.3 18 2.2 17 2.5 Delrin 13 0.9 12 1.5 11 1.6 Zotek F30 47 3.3 37.5 5.5 36 6.2 Valox DR48 31 2.2 28.1 4.1 28 4.8 Nylon/ Phenolic 18 1.3 17 2.5 17 2.9 Armalon TG4060 50 3.5 35 5.1 33 5.7 Sygef 34 3.5 34 5.0 32 5.5 Udel P1700
Polysulfone 0.9 29 3.0 24 3.5 22 3.8 Ultem 1000 0.9 24 2.4 21 3.1 21 3.6 Melamine/ Glass 36 3.7 34 5.0 33 5.7 Melinex 515 0.4 20 2.0 18.5 2.7 Kydex 100 0.6 32 3.3 32 4.7 28 4.8 Nomex 90-40 0.5 37 3.8 31.5 4.6 30 5.2 Normoxic
environment partial pressure equivalents (CEV/STS) 44 3.1 30 3.1 25 3.1 21 3.1 18 3.1
ISS environment partial pressure equivalents 50 3.5 34 3.5 28 3.5 24.1 3.5 20 3.5
MOC = Maximum oxygen concentration which consistently results in material self-extinguishment MOP = Maximum oxygen partial pressure when extinguishment occurs (based on MOC with the exception of 99.8% testing)

16 JOURNAL OF ASTM INTERNATIONAL
FIG. 1—Pressure effects on NASA STD-6001 Test 1 MOC flammability thresholds.

17 JOURNAL OF ASTM INTERNATIONAL
FIG. 2—MOC threshold in which NASA-STD-6001 Test 1 will consistently self extinguish, and equivalent normoxic oxygen concentrations.

18 JOURNAL OF ASTM INTERNATIONAL
FIG. 3—MOP thresholds in which NASA-STD-6001 Flammability Test 1 will consistently self extinguish, and equivalent normoxic partial pressures.