p 1 july 2012 fm article
DESCRIPTION
P1 articleTRANSCRIPT

44 Study notes
Paper P1
OperationsPerformance
By the examiner for paper P1
Variance analysis is a standard management accounting technique, but too many P1 candidates struggle to apply it because they don’t bother to understand what all the variances actually mean
Students tend to find the P1 exam diffi-cult because the information given in the scenarios and the requirements vary considerably from question to question. Rote learning for this paper, therefore, will not be effective.
Section C of the exam often includes a question requiring a variance analysis. I have invariably been disappointed by how badly most candidates have performed on answering such questions, par-ticularly because it’s a core area of the syllabus that they should see as their bread and butter. Post-exam guides have stated that students tend to try to learn by rote for this subject, rather than understanding what they are trying to achieve. Variance analysis is not about learning formulas; it’s about working out what the variances mean. Once these are understood, the figures necessary to calculate them usually become clear.
Let’s attempt question 3 in section C of the November 2011 P1 paper, which required candi-dates to perform a variance analysis. Here is the scenario it gives, along with part A of the require-ment:
TP makes wedding cakes that are sold to special-ist retail outlets, which decorate the cakes accord-ing to the customers’ specific requirements. The standard cost per unit of its most popular cake is as follows:Direct material: $ Ingredient A 4kg at $25 per kg 100 Ingredient B 3kg at $22 per kg 66 Ingredient C 2kg at $11.50 per kg 23Direct labour: 3 hours at $12 per hour 36Variable overhead: 3 hours at $8 per hour 24Standard cost: 249
The budgeted production for the period was
10,000 units. Actual results for the period were as follows:
Production: 9,000 units.
Direct material: $ Ingredient A 35,000kg 910,000 Ingredient B 28,000kg 630,000 Ingredient C 27,000kg 296,000Direct labour: 30,000 hours 385,000Variable overhead: 230,000
The general market prices at the time of purchase
for ingredient A and ingredient B were $23 per kg and $20 per kg respectively.
TP operates a just-in-time (JIT) purchasing system for ingredients and a JIT production system. Therefore, there was no inventory during the period.
Prepare a statement that reconciles the flexed budget material cost and the actual material cost. Your statement should include the material price planning variances and the operational variances, including material price, material mix and mate-rial yield (12 marks).
The first thing to note is that a reconciliation statement is required. Many candidates didn’t produce a statement and, while this omission was treated fairly leniently in the marking, the post-exam guide for that paper warned that this might not always be the case. Such questions test not only your ability to calculate variances, but also your ability to calculate the appropriate variances that will explain the difference between the budget figures and the actual figures.
In addition, the reconciliation should be between the “flexed budget material cost” and the actual material cost. The original production budget was 10,000 units, but only 9,000 units were actually made. Therefore we need to recon-cile the budget cost of 9,000 units – i.e. the flexed budget – with the actual cost of 9,000 units.
The second part of the requirement makes it clear which variances need to be calculated: the material price planning variances and the opera-tional variances, including the material price, material mix and material yield variances. Despite this, a disappointingly high number of candidates wasted a lot of valuable time calculating labour variances and variable overhead variances. This may have been because questions they had prac-tised during their revision required the reconcil-iation of profit or contribution. It is important to read the question requirements carefully, because no marks will be awarded for performing calcula-tions that are not required. Other candidates,
‘I have invariably been disappointed by how badly most candidates have performed on answering variance analysis questions’

46
TO
TA
L P
RO
FIT
V
AR
IAN
CE
Further reading CIMA Official Study Text – Performance Operations (2011-12 edition), CIMA Publishing, 2011.
Paper P1Performance Operations
Study notes
while they didn’t calculate labour or overhead variances, worked out the material usage variance. This meant that there was a duplication of vari-ances, because the material usage variance is a combination of the material mix variance and the material yield variance.
The diagram below shows the chart of variances using absorption costing principles. The same applies under marginal costing, except that the sales variances will relate to contribution and there will be no further breakdown of the fixed production overhead total variance.
Many questions on variance analysis require the reconciliation of budget and actual profit. They will ask candidates to show variances in as much detail as possible. If the scenario involves a firm selling multiple products and/or a product that requires a mix of different inputs, you should calculate sales mix and sales quantity variances and/or material mix and yield variances. But you should not then also calculate the sales volume variance and the material usage variance, as this would result in duplication and it would be impos-sible to reconcile the budget and actual figures.
Chart of variances using absorption costing principles
Selling price variance SALES Sales mix profit variance VARIANCES Sales volume profit variance Sales quantity profit variance
Direct material price variance Direct material total variance Direct material mix variance Direct material usage variance Direct material yield variance
Direct labour rate variance Direct labour total variance Direct labour efficiency variance PRODUCTION VARIANCES Variable production overhead expenditure variance Variable production overhead total variance Variable production overhead efficiency variance
Fixed production overhead expenditure variance Fixed production overhead total variance Fixed production overhead volume variance
Marketing cost variance NON-PRODUCTION COST VARIANCES Administrative cost variance Source: CIMA Official Terminology, 2005 edition.
Study notes 47
The first step is to calculate the flexed budget material cost. This should be based on 9,000 units and the original standard material cost – i.e. the total cost of ingredients A, B and C, which is $189.
CIMA corporate centre 26 Chapter Street,London SW1P 4NP T: +44 (0)20 8849 2251E: cima.contact@ cimaglobal.comwww.cimaglobal.comCIMA Australia 5 Hunter Street, Sydney, NSW 2000T: +61 (0)2 9376 9902E: [email protected] Bangladesh Suite 309, RM Center, (3rd Floor), 101 Gulshan Avenue, Dhaka-1212T: +8802 881 5724E: zareef.matin@ cimaglobal.comCIMA Botswana Plot 50374 , Block 3, 1st Floor, Southern Wing, Fairgrounds Financial Centre, GaboroneT: +267 395 2362E: [email protected] China: head officeUnit 1508A, 15th Floor, Azia Center, 1233 Lujiazui Ring Road, Pudong, Shanghai 200120T: +86 (0)21 6160 1558E: [email protected] China: BeijingC 201, 2/F Landmark Tower 2, 8 North Dongsanhuan Road,Beijing 100004
T: +86 (0)10 6590 0751 E: [email protected] China: ChongqingRoom 1202, Metropolitan Plaza, 68 Zou Rong Road, Yuzhong District, Chongqing 400010T: +86 (0)23 6371 3538 E: [email protected] China: Shenzhen16/F, CITIC City Plaza,Shennan Road Central, Shenzhen 518031T: +86 (0)755 3330 5151 E: [email protected] Ghana3rd Floor, Ayele Building,IPS/Attraco Road,Madina, AccraT: +233 (0)30 250 3407E: [email protected] Hong KongSuite 2005, 20th Floor, Tower One, Times Square, 1 Matheson Street, Causeway Bay, Hong KongT: +852 (0)2511 2003E: [email protected] India Unit 1-A-1, 3rd Floor, Vibgyor Towers, C-62, G Block, Bandra Kurla Complex, Bandra (East), Mumbai 400051T: +91 22 4237 0100E: [email protected]
CIMA Ireland5th Floor, Block E, Iveagh Court, Harcourt Road, Dublin 2T: +353 (0)1 643 0400E: cima.ireland@ cimaglobal.comCIMA Malaysia: head office CIMA Malaysia, Lots 1.03b & 1.05, Level 1, KPMG Tower, 8 First Avenue, Bandar Utama, 47800 Petaling Jaya, Selangor Darul EhsanT: +60 (0)3 77 230230E: kualalumpur@ cimaglobal.comCIMA Malaysia: SarawakSublot 315, 1st Floor, 21 Jalan Bukit Mata, 93100 Kuching, Sarawak T: +6082 233136E: [email protected] CIMA Malaysia: PenangSuite 12-04A, 12th Floor, Menara Boustead Penang,39 Jalan Sultan Ahmad Shah, 10050 PenangT: +60 (0)4 226 7488E: [email protected] Middle EastOffice E01, 1st Floor, Block 3,PO Box 502221, Dubai Knowledge Village, Al Sofouh Road, Dubai, United Arab EmiratesT: +9714 434 7370E: [email protected]
CIMA NigeriaLandmark Virtual Office, 5th Floor, Mulliner Towers, 39 Alfred Rewane Road, Ikoyi, LagosT: +234 1 463 8353 (ext 518)E: [email protected] Pakistan 201, 2nd Floor, Business Arcade, Plot 27-A, Block 6, PECHS, Shahra-e-faisal, KarachiT: +92 21 3432 2387E: [email protected] Pakistan: Islamabad1st Floor, Rehman Chambers,Fazal-e-Haq Road, Blue Area, IslamabadT: + 92 51 260 5701-6CIMA Pakistan: LahoreFlat 1, 2, 1st Floor, Front Block 3, Awami Complex at 1-4, Usman Block, New Garden Town, LahoreT: +92 42 3594 0311-16CIMA PolandWarsaw Financial Centre , Floor 11, ul Emilii Plater 53,00-113 Warsaw T: +48 22 528 6651E: [email protected] RussiaOffice 4009, 4th floor,Zemlyanoj Val 9, Moscow 105064 T: +7495 967 9328E: [email protected]
CIMA Singapore3 Phillip Street, Commerce Point, Level 19, Singapore 048693T: +65 68248252E: [email protected] South Africa 1st Floor, 198 Oxford Road, Illovo 2196T: +27 11 788 8723 E: johannesburg@ cimaglobal.comCIMA Sri Lanka356 Elvitigala, Mawatha,Colombo 05T: +94 (0)11 250 3880E: [email protected] Sri Lanka: Kandy229 Peradeniya Road, KandyT: +94 (0)81 222 7883E: [email protected] UK 26 Chapter Street, London SW1P 4NP T: +44 (0)20 8849 2251E: cima.contact@ cimaglobal.comCIMA Zambia6053 Sibweni Road,Northmead, LusakaT: +260 1 290219E: [email protected] Zimbabwe6th Floor Michael House, 62 Nelson Mandela Ave, HarareT: +263 4 708600E: [email protected]
GlObal cOntact details
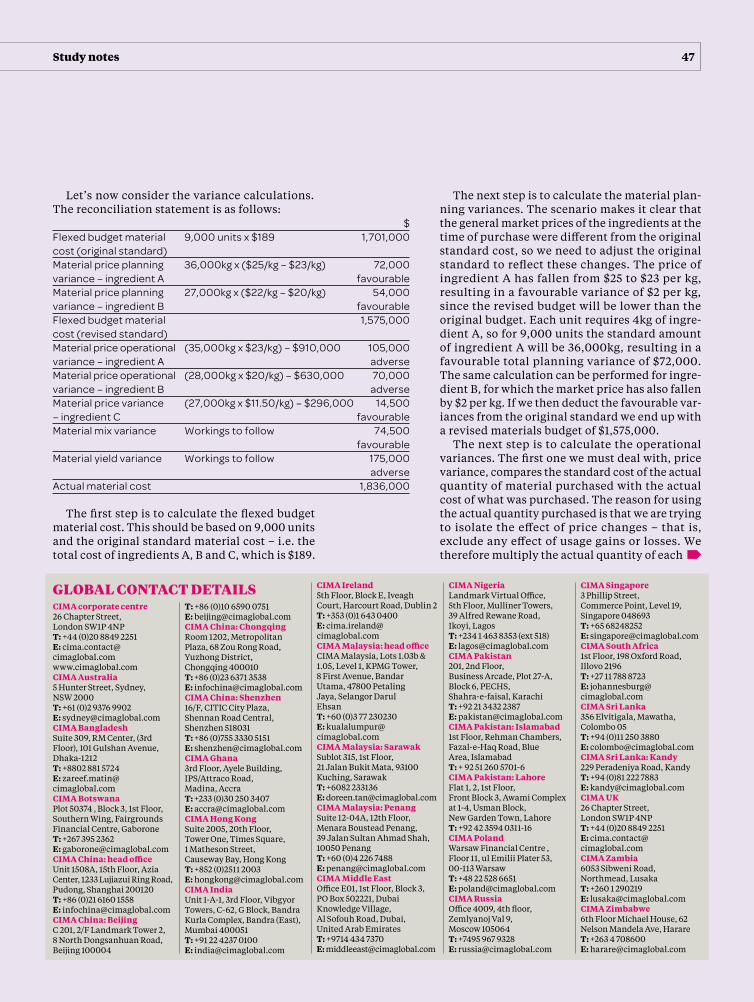
Let’s now consider the variance calculations. The reconciliation statement is as follows:
The next step is to calculate the material plan-ning variances. The scenario makes it clear that the general market prices of the ingredients at the time of purchase were different from the original standard cost, so we need to adjust the original standard to reflect these changes. The price of ingredient A has fallen from $25 to $23 per kg, resulting in a favourable variance of $2 per kg, since the revised budget will be lower than the original budget. Each unit requires 4kg of ingre-dient A, so for 9,000 units the standard amount of ingredient A will be 36,000kg, resulting in a favourable total planning variance of $72,000. The same calculation can be performed for ingre-dient B, for which the market price has also fallen by $2 per kg. If we then deduct the favourable var-iances from the original standard we end up with a revised materials budget of $1,575,000.
The next step is to calculate the operational variances. The first one we must deal with, price variance, compares the standard cost of the actual quantity of material purchased with the actual cost of what was purchased. The reason for using the actual quantity purchased is that we are trying to isolate the effect of price changes – that is, exclude any effect of usage gains or losses. We therefore multiply the actual quantity of each
$Flexed budget material 9,000 units x $189 1,701,000 cost (original standard)Material price planning 36,000kg x ($25/kg – $23/kg) 72,000 variance – ingredient A favourableMaterial price planning 27,000kg x ($22/kg – $20/kg) 54,000 variance – ingredient B favourableFlexed budget material 1,575,000 cost (revised standard)Material price operational (35,000kg x $23/kg) – $910,000 105,000 variance – ingredient A adverseMaterial price operational (28,000kg x $20/kg) – $630,000 70,000 variance – ingredient B adverseMaterial price variance (27,000kg x $11.50/kg) – $296,000 14,500 – ingredient C favourableMaterial mix variance Workings to follow 74,500 favourableMaterial yield variance Workings to follow 175,000 adverseActual material cost 1,836,000
48
Paper P1Performance Operations
Study notes
ingredient purchased by the revised standard cost and compare this with the actual cost. Note that the operational variances use the revised stand-ard, as we are trying to assess operational effi-ciency, which makes it necessary to exclude any planning variances since these are not within the operational manager’s control.
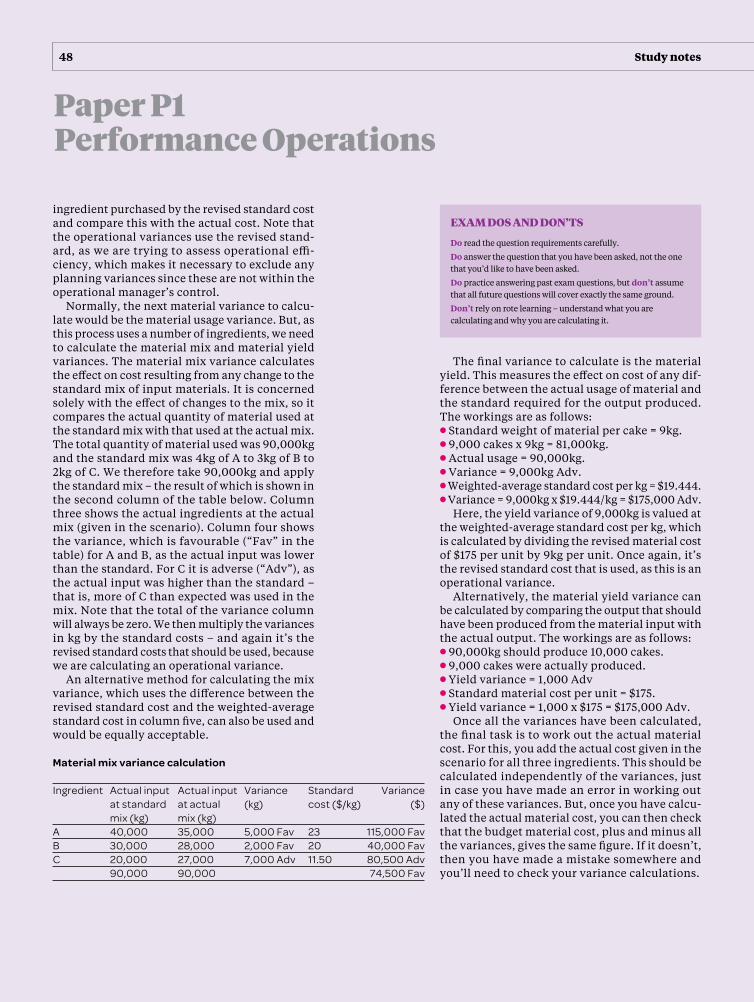
Normally, the next material variance to calcu-late would be the material usage variance. But, as this process uses a number of ingredients, we need to calculate the material mix and material yield variances. The material mix variance calculates the effect on cost resulting from any change to the standard mix of input materials. It is concerned solely with the effect of changes to the mix, so it compares the actual quantity of material used at the standard mix with that used at the actual mix. The total quantity of material used was 90,000kg and the standard mix was 4kg of A to 3kg of B to 2kg of C. We therefore take 90,000kg and apply the standard mix – the result of which is shown in the second column of the table below. Column three shows the actual ingredients at the actual mix (given in the scenario). Column four shows the variance, which is favourable (“Fav” in the table) for A and B, as the actual input was lower than the standard. For C it is adverse (“Adv”), as the actual input was higher than the standard – that is, more of C than expected was used in the mix. Note that the total of the variance column will always be zero. We then multiply the variances in kg by the standard costs – and again it’s the revised standard costs that should be used, because we are calculating an operational variance.
An alternative method for calculating the mix variance, which uses the difference between the revised standard cost and the weighted-average standard cost in column five, can also be used and would be equally acceptable.
The final variance to calculate is the material yield. This measures the effect on cost of any dif-ference between the actual usage of material and the standard required for the output produced. The workings are as follows:l Standard weight of material per cake = 9kg.l 9,000 cakes x 9kg = 81,000kg.l Actual usage = 90,000kg.l Variance = 9,000kg Adv.l Weighted-average standard cost per kg = $19.444.l Variance = 9,000kg x $19.444/kg = $175,000 Adv.
Here, the yield variance of 9,000kg is valued at the weighted-average standard cost per kg, which is calculated by dividing the revised material cost of $175 per unit by 9kg per unit. Once again, it’s the revised standard cost that is used, as this is an operational variance.
Alternatively, the material yield variance can be calculated by comparing the output that should have been produced from the material input with the actual output. The workings are as follows:l 90,000kg should produce 10,000 cakes.l 9,000 cakes were actually produced.l Yield variance = 1,000 Adv l Standard material cost per unit = $175.l Yield variance = 1,000 x $175 = $175,000 Adv.
Once all the variances have been calculated, the final task is to work out the actual material cost. For this, you add the actual cost given in the scenario for all three ingredients. This should be calculated independently of the variances, just in case you have made an error in working out any of these variances. But, once you have calcu-lated the actual material cost, you can then check that the budget material cost, plus and minus all the variances, gives the same figure. If it doesn’t, then you have made a mistake somewhere and you’ll need to check your variance calculations.
Material mix variance calculation Ingredient Actual input Actual input Variance Standard Variance at standard at actual (kg) cost ($/kg) ($) mix (kg) mix (kg)A 40,000 35,000 5,000 Fav 23 115,000 FavB 30,000 28,000 2,000 Fav 20 40,000 FavC 20,000 27,000 7,000 Adv 11.50 80,500 Adv 90,000 90,000 74,500 Fav
exam dOs and dOn’ts
Do read the question requirements carefully.
Do answer the question that you have been asked, not the one that you’d like to have been asked.
Do practice answering past exam questions, but don’t assume that all future questions will cover exactly the same ground.
Don’t rely on rote learning – understand what you are calculating and why you are calculating it.