p 3 actuaries you can understand 1 introduction to the actuarial valuation: funding and assumptions...
TRANSCRIPT
1P3 Actuaries you can
understand
Introduction to the Actuarial Valuation:
Funding and Assumptions
January 12, 2006
P

2P3 Actuaries you can
understand
Outline
• Basic Concepts and Terminology
• Developing Contributions
• Economic Assumptions
3P3 Actuaries you can
understand
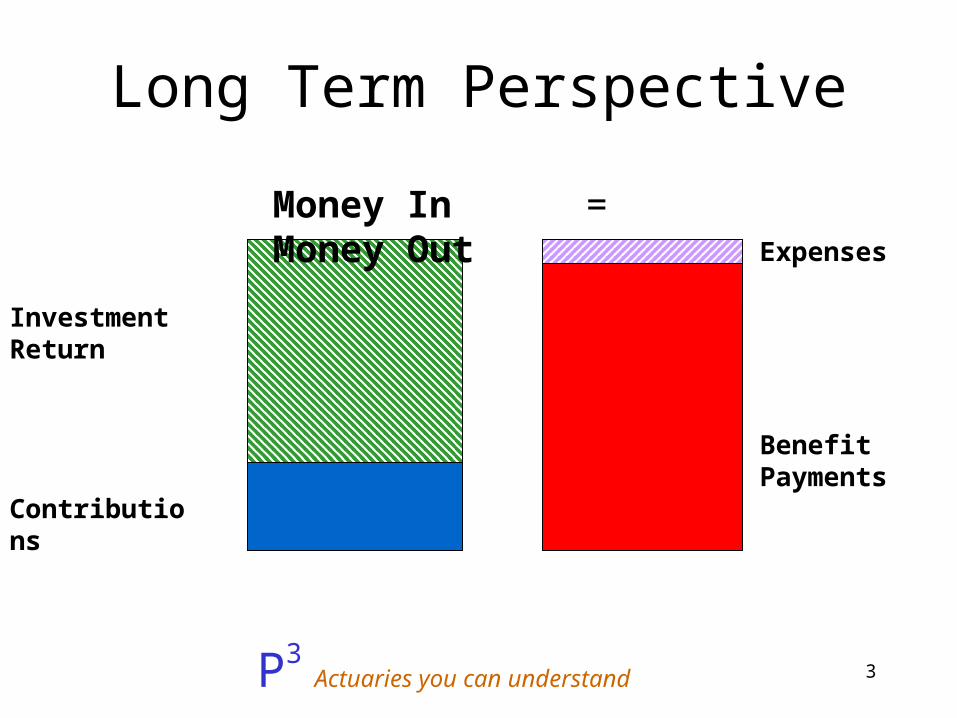
Long Term Perspective
Contributions
Investment Return
Benefit Payments
Expenses
Money In = Money Out

4P3 Actuaries you can
understand
What funding methods do
Contribution Timing
5P3 Actuaries you can
understand
What funding methods do
Contribution Smoothing
6P3 Actuaries you can
understand
Funding Goal
Fully paid at retirement
7P3 Actuaries you can
understand
Do we have enough money?
8P3 Actuaries you can
understand
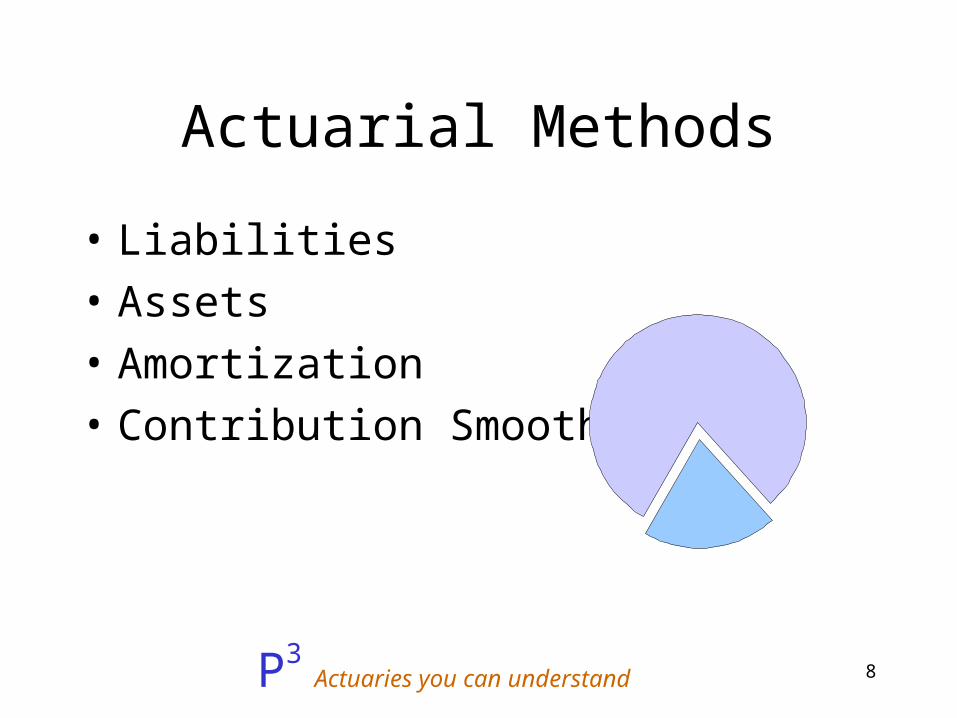
Actuarial Methods
• Liabilities
• Assets
• Amortization
• Contribution Smoothing
9P3 Actuaries you can
understand
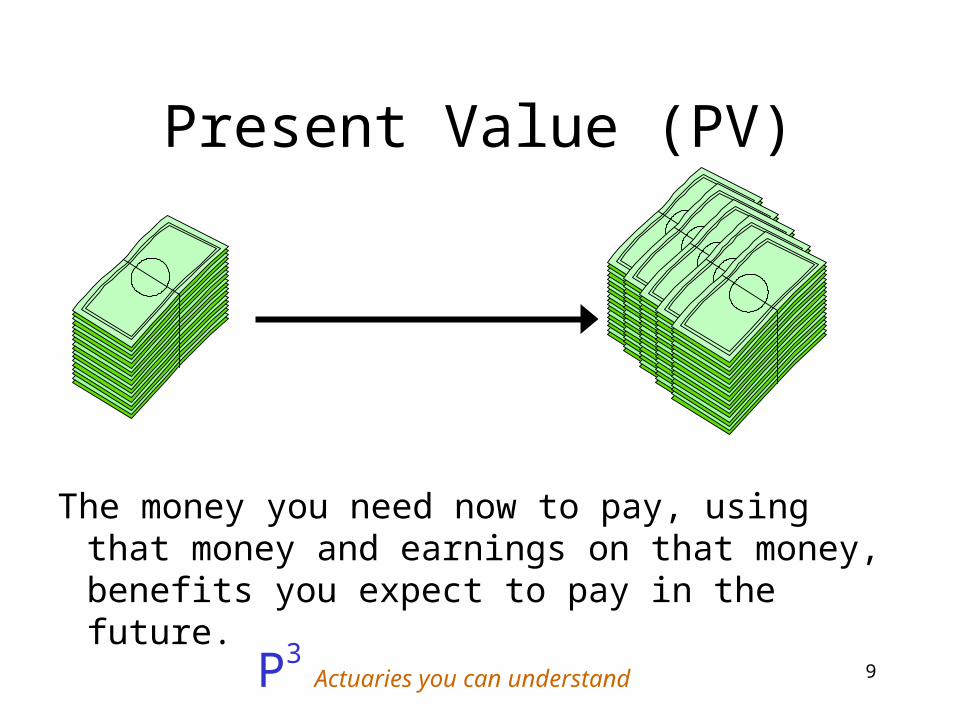
Present Value (PV)
The money you need now to pay, using that money and earnings on that money, benefits you expect to pay in the future.
10P3 Actuaries you can
understand
Expect to Pay

11P3 Actuaries you can
understand
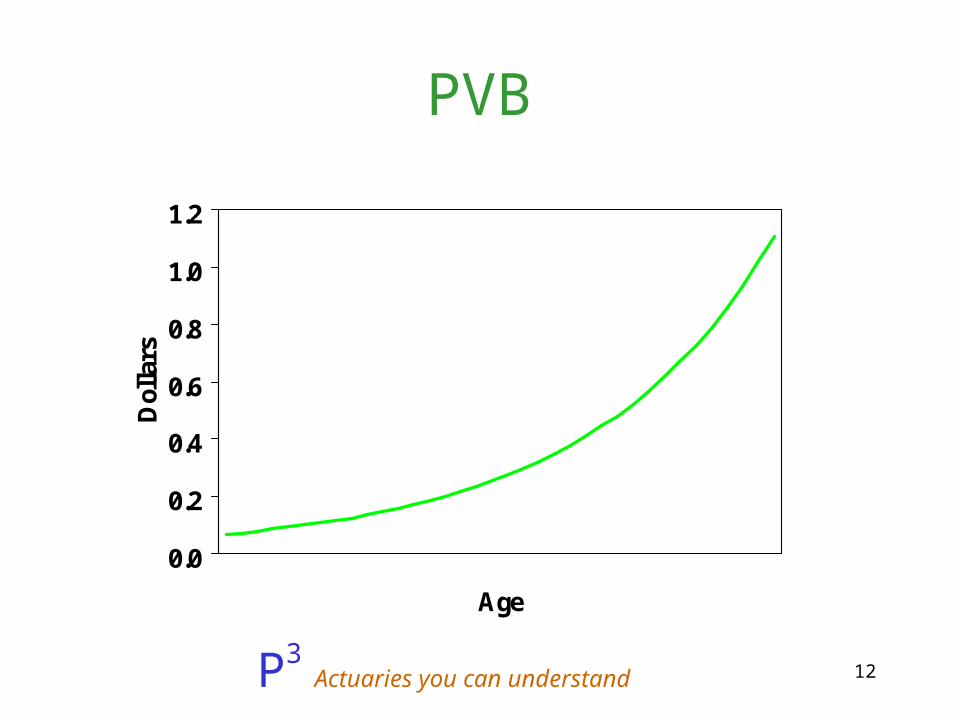
PV of Projected Benefits (PVB)
Present
Value of
Projected
Benefits
Assumptions
12P3 Actuaries you can
understand
PVB
0.0
0.2
0.4
0.6
0.8
1.0
1.2
Age
Dol
lars
13P3 Actuaries you can
understand
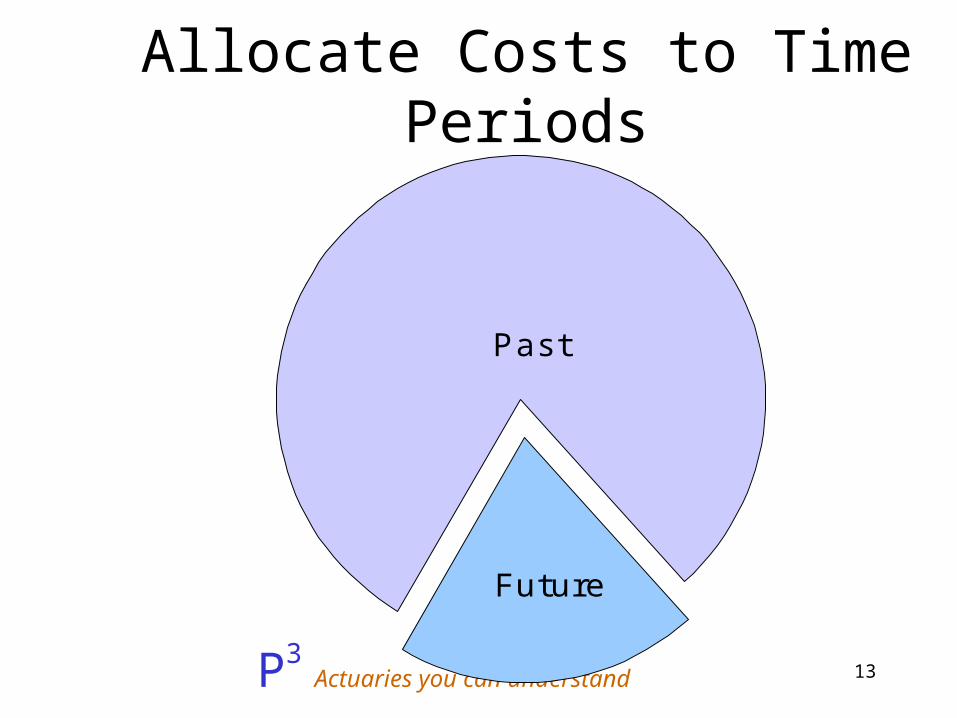
Allocate Costs to Time Periods
Future
Past
14P3 Actuaries you can
understand
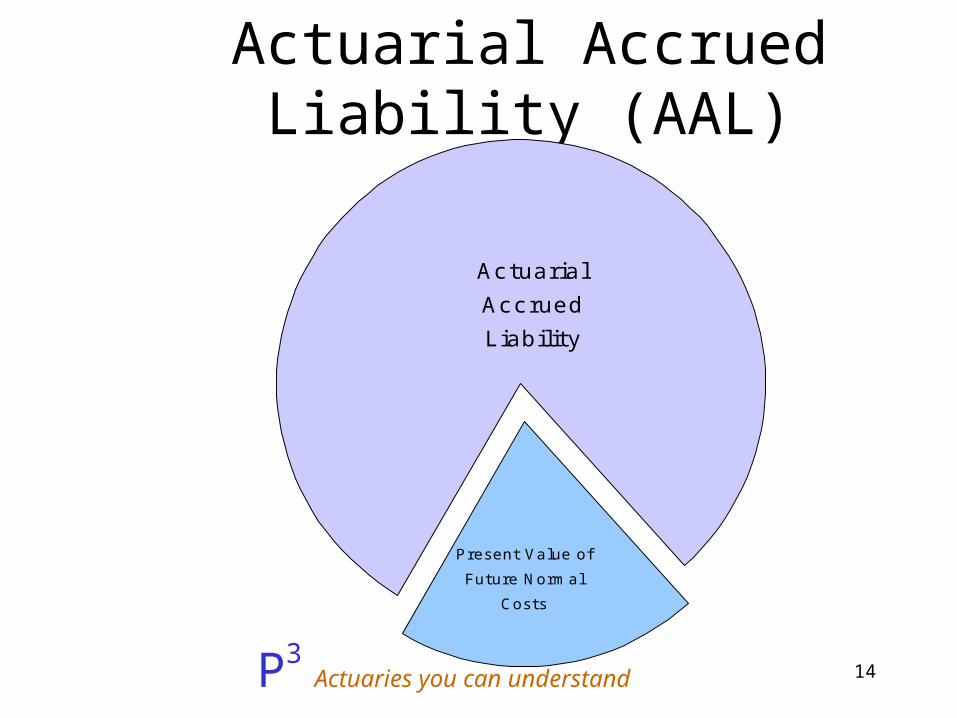
Actuarial Accrued Liability (AAL)
Present Value of
Future Normal
Costs
Actuarial
Accrued
L iability
15P3 Actuaries you can
understand
Asset Smoothing Methodology
16P3 Actuaries you can
understand
Competing GoalsDampen Volatility
Track Asset Value over
the long-term

17P3 Actuaries you can
understand
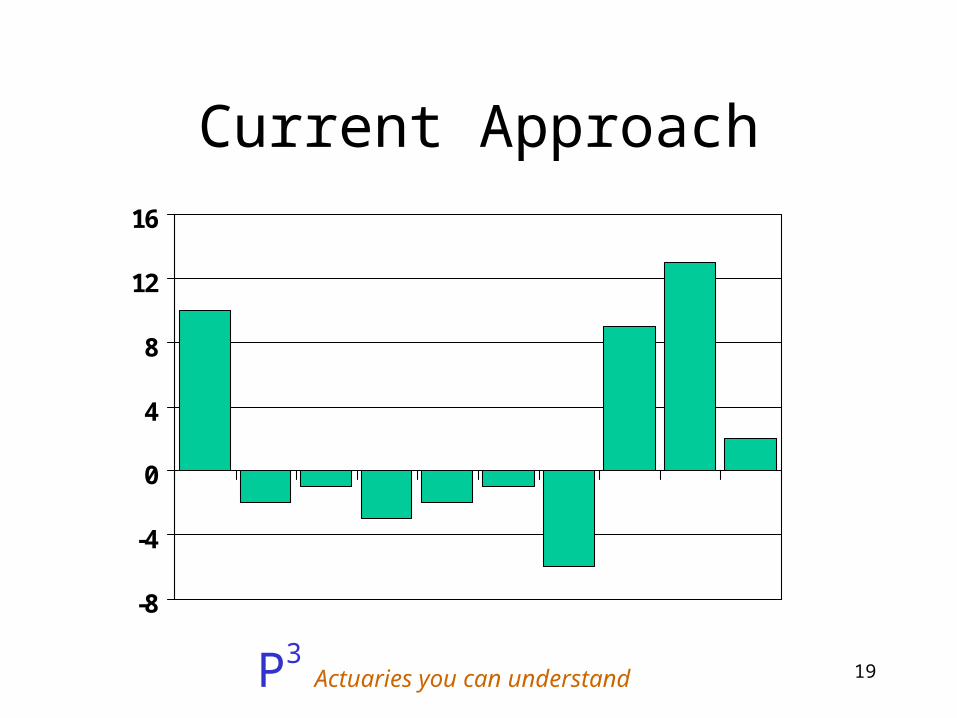
Current Approach
• Difference between expected and actual investment return spread over 5 years

18P3 Actuaries you can
understand
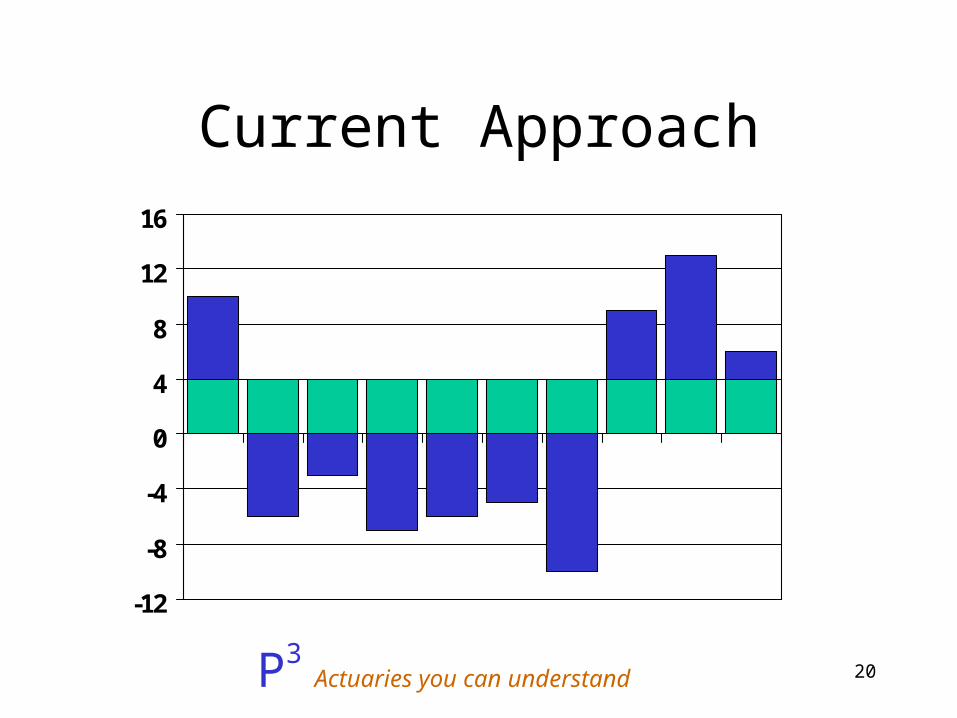
Current Approach
• Expected Return– Calculate semi-annually– Base on market value– Use assumed investment return at that
time
• Set 20% Corridor around Market Value
19P3 Actuaries you can
understand
Current Approach
-8
-4
0
4
8
12
16
20P3 Actuaries you can
understand
Current Approach
-12
-8
-4
0
4
8
12
16

21P3 Actuaries you can
understand
Unfunded Actuarial Accrued Liability (UAAL)
Assets
UAALPresent
Value of
Future
Normal
Costs
22P3 Actuaries you can
understand
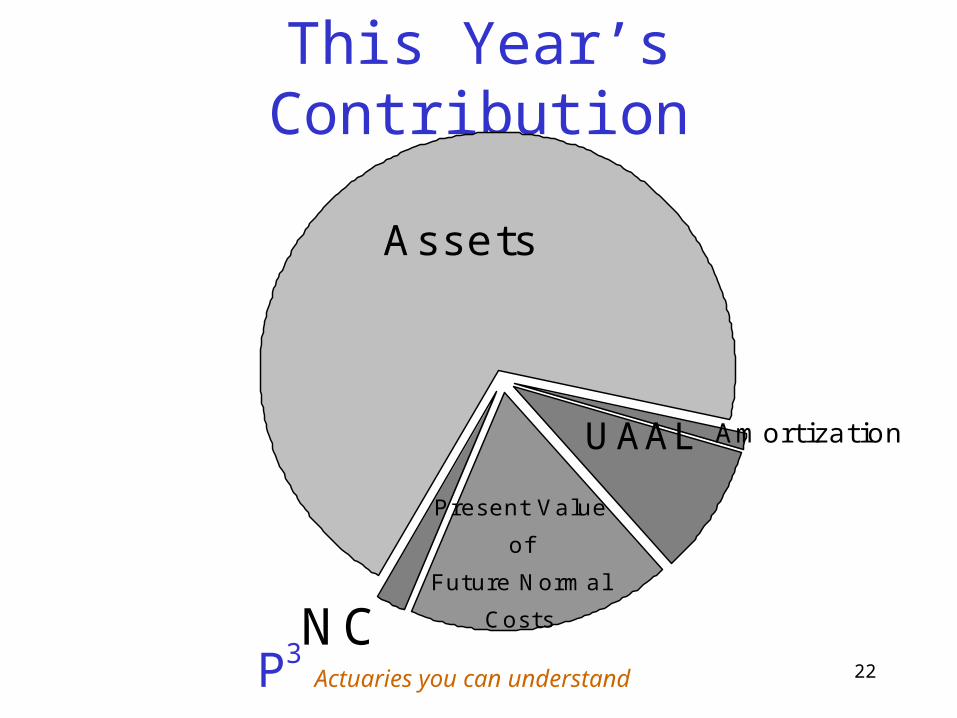
This Year’s Contribution
Present Value
of
Future Normal
CostsNC
UAAL Amortization
Assets
23P3 Actuaries you can
understand
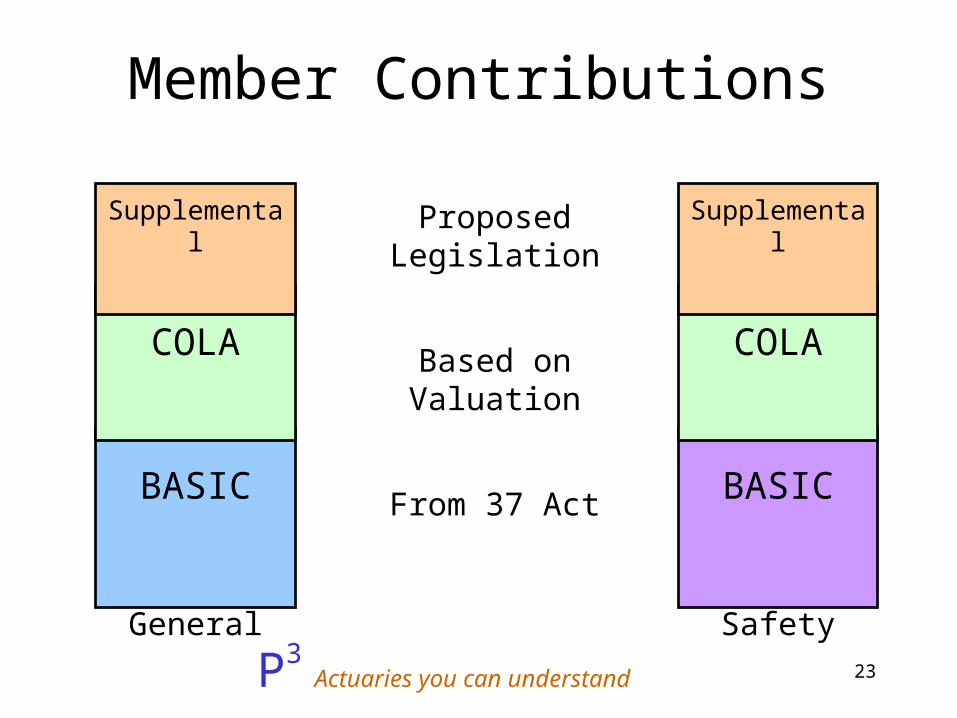
Member Contributions
BASIC
General
COLA
Supplemental
BASIC
Safety
COLA
SupplementalProposed Legislation
Based on Valuation
From 37 Act

24P3 Actuaries you can
understand
Basic – General MembersTier 1
• 31621.5. … the normal rate of contribution … shall be such as will provide an average annuity at age 60 equal to one 200th of the final compensation of members …
BASIC31621.5
25P3 Actuaries you can
understand
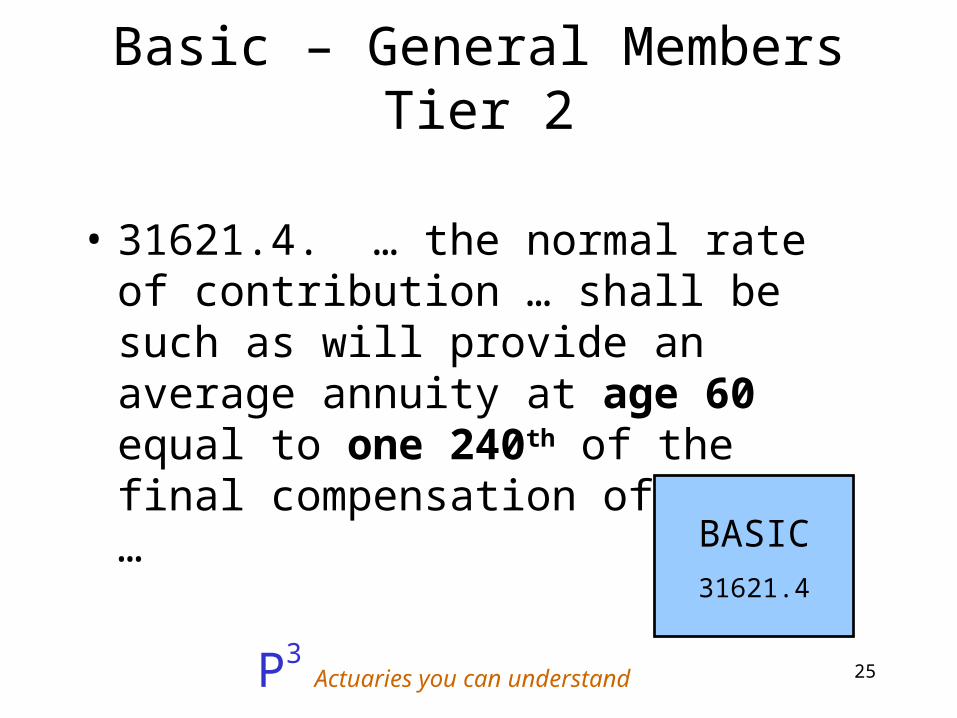
Basic – General MembersTier 2
• 31621.4. … the normal rate of contribution … shall be such as will provide an average annuity at age 60 equal to one 240th of the final compensation of members …
BASIC31621.4
26P3 Actuaries you can
understand
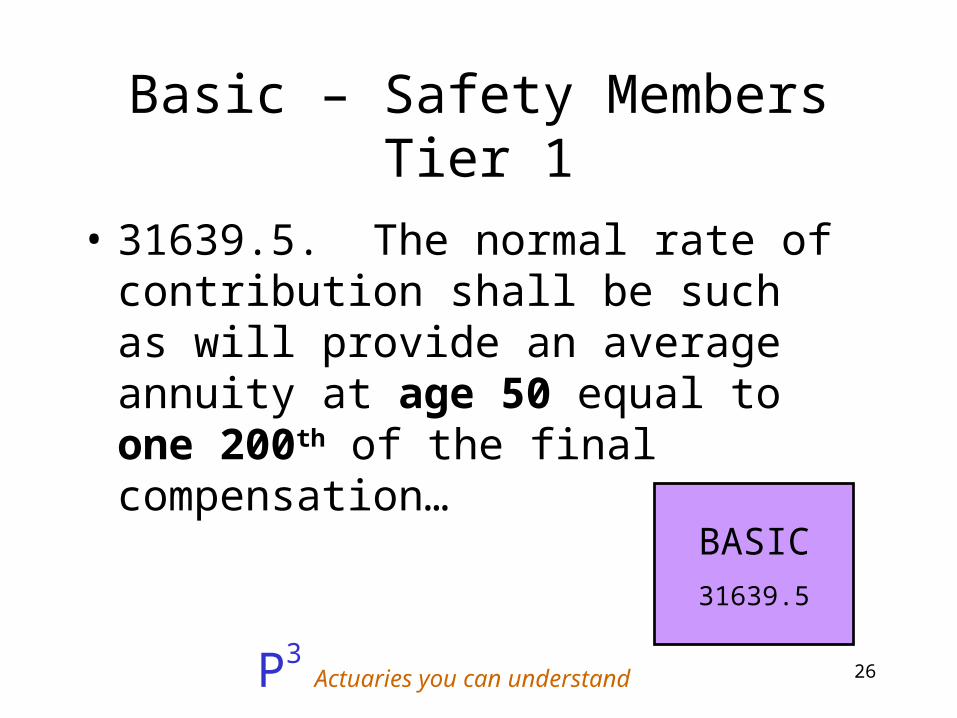
Basic – Safety MembersTier 1
• 31639.5. The normal rate of contribution shall be such as will provide an average annuity at age 50 equal to one 200th of the final compensation…
BASIC31639.5

27P3 Actuaries you can
understand
Basic – Safety MembersTier 2
• 31639.5. The normal rate of contribution shall be such as will provide an average annuity at age 50 equal to one 200th of the final compensation…
BASIC31639.5
28P3 Actuaries you can
understand
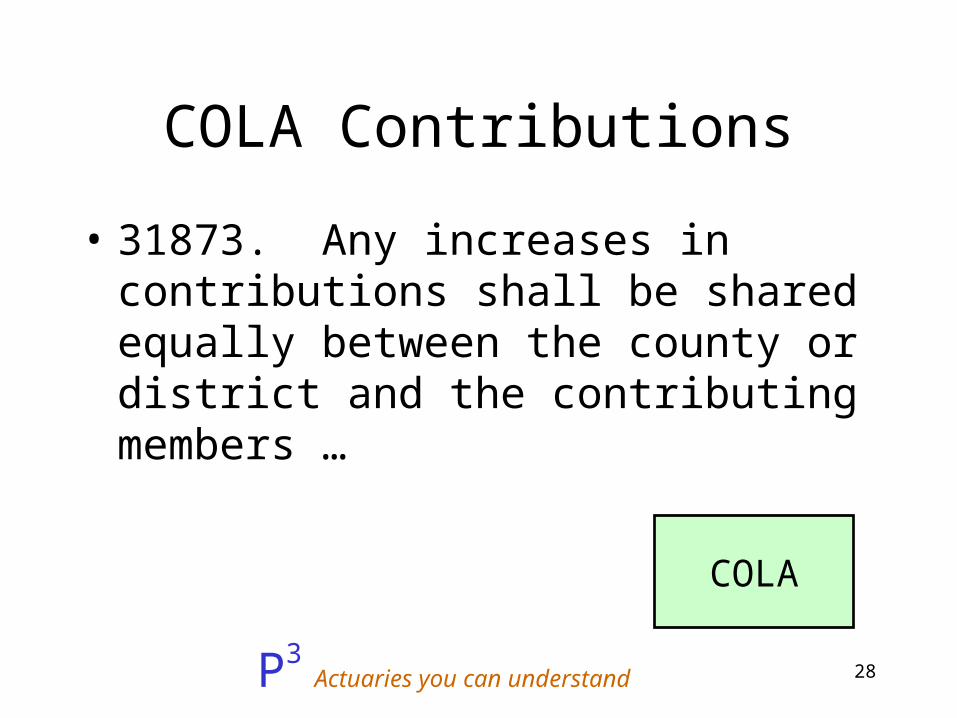
COLA Contributions
• 31873. Any increases in contributions shall be shared equally between the county or district and the contributing members …
COLA

29P3 Actuaries you can
understand
COL Contributions
• FCERA Board previously decided that “Any increases in contributions” means contributions for both Normal Cost and Unfunded Actuarial Accrued Liability.
30P3 Actuaries you can
understand
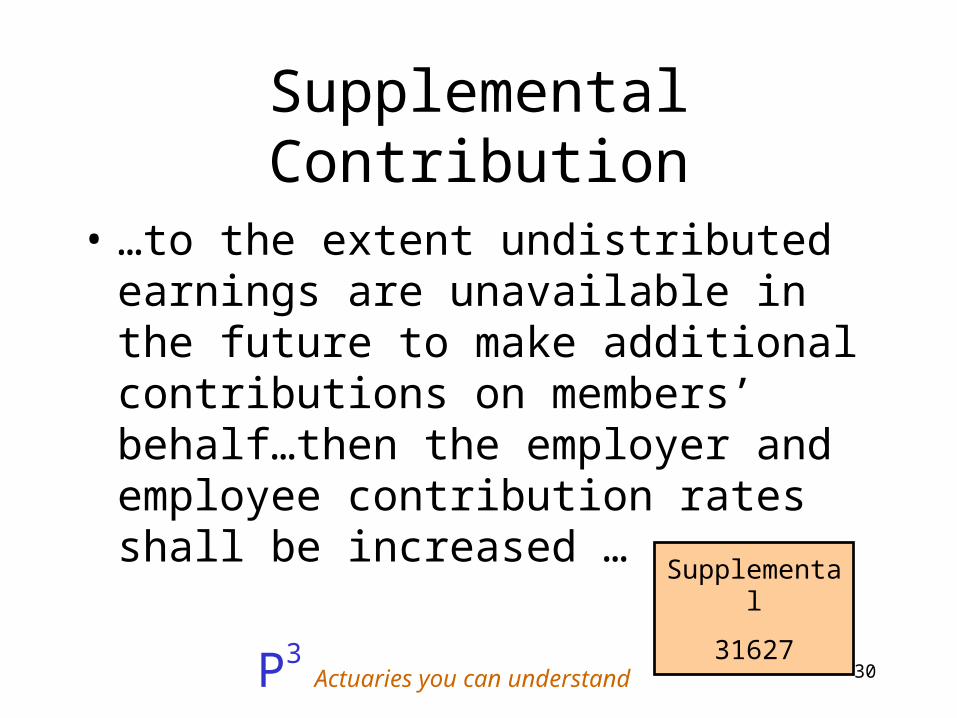
Supplemental Contribution
• …to the extent undistributed earnings are unavailable in the future to make additional contributions on members’ behalf…then the employer and employee contribution rates shall be increased …
Supplemental
31627
31P3 Actuaries you can
understand
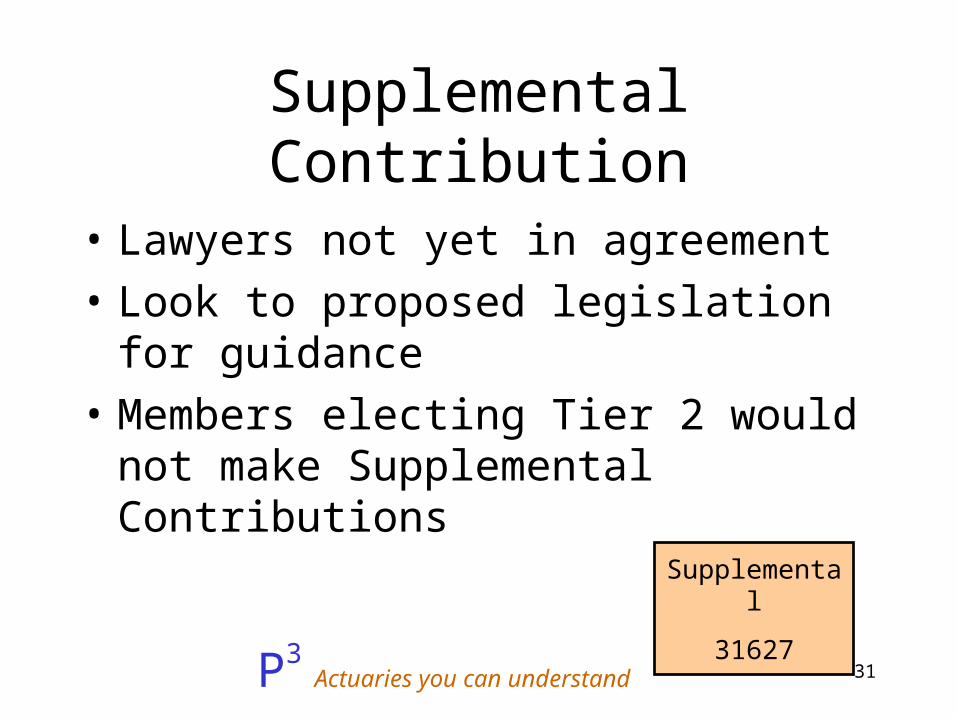
Supplemental Contribution
• Lawyers not yet in agreement
• Look to proposed legislation for guidance
• Members electing Tier 2 would not make Supplemental Contributions
Supplemental
31627
32P3 Actuaries you can
understand
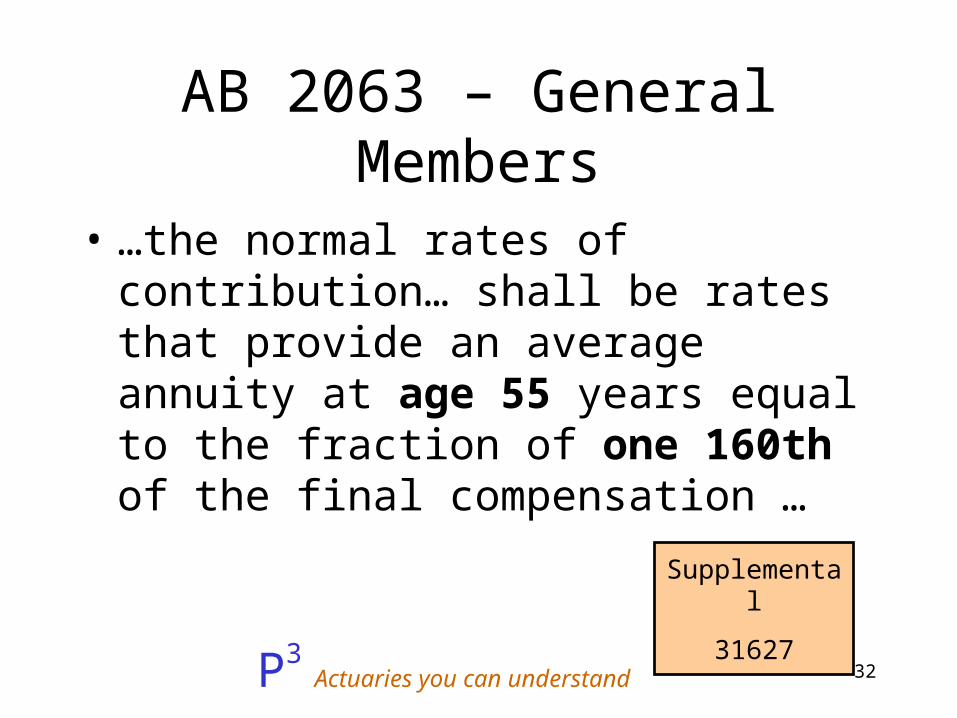
AB 2063 – General Members
• …the normal rates of contribution… shall be rates that provide an average annuity at age 55 years equal to the fraction of one 160th of the final compensation …
Supplemental
31627
33P3 Actuaries you can
understand
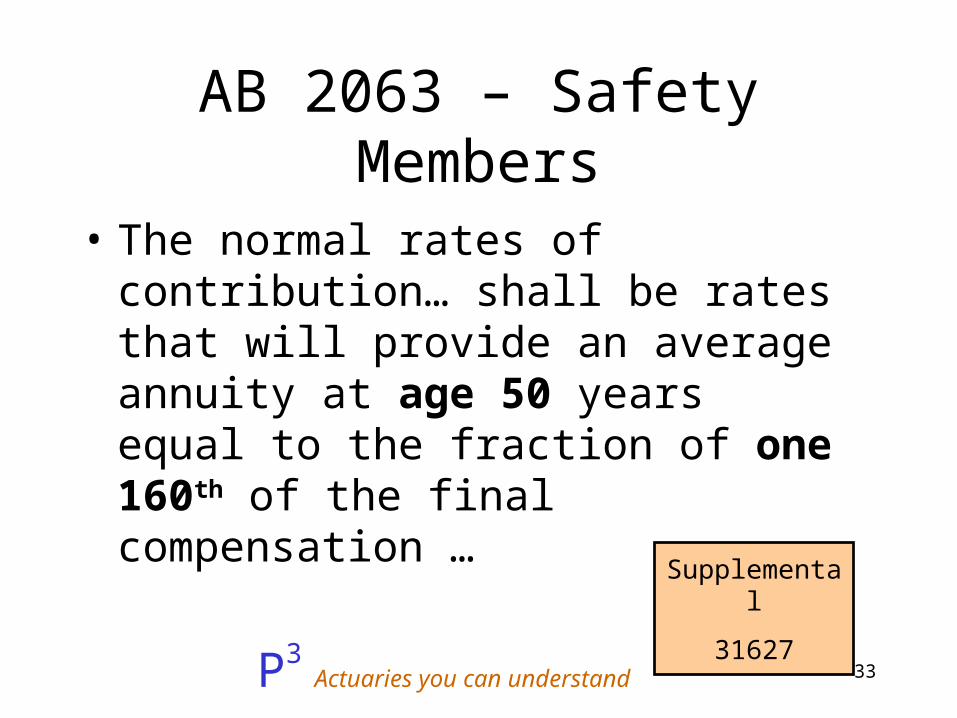
AB 2063 – Safety Members
• The normal rates of contribution… shall be rates that will provide an average annuity at age 50 years equal to the fraction of one 160th of the final compensation …
Supplemental
31627
34P3 Actuaries you can
understand
Actuarial Assumptions
• What are they?
• How do we set them?
• What are others doing?
• What are our recommendations?
35P3 Actuaries you can
understand
Assumptions
• Best guess of what will happen in the future

36P3 Actuaries you can
understand
Economic Assumptions
• Describe impact on money
• InflationSalary IncreasesReturn on InvestmentsCost-of-Living Adjustments

37P3 Actuaries you can
understand
Demographic Assumptions
• Describe member movement from one category to another
• TerminationDisabilityRetirementDeath
38P3 Actuaries you can
understand
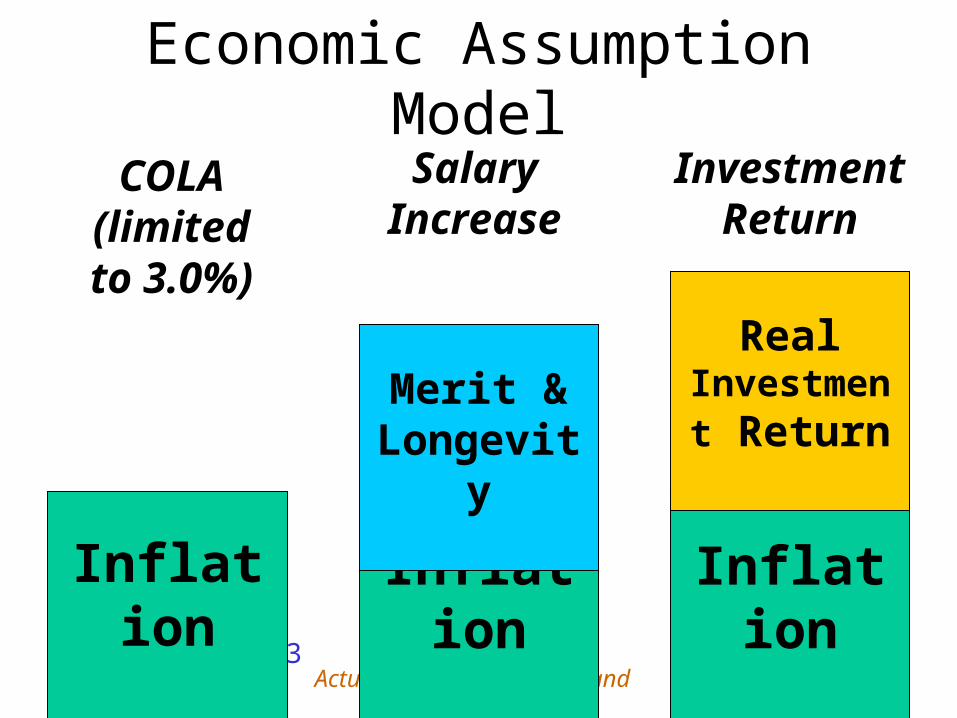
Economic Assumption Model
Inflation Inflation Inflation
Merit & Longevity
Real Investment
Return
COLA (limited to 3.0%)
Salary Increase
Investment Return
39P3 Actuaries you can
understand
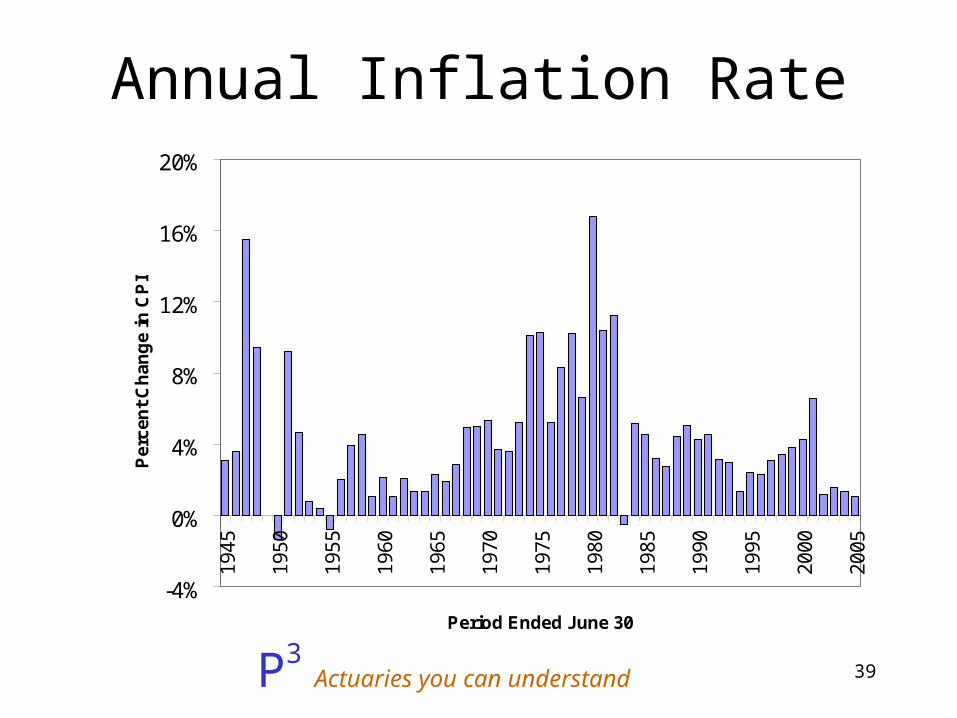
Annual Inflation Rate
-4%
0%
4%
8%
12%
16%
20%
1945
1950
1955
1960
1965
1970
1975
1980
1985
1990
1995
2000
2005
Period Ended June 30
Per
cen
t C
han
ge
in C
PI
40P3 Actuaries you can
understand
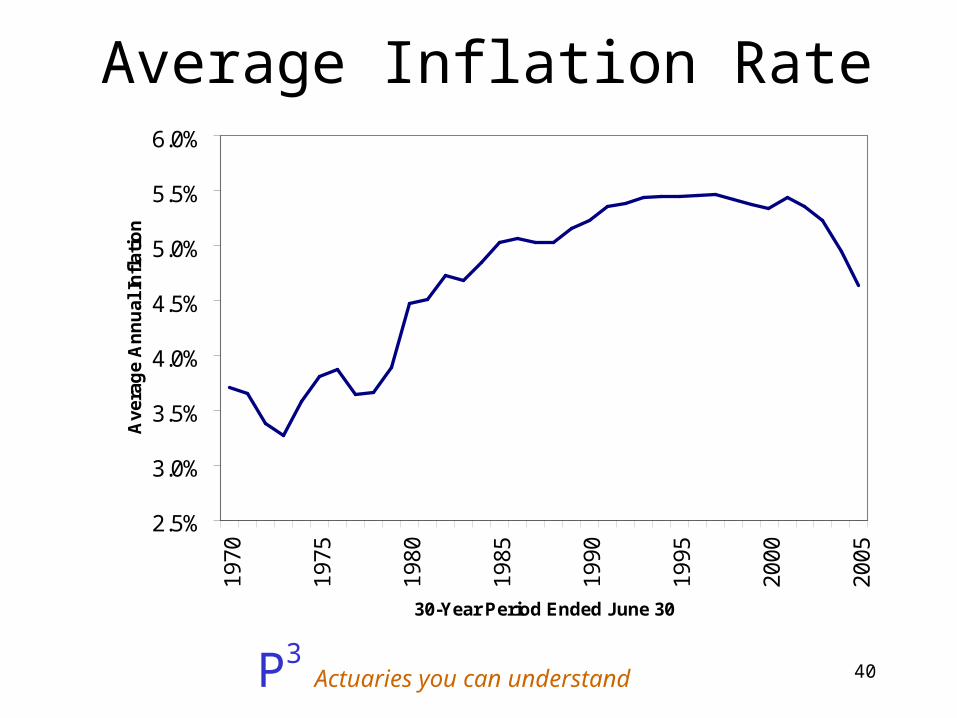
Average Inflation Rate
2.5%
3.0%
3.5%
4.0%
4.5%
5.0%
5.5%
6.0%
1970
1975
1980
1985
1990
1995
2000
2005
30-Year Period Ended June 30
Ave
rag
e A
nn
ual
Infl
atio
n
41P3 Actuaries you can
understand
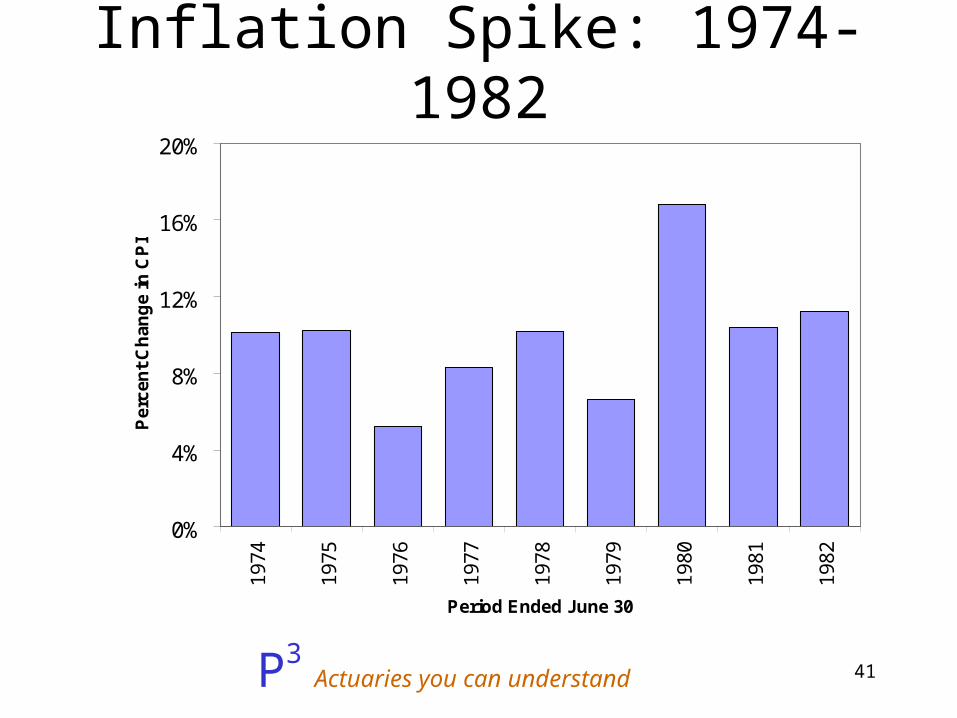
Inflation Spike: 1974-1982
0%
4%
8%
12%
16%
20%
1974
1975
1976
1977
1978
1979
1980
1981
1982
Period Ended June 30
Per
cen
t C
han
ge
in C
PI
42P3 Actuaries you can
understand
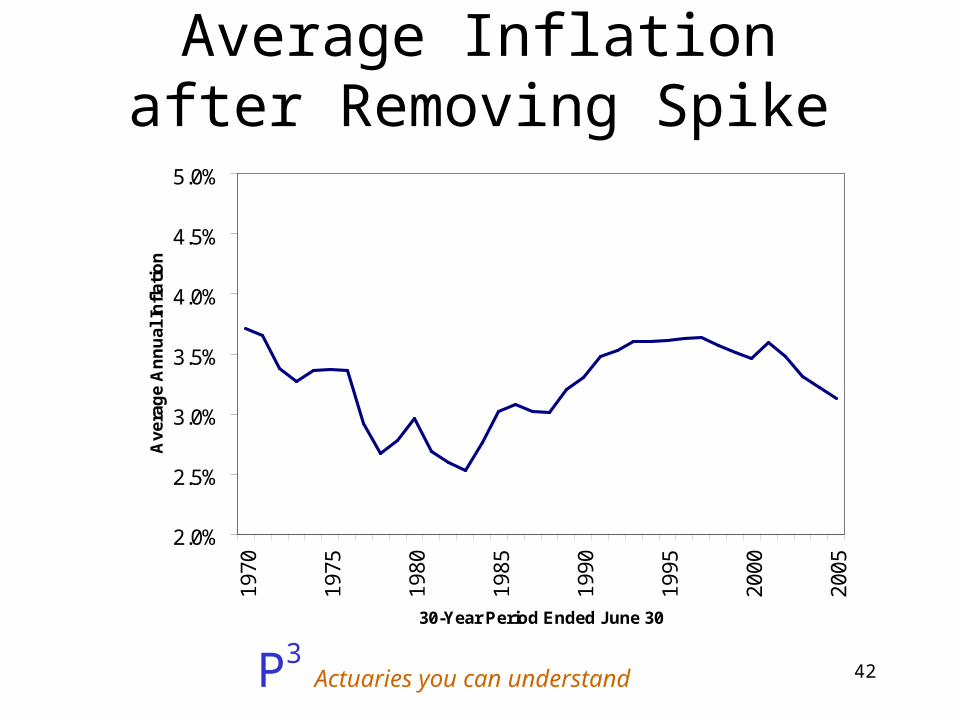
Average Inflation after Removing Spike
2.0%
2.5%
3.0%
3.5%
4.0%
4.5%
5.0%
1970
1975
1980
1985
1990
1995
2000
2005
30-Year Period Ended June 30
Ave
rag
e A
nn
ual
Infl
atio
n
43P3 Actuaries you can
understand
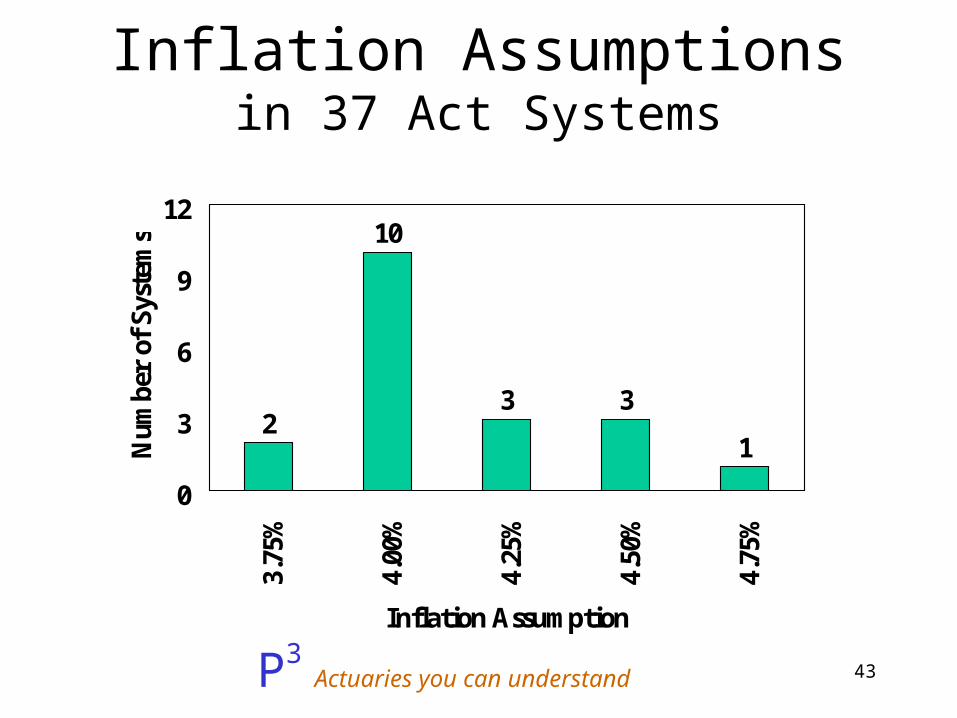
Inflation Assumptionsin 37 Act Systems
2
10
3 3
1
0
3
6
9
12
3.75
%
4.00
%
4.25
%
4.50
%
4.75
%
Inflation Assumption
Num
ber
of S
yste
ms
44P3 Actuaries you can
understand
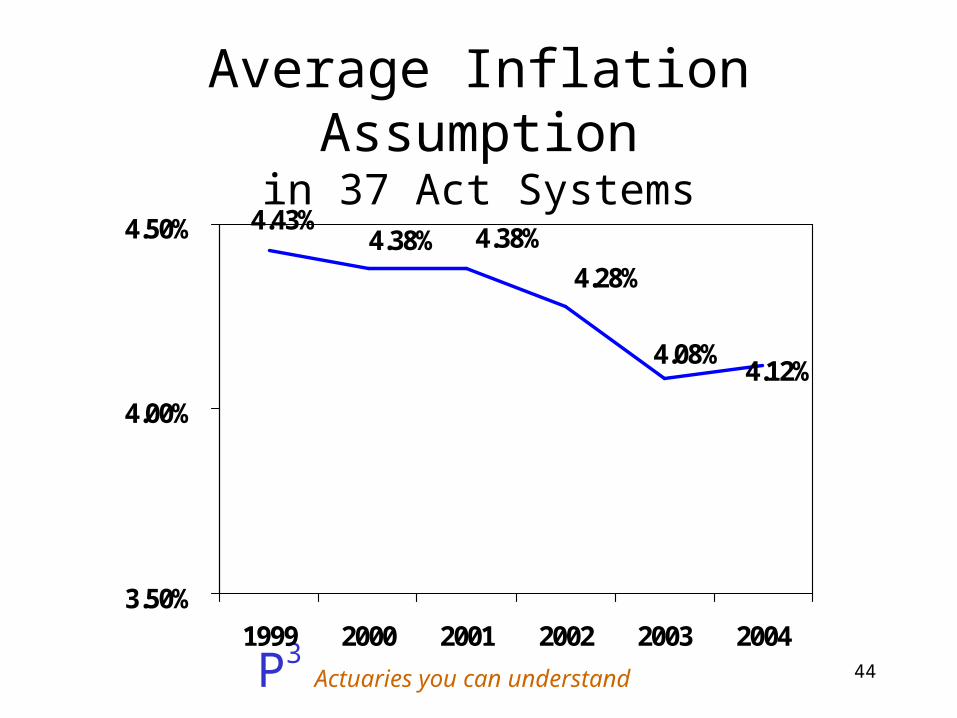
Average Inflation Assumptionin 37 Act Systems
4.12%4.08%
4.28%
4.38%4.38%4.43%
3.50%
4.00%
4.50%
1999 2000 2001 2002 2003 2004

45P3 Actuaries you can
understand
Inflation Assumption
• Current4.00%
• Reasonable Range 3.00% - 5.00%
46P3 Actuaries you can
understand
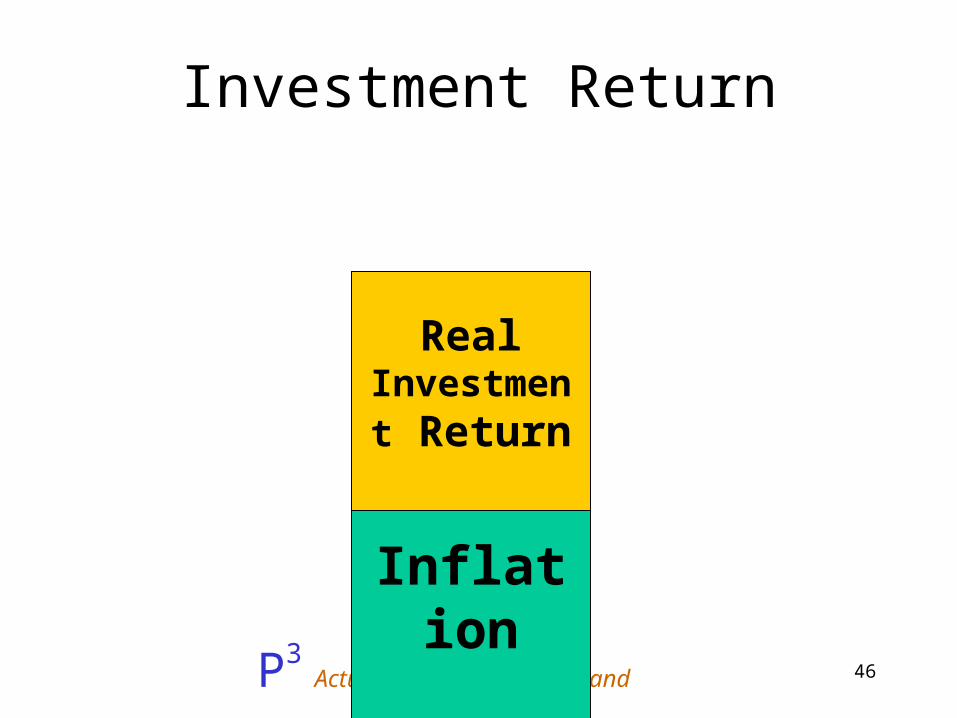
Investment Return
Inflation
Real Investment
Return

47P3 Actuaries you can
understand
Real Investment Return
• Over 90% of Real Investment Return due to asset allocation
48P3 Actuaries you can
understand
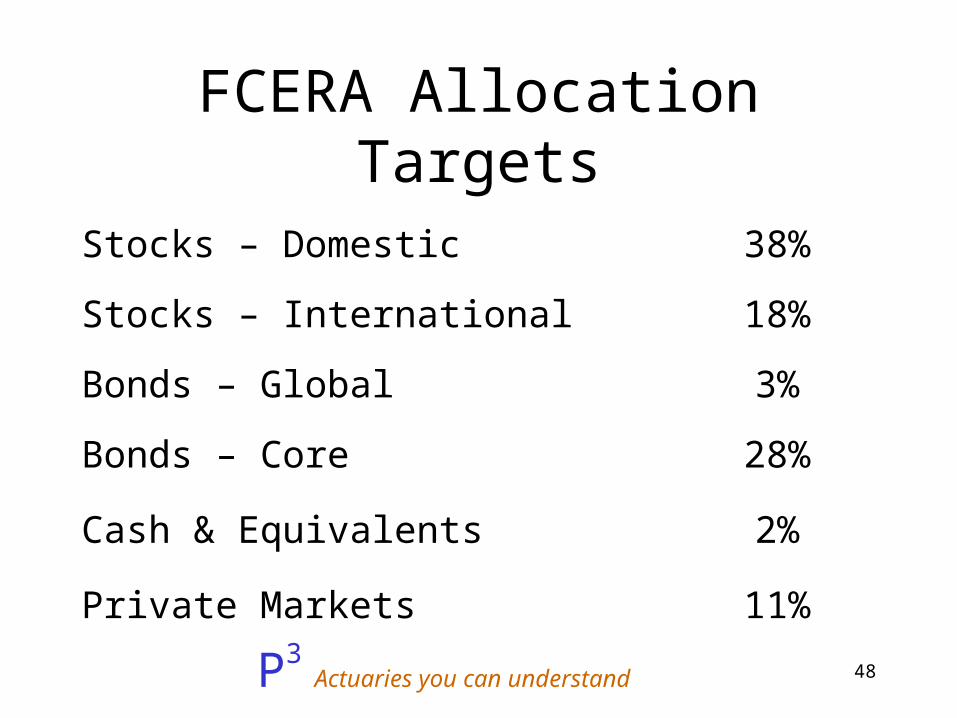
FCERA Allocation Targets
Stocks – Domestic 38%
Stocks – International 18%
Bonds – Global 3%
Bonds – Core 28%
Cash & Equivalents 2%
Private Markets 11%
49P3 Actuaries you can
understand
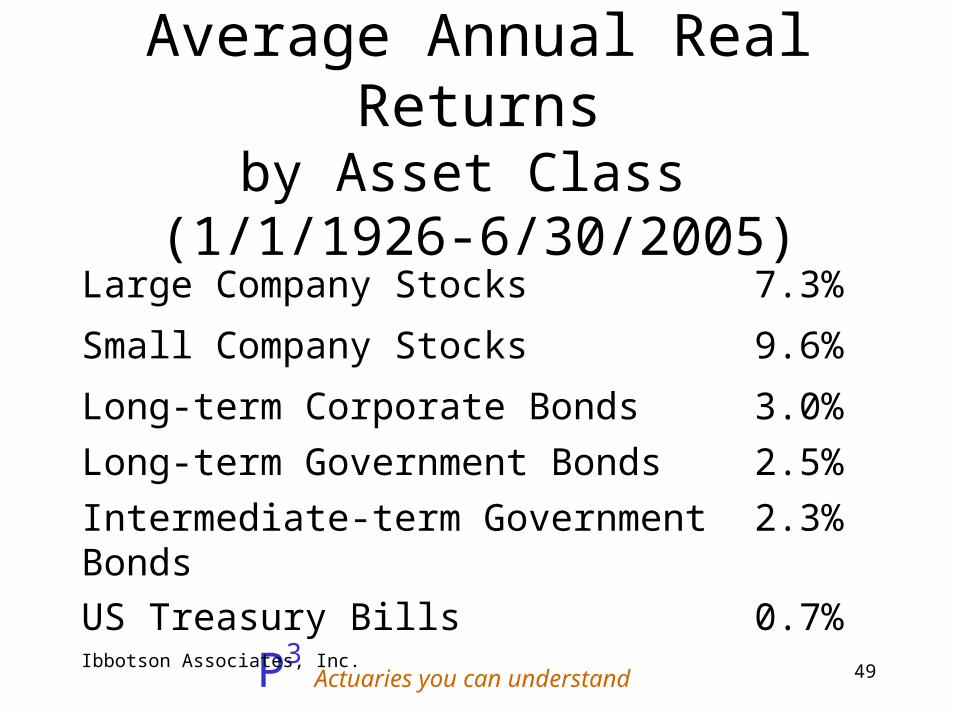
Average Annual Real Returnsby Asset Class
(1/1/1926-6/30/2005)
Large Company Stocks 7.3%
Small Company Stocks 9.6%
Long-term Corporate Bonds 3.0%
Long-term Government Bonds 2.5%
Intermediate-term Government Bonds 2.3%
US Treasury Bills 0.7%Ibbotson Associates, Inc.

50P3 Actuaries you can
understand
Real Investment Return in 37 Act Systems
1 1
32
3
7
1 1
0
3
6
9
3.25% 3.50% 3.66% 3.75% 3.90% 4.00% 4.16% 4.25%
Real Investment Return Assumption
Num
ber
of S
yste
ms

51P3 Actuaries you can
understand
Average Real Investment Assumption
3.90%
3.96%
3.80%3.81%3.82%
3.73%
3.50%
3.75%
4.00%
1999 2000 2001 2002 2003 2004
52P3 Actuaries you can
understand
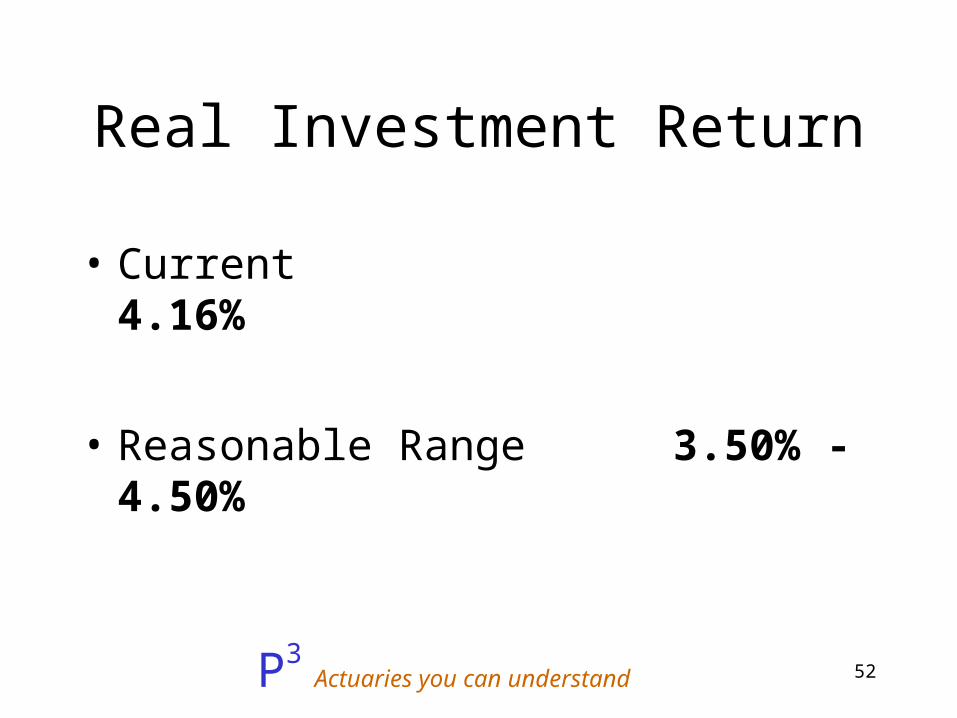
Real Investment Return
• Current4.16%
• Reasonable Range 3.50% - 4.50%
53P3 Actuaries you can
understand
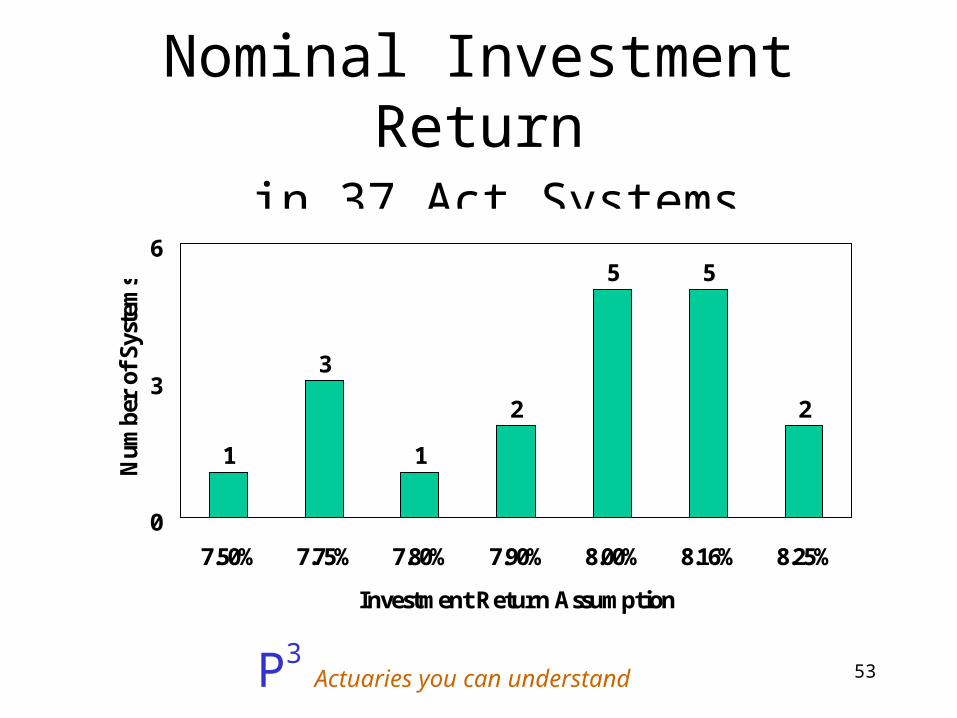
Nominal Investment Return in 37 Act Systems
1
3
1
2
5 5
2
0
3
6
7.50% 7.75% 7.80% 7.90% 8.00% 8.16% 8.25%
Investment Return Assumption
Num
ber
of S
yste
ms
54P3 Actuaries you can
understand
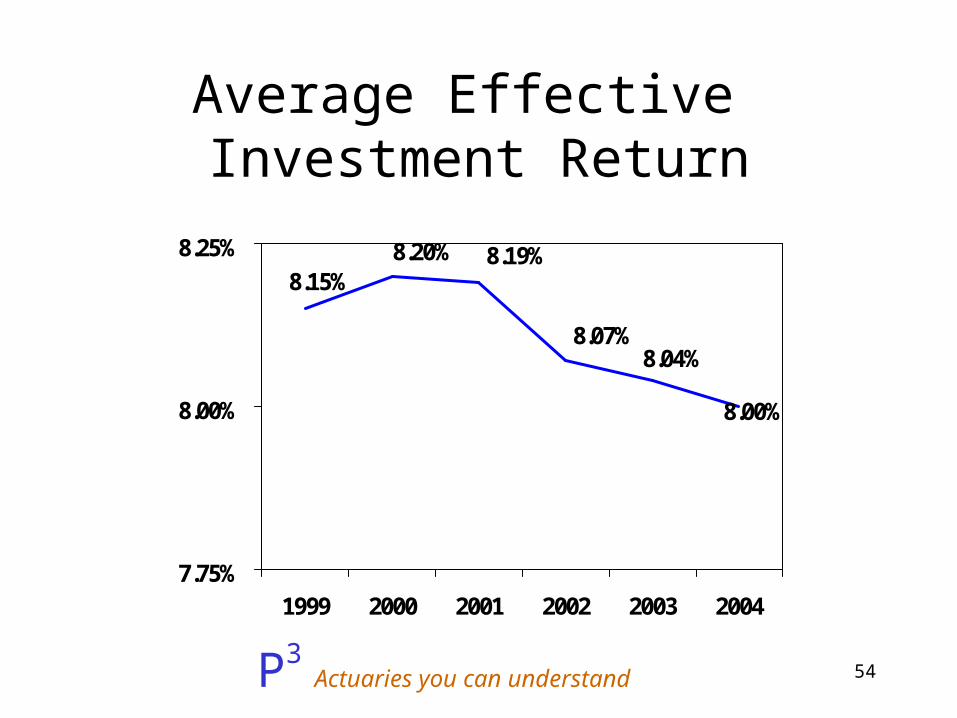
Average Effective Investment Return
8.00%
8.04%8.07%
8.19%8.20%8.15%
7.75%
8.00%
8.25%
1999 2000 2001 2002 2003 2004
55P3 Actuaries you can
understand
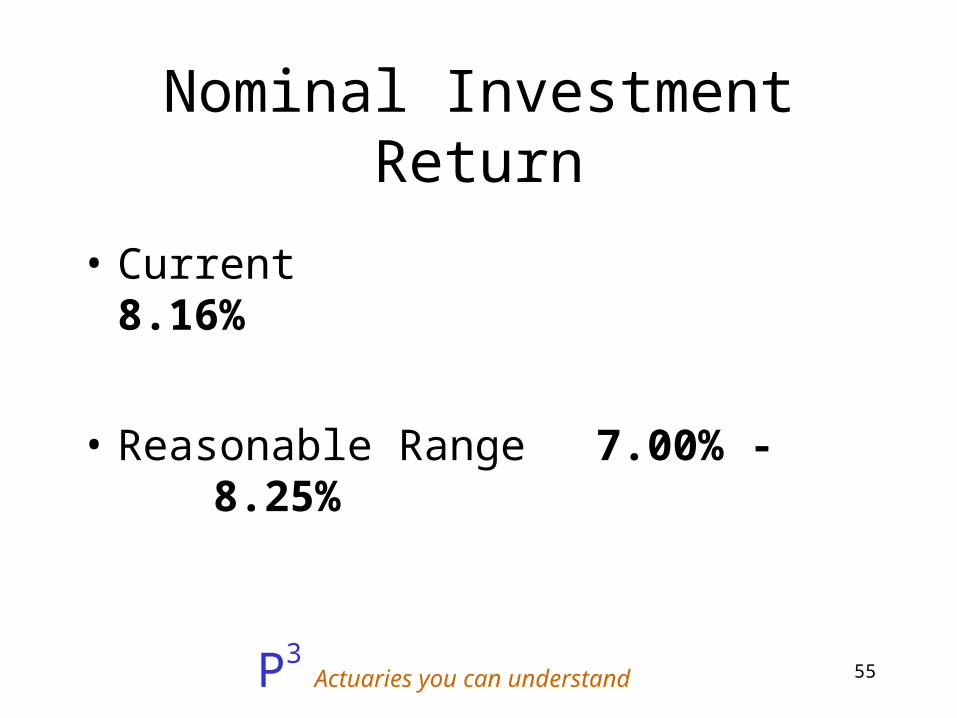
Nominal Investment Return
• Current8.16%
• Reasonable Range 7.00% - 8.25%

56P3 Actuaries you can
understand
Questions