p a g e | ptca capcoa re… · p a g e | 3 table of contents executive summary 4 air districts‟...
TRANSCRIPT


P a g e | 2
CALIFORNIA’S AIR DISTRICTS Air Pollution Control Officers and Air District Websites
For more information please visit www.capcoa.org
Jim McHargue
Amador County Air Pollution
Control District (APCD)
http://www.co.amador.ca.us
Eldon Heaston
Antelope Valley Air Quality
Management District (AQMD)
www.avaqmd.ca.gov
Jack Broadbent
Bay Area AQMD
www.baaqmd.gov
Jim Wagoner
Butte County AQMD
www.bcaqmd.org
Brian Moss
Calaveras County APCD
envhmgmt.calaverasgov.us
Joseph Damiano
Colusa County APCD
www.colusanet.com/apcd
Dave Johnston
El Dorado County AQMD
www.edcgov.us/AirQualityManagement
Glen Stephens
Eastern Kern APCD
www.kernair.org
Christopher D. Brown
Feather River AQMD
www.fraqmd.org
Jim Donnelly
Glenn County APCD
www.countyofglenn.net
Phill Kiddoo
Great Basin APCD
www.gbuapcd.org
Brad Poiriez
Imperial County APCD
www.co.imperial.ca.us/AirPollution
Doug Gearhart
Lake County AQMD
www.lcaqmd.net
Dan Newton
Lassen County APCD
www.lassenair.org
Charles Mosher
Mariposa County APCD
www.mariposacounty.org
Robert A. Scaglione
Mendocino County AQMD
www.mendoair.org
Joe Moreo
Modoc County APCD
www.co.modoc.ca.us
Eldon Heaston
Mojave Desert AQMD
www.mdaqmd.ca.gov
Richard Stedman
Monterey Bay Unified APCD
www.mbuapcd.org
Brian Wilson
North Coast Unified AQMD
www.ncuaqmd.org
Gretchen Bennitt
Northern Sierra AQMD
www.myairdistrict.com
Susan Klassen
Northern Sonoma County APCD
http://sonomacounty.ca.gov
Tom Christofk
Placer County APCD
http://www.placer.ca.gov
Larry Greene
Sacramento Metropolitan AQMD
www.airquality.org
Bob Kard
San Diego County APCD
www.sdapcd.org
Seyed Sadredin
San Joaquin Valley Unified APCD
www.valleyair.org
Larry Allen
San Luis Obispo County APCD
www.slocleanair.org
Dave Van Mullem
Santa Barbara County APCD
www.sbcapcd.org
Richard W. Simon
Shasta County AQMD
www.co.shasta.ca.us
Patrick Griffin
Siskiyou County APCD
www.co.siskiyou.ca.us
Barry Wallerstein
South Coast AQMD
www.aqmd.gov
Alan Abbs
Tehama County APCD
www.tehcoapcd.net
Gary W. Stockel
Tuolumne County APCD
www.tuolumnecounty.ca.gov
Mike Villegas
Ventura County APCD
www.vcapcd.org
Mat Ehrhardt
Yolo-Solano AQMD
www.ysaqmd.org

P a g e | 3
TABLE OF CONTENTS
EXECUTIVE SUMMARY 4
AIR DISTRICTS‟ SUCCESSES IN 2014 5
PUBLIC HEALTH BENEFITS OF CLEAN AIR 6
CHALLENGES AHEAD 7
AIR DISTRICT UPDATES 11
APPENDICES
APPENDIX A − UNDERSTANDING THE AIR QUALITY INDEX 48
APPENDIX B − AQI FOR OZONE 49
APPENDIX C − AQI FOR PARTICULATE MATTER 52
APPENDIX D − EXCEEDANCES: OZONE 56
APPENDIX E − OZONE AIR QUALITY 58
APPENDIX F − EXCEEDANCES: PM2.5 61
APPENDIX G − PARTICULATE MATTER AIR QUALITY 64
MAP OF CALIFORNIA‟S AIR DISTRICTS 67

P a g e | 4
EXECUTIVE SUMMARY
The California Air Pollution Control Officers‟ Association (CAPCOA) represents the 35 local
air districts throughout California. This report provides information from these agencies on
California‟s progress toward cleaner air in 2014 as well as challenges that remain in
meeting health-based air quality standards in the future.
The activities of the local air districts along with the air quality statistics documented in this
report demonstrate an ongoing trend of air quality improvement across the state. These
improvements have occurred in spite of significant growth of the state‟s population,
economy, and registered vehicles over the same time period. Since 1990, California‟s
population increased by 29 percent, registered vehicles increased by 32 percent and the
economy grew by 83 percent. During the same time span, statewide emissions of smog-
forming pollutants decreased by over 50 percent. In addition, emissions of toxic air
contaminants and the resulting cancer risk to residents have been cut by 80 percent since
1990. The California Air Resources Board estimates that 63 percent of Californians now
reside in areas that meet the federal standard for ozone, compared to only 24 percent in
1990.1
1 http://www.arb.ca.gov/aqd/almanac/almanac13/almanac13.htm
29% 32%
83%
-80%
-50%
-100%
-80%
-60%
-40%
-20%
0%
20%
40%
60%
80%
100%
Ch
ange
fro
m 1
99
0 t
o P
rese
nt
Air Pollution Reductions in CA in Spite of Growth

P a g e | 5
These substantial reductions in harmful air pollutants are the result of a comprehensive air
pollution control strategy implemented by local air districts and the state of California.
Thanks to California‟s strong vehicle emissions requirements and motor fuel standards,
new cars and trucks emit only a small fraction of the pollution they did 20 years ago.
Likewise, local air districts have adopted, implemented and enforced regulations that have
reduced emissions from most industrial and commercial sources by 90 percent or more.
Through state funding, local air districts also have provided hundreds of millions of dollars
in incentives and grants to replace old, dirty diesel trucks and other equipment with
cleaner-burning models.
Although the progress toward clean air
has been quite remarkable, the quest for
clean air continues. The challenges ahead
seem daunting: California‟s current
drought has significantly impacted levels
of PM2.5; climate change threatens to
undo years of clean air progress and
ongoing medical research indicates that
the health effects of air pollution have
been previously underestimated. As a
result, the federal government has
proposed once again to strengthen the
health-based standard for ground-level
ozone. Achieving this new standard will require further reductions of smog-forming
pollutants on top of regulations that are already among the strictest in the nation. In areas
with the highest level of air pollution, including Southern California and the San Joaquin
Valley, achieving proposed air quality standards calls for a transformation of our
combustion-driven society to zero- and near-zero emission sources of transportation and
energy.
Unhealthful air quality causes myriad health problems for Californians, from increased
hospital and emergency room visits to increased risk of heart attacks and a higher number
of premature deaths. Conversely, as air quality improves, Californians are living healthier
lives. A study just published in the New England Journal of Medicine showed that air quality
improvements in Southern California were associated with stronger lung growth in youth.
Earlier studies have shown that the economic benefit of these expected health benefits is
greater than the costs of air pollution control.

P a g e | 6
AIR DISTRICTS’ SUCCESSES IN 2014 In addition to the overall long-term trend of improved air quality across the state, some air
districts met air quality standards for PM2.5 and PM10 in 2014. The Yuba City-Marysville
area of the Feather River air district achieved the 2006 federal PM2.5 standard. For PM10,
the Trinity and Del Norte counties of North Coast Unified air district were designated in
attainment of the federal PM10 standard.
Some air districts also succeeded in meeting ozone targets. The Antelope Valley and
Mojave Desert areas both attained the former federal 1-hour ozone standard. The Sutter
Buttes area of the Feather River air district attained the federal 2008 8-hour ozone
standard. For the San Diego area, 2014 was a record year as the county achieved its
lowest ozone design value ever (79 ppb over an 8-hour period). For the second time in
recorded history, the San Joaquin Valley experienced another full year in 2014 with no
violations of the 1-hour ozone standard (second year in a row). Three counties came close
to achieving the current ozone standard: San Luis Obispo area had three, Tuolumne County
had two and Yolo-Solano had just one exceedance of the federal 8-hour ozone standard in
2014.
In 2014, the California Air Resources Board (ARB) reclassified Glenn County in attainment
of both the state ozone and PM2.5 standards.
PUBLIC HEALTH BENEFITS OF CLEAN AIR Air pollution has serious health
repercussions for Californians.
Exposure to fine particulate
pollution causes myriad health
impacts, particularly for the
respiratory and cardiovascular
systems. Exposure to fine
particulates aggravates asthma
attacks and can amplify other lung
ailments such as emphysema and
chronic obstructive pulmonary
disease (COPD). A broad body of
scientific research has also linked

P a g e | 7
PM2.5 exposure to cardiovascular diseases.2
According to the most recent calculations from the ARB, exposure to current levels of
PM2.5 is responsible for an estimated 7,300 cardiopulmonary-related deaths per year in
California.3 The bulk of those deaths occur in the most polluted areas of the state: the
South Coast air basin (4,300 estimated deaths per year) and the San Joaquin Valley (1,300
estimated deaths per year). Improving our air quality will save lives.
Cleaner air also reduces hospital visits. A 2010 study estimated that air pollution in the
San Joaquin Valley and South Coast air basin was responsible for 30,000 hospital visits
from 2005-2007. Statewide, the impacts of air pollution caused an estimate $193 million
in medical costs during that three-year period.4
A recent study by University of Southern California (USC) scientists responsible for the
landmark Children‟s Health Study found that lung growth improved as air pollution
declined during a 20-year-period for children aged 11 to 15 in five Southern California
communities.5
Finally, there is a substantial economic benefit in cleaning up our air. A 2008 study
estimated $22 billion annually in monetary value associated with air pollution health
effects in the South Coast Air Basin and $6 billion annually in the San Joaquin Valley.6 The
Bay Area AQMD‟s 2010 Clean Air Plan estimates up to $1.5 billion in benefits annually in
reduced medical costs, increased life expectancy and reduced impacts of climate change
as air pollution control measures are implemented.7 Multiple studies have shown that the
economic benefits of reduced medical costs, increased productivity due to improved health
and decreased mortality rates far exceed the cost of pollution control measures.
2 U.S. EPA. Integrated Science Assessment for Particulate Matter (Final Report). U.S. Environmental Protection Agency, Washington, DC, EPA/600/R-08/139F, 2009 See: http://cfpub.epa.gov/ncea/isa/recordisplay.cfm?deid=216546
3 “Estimated cardiopulmonary mortality by air basin associated with PM2.5 exposure.” California Air Resources Board, Health and Exposure Branch. February 3, 2015.
4 RAND Corporation. “Dirty air in California causes millions worth of medical care each year, study finds.” Science Daily. Science Daily, 5 March 2010. See: http://www.sciencedaily.com/releases/2010/03/100302083456.htm
5 “Association of Improved Air Quality with Lung Development in Children,” W.J. Gauderman et al., New England Journal of Medicine, Vol. 372, No. 10, March 5, 2015
6 Hall, J., Brajer and F. Lurmann. (2008). Benefits of Meeting Federal Clean Air Standards in the South Coast and San Joaquin Valley Air Basins. California State University-Fullerton. See: http://publichealth.lacounty.gov/mch/AsthmaCoalition/docs/BenefitsofMeetingCleanAirStandards_11_06_08.pdf
7 Bay Area 2010 Clean Air Plan (2010). Bay Area Air Quality Management District. See: http://www.baaqmd.gov/Divisions/Planning-and- Research/Plans/Clean-Air-Plans.aspx

P a g e | 8
CHALLENGES AHEAD California‟s air districts will face additional challenges in 2015 as they continue working to
reduce emissions and improve public health.
CALIFORNIA’S ONGOING DROUGHT The persistent drought plaguing California affects our air
quality. The absence of rain leads to drier ground
surfaces, and thus vehicles kick up more fugitive dust on
roads and strong winds blow loose soil from areas such
as dry lakebeds and fallow fields. Fugitive dust can boost
concentrations of both coarse and fine particulates. This
problem is most acute in the more rural areas of
California, where there are tens of thousands of miles of
unpaved roads.
The drought also increases the need for mechanical water pumping in lieu of natural
irrigation, and many pumps throughout the state still operate on highly polluting diesel
fuel. Drier conditions also reduce the natural cleansing effect of precipitation. And the lack
of windy, unstable weather conditions during storms can result in longer episodes of
stagnant air when particulate pollution builds up and reaches unhealthful levels.
Finally, the drought has been linked to increased frequency and intensity of wildfires
throughout the state. Wildfire smoke contains toxic air contaminants and can quickly
create high levels of fine particulates. In addition, large fires can also boost ozone
production.
NEW SCIENCE OF TOXIC RISKS California has successfully reduced risks from airborne toxic pollutants by 80 percent since
1990. But we are learning more about how toxic air pollutants affect humans.
Research analyzed by the state‟s Office of Environmental Health Hazard Assessment
(OEHHA) has found that previous methodologies underestimated the health risk of cancer-
causing air pollutants. While emissions of these pollutants have been ratcheted down
significantly, the new methodologies suggest that continued efforts are vital to lower the
risk of airborne toxics.

P a g e | 9
Individual air districts, CAPCOA and the ARB are working together to develop policies, rule
amendments and outreach plans to address these new findings and better protect public
health from toxic air contaminants.
TOUGHER FEDERAL OZONE STANDARDS In November 2014, based on a wealth of scientific evidence, the U.S. Environmental
Protection Agency (U.S. EPA) proposed lowering the federal 8-hour standard for ground-
level ozone to make it more health-protective. EPA proposed changing the standard from
the current 75 parts per billion (ppb) to a level in the range of 65 ppb to 70 ppb. Since
most populated areas of California do not meet the current 8-hour ozone standard,
attaining a lower standard will be even more difficult and the challenges numerous.
The new standard, expected to be finalized in October 2015, will demand that the U.S. EPA,
the ARB and the air districts go even further to research the issues, analyze data and adopt
stricter emissions limits, develop incentive programs to achieve voluntary emissions
reductions and inform the public of strategies to improve our air quality. Though
compliance deadlines will be set years into the future, interim timelines for current
implementation plans add to the pressure to move quickly.
IMPACTS OF CLIMATE CHANGE The Earth‟s atmosphere is getting warmer due to man‐made emissions of carbon dioxide
and other greenhouse gases (GHGs). The increased atmospheric levels of greenhouse

P a g e | 10
gases along with other climate forcers such as black carbon are causing global warming
that is already being experienced in California and throughout the world. We are now
forced to adapt to climate changes including rising sea levels, disruptions in natural
resource availability, increases in the frequency and intensity of wildfires, severity of
droughts, extreme weather patterns and much more.
Climate change also has a direct impact on air quality in California, primarily through
increasing atmospheric temperatures and changing weather patterns. Research suggests
that global warming caused by world‐wide emissions of GHGs impacts ozone levels
through any and all of the following:
higher temperatures;
longer and more frequent heat waves;
more frequent severe temperature spikes;
increased length of the ozone season;
increased VOC emissions from trees and other biogenic sources of VOCs, such as
isoprene and monoterpenes, due to higher temperatures;
increased evaporative emissions of VOCs from storage tanks, solvents, motor
vehicles, and other sources;
change in the ratio of VOC to NOx in the atmosphere;
increased atmospheric water vapor, higher humidity; and
reductions in wind and vertical mixing that disperse pollutants.
All of these impacts will result in more frequent multi-day, high-ozone episodes.
Climate change is also likely to increase PM and other pollutants as well. For example,
increased demand for air conditioning in buildings and vehicles may cause higher
emissions of direct PM and PM precursors such as NOx and SO2 from power plants and
vehicle engines. Drought may lead to higher emissions due to fugitive dust and mechanical
irrigation. Increased wildfire activity could also make dangerous smoke impacts more
common.
The impacts of climate change have the potential to slow or reverse the remarkable
progress made by local air districts and the state to clean up our air.

P a g e | 11
AIR DISTRICT UPDATES
The following summaries are provided by California‟s local air districts and highlight the
successes and future challenges facing the air districts in meeting air quality standards.
ANTELOPE VALLEY AIR QUALITY MANAGEMENT DISTRICT
In 2014, the Antelope Valley‟s air quality attained the 1-hour National Ambient
Air Quality Standard (NAAQS) for ozone, after three consecutive calendar years
of certified air monitoring data collected within the Antelope Valley Air Quality
Management District‟s boundaries. Although the 1-hour standard was revoked by the U.S.
EPA in 1997 and replaced by a more stringent 8-hour standard, many regions - including
the AVAQMD - continued to have regulatory obligations under the former standard. Due to
the continued impact of transport emissions on the region, the recently proposed 65 to 70
ppb federal ozone standard is likely to present a renewed challenge to the air district‟s
attainment status.
The transfer of emission reduction credits required for the construction of the Palmdale
Hybrid Power Plant remains entwined in litigation. Air quality permits were issued by the
air district to BYD, an electric bus and battery manufacturer, and to Kinkisharyo
International, a light rail car manufacturer for newly established manufacturing facilities in
the Antelope Valley.
In response to increased solar development in the Antelope Valley, the AVAQMD partnered
with First Solar, the Antelope Valley Resource Conservation District and the City of
Lancaster to implement a Solar Array Dust Suppression Study which identified best
practices and long-term stabilization strategies appropriate for High Desert photovoltaic
solar developments.

P a g e | 12
The AVAQMD‟s Alternative Fuel Vehicle Incentive Program - which offers a rebate to
Antelope Valley residents who purchase or lease an electric, plug-in electric, hybrid or
compressed natural gas vehicle from a local auto dealership - continued to flourish. In
2014, 113 residents received rebates through the popular program, which represented a
71 percent increase from the eight vehicles sold in 2011 during the first year of the
program.
In early 2014, the AVAQMD Governing Board voted to increase the amount of Mobile
Source Emission Reduction Program funds allocated to the cities of Lancaster and
Palmdale from $75,000 to $100,000 per year. The vote included a provision to allocate 50
percent of these funds toward improved traffic synchronization efforts.
In September, the Antelope Valley Transit Authority was presented with the Wm. J. “Pete”
Knight Memorial AIRE (Achievement in Reducing Emissions) Award for introducing zero-
emission electric bus technology to the Antelope Valley. The AVAQMD continued to bring
STEM-based education resources to Antelope Valley educators through its collaboration
with the Mojave Environmental Education Consortium (MEEC).
BAY AREA AIR QUALITY MANAGEMENT DISTRICT
The Bay Area Air Quality Management District celebrated several firsts in
2014. In March, data from the air district‟s first of three permanent air
monitoring sites located along major Bay Area freeways was made available online. The
new air monitors were set up in an effort to better understand the health effects of traffic-
related air pollution. This effort was an outgrowth of regulations amended by the U.S. EPA
to require air districts in higher population areas to monitor pollutants near heavily traveled
roadways.
The air district, working with ARB, Wind & Wing Technologies and others, launched in
February a program to test a catamaran sailboat outfitted with a 40-foot tall rigid WingSail.
The wind-assisted ferry demonstration project was designed to test the novel idea of using
wind assistance to help propel passenger ferry vessels of the future − reducing fuel use
and air pollution.
In August, the air district celebrated the one-year anniversary of Bay Area Bike Share, a
last-mile commute solution system launched with 700 bicycles at 70 stations in San
Francisco, Redwood City, Mountain View, Palo Alto and San Jose, within three counties
along the Bay Area peninsula. In the first 365 days, 5,000 annual members and 28,000
casual members joined Bay Area Bike Share, pedaling a combined total of 630,000 miles
– equivalent to 25 times around the earth.

P a g e | 13
The air district continued a comprehensive grant program to reduce mobile source
emissions from heavy-duty trucks and funded an array of projects to improve air quality in
the region. The focus in 2014 was on on-road trucks as well as other diesel-powered
equipment.
The air district awarded its first grant for zero-emission equipment at a major Bay Area
airport to Southwest Airlines for the purchase of three electric aircraft ground support
tow/tugs that will operate at the San Jose Airport. Ground support tow/tug equipment is
used to service aircraft between flights, to help move aircraft within the terminal area and
facilitate loading operations for cargo and passengers.
As part of the air district‟s ongoing focus on refinery emissions, in October the Board of
Directors adopted a resolution that outlines an ambitious approach to both track and
further reduce refinery emissions through an aggressive implementation schedule.
Included in the resolution is a goal to reduce refinery emissions by 20 percent or as much
as feasible which will further protect Bay Area communities by committing the agency to
develop a strategy to achieve further emission reductions from petroleum refineries. The
air district will continue to
prepare its Petroleum Refining
Emissions Tracking rule, which
will require updated health risk
assessments and add further
fence-line and neighborhood
monitoring capacity, as well as
require the compilation of an
annual emission inventory. The
air district will also continue to
prepare a companion rule to set
emissions thresholds and
mitigate potential increases at
refineries.

P a g e | 14
In March, the air district, in
partnership with the Metropolitan
Transportation Commission (MTC)
approved the launch of the Bay
Area Commuter Benefits Program,
a joint pilot program that requires
employers with 50 or more full-
time employees in the Bay Area to
offer commuter benefits to their
employees. The program was
developed in response to Senate
Bill 1339, which was signed into
law by Governor Brown in
September 2012. The program
goal is to reduce greenhouse gas
emissions and traffic congestion by using the federal tax code to encourage employees to
commute via alternatives to driving alone. The law is designed to give employers various
options for compliance, including simply offering their employees the ability to pay for
transit or vanpooling with pre-tax dollars, which can save both employers and employees
money through lower taxes. The program was modeled on commuter benefit ordinances
established in 2009 in San Francisco, Berkeley and Richmond, as well as at San Francisco
International Airport.
In April, the air district released the Community Air Risk Evaluation (CARE) Program
summary report which outlined the results of a nearly decade-long effort to analyze the
effect of toxic air pollutants on more highly impacted Bay Area communities and focus air
pollution reduction measures in these areas. The report was an outgrowth of a close
collaboration between air district staff and members of a task force that included
environmental groups, community members, researchers, and local health and planning
departments. Over the years, the CARE program has introduced many new approaches for
understanding and reducing air pollution problems.
Wildfires continued to produce smoke and fine particle emissions that choked Bay Area
skies. In September, three smoke advisories were issued due to heavy smoke from the
Bully and Happy Camp Complex fires in Northern California.
The Bay Area Air Quality Management District Board of Directors approved a 10-Point
Climate Action Work Program, designed to guide and focus the air district‟s climate
protection activities and identify necessary resources for future action. This work program
was called for in the air district‟s Climate Protection Resolution, adopted in November
2013 and set as a goal the reduction of greenhouse gas emissions to 80 percent below

P a g e | 15
1990 levels by 2050. The Bay Area climate protection work program includes measures
for updating efforts for inventory, forecast, and monitoring GHGs, initiating development of
rules limiting GHG emissions, expanding enforcement and working with state, regional,
and local agencies as well as stakeholders to develop the Regional Climate Action
Strategy.
BUTTE COUNTY AIR QUALITY MANAGEMENT DISTRICT
Butte County Air Quality Management District faces a wintertime challenge in
reducing levels of PM2.5 due to wood stove and fireplace smoke. In response
to this, the air district has initiated a voluntary county-wide curtailment program, Check
Before You Light. The City of Chico, the largest municipality in the county, implemented a
mandatory curtailment program beginning with the 2011-12 season. An increase in media
attention and advisory notification requests indicate an increased public awareness of the
problem. No Check Before You Light advisories were issued in 2014, indicating a
combination of reduction in localized smoke impacts, public awareness and attention to
the curtailment program, and mild weather conditions.
Additionally, the air district began implementation of a three-
year wood-burning device change-out program in January
2014. A total of 321 change-outs have been completed to
date, with nearly 50 percent of those upgraded to low-
emission gas or pellet devices, and the remaining upgraded
to U.S. EPA-certified wood-burning devices. One more round
of funding remains in the program and is expected to begin
in August 2015.
The air district participates in the Carl Moyer Memorial Air
Quality Standards Attainment Program and continues
funding off-road equipment replacement projects in addition to on-road and stationary
source projects. Most of these projects occur within the agricultural community, which
makes up the predominant economy in Butte County. The air district also continued
accepting applications for Truck Improvement/Modernization Benefitting Emission
Reductions (TIMBER) Log Truck replacements.
At their October 2014 meeting, the air district‟s Governing Board approved an update to its
California Environmental Quality Act (CEQA) Air Quality Handbook, which includes
enhanced discussion of analysis and mitigation of criteria air pollutants and toxic air
contaminants and also expanded its discussion of the evaluation of greenhouse gases and
mitigation. At this time, the air district does not have screening criteria for greenhouse

P a g e | 16
gases but the handbook includes a discussion based on AB 32, requiring reduction of these
gases in California. The proposed amendments recognize projects that are consistent with
the goals, policies and actions of an approved local Climate Action Plan. Emissions
modeling has been updated to replace the previously recommended model (URBEMIS) to a
newer, more comprehensive model (CalEEMod).
COLUSA COUNTY AIR POLLUTION CONTROL DISTRICT
Colusa County APCD is part of an agricultural region located in the Sacramento
Valley, approximately 60 miles northwest of Sacramento. The air district
continues its efforts to improve air quality and protect public health and safety by working
with the agricultural industry and industrial businesses located within the air district. The
air district is in attainment for the federal 8-hour and state ozone standard, as well as
designated in attainment for the federal and state PM2.5 standards.
The air district continues to aid in the replacement of older stationary diesel agricultural
engines and off-road diesel equipment with funding from the Carl Moyer Program, which
includes the Off-road Equipment Replacement Program and the Off-road Voucher Incentive
Program. Air district information is available at: http://colusanet.com/apcd/.
EASTERN KERN AIR POLLUTION CONTROL DISTRICT
Located in the eastern portion of Kern County, Eastern Kern Air Pollution
Control District encompasses 3,700 square miles with a population of
approximately 130,000. The majority of the area within the air district includes high
elevation desert land with high wind conditions. Because of this, the air district is home to
many renewable energy project developments, including wind and solar plants. A total of
2,950 megawatts (MW) of wind energy
projects are currently in operation with an
additional 900 MW being proposed.
Additionally, 4,140 MW of solar energy
projects are in or pending operation with a
total of 770 MWs being proposed.
The challenge Eastern Kern air district
currently faces is to achieve the federal
PM10 and ozone standards, since the air
district is designated as non-attainment for

P a g e | 17
these pollutants. However, the air district has achieved attainment of all other federal
clean air standards including PM2.5. The table below shows the attainment status of these
standards.
Pollutant
Designation/Classification
National Ambient Air Quality Standards
(NAAQS) California
Ambient Air
Quality
Standards Indian Wells
Valley
Kern River/
Cummings
Valley
Balance of
Eastern Kern
Ozone 1-
hour Attainment Attainment Attainment
Non-
attainment
Ozone 8-
hour
Unclassifiable
/ Attainment
Non-
attainment/
Marginal
Non-
attainment/
Marginal
Non-
attainment
PM10 Attainment
Maintenance
Serious Non-
attainment
Unclassifiable/
Attainment
Non-
attainment
PM2.5 Unclassifiable
/ Attainment
Unclassifiable/
Attainment
Unclassifiable/
Attainment Unclassified
To help achieve and maintain federal PM10 standards, the ARB installed a PM10 monitor
in Canebrake (Kern River/Cummings Valley Planning Area), operated and maintained by
the air district. The data shows there have been no days exceeding the federal 24-hour
PM10 standard since 2009. Therefore, the air district believes U.S. EPA will designate Kern
River/Cummings Valley planning area as in attainment for PM10 in the near future.
Additionally, the air district plans to further reduce PM10 emissions from construction of
rapidly increasing solar energy projects by revising its Rule 402 -- Fugitive Dust.
Although the number of days exceeding the federal 8-hour ozone standard fluctuates every
year, a steady decrease in the 8-hour design values proves that the air district continues to
make great progress towards meeting the federal 8-hour ozone standard.
The air district also participates in a variety
of grant programs to reduce emissions, such
as the Carl Moyer Program, School Bus
Replacement Program (AB 923), and the
DMV Grant Program (AB 2766). During
2014, the air district funded two emergency
vehicles for fire stations with Carl Moyer
Program funding. The DMV AB 2766 grant
program provides funding for mobile source
emission-reduction projects. Almost
$325,000 was awarded for a variety of
emission reduction projects in 2014-2015.

P a g e | 18
EL DORADO COUNTY AIR QUALITY MANAGEMENT DISTRICT
El Dorado County air district is in the Mountain Counties and Lake Tahoe air
basins. The Mountain Counties portion is non‐attainment for the federal and state ozone
standards. The western portion is nearing federal PM2.5 attainment. Mountain Counties
and Lake Tahoe areas are non‐attainment for the state PM10 standard.
The air district implements an Online Burn Violators Training Course. Course completion
reduces penalties. Since implemented in 2013, over 100 residents have taken the course.
The course can be viewed at:
http://edcapps.edcgov.us/AirQualityManage
ment/BurnRuleTraining/traininghome.html
Air district staff conducts dust, odor
and no‐burn day patrols at priority sites
and responds to complaints 24 hours a
day, seven days a week.
Over 73 percent of the county is
national and private forest. Prescribed
burning and wildfires produce
significant particulate matter. A three
ton-per-day pilot biomass plant is
planned for 2015.
The air district‟s Chimney Smoke Reduction program provides $500 to $1,000 to replace
uncertified wood stoves with U.S. EPA-certified stoves and heaters. In 2014, 117
replacements were incentivized. The Tahoe Regional Planning Agency contributes funding
and the Tahoe Fund Organization may also contribute funding.
AB 2766 funds various projects and a Drive Clean program. Projects funded in 2014-2015
include shuttle, bicycle, vehicle and electric vehicle service equipment (EVSE) charging
stations. Drive Clean also provides $1,000 toward battery and plug-in hybrid vehicles for
residents commuting to work and school on sections of Highway 50 with carpool lanes,
thereby reducing congestion.
The air district recently received Indian Gaming and California Energy Commission grants.
The grants are funding Level 2 EVSE charging stations at Red Hawk Casino (10), Placerville
(11) and South Lake Tahoe government centers (4). The air district is working with Tesla
and Nissan to install Level 3 DC EVSE chargers at locations near Highway 50.

P a g e | 19
The air district received a Congestion Management Air Quality (CMAQ) grant. The grant will
help fund 40 new county fleet vehicle replacements with plug-in hybrids and additional
EVSE charging stations.
In 2014, the air district used AB 923 funds to retrofit 18 school buses and replace eight
school buses. The air district will begin implementing the Carl Moyer program in 2015. Air
district information is available at: http://www.edcgov.us/AirQualityManagement/.
FEATHER RIVER AIR QUALITY MANAGEMENT DISTRICT
The Feather River air district includes the counties of Yuba and Sutter in the
Sacramento Valley Air Basin. During 2000-2002, the air district had two ozone
monitors, one in Pleasant Grove and one in Yuba City. In 2012-2014, the air district had
only one monitor in Yuba City that records both ozone and PM2.5, and a special-purpose
ozone monitor located on top of the Sutter Buttes. This special-purpose monitor records
transport emissions from the metropolitan areas northward into the Sacramento Valley.
The monitor in Yuba City is indicative of air quality on both sides of the Feather River, so no
additional monitor has been installed on the Yuba County side.
The pending challenges for the air district include reducing emissions of PM2.5, PM10, and
ozone precursors in order to achieve and/or maintain federal and state air quality
standards. The southern portion of the air district falls within the Sacramento federal non-
attainment area for ozone. The air district has also been designated as non-attainment for
state ozone and PM10 standards.
The air district recently made significant
achievements in improving air quality. The Yuba
City-Marysville PM2.5 non-attainment area has
achieved the 2006 federal PM2.5 standard. In
2010, ARB changed the designation for Sutter and
Yuba Counties from non-attainment to non-
attainment-transitional, demonstrating that the air
district is moving closer to attaining the state
standard. Also, the Sutter Buttes non-attainment
area has been designated in attainment with the
federal 2008 ozone standard. Sutter Buttes has
been designated as a separate non-attainment area
since the location, at 2,000 feet above the valley floor, is not populated and not indicative
of air quality conditions where the population of the county resides. The air district

P a g e | 20
continues to work internally and with the Sacramento regional air districts to reduce ozone
through planning, outreach and regulatory controls.
GLENN COUNTY AIR POLLUTION CONTROL DISTRICT
The Glenn County air district maintains jurisdiction over an agricultural county
approximately 80 miles north of Sacramento. The air district is bordered by the
Mendocino National Forest in the west, the Sacramento River in the east, and is bisected
by Interstate 5. Challenges in this area include emissions related to freeway vehicles,
wildfires, agricultural burning of crop residue, and soil preparation activities. The air district
also faces the challenge of protecting public health and implementing all programs with a
staff consisting of one manager, one inspector, and one part-time staff member.
The air district is proud of the recent change in
attainment status for the area by ARB. The 2013
area designations for the state standards show
Glenn County air district has been re-classified to
attainment for both ozone and PM2.5.
The air district will continue to strive to protect
the comfort, repose, health and safety of the
residents and businesses of Glenn County.
Outreach information, including Carl Moyer
Program applications and contact information, is
available in the air district‟s Willows office and
on the air district‟s website at
http://www.countyofglenn.net/APCD.
IMPERIAL COUNTY AIR POLLUTION CONTROL DISTRICT
The air district continues its public outreach efforts by improving its air
monitoring network. Aside from installing newer, more accommodating
shelters, newer instruments have either been installed or will be installed during the first
part of 2015 for ozone, NOx, CO, and continuous PM monitoring. In addition to criteria
pollutant monitoring, the air district is installing hydrogen sulfide (H2S) monitors designed
to help establish baseline emissions for the receding Salton Sea. Other measures are
planned for capturing emissions affecting the northern section of Imperial County. To
support data capture, a visual support system will be put into place by the end of the first

P a g e | 21
quarter of 2015. The overall strategic design follows a north-to-south, east-to-west
placement to cover the entire county. Overall in 2014, the air district saw improvements in
PM2.5 levels but PM10 levels remained unchanged.
The air district continues to be intimately involved with studies conducted within Imperial
County and along the international border to better understand emissions impacts from
within the county and those associated with international transport. The active
participation of the air district with local community stakeholder groups and the Border
2020 program remain essential. Under the cooperative direction of the Imperial County -
Mexicali Air Quality Task Force, programs and studies are coordinated to better understand
international impacts. Overall, the main goal of the task force is to collaboratively identify
and prioritize air quality issues that affect the health and well-being of border
communities.
LAKE COUNTY AIR QUALITY MANAGEMENT DISTRICT
The Lake County air district includes all of Lake County. This includes all of the
Known Geothermal Resource Area (KGRA) in Lake County – the largest direct
steam geothermal power generation installation in the world. Air monitoring stations are
located in Lakeport, Glenbrook, Pine Summit, and Anderson Springs. The air district has
been in attainment of all of the federal and state standards since 1990 and is the only air
district and air basin in California to do so.
The air district‟s primary concerns are maintaining its clean air through a robust open burn
permitting and enforcement program, maintaining its ozone and PM monitoring network,
and conducting its stationary source permitting
and enforcement program. Lake County was
ranked the Cleanest County in the Nation for
PM2.5 by the American Lung Association in its
2013 and 2014 State of the Air Reports. The air
district has met and maintained this standard
without the benefit of vehicle license fees or other
grants that are commonly available for non-
attainment air districts. Lake County is operating
an additional four monitoring stations working in
coordination with the county Public Health Officer
regarding natural events in the City of Clearlake
as well as localized odor impacts from
geothermal operations.

P a g e | 22
MENDOCINO COUNTY AIR QUALITY MANAGEMENT DISTRICT
The Mendocino County air district lies between Sonoma County (Northern
Sonoma County air district) to the south and Humboldt County (North Coast
Unified air district) to the north, along the Northern California coast. As part of the North
Coast Air Basin, the air district maintains some of the cleanest air in the state.
The air district remains in attainment for all federal ambient air quality standards and all
state standards, with the exception of coastal PM10, although continuous air monitoring
shows improvement toward PM10 attainment. The air district is actively involved with the
evaluation and development of small-scale distribution systems utilizing woody biomass
generated from the reduction of forest fuel loading, timber harvest residues, and
defensible space clearing. There is an abundance of these resources available for the
production of biochar and black carbon, which
are useful methods of carbon sequestering.
Several demonstration projects including
commercial biochar production, small scale
electric generation, and biochar from open
burning are planned for the coming year. These
efforts will contribute to reducing greenhouse
gas (GHG) emissions as well as particulate
reduction and fire fuel loading.
The air district continues to provide grant funds
for the replacement of older stationary diesel
agricultural engines and off-road diesel
equipment, utilizing funding through the Carl Moyer Program.
Improvements to the air district website allow for more current information updates, easier
access to air district information, and online access to permit applications. In addition to
online burn permit applications, the ability to process payments utilizing GovPayNet greatly
reduces the long drives for residents in remote corners of the county while at the same
time increasing the likelihood that open outdoor burning regulations will be followed.
A large source of PM10 emissions is unpaved roads, accounting for much of the air
district‟s non-attainment status for PM. The air district has developed a pilot grant program
that will provide reimbursement funds to Mendocino County residents toward the cost of
applying dust suppressants to privately owned unpaved roads. Grants will be available for
up to $5,000 toward the cost of applying air district-approved dust suppressants on their
property.

P a g e | 23
MOJAVE DESERT AIR QUALITY MANAGEMENT DISTRICT
In 2014, the High Desert‟s air quality attained the federal 1-hour
ozone standard based on three consecutive calendar years of
complete, quality-assured, and certified air monitoring data collected within the air
district‟s 20,000 square mile jurisdiction. Although
the federal 1-hour standard was revoked by the U.S.
EPA in 1997 and replaced by a more stringent federal
8-hour standard, many regions – including the Mojave
Desert AQMD − continued to have regulatory
obligations under the former standard, which could
have imposed potentially crippling punitive fines on
major sources in the region. Due to the continued
impact of transport emissions on the High Desert, the
recently proposed 65 to 70 ppb federal ozone
standard is likely to present a renewed challenge to
the air district‟s attainment status.
In late 2014, CalEPA selected the Mojave Desert communities of Victorville and Barstow to
receive a portion of more than $200 million of $832 million in cap-and-trade proceeds
earmarked for greenhouse gas-cutting projects, to be located within disadvantaged
communities.
The air district traded out its TEOM and Hi-Vol particulate monitoring equipment for BAM
units, with one co-located Hi-Vol retained in Victorville. Panoramic site cameras were
installed and tested for use in viewing fine particulate formation/movement.
The Mojave Desert AQMD Governing Board approved a Reasonably Available Control
Technology (RACT) revision to Rule 464 - Oil Water Separators and a 3.25 percent permit
fee increase, effective January 2015. The air district‟s existing Dust Control Plan Guidance
was expanded to include specific solar project fugitive dust control.
In fall of 2014, the air district released a Call for Projects for $936,000 in AB 2766 grant
program funds for projects reducing mobile source emissions within the air district
boundaries. By the end of 2014, a total of 765 vehicles had been removed from the road
since the 2006 inception of the air district‟s Voluntary Accelerated Vehicle Retirement
Program.
In April, the Mojave Environmental Education Consortium (MEEC) was recognized by the
San Bernardino County Superintendent of Schools with its prestigious Medal of Honor for

P a g e | 24
outstanding service and support to public education. This is the second Medal of Honor in a
decade to be conferred on MEEC, whose lead agency is the Mojave Desert AQMD. The air
district‟s annual Solar Cook-off for students was spotlighted in the November/December
issue of the California Special District Association Magazine, a bi-monthly publication
distributed to more than 20,000 Special District Board Members and staff throughout the
state.
MONTEREY BAY UNIFIED AIR POLLUTION CONTROL
DISTRICT
The Monterey Bay Unified Air Pollution Control District has local jurisdiction
for air quality in the North Central Coast Air Basin, which covers Monterey, San Benito, and
Santa Cruz counties. The air basin was designated in attainment for the federal 8-hour
ozone standard in 2012; however, work still remains to achieve attainment of the state 8-
hour ozone standard. The year 2014 was a clean one for the air basin as the ozone
standard was exceeded only three times at the Pinnacles National Park monitor and once
at the Hollister monitor. There were no measured ozone exceedances in Santa Cruz or
Monterey counties. The air basin is also designated as attainment for the federal PM2.5
standard.
The air district is fortunate to experience good regional air quality, yet localized high PM2.5
concentrations continue to be a challenge. Special monitors in the San Lorenzo Valley
(SLV) area near Santa Cruz continue to record exceedances of the federal 24-hour PM2.5
standard due to the topography of the area, the large number of homes heated with wood
stoves and intermittent outdoor burning of yard waste. The mountainous terrain of SLV
traps winter smoke, causing PM2.5
concentrations as well as smoke complaints
to increase during the winter months. The air
district continued funding for the Wood Stove
Change-Out Program with the focus of the
funding on SLV. The 2014 program
successfully changed out over 50 old wood
stoves in SLV. The air district also continued
free yard waste recycling events for SLV
residents, resulting in the recycling of
approximately 700 tons of yard waste
material. Implementing these programs will
help to reduce the localized increases in
PM2.5 concentrations experienced in SLV.

P a g e | 25
NORTH COAST UNIFIED AIR QUALITY MANAGEMENT
DISTRICT
In general, the North Coast Unified Air Quality Management District has some
of the healthiest air in the nation. Located along the rugged northern coast of California,
the air district encompasses approximately 7,753 square miles within Humboldt, Del Norte
and Trinity counties. The terrain spans
coastal, agricultural, forested, and
mountainous regions, which creates
hundreds of microclimates within the air
district. Inversions and diurnal offshore
wind patterns are common. To better
examine those microclimates, the air
district has increased the number of air
monitoring stations from three to five
since 2006.
Effective July 1, 2014, Trinity and Del
Norte counties were designated as
attainment of the federal PM10 standard.
Also earlier this year, the U.S. EPA granted approval to begin using continuous real-time
PM10 monitors and discontinue the use of the filter-based monitors. There have been no
exceedances of the ozone standards in all three counties.
Particulate matter from wildfires and wood stove smoke remain as challenges in the
region. The air district continues to provide a district-funded wood stove change-out
program as well as administering the Carl Moyer and TIMBER grant programs.
NORTHERN SIERRA AIR QUALITY MANAGEMENT
DISTRICT
The Northern Sierra Air Quality Management District is comprised of the rural mountain
counties of Nevada, Sierra and Plumas. Of these, Nevada County is the most populous,
with nearly 100,000 residents (compared to Plumas with fewer than 19,000 and Sierra
with approximately 3,000). All three counties are predominantly covered by U.S. Forest
Service land, particularly Plumas and Sierra counties. Elevations in the air district range
from a few hundred feet above sea level to over 9,000 feet.

P a g e | 26
The western portion of Nevada County (west of the Sierra crest) is non-attainment for
ozone and occasionally experiences high ozone concentrations on hot summer days with
wind out of the southwest. Most of this ozone is transported from the Sacramento region
and the Bay Area. Ozone data from the past few years demonstrate an improvement in
western Nevada County‟s air quality, although the summer of 2014 saw a few high ozone
days associated with wildfire emissions to the south. The town of Truckee, in eastern
Nevada County, occasionally experiences elevated wintertime particulate matter
concentrations from wood combustion and road sand, but the situation has improved
greatly over the past 15 years due to the town‟s successful Particulate Matter Air Quality
Management Plan, adopted in 1999.
Plumas and Sierra counties are separated from Nevada County and the Sacramento area
by vast canyons that disrupt the transport of ozone. PM2.5 is the main pollutant of concern
in Plumas and Sierra counties and is mostly associated with residential wood combustion.
The Portola area in Plumas County has recently been designated federal non-attainment
for PM2.5. The air district maintains a proactive smoke management program for open
burning and has administered several wood stove change-out programs, for which funding
is an ongoing challenge. On a typical elevated PM2.5 day in Plumas County, temperatures
are cold, residents are using their wood stoves and an atmospheric inversion is in place.
The highest concentrations generally occur late at night (when wood stoves are damped
down) and in the morning (when stoves are started up). November and December are
historically the highest PM2.5 months.
NORTHERN SONOMA AIR POLLUTION CONTROL
DISTRICT
The Northern Sonoma Air Pollution Control District includes the entire
coast of Sonoma and areas north of the town of Windsor, as well as the lower Russian
River valley. This includes all of the Known Geothermal Resource Area (KGRA) in Sonoma
County, which is the largest direct steam geothermal power generation installation in the
world. Air monitoring stations are located in Cloverdale, Healdsburg and Guerneville, as
well as stations operated cooperatively with Lake County in
the KGRA. The southern portion of the county (including the
monitoring stations in the cities of Santa Rosa and
Sonoma) lies within the jurisdiction of the Bay Area Air
Quality Management District.
The air district is currently in attainment of all federal and
state standards. One of the air district‟s primary concerns is
residential and agricultural wood smoke, which the air

P a g e | 27
district regulates through a robust open burn permitting and enforcement program. The air
district also provides grant incentives for clean air projects, and conducts stationary source
permitting and enforcement. The air district works in partnership with other agencies,
cities, and Sonoma County to achieve reductions in greenhouse gases called for in the
Climate Action Plan adopted by the county and all of its nine cities.
In early 2014, the air district ran a Wood Stove Change-out Voucher Reimbursement
program, which incentivized the replacement of uncontrolled wood stoves with U.S. EPA-
certified wood-burning appliances. Also in 2014, the air district continued to award grants
for heavy-duty diesel engine clean-up projects, primarily tractors and other agricultural
equipment. In the months and years to come, the air district will be working with the
Sonoma County Winegrowers Association to encourage limitation of open burning as part
of the vineyards‟ move to becoming 100 percent sustainable by 2019.
PLACER COUNTY AIR POLLUTION CONTROL DISTRICT
The Placer County Air Pollution Control District continues to move
forward with numerous projects and programs that are providing both quantitative and
qualitative improvements in air quality.
Smoke filled the air in Placer County in late
summer/early fall with the King Fire, along
with other smaller wildfires. With multiple
days of hazardous air quality throughout the
region, air district staff provided extensive
public outreach, along with real-time air
quality data that provided air quality trends
of the smoke impact. Together with the
County Emergency Services and the County
Health Officer, this information helped
support planning efforts and decision-
making for outdoor activities such as high
school football games, athletic tournaments
and school closures. Both Placer County and air district staffs also provided the
International Ironman Triathlon officials with information that helped with the decision to
cancel their event in Lake Tahoe due to hazardous air quality.
With the high PM2.5 data recorded from wildfires during both 2014 and 2013, the air
district is working on two Exceptional Events Reports, one for each year, which will be
submitted to the U.S. EPA. Each report, if approved, will allow the PM2.5 data recorded

P a g e | 28
during the wildfires to be excluded from the air district‟s attainment demonstration. The
reports, when completed, will be available on the air district‟s website.
In the last decade, the frequency and intensity of the wildfires have resulted in the burning
of over 100,000 acres, about 20 percent of the forested lands in the county. The air district
continues to commit resources to the development and forward progress of a suite of
forest-related initiatives. The air district has teamed up with other public and private
stakeholders, through California‟s carbon market, to implement economically self-
sustaining forest management activities to restore the forest land to a fire-resilient
condition, which will help to reduce criteria pollutant emissions released from wildfires,
prescribed broadcast burns, and open-pile burning.
Details of each of these initiatives have garnered significant visibility at both the state and
federal level. In the last year, air district staff provided a briefing on its biomass-waste-to-
energy, open burning and economic/air emission credit work to a delegation of forestry
and agricultural officials from Bangladesh. The air district completed and released a short
video describing some of its forest resource sustainability initiatives, which can be found
on the air district website under the heading of Biomass Energy Initiatives. The video was
produced in cooperation with the UC Berkeley Blodgett Forest Research Station.
Additionally, after extensive work, the air district was able to release 2,156 metric tons of
carbon credits for sale on the CAPCOA Greenhouse Gas Exchange, utilizing the air district‟s
Biomass Waste for Energy GHG accounting protocol. These verified credits, which were
created from one of its biomass for energy projects, will provide mitigation options for
project developers and businesses in meeting CEQA obligations.
The air district‟s Board of Directors approved the federal PM2.5
Implementation/Maintenance Plan and Re-Designation Request for the Sacramento
PM2.5 non-attainment area in February 2014. With the 2008 revised federal ozone
standards, air district staff, along with ARB and the Sacramento region‟s other four local
air districts, have begun work on a new State Implementation Plan to demonstrate the
region‟s ability to meet the attainment deadline of 2027. The plan includes preparing the
planning emission inventory, a list of feasible mitigation measures and modeling analysis.
In addition, air district staff will begin working on the 2012-2014 Triennial Progress Report
to assess progress towards attaining the state ozone standard.
The air district‟s extremely successful Clean Air Grant incentive program continues to
reduce criteria pollutants from successful projects not otherwise required by law to lower
emissions. This year, more than $1 million is available for Clean Air Grants. Since 2001,
approximately $15 million for emission reduction projects resulted in a reduction of 1,074
tons of NOx, Reactive Organic Gases (ROG) and PM. Additionally, the air district is
administering a wood stove incentive program in the Tahoe region, in conjunction with

P a g e | 29
other air districts on behalf of the Tahoe Regional Planning Agency, to replace non-U.S.
EPA-certified wood stoves.
The air district continues with more traditional programs in striving to reach attainment of
air quality standards for both PM2.5 and ozone, such as stationary source permitting and
complaint investigation. In 2014, the air
district continued to implement its
Strategic Information Technology
Master Plan. This is the start of an effort
to identify technologies the air district
can use to improve its operations, with
the goals of improving staff productivity,
the completeness of documentation,
and reducing costs. With the
combination of wireless computer
technology, and the air district‟s
database of permit and compliance
information, staff has seen
improvements in the quality and quantity of inspections and investigations that are
conducted in the field. Increases in inspection productivity enable fewer air district staff to
conduct required inspections, reducing costs for inspections and freeing up resources for
other programs. The air district has developed inspection forms that are automatically pre-
loaded with data from the air district database for the permits to be inspected. The forms
are then pushed out via the internet and wireless communications technology to Samsung
Galaxy 8” tablets in the field (currently four tablets are in use). In 2015, the goal is to
upload inspection results back to the database and fully integrate the field inspection
process with the database.
SACRAMENTO METROPOLITAN AIR QUALITY
MANAGEMENT DISTRICT
The Sacramento Metropolitan Air Quality Management District works
with local, state and federal government agencies, the business community, and private
citizens to achieve and maintain healthy air quality for Sacramento County. The air
district‟s Board of Directors includes representation from the various cities within
Sacramento County. These include: all five Sacramento County Board of Supervisors; four
members of the Sacramento City Council; one member representing each of the cities of
Citrus Heights, Elk Grove, Folsom, and Rancho Cordova; and one member representing the

P a g e | 30
cities of Galt and Isleton. Since 2004, Larry Greene has led the air district as its Executive
Director.
The air district has completed its eighth Check Before You Burn season (as per Rule 421 -
Mandatory Episodic Curtailment of Wood and Other Solid Fuel Burning – which prohibits
burning when weather conditions trap wood smoke at ground level). Since 50 percent of
the particulate matter emissions in the winter can be attributed to wood burning, this rule
reduces the number of days the air district exceeds the federal PM2.5 health standard.
Advertising, outreach, enforcement efforts and incentives to replace dirty wood burning
devices are essential parts of Sacramento‟s attainment of the federal PM2.5 standard.
In 2014, the air district funded just under $11.6 million in mobile on‐road and off‐road
emission reduction projects, including modernizing 182 on‐road heavy‐duty trucks,
upgrading over 36 pieces of off-road equipment, and performing 82 agricultural electric
pump replacements. In addition, the air district reviews, provides guidance, and develops
comments on land-use-specific plans, as well as local agency Climate Action Plans,
General Plans, and regional Transportation Plans.
The annual Spare The Air program continues to encourage residents to change behavior
and reduce air pollution, including focusing on reducing driving and using other means of
transportation on Spare The Air days. Through multiple outreach efforts, the
Communications Office recorded 15,873 Air Alert subscribers; 3,218 Spare The Air
business and community
partners, and 1,775 Check
Before You Burn partners who
distribute air quality
information to the public. In
addition, social media efforts
resulted in 1,395 Twitter
followers, 1,140 Facebook
followers, and 385 Instagram
followers. The Spare The Air
annual survey shows that in
2014, residents of the
Sacramento region reduced .65
tons per day of ozone
precursors by driving less in the
summer to improve air quality.

P a g e | 31
SAN DIEGO COUNTY AIR POLLUTION CONTROL DISTRICT
The San Diego County Air Pollution Control District is governed by its Air
Pollution Control Board, composed of five members from the San Diego County Board of
Supervisors. The Board adopts measures to control air pollutants from stationary sources.
The Board also provides millions of dollars in grant funding to incentivize the reduction of
air pollutants from diesel vehicles and equipment through the replacement of dirty, old
equipment with cleaner, low-emitting equipment.
As a result of these efforts, the county continues to
make great progress in overcoming what historically
has been the region‟s primary air pollution problem –
ozone. In fact, 2014 was another record year as the
county achieved its lowest ozone design value ever
(79 ppb over an 8-hour period), as displayed in the
chart below. The county continued to attain the 1997
federal ozone standard, although work still remains to
meet the more health-protective 2008 standard. In
addition, the county continued to meet all federal
standards for PM2.5.
In 2014, the air district launched its first-ever web-based services allowing customers to
complete and submit an online application for an air quality permit or mobile-source
project grant. Work is underway to expand the air district‟s online services and improve
convenience to customers.
70
80
90
100
2000 2002 2004 2006 2008 2010 2012 2014
8-Hour Ozone Design Value Trend
2008 Standard (75 ppb)
1997 Standard (84 ppb)
Par
ts p
er
Bill
ion

P a g e | 32
Also in 2014, air district staff received classroom and in-field training from ARB after
signing a Memorandum of Understanding with ARB to help enforce their mobile source air
pollution regulations in San Diego County. These regulations apply to trucks, buses, and
off-road equipment. Ensuring local compliance is important because three-fourths of all of
the air pollution in the county comes from vehicular and other mobile sources of
emissions.
The air district‟s mobile source incentive program continued to flourish in 2014, with the
award of $5.4 million for the replacement or repower of heavy-duty on- and off-road
vehicles and equipment. This funding provides early emission reductions and improves
regional air quality and public health at lower costs to businesses.
SAN JOAQUIN VALLEY AIR POLLUTION CONTROL
DISTRICT
In the summer of 2014, the San Joaquin Valley experienced strings of triple-digit
temperatures, wildfires, and continued air stagnation due to the ongoing drought. Overall,
meteorological conditions during summer and early fall were extremely conducive to ozone
formation. Despite these conditions, the San Joaquin Valley continued progress and
experienced another record-setting good year for ozone, with no violations of the 1-hour
ozone standard for the second year in a row.

P a g e | 33
Ozone
For the second time in recorded history, the San Joaquin Valley completed an ozone
season with no violations of the federal 1-hour ozone standard. By contrast, in 1996 the
San Joaquin Valley experienced 281 hourly exceedances of this standard throughout the
eight-county region. In 2004, U.S. EPA classified the San Joaquin Valley as “Extreme” non-
attainment for this standard, meaning that, at that time, technology did not exist to
achieve the standard. The San Joaquin Valley is the first and only region in the nation with
“Extreme” classification to attain the standard.
8
The San Joaquin Valley remains on track to meet the 84 ppb federal 8-hour ozone standard
before the deadline (the “black box” plan component is no longer needed). San Joaquin
Valley residents‟ exposure to ozone concentrations above the health-based standards
established by U.S. EPA, including the toughest 8-hour ozone standard, has been reduced
significantly. For the three-year period from 2012 through 2014, with a neighborhood-by-
neighborhood accounting for population exposure to ozone concentrations, on average,
San Joaquin Valley residents were exposed to ozone concentrations above the standards
for the fewest number of days on record.
8 Refers to the number of days over the standard among all of the eight counties in the air district
0 10 20 30 40 50 60
Day
s
Year
County Days9 over Federal 1-hour Ozone Standard
For the air district, 2014 was another historic year recording two consecutive years
with zero exceedances of the federal 1-hour ozone standard.

P a g e | 34
The number of days when the 75 ppb federal 8-hour ozone standard was exceeded
anywhere in the San Joaquin Valley was the lowest during the typical peak ozone season of
May through September.
0
100
200
300
400
500
600
700 D
ays
Year
County Days over Federal 8-hour Ozone Standard
2008 Standard (75 ppb)
1997 Standard (84 ppb)
-80%
-60%
-40%
-20%
0%
1992 1999 2004 2014
8-hour Ozone Exceedance Days Percent Decrease
1997 Standard (84 ppb)
2008 Standard (75 ppb)
The San Joaquin Valley experienced the longest stretch of consecutive days in July and August on
record without violating the 75 ppb federal 8-hour ozone standard, and the cleanest August on record:
17 days without an 8-hour ozone exceedance (75 ppb 8-hour ozone standard).
A 41 percent decrease in days over the 2008 8-hour ozone standard since 1992, and a 68 percent decrease in
days over the 1997 standard over the same time period.

P a g e | 35
Due to improving ozone conditions in the Valley, the number of Good AQI days during the
ozone season is continuing to increase while the number of Unhealthy AQI days is
continuing to decrease.
Particulate Matter
As was the case with virtually every air basin in California, the winter of 2013-14 in the
Valley was plagued with unrelentingly stubborn atmospheric stagnation, strong inversions,
and record low precipitation, resulting in an elevated number of Unhealthy air quality days.
Due to these elevated numbers, both the federal 24-hour and annual average PM2.5
design values for 2014 have increased across the Valley, as displayed in the charts below.
Despite exceptionally high peak PM2.5 concentrations in the winter of 2013-14 as a result
of these factors, long-term trends in fine particulates continue to decline. Even with poor
meteorology, the amendments to the air district‟s wood-burning curtailment regulation
(Rule 4901) and associated grant program were effective at preventing PM2.5 levels from
climbing even higher.
0 100 200 300 400 500 600
Day
s
Year
Ozone Season Good and Unhealthy AQI Days (May to September)
Good Days
Unhealthy Days
Continued decrease in the number of Unhealthy AQI County-Days during the ozone season of May to
September.

P a g e | 36
20
30
40
50
60
70
80
90
100
µg/
m3
Year
24-hour PM2.5 Design Value Trend
1997 Standard (65 µg/m3)
2006 Standard (35 µg/m3)
10
12
14
16
18
20
22
24
µg/
m3
Year
Annual PM2.5 Design Value Trend
1997 Standard (15 µg/m3)
2013 Standard (12 µg/m3)
The 24-hour average PM2.5 design value is increasing due to current drought conditions, causing abnormally
long periods of stagnation and trapping of pollutants near the surface.
The annual average PM2.5 design value is also increasing due to current extreme meteorological conditions,
causing abnormally long periods of stagnation and trapping of pollutants near the surface.

P a g e | 37
The uncharacteristic trends for both Good days and Unhealthy days seen during this last
winter were directly related to extreme weather and drought conditions.
SAN LUIS OBISPO COUNTY AIR POLLUTION
CONTROL DISTRICT
Located along the central coast of California, San Luis Obispo County encompasses
approximately 3,299 square miles and a population of 273,231. The county is comprised
of coastal plains, valleys, hills and mountains, resulting in a variety of air quality
characteristics.
The sparsely populated eastern portion of the county is designated non-attainment for the
federal ozone standard. This area experiences the highest levels of ozone in the county as
a result of pollution transport from outside of the county. Data shows significant reduction
in ozone exceedances in the eastern portion of the county over the last eight years; 2014
was the cleanest year with only three exceedances of the federal ozone standard, as shown
on the following graph.
0
50
100
150
200
250
300
PM2.5 Season Good and Unhealthy AQI County-Days (Nov - Feb)
Good AQI
Unhealthy AQI Days
Increase in Unhealthy AQI County-Days and decrease in Good AQI County-Days due to the extreme
meteorological conditions experienced during the 2013-14 winter season.

P a g e | 38
The ozone trends reflected in the appendices compare 2000-2002 data to more current
data from 2012 – 2014. For San Luis Obispo County, that comparison shows an apparent
increase in ozone levels opposite to the sharp decrease shown above. This isan artifact of
the time periods chosen for comparison and a change in the monitoring network. A new
ozone monitoring station was installed in the East County in 2006 where none was present
prior to that time. Thus, the apparent increase in ozone levels is not due to deteriorating air
quality, but rather, reflects the start of ozone monitoring in a new location. This artifact is
reflected in the decrease in the number of Good air quality days shown in Appendix B; the
increase in the percentage of days exceeding the NAAQS in Appendix D; and the design
value trend in Appendix E. The chart above shows the actual ozone trend in SLO County,
which has been decreasing significantly over the past several years.
The entire county is designated non-attainment for the state PM10 standard. Windblown
dust from the Oceano Dunes State Vehicular Recreation Area (SVRA) in southern San Luis
Obispo County impacts the Nipomo Mesa, where most of the PM10 standard exceedances
are measured. Historical ambient air monitoring on the Nipomo Mesa has documented
high levels of particulate matter compared to other areas of the county and other coastal
areas of California. The air district conducted several comprehensive air monitoring
studies, and concluded that off-highway vehicle activity in the Oceano Dunes SVRA is the
major contributing factor to the high peak concentrations of PM on the Nipomo Mesa. The
air district has been working to develop solutions to reduce PM from the SVRA that
impacts downwind neighborhoods. In 2011, the air district Board approved the Coastal
Dunes Dust Control Rule 1001 to require implementation of dust control measures on
coastal dunes where vehicle activity occurs. As of 2014, reduction of ambient PM
concentrations on the Nipomo Mesa has not yet been realized.

P a g e | 39
The decrease in the number of Good air quality days in Appendix C - AQI for Particulate
Matter, is due to a change in the monitoring network, not due to deteriorating air quality.
The number of official monitoring stations on the Nipomo Mesa has increased. As
described above, Nipomo Mesa is significantly impacted by blowing dust, and a new
monitor was placed closer to the source in 2010.
SANTA BARBARA COUNTY AIR POLLUTION CONTROL
DISTRICT
Santa Barbara County is designated non-attainment for the
state 24-hour PM10 and ozone standards. The county
remains in attainment of the federal PM10 and PM2.5
standards, and the federal 8-hour ozone standard. In 2014,
there were more exceedances of the state and federal ozone
standards than in the preceding years, including a higher
number of days in October.
Emissions from large ships going through the Santa Barbara
Channel threaten the county‟s ability to continue progress
toward attainment of the state ozone standard, and to
maintain attainment of the federal ozone standard. In 2014, the air district worked with
the Channel Islands National Marine Sanctuary and the Environmental Defense Center on
the development of a program to slow ships down in the Santa Barbara Channel for whale-
protection and air-quality benefits. A ship strike on a whale is up to 50 percent less likely to
be fatal at speeds below 12 knots, and ship speed reduction increases fuel efficiency and
reduces air emissions.
The Vessel Speed Reduction (VSR) trial
incentive program, modeled after the
successful VSR programs at the ports of
Los Angeles and Long Beach, was
implemented in the Santa Barbara
Channel from July through November
2014. Seven global shipping companies
participated; 27 transits through the
Channel were slowed to 12 knots or less
(from previous baseline speeds of 14 knots
to 18.67 knots) for an incentive payment of
$2,500 per transit.

P a g e | 40
The VSR trial achieved a 50 percent reduction from baseline levels for these transits of
ozone-forming NOx emissions (16 tons reduced) and of greenhouse gas emissions (500
metric tons reduced). Most of the ship transits occurred from July through October,
coinciding with the peak ozone season and the peak whale season.
The VSR trial was funded by the Santa Barbara Foundation, the Santa Barbara County Air
Pollution Control District and the Ventura County Air Pollution Control District, with
payments administered by the National Marine Sanctuary Foundation. In September of
2014, the air district and partners hosted a community forum titled “Protecting Blue
Whales and Blue Skies” to share results from the VSR trial. The air district and partners are
building on the success of the VSR trial and working towards establishing a larger-scale
program.
In 2014, the air district also continued to support installation of public electric vehicle
charging stations and participated in tri-county collaborative efforts to develop electric
vehicle charging and hydrogen fueling infrastructure. The air district‟s popular Old Car Buy
Back Program retired 525 old cars in 2014, achieving 17.52 tons of emission reductions
(NOx, reactive organic compounds, and particulate matter). In 2014, the air district also
continued to lead the award-winning Santa Barbara Car Free partnership, and to
implement diesel engine grant programs and the Care for Our Earth teacher grants
program. More information is available at www.OurAir.org, and www.twitter.com/OurAirSBC.
SHASTA COUNTY AIR QUALITY MANAGEMENT DISTRICT
The Shasta County Air Quality Management District encompasses the
northernmost portion of the Sacramento Valley Air Basin. The air district is in
attainment for all federal ambient air quality standards.
Efforts to enhance air quality within the air district include grant opportunities and public
outreach. Grants continue to be available for the Carl Moyer Program and the Timber Log
Truck Replacement Program. A wood stove upgrade program has been ongoing for the last
eight winters. Air district public outreach includes utilizing the U.S. EPA‟s Enviroflash service,
which updates individuals on ambient air quality levels via e-mail. The air district also
maintains a webpage which displays the AQI values for ozone and PM2.5 monitors located
throughout the Sacramento Valley. A visibility camera is operated atop the air district‟s
western mountain range and can be viewed at
http://www.co.shasta.ca.us/index/drm_index/aq_index/aq_webcam.aspx.

P a g e | 41
SOUTH COAST AIR QUALITY MANAGEMENT DISTRICT
Air quality in the South Coast region continues to improve over the long term,
although the maximum concentration and number of days each year in which the
federal ozone standard is exceeded fluctuates from year to year due to weather conditions.
In 2014, the South Coast region exceeded the federal ozone standard on 94 days, the
second-lowest number ever recorded in the South Coast Air Basin. The maximum 1-hour
ozone concentration of 0.142 parts per million (ppm) in 2014 was the lowest on record
and the maximum 8-hour ozone concentration of 0.114 was the second-lowest recorded.
Air pollution controls have significantly reduced levels of PM2.5 across the region and data
since 2011 show that the Southland is meeting the former 1997 annual PM2.5 federal
standard of 15 micrograms per cubic meter.
U.S. EPA revised the annual average PM2.5 standard from 15 micrograms per cubic meter
down to 12 micrograms per cubic meter in March 2013 and the South Coast region is
continuing to make progress toward attainment of this new annual standard. The region
came close but did not meet the 24-hour federal PM2.5 standard in 2014.
Severe drought conditions continue to have an impact on the number of 24-hour PM2.5
episodes in the region. The lack of storm events and associated rainfall reduced the

P a g e | 42
dispersion of pollutants, the atmospheric cleansing of particulates by precipitation, and the
control of fugitive particulate emissions from the wetting of soil and road surfaces. The air
district is now developing additional control measures to help meet the 24-hour PM2.5
federal standard deadline in 2015.

P a g e | 43
During the 2014-15 winter Check Before You Burn season, the air district issued 25 no-
burn alerts. A total of 16 no-burn alerts were issued during the 2013-14 season and five
no-burn alerts during the 2012-13 season. In 2013, the air district lowered the forecast
threshold triggering no-burn alerts from 35 micrograms per cubic meter to 30 micrograms
per cubic meter, which has increased the number of no-burn days.
The air district continues to face major air quality challenges, particularly in reducing
mobile source emissions. Nitrogen oxide emissions must be further reduced by 65 to 75
percent or more to meet current federal health standards for both PM2.5 and ozone.
However, improvements in air quality are paying dividends. A recent study by USC
scientists responsible for the landmark Children‟s Health Study found that lung growth
improved as air pollution declined for children aged 11 to 15 in five Southern California
communities. The study findings were published in the New England Journal of Medicine.
The air district achieved significant accomplishments in 2014, including:
Releasing results of its fourth Multiple Air Toxics Exposure Study (MATES IV), which
showed a steep decline in cancer risk to residents of the South Coast region;
Establishing the nation‟s first Air Quality Sensor Performance Evaluation Center (AQ-
SPEC) to test commercially available, low-cost air quality sensors to help evaluate
the validity and overall performance of these personal air quality sensors;
Successfully securing orders of abatement from the SCAQMD Hearing Board to
require Exide Technologies, one of two lead-acid battery recycling plants in the
South Coast region, to make substantial improvements to its air pollution control
system before resuming operations at its plant. The two orders applied conditions
on Exide that went beyond SCAQMD‟s already stringent rules regulating lead and
arsenic emissions from battery recycling plants;
Adopting new, tougher requirements to control arsenic
and other toxic emissions from the two lead-acid battery
recycling plants in the South Coast region;
Kicked off the planning process for the 2016 Air Quality
Management Plan (AQMP), which includes advisory groups and
dialogues with stakeholders regarding development strategies.
Also, for the first time the AQMP planning process includes a
series of white papers that are being prepared to lay out the
technical and policy issues concerning interlocking disciplines on
air quality, climate, energy and transportation issues;

P a g e | 44
Funding close to $150 million for the replacement and/or retrofit of older diesel
trucks and buses, as well as innovative clean-technology projects such as the
demonstration and deployment of a zero-emission cargo container moving system
in the ports using overhead catenary technology;
Installing an air pollution monitor near the Sentinel power plant in the Desert Hot
Springs area of Coachella Valley to better assess any potential emission impacts
from the power plant on the Desert Hot Springs area;
Expanding the near-road NO2 monitoring network next to busy Southern California
freeways from two to four monitoring stations. Two stations have also been
enhanced with PM2.5 monitors; another two stations were enhanced with CO
monitors; and one station is now monitoring for black carbon;
Launching a Green Gardener initiative to demonstrate new heavy-duty electric lawn
mowers used by professional landscapers in parks, cities and other venues;
Conducting a wide range of air toxics monitoring activities throughout the region,
including odor investigations and near-source toxic metals monitoring; and
Continuously monitoring hydrogen sulfide gas levels at the Salton Sea and issuing
odor advisories when those levels are elevated.
TEHAMA COUNTY AIR POLLUTION CONTROL DISTRICT The Tehama County Air Pollution Control District is located in the northern part
of the Sacramento Valley. The air district spans 2,949 square miles and has
an estimated population of 63,057. The county economy is predominantly based in
agriculture, including production of walnuts, almonds, various fruits, and livestock. The air
district operates three air quality monitors that were recently relocated from various
locations throughout the county to the air district office at 1834 Walnut St. in Red Bluff.
The air district actively participates in many grant programs to help improve air quality in
the air district‟s jurisdiction, including the Carl Moyer program, the TIMBER Log Truck
Replacement Program, and AB 923 funding program. Through these programs, the air
district has been able to reduce emissions from stationary diesel irrigation pumps, off-road
mobile diesel tractors, and on-road mobile diesel vehicles. Expanding grant opportunities
is an important task for the air district. In 2015, the air district hopes to introduce a wood
stove replacement grant program.
The air district believes outreach and education on many topics will help to increase
awareness about rural air quality problems and solutions. The air district strives to

P a g e | 45
continue to participate in projects that will benefit not only Tehama County but all of
northern California‟s rural air districts, by participating in the Upstate Plug-In Electric
Vehicle Readiness Project and the Rural Sustainability Fund. Outreach information and air
district activities can be found at http://www.tehcoapcd.net/.
TUOLUMNE COUNTY AIR POLLUTION CONTROL DISTRICT
The Tuolumne County Air Pollution Control District is a small air district,
serving approximately 55,000 people. Seventy-seven percent of the land
within the air district is federal, comprised mainly of the Stanislaus National Forest and the
northern half of Yosemite National Park. Major air quality concerns are particulate matter
emissions from wildfires, opening burning and residential wood-heating appliances, and
also ozone and ozone precursor emissions. Tuolumne County is designated non-attainment
for the state ozone standard, but classified as non-attainment due to “Overwhelming
Transport” of emissions into the air
district.
Tuolumne County‟s air quality continues
to improve. In 2014, air quality
monitoring data showed only two
exceedances of the 2008 federal 8-hour
ozone standard. In 2012, the U.S. EPA
determined that Tuolumne County had
attained the 1997 federal 8-hour ozone
standard and designated the air district
as in attainment for the more stringent
2008 federal 8-hour ozone standard.
Tuolumne County continues to recover from the Rim Fire that began in August 2013 and
burned over 256,000 acres. The air district is working with stakeholders to utilize unburned
fuel within the Rim Fire boundaries to be used at local biomass energy plants. Preventing
future large scale wildfires will take the effort of both land managers and air quality
regulators to implement scientific and common-sense approaches to reducing fuel loading.
The air district continues to implement the Carl Moyer program with over $1.6 million
dollars allocated to local businesses and public and private agencies. In 2013, the air
district implemented the TIMBER program to help log truckers comply with ARB‟s new On-
Road Truck and Bus regulation; however, this grant program is falling short of
expectations. The air district is completing its second very successful green waste voucher

P a g e | 46
program, giving residents within the county the ability to recycle up to four cubic yards of
green waste that would most likely otherwise be burned.
VENTURA COUNTY AIR POLLUTION CONTROL
DISTRICT
Ventura County does not meet the federal and state ozone standards nor the state PM10
standard. Ozone levels in the county exceeded the federal 8-hour ozone standard seven
days in 2014, which was the county‟s second cleanest year on record. Ventura County‟s
cleanest year on record was 2013 with only four days over the standard. Weather
conditions play a role in ozone formation, with hot summers (2014) leading to higher
ozone levels, and mild summers (2013) leading to lower ozone levels.
2014 was far better than 1990 (117 days over the standard) and 2000 (57 days over the
standard). Moreover, the county‟s long-term trend towards clean air continues and the air
district anticipates meeting the current federal ozone standard by 2021, as required by the
federal Clean Air Act. The following summarizes several of the air district‟s
accomplishments during 2014.
In September 2014, the air district joined a
coalition of four government, non-profit,
and marine industry groups in a trial
incentive program to slow down large
cargo vessels transiting the Santa Barbara
Channel. The purpose of the program was
to reduce air pollution and help protect
endangered whales. Air emissions from
these vessels contribute approximately one
quarter of the air district‟s ozone-forming
nitrogen oxide emissions. They are also a
significant source of sulfur dioxide,
greenhouse gases, diesel particulate
matter, among other toxic air pollutants.
The air district helped fund the Port of Hueneme‟s state-of-the-art shore-side electrification
power project. The California At-Berth Ocean-going Vessels Regulation requires cargo
vessels to use shore electrical power while in port. Shore power dramatically cuts air
pollutants – nitrogen oxides, particulate matter, and greenhouse gases – from docked
cargo ships.
The air district‟s 2014 Carl Moyer Program helped local farmers and commercial
fishermen replace 78 high-emission diesel engines with new low-emission diesel engines

P a g e | 47
or electric motors. The program has achieved significant air pollutant reductions over the
last 16 years by funding replacement of over 900 high emitting diesel engines with new,
much cleaner equipment.
Another air district clean air program is the Ventura County Electric Vehicle (EV)
Infrastructure Grant Program. This program helps fund new EV charging stations for fully
electric vehicles and plug-in hybrids. Projects in 2014 included charging stations at the
Ventura County Government Center, Oak Park School District, Camarillo Metrolink Station,
and the Ventura County Office of Education.
The air district upgraded its entire particulate monitoring network from filter-based
particulate monitors to continuous particulate monitors. These new monitors continuously
measure airborne particulate concentrations giving county citizens near real-time
information about particulate concentrations in their area.
YOLO-SOLANO AIR QUALITY MANAGEMENT DISTRICT
Located on the west side of the Sacramento Valley, the Yolo-Solano Air Quality
Management District boasts a rich agricultural heritage with seven
incorporated cities and a plethora of innovative businesses. Encompassing all of Yolo
County and the northeastern portion of Solano County, the air district is home to 330,000
residents.
Residents of the Yolo-Solano region breathed easy in 2014 as the air district experienced
just one day of air quality that did not meet federal health standards. Yet Yolo-Solano
remains out of attainment of the federal ozone standard due to its emission contributions
to the wider Sacramento region. As such, air district staff works hard to ensure it will meet
compliance dates while protecting residents from harmful air pollution in the immediate
term.
To ensure Yolo-Solano‟s clean air future, the air district launched its Clean Agricultural and
Municipal Equipment programs in 2014. The programs help fund projects to replace or
retrofit off-road engines and lower emissions from mobile sources. The first project funded
under the program, a new tractor for a local family farm, was completed in late 2014.

P a g e | 48
In order to protect residents against potential future episodes of unhealthy air quality, the
air district adopted an Emergency Event Response Manual laying out procedures and
standards in the case of hazardous conditions. The manual will help staff quickly assess
and respond to emergency events such as wildfires, toxic releases and extreme heat
episodes. The manual was created in close conjunction with county Public Health Officers.

P a g e | 49
APPENDICES
APPENDIX A - WHAT IS THE AIR QUALITY INDEX (AQI)?
The Air Quality Index (AQI) is a tool for reporting daily air quality levels. The index demonstrates how clean or
polluted the air is using colors and a scale from zero (Good) to 500 (Hazardous). The AQI also indicates
potential health effects associated with each air quality category, focusing on those effects that may be
experienced within a few hours or days after breathing polluted air.
The AQI is calculated for the major air pollutants regulated by the federal Clean Air Act. For each of these
pollutants, the U.S. EPA established a National Ambient Air Quality Standard (NAAQS) to protect health. An
AQI value of 100 generally corresponds to the current NAAQS for the pollutant.
For particulate matter, an AQI value of 101 or higher corresponds to a measured concentration over the 24-
hour PM2.5 NAAQS of 35 micrograms per cubic meter (µg/m3). For ground-level ozone, an AQI value of 101
or higher corresponds to a measured concentration over the current 8-hour ozone NAAQS of 75 parts per
billion (ppb).

P a g e | 50
APPENDIX B – AQI FOR OZONE
This table shows the percent of days in each of the AQI reporting categories for each county,
comparing the years 2000-2002 and 2012-2014, for the measured daily maximum 8-hour ozone
concentration. For ozone, an AQI value of 101 or higher corresponds to the 8-hour ozone
concentration exceeding the NAAQS of 75 parts per billion, indicated in the table by a percentage
greater than zero in the „Unhealthy for Sensitive Groups‟ or „Unhealthy‟ or „Very Unhealthy‟
categories.
The recent data may not be final or complete for some air districts and should be treated as
preliminary and subject to change when validated. In addition, some air districts may have changed
the number of stations or frequency of monitoring between 2000 and 2014. Please refer to your
local air district for more specific information.
County Air District
Good Moderate Unhealthy
for Sensitive Groups
Unhealthy Very
Unhealthy
2000-2002
2012-2014
2000-2002
2012-2014
2000-2002
2012-2014
2000-2002
2012-2014
2000-2002
2012-2014
Percent of Days for Ozone
Alameda Bay Area 93.8 95.5 4.3 3.7 1.6 0.7 0.3 0 0 0
Alpine* Great Basin Unified NA NA NA NA NA NA NA NA NA NA
Amador Amador County 73.4 85.2 20.1 14.0 6.2 0.8 0.3 0 0 0
Butte Butte County 71.1 80.0 20.6 19.2 8.3 0.8 0.1 0 0 0
Calaveras Calaveras County 70.5 86.7 20.7 12.8 8.3 0.5 0.5 0 0 0
Colusa Colusa County 87.9 98.1 10.7 1.9 1.5 0 0 0 0 0
Contra Costa Bay Area 90.8 95.3 7.0 4.2 2.0 0.5 0.2 0 0 0
Del Norte* North Coast Unified NA NA NA NA NA NA NA NA NA NA
El Dorado El Dorado County 59.5 70.3 22.7 25.1 14.0 4.5 3.6 0.1 0.2 0
Fresno San Joaquin Valley 41.9 55.6 20.8 26.6 24.0 16.2 12.0 1.6 1.3 0.1
Glenn Glenn County 85.1 95.0 14.2 5.0 0.7 0 0 0 0 0
Humboldt* North Coast Unified NA 100 NA 0 NA 0 NA 0 NA 0
Imperial Imperial County 69.0 77.1 23.8 19.2 6.2 3.7 1.0 0.1 0 0
Inyo Great Basin Unified 70.5 83.3 26.6 16.6 2.9 0.1 0 0 0 0
Kern Eastern Kern 58.4 62.9 24.1 28.2 16.4 8.9 1.0 0 0 0
Kern San Joaquin Valley 48.9 53.3 17.9 29.4 22.2 16.4 10.3 0.9 0.7 0
Kings San Joaquin Valley 60.4 67.6 21.6 27.8 15.8 4.4 2.2 0.2 0 0
Lake Lake County 96.6 97.9 3.3 2.0 0.1 0.1 0 0 0 0

P a g e | 51
County Air District
Good Moderate Unhealthy
for Sensitive Groups
Unhealthy Very
Unhealthy
2000-2002
2012-2014
2000-2002
2012-2014
2000-2002
2012-2014
2000-2002
2012-2014
2000-2002
2012-2014
Percent of Days for Ozone
Lassen* Lassen County NA NA NA NA NA NA NA NA NA NA
Los Angeles Antelope Valley 62.5 65.6 20.0 26.2 14.6 8.2 2.8 0 0.1 0
Los Angeles South Coast 62.3 59.2 19.1 24.3 12.2 14.7 4.9 1.8 1.5 0
Madera San Joaquin Valley 67.9 67.9 22.3 25.4 9.3 6.3 0.5 0.4 0 0
Marin Bay Area 99.8 99.5 0.2 0.5 0 0 0 0 0 0
Mariposa Mariposa County 61.2 70.4 24.0 27.3 14.3 2.3 0.5 0 0 0
Mendocino Mendocino County 99.5 99.8 0.5 0.2 0 0 0 0 0 0
Merced San Joaquin Valley 58.8 75.1 21.4 20.9 16.4 4.0 3.2 0 0.2 0
Modoc* Modoc County NA NA NA NA NA NA NA NA NA NA
Mono* Great Basin Unified NA NA NA NA NA NA NA NA NA NA
Monterey Monterey Bay Unified 97.4 98.9 2.5 1.1 0.2 0 0 0 0 0
Napa Bay Area 98.5 99.0 1.3 0.9 0.2 0.1 0 0 0 0
Nevada Northern Sierra 59.4 71.6 24.7 25.9 14.5 2.5 1.4 0 0 0
Orange South Coast 85.6 90.0 12.0 8.7 2.3 1.3 0.2 0 0 0
Placer Placer County 70.9 77.4 16.4 19.4 10.4 3.2 2.3 0 0 0
Plumas* Northern Sierra 83.8 NA 14.8 NA 1.4 NA 0 NA 0 NA
Riverside* Mojave Desert NA 89.0 NA 10.0 NA 0.9 NA 0 NA 0
Riverside South Coast 48.0 47.8 20.4 30.7 20.4 19.7 9.8 1.8 1.4 0
Sacramento Sacramento Metro 70.2 78.3 17.2 15.6 10.2 5.7 2.4 0.5 0.1 0
San Benito Monterey Bay Unified 81.9 91.3 14.4 8.6 3.7 0.1 0 0 0 0
San Bernardino Mojave Desert 50.3 56.1 24.1 29.7 19.5 13.4 5.3 0.8 0.8 0
San Bernardino South Coast 52.5 53.4 17.9 22.1 16.3 18.4 9.6 6.0 3.7 0.1
San Diego San Diego County 64.8 70.1 24.3 27.3 9.5 2.7 1.4 0 0.1 0
San Francisco Bay Area 100 99.9 0 0.1 0 0 0 0 0 0
San Joaquin San Joaquin Valley 86.3 83.8 10.3 13.7 3.3 2.4 0.1 0.1 0 0
San Luis Obispo** San Luis Obispo County 86.3 79.3 12.7 19.2 1.0 1.6 0 0 0 0
San Mateo Bay Area 99.6 99.4 0.4 0.6 0 0 0 0 0 0
Santa Barbara Santa Barbara County 74.5 91.8 20.2 7.6 5.2 0.6 0.1 0 0 0
Santa Clara Bay Area 92.1 95.1 6.4 4.5 1.0 0.5 0.5 0 0 0
Santa Cruz Monterey Bay Unified 96.7 99.5 3.1 0.5 0.2 0 0 0 0 0
Shasta Shasta County 81.0 89.1 16.5 10.5 2.5 0.4 0 0 0 0
Sierra* Northern Sierra NA NA NA NA NA NA NA NA NA NA
Siskiyou Siskiyou County 96.7 97.9 3.3 2.1 0 0 0 0 0 0

P a g e | 52
County Air District
Good Moderate Unhealthy
for Sensitive Groups
Unhealthy Very
Unhealthy
2000-2002
2012-2014
2000-2002
2012-2014
2000-2002
2012-2014
2000-2002
2012-2014
2000-2002
2012-2014
Percent of Days for Ozone
Solano Bay Area/Yolo-Solano 93.9 96.0 5.1 3.9 1.0 0.1 0 0 0 0
Sonoma Bay Area 97.7 99.7 2.2 0.3 0.1 0 0 0 0 0
Sonoma Northern Sonoma County 99.0 99.1 1.0 0.9 0 0 0 0 0 0
Stanislaus San Joaquin Valley 74.9 71.8 16.7 20.7 7.4 7.2 1.0 0.3 0 0
Sutter Feather River 83.0 94.7 13.0 5.2 4.0 0.1 0 0 0 0
Tehama Tehama County 76.1 77.7 18.8 21.2 5.2 1.2 0 0 0 0
Trinity* North Coast Unified NA NA NA NA NA NA NA NA NA NA
Tulare San Joaquin Valley 50.6 55.6 15.0 25.2 25.9 18.8 8.4 0.5 0.1 0
Tuolumne Tuolumne County 60.3 81.1 26.2 18.3 12.9 0.6 0.6 0 0 0
Ventura Ventura County 61.6 78.4 24.5 19.2 12.2 2.5 1.7 0 0 0
Yolo Yolo-Solano 87.7 94.2 9.7 5.6 2.6 0.2 0 0 0 0
Yuba* Feather River NA NA NA NA NA NA NA NA NA NA
* County did not contain official monitoring stations for ozone during one or both periods. ** See explanation on page 38 regarding apparent increase in ozone levels over the reference periods.

P a g e | 53
APPENDIX C – AQI FOR PARTICULATE MATTER
This table shows the percent of days in each of the AQI reporting categories for each county,
comparing the years 2000-2002 and 2012-2014, for the daily maximum 24-hour PM2.5
measurement. For PM2.5, an AQI value of 101 or higher corresponds to the 24-hour PM2.5
concentration exceeding the NAAQS of 35 micrograms per cubic meter, indicated in the table by a
percentage greater than zero in the „Unhealthy for Sensitive Groups,‟ or „Unhealthy‟ or „Very
Unhealthy‟ categories.
The recent data may not be complete or finalized for some air districts and should be treated as
preliminary and subject to change when validated. In addition, some air districts may have
changed the number of stations or the frequency of monitoring between 2000 and 2014. The data
used in this report may include data flagged as being influenced by exceptional events, such as
wildfire smoke or windblown dust, which are generally uncontrollable in spite of best emissions
controls. In such cases, including several large wildfire events in Northern and Central California in
recent years, the tables may indicate more days of unhealthful air quality than is typically seen in
those counties. Please refer to your local air district for more specific information.
County Air District
Good Moderate Unhealthy for
Sensitive Groups
Unhealthy Very
Unhealthy
2000-2002
2012-2014
2000-2002
2012-2014
2000-2002
2012-2014
2000-2002
2012-2014
2000-2002
2012-2014
Percent of Days for Particulate Matter (PM2.5)
Alameda Bay Area 61.8 67.0 31.0 32.3 5.6 0.6 1.6 0 0 0
Alpine* Great Basin Unified NA NA NA NA NA NA NA NA NA NA
Amador* Amador NA NA NA NA NA NA NA NA NA NA
Butte Butte County 67.4 78.0 24.3 21.6 5.0 0.3 3.3 0 0 0
Calaveras Calaveras County 83.7 88.8 15.2 11.1 1.1 0.1 0 0 0 0
Colusa Colusa County 76.7 84.3 22.1 15.7 0.9 0.0 0.3 0 0 0
Contra Costa Bay Area 67.4 69.6 24.7 30.1 6.0 0.3 1.8 0 0 0
Del Norte* North Coast Unified NA NA NA NA NA NA NA NA NA NA
El Dorado* El Dorado County NA NA NA NA NA NA NA NA NA NA
Fresno San Joaquin Valley 40.4 51.0 39.8 38.8 11.5 7.0 8.2 0 0.1 0
Glenn* Glenn County NA 79.6 NA 20.3 NA 0.1 NA 0 NA 0

P a g e | 54
County Air District
Good Moderate Unhealthy for
Sensitive Groups
Unhealthy Very
Unhealthy
2000-2002
2012-2014
2000-2002
2012-2014
2000-2002
2012-2014
2000-2002
2012-2014
2000-2002
2012-2014
Percent of Days for Particulate Matter (PM2.5)
Humboldt North Coast Unified 81.7 88.0 18.3 12.0 0 0 0 0 0 0
Imperial Imperial County 42.5 52.3 52.8 45.9 3.0 1.7 1.7 0 0 0
Inyo Great Basin Unified 90.6 89.1 5.0 9.0 2.0 0.4 2.3 0 0 0
Kern Eastern Kern 86.1 86.0 13.6 13.2 0.3 0.5 0 0 0 0
Kern San Joaquin Valley 33.4 47.3 49.3 42.2 9.5 6.0 7.7 0.1 0.1 0
Kings San Joaquin Valley 37.8 51.4 42.2 38.9 13.0 6.4 7.0 0 0 0
Lake Lake County 96.6 95.8 2.2 4.2 0.6 0.0 0.6 0 0 0
Lassen* Lassen County NA NA NA NA NA NA NA NA NA NA
Los Angeles Antelope Valley 76.2 97.3 23.5 2.1 0.3 0.7 0 0 0 0
Los Angeles South Coast 12.1 44.4 67.0 53.5 16.0 1.8 4.9 0 0 0
Madera* San Joaquin Valley NA 41.3 NA 52.6 NA 4.6 NA 0 NA 0
Marin* Bay Area NA 77.1 NA 22.6 NA 0.3 NA 0 NA 0
Mariposa* Mariposa County NA NA NA NA NA NA NA NA NA NA
Mendocino Mendocino County 85.9 83.4 12.4 16.6 1.1 0 0.6 0 0 0
Merced San Joaquin Valley 45.6 67.6 40.2 27.8 11.3 4.1 2.9 0 0 0
Modoc* Modoc County NA NA NA NA NA NA NA NA NA NA
Mono* Great Basin Unified NA NA NA NA NA NA NA NA NA NA
Monterey Monterey Bay Unified 87.0 93.1 13.0 6.9 0 0 0 0 0 0
Napa* Bay Area NA 62.0 NA 37.9 NA 0.1 NA 0 NA 0
Nevada Northern Sierra 86.1 90.9 13.6 8.3 0 0.5 0.3 0 0 0
Orange South Coast 28.3 75.3 59.7 23.6 9.3 1.0 2.7 0 0 0
Placer Placer County 73.2 85.1 22.3 13.7 4.5 0.5 0 0.1 0 0
Plumas Northern Sierra 63.6 60.1 31.1 32.7 5.1 7.0 0.3 0 0 0

P a g e | 55
County Air District
Good Moderate Unhealthy for
Sensitive Groups
Unhealthy Very
Unhealthy
2000-2002
2012-2014
2000-2002
2012-2014
2000-2002
2012-2014
2000-2002
2012-2014
2000-2002
2012-2014
Percent of Days for Particulate Matter (PM2.5)
Riverside* Mojave Desert NA NA NA NA NA NA NA NA NA NA
Riverside South Coast 13.7 41.4 58.1 56.0 19.0 2.5 9.1 0 0 0
Sacramento Sacramento Metro 68.0 75.0 25.7 23.4 4.1 1.6 2.2 0 0 0
San Benito* Monterey Bay Unified NA 96.3 NA 3.7 NA 0 NA 0 NA 0
San Bernardino Mojave Desert 58.8 97.4 41.0 2.6 0.3 0 0 0 0 0
San Bernardino South Coast 8.7 46.0 66.0 51.5 17.7 1.9 7.6 0 0 0
San Diego San Diego County 26.9 51.8 66.5 47.6 6.2 0.3 0.4 0 0 0
San Francisco Bay Area 60.2 80.2 32.9 19.5 5.2 0.3 1.7 0 0 0
San Joaquin San Joaquin Valley 61.1 54.3 30.0 40.9 7.3 3.8 1.6 0 0 0
San Luis Obispo
San Luis Obispo County 77.4 56.6 19.9 42.6 2.2 0.8 0.5 0 0 0
San Mateo Bay Area 68.2 80.5 27.4 19.2 4.0 0.3 0.4 0 0 0
Santa Barbara
Santa Barbara County 69.4 77.0 30.1 23.0 0.5 0 0 0 0 0
Santa Clara Bay Area 55.1 75.6 36.2 23.8 6.4 0.5 2.3 0 0 0
Santa Cruz Monterey Bay Unified 84.8 97.1 15.2 2.9 0 0 0 0 0 0
Shasta Shasta County 79.4 86.2 17.6 13.8 2.9 0 0 0 0 0
Sierra* Northern Sierra NA NA NA NA NA NA NA NA NA NA
Siskiyou* Siskiyou County NA 84.8 NA 12.9 NA 1.2 NA 0 NA 0
Solano
Bay Area/Yolo-Solano 62.8 76.8 30.0 22.4 4.7 0.7 2.5 0 0 0
Sonoma Bay Area 71.8 84.1 22.3 15.9 5.5 0 0.4 0 0 0
Sonoma*
Northern Sonoma County NA NA NA NA NA NA NA NA NA NA
Stanislaus San Joaquin Valley 54.4 59.6 34.0 32.4 6.7 6.4 4.9 0 0 0

P a g e | 56
County Air District
Good Moderate Unhealthy for
Sensitive Groups
Unhealthy Very
Unhealthy
2000-2002
2012-2014
2000-2002
2012-2014
2000-2002
2012-2014
2000-2002
2012-2014
2000-2002
2012-2014
Percent of Days for Particulate Matter (PM2.5)
Sutter Feather River 70.0 80.1 27.0 19.5 2.0 0.4 1.0 0 0 0
Tehama* Tehama County NA 85.9 NA 13.7 NA 0.4 NA 0 NA 0
Trinity* North Coast Unified NA 96.3 NA 3.7 NA 0 NA 0 NA 0
Tulare San Joaquin Valley 35.0 51.6 46.2 39.5 10.3 4.9 8.5 0 0 0
Tuolumne* Tuolumne County NA NA NA NA NA NA NA NA NA NA
Ventura Ventura County 35.4 58.3 60.6 41.6 4.0 0.1 0 0 0 0
Yolo Yolo-Solano 77.9 89.2 20.4 10.8 1.2 0 1 0 0 0
Yuba* Feather River NA NA NA NA NA NA NA NA NA NA
* County did not contain official monitoring stations for PM2.5 during one or both periods.

P a g e | 57
APPENDIX D– EXCEEDANCES: OZONE
This table shows the average percent of days in each county when at least one county monitoring
station exceeded the level of the 8-hour ozone NAAQS (75 ppb) for the reporting periods of 2000-
2002 and 2012-2014. Recent data may not be complete or finalized for some air districts and
should be treated as preliminary and subject to change when validated. In addition, some air
districts may have changed the number of stations or frequency of monitoring between each
reporting period. Please refer to your local air district for more specific information.
County Air District
Percent of Days Exceeding the 8-hour NAAQS (75 ppb)
2000-2002 2012-2014
Alameda Bay Area 1.9 0.7
Alpine* Great Basin Unified No Data No Data
Amador Amador County 6.5 0.8
Butte Butte County 8.3 0.8
Calaveras Calaveras County 8.8 0.5
Colusa Colusa County 1.5 0
Contra Costa Bay Area 2.2 0.5
Del Norte* North Coast Unified No Data No Data
El Dorado El Dorado County 17.8 4.6
Fresno San Joaquin Valley 37.3 17.8
Glenn Glenn County 0.7 0
Humboldt* North Coast Unified No Data 0
Imperial Imperial County 7.2 3.7
Inyo Great Basin Unified 2.9 0.1
Kern Eastern Kern 17.5 8.9
Kern San Joaquin Valley 33.2 17.3
Kings San Joaquin Valley 18.0 4.6
Lake Lake County 0.1 0.1
Lassen* Lassen County No Data No Data
Los Angeles Antelope Valley 17.7 8.2
Los Angeles South Coast 18.6 16.5
Madera San Joaquin Valley 9.8 6.7
Marin Bay Area 0 0
Mariposa Mariposa County 14.8 2.3
Mendocino Mendocino County 0 0
Merced San Joaquin Valley 19.8 4.0
Modoc* Modoc County No Data No Data
Mono* Great Basin Unified No Data No Data
Monterey Monterey Bay Unified 0.2 0

P a g e | 58
County Air District
Percent of Days Exceeding the 8-hour NAAQS (75 ppb)
2000-2002 2012-2014
Napa Bay Area 0.2 0.1
Nevada Northern Sierra 15.9 2.5
Orange South Coast 2.5 1.3
Placer Placer County 12.7 3.2
Plumas* Northern Sierra 1.4 No Data
Riverside* Mojave Desert No Data 0.9
Riverside South Coast 31.6 21.5
Sacramento Sacramento Metro 12.7 6.1
San Benito Monterey Bay Unified 3.7 0.1
San Bernardino Mojave Desert 25.6 14.2
San Bernardino South Coast 29.7 24.5
San Diego San Diego County 10.9 2.7
San Francisco Bay Area 0 0
San Joaquin San Joaquin Valley 3.4 2.5
San Luis Obispo** San Luis Obispo County 1.0 1.6
San Mateo Bay Area 0 0
Santa Barbara Santa Barbara County 6.0 0.6
Santa Clara Bay Area 1.5 0.5
Santa Cruz Monterey Bay Unified 0.2 0
Shasta Shasta County 2.5 0.4
Sierra* Northern Sierra No Data No Data
Siskiyou Siskiyou County 0 0
Solano Bay Area/Yolo-Solano 0.6 0.1
Sonoma Bay Area 0.1 0
Sonoma Northern Sonoma County 0 0
Stanislaus San Joaquin Valley 8.4 7.5
Sutter Feather River 3.0 0.1
Tehama Tehama County 6.6 1.2
Trinity* North Coast Unified No Data No Data
Tulare San Joaquin Valley 34.4 19.3
Tuolumne Tuolumne County 13.6 0.6
Ventura Ventura County 14.0 2.5
Yolo Yolo-Solano 2.6 0.2
Yuba* Feather River No Data No Data
* County did not contain official monitoring stations for ozone during one or both periods. ** See explanation on page 38 regarding apparent increase in ozone levels over the reference periods.

P a g e | 59
APPENDIX E– OZONE AIR QUALITY TRENDS
This table shows the percent above or below the current ozone NAAQS for each county over the
comparison reporting periods of 2000-2002 and 2012-2014. This method uses the 3-year “design
values” for each county, which is the metric used to assess attainment of the NAAQS. It takes into
account both the level and the form of the federal standard for the county‟s highest station,
averaged over three years. A positive number means the county is above, or not in attainment of,
the NAAQS and a negative number or zero indicates that the county is below, or in attainment of,
the NAAQS for that period. The data in this table illustrate the changes that have occurred between
the two reporting periods.
Data may not be complete or finalized for some air districts and should be treated as preliminary
and subject to change when validated. In addition, some air districts may have changed the
number of stations or frequency of monitoring between 2000-2002 and 2012-2014 averaging
periods. Please refer to your local air district for more specific information.
County Air District
Percent of Ozone Design Value Above/Below the 8-hour Ozone NAAQS
(75 ppb)
2000-2002 2012-2014
Alameda Bay Area 8 -4
Alpine* Great Basin Unified No Data No Data
Amador Amador County 17 -4
Butte Butte County 19 0
Calaveras Calaveras County 23 -5
Colusa Colusa County 1 -20
Contra Costa Bay Area 4 -11
Del Norte* North Coast Unified No Data No Data
El Dorado El Dorado County 41 12
Fresno San Joaquin Valley 53 28
Glenn Glenn County -1 -12
Humboldt* North Coast Unified No Data -40
Imperial Imperial County 16 7
Inyo Great Basin Unified 8 -7
Kern Eastern Kern 27 12
Kern San Joaquin Valley 49 21
Kings San Joaquin Valley 32 12
Lake Lake County -15 -19
Lassen* Lassen County No Data No Data
Los Angeles Antelope Valley 23 15
Los Angeles South Coast 51 31
Madera San Joaquin Valley 21 15
Marin Bay Area -37 -25

P a g e | 60
County Air District
Percent of Ozone Design Value Above/Below the 8-hour Ozone NAAQS
(75 ppb)
2000-2002 2012-2014
Mariposa Mariposa County 19 5
Mendocino Mendocino County -27 -32
Merced San Joaquin Valley 35 8
Modoc* Modoc County No Data No Data
Mono* Great Basin Unified No Data No Data
Monterey Monterey Bay Unified -15 -21
Napa Bay Area -16 -23
Nevada Northern Sierra 31 8
Orange South Coast 7 -1
Placer Placer County 35 8
Plumas* Northern Sierra -5 No Data
Riverside* Mojave Desert No Data -7
Riverside South Coast 51 25
Sacramento Sacramento Metro 33 13
San Benito Monterey Bay Unified 8 -7
San Bernardino Mojave Desert 41 24
San Bernardino South Coast 71 39
San Diego San Diego County 27 5
San Francisco Bay Area -41 -37
San Joaquin San Joaquin Valley 8 5
San Luis Obispo** San Luis Obispo County -3 1
San Mateo Bay Area -31 -25
Santa Barbara Santa Barbara County 8 -7
Santa Clara Bay Area 9 -7
Santa Cruz Monterey Bay Unified -12 -21
Shasta Shasta County 4 -7
Sierra* Northern Sierra No Data No Data
Siskiyou Siskiyou County -7 -17
Solano Bay Area/Yolo-Solano -4 -11
Sonoma Bay Area -16 -29
Sonoma Northern Sonoma County -16 -24
Stanislaus San Joaquin Valley 27 13
Sutter Feather River 9 -12
Tehama Tehama County 11 0
Trinity* North Coast Unified No Data No Data
Tulare San Joaquin Valley 40 21
Tuolumne Tuolumne County 21 -3

P a g e | 61
County Air District
Percent of Ozone Design Value Above/Below the 8-hour Ozone NAAQS
(75 ppb)
2000-2002 2012-2014
Ventura Ventura County 29 5
Yolo Yolo-Solano 11 -9
Yuba* Feather River No Data No Data
* County did not contain official monitoring stations for ozone during one or both periods. ** See explanation on page 38 regarding apparent increase in ozone levels over the reference periods.

P a g e | 62
APPENDIX F– EXCEEDANCES: PM2.5
This table shows the average percent of days when at least one county monitoring station
exceeded the level of the 24-hour PM2.5 NAAQS (35 µg/m3) for the reporting periods of 2000-
2002 and 2012-2014. Recent data may not be complete or finalized for some air districts, and
should be treated as preliminary and subject to change when validated. In addition, some air
districts may have changed the number of stations or frequency of monitoring between the
reporting periods. Some of the data contributing to exceedances of the PM2.5 NAAQS may be
influenced by exceptional events, such as wildfires. Please refer to your local air district for more
specific information.
County Air District
Percent of Days Exceeding the 24-hour PM2.5 NAAQS
2000-2002 2012-2014
Alameda Bay Area 7.2 0.6
Alpine* Great Basin Unified No Data No Data
Amador* Amador County No Data No Data
Butte Butte County 8.3 0.4
Calaveras Calaveras County 1.1 0.1
Colusa Colusa County 1.2 0
Contra Costa Bay Area 7.8 0.3
Del Norte* North Coast Unified No Data No Data
El Dorado* El Dorado County No Data No Data
Fresno San Joaquin Valley 19.8 10.2
Glenn* Glenn County No Data 0.1
Humboldt North Coast Unified 0 0
Imperial Imperial County 4.7 1.9
Inyo Great Basin Unified 4.4 1.8
Kern Eastern Kern 0.3 0.8
Kern San Joaquin Valley 17.3 10.6
Kings San Joaquin Valley 20.0 9.7
Lake Lake County 1.1 0
Lassen* Lassen County No Data No Data
Los Angeles Antelope Valley 0.3 0.7
Los Angeles South Coast 20.8 2.0
Madera* San Joaquin Valley No Data 6.1
Marin* Bay Area No Data 0.3
Mariposa* Mariposa County No Data No Data
Mendocino Mendocino County 1.7 0

P a g e | 63
County Air District
Percent of Days Exceeding the 24-hour PM2.5 NAAQS
2000-2002 2012-2014
Merced San Joaquin Valley 14.2 4.6
Modoc* Modoc County No Data No Data
Mono* Great Basin Unified No Data No Data
Monterey Monterey Bay Unified 0 0
Napa* Bay Area No Data 0.1
Nevada Northern Sierra 0.3 0.8
Orange South Coast 11.9 1.1
Placer Placer County 4.5 1.2
Plumas Northern Sierra 5.3 7.3
Riverside* Mojave Desert No Data No Data
Riverside South Coast 28.1 2.7
Sacramento Sacramento Metro 6.3 1.6
San Benito* Monterey Bay Unified No Data 0
San Bernardino Mojave Desert 0.3 0
San Bernardino South Coast 25.3 2.5
San Diego San Diego County 6.5 0.5
San Francisco Bay Area 6.9 0.3
San Joaquin San Joaquin Valley 8.9 4.8
San Luis Obispo San Luis Obispo County 2.7 0.8
San Mateo Bay Area 4.4 0.3
Santa Barbara Santa Barbara County 0.5 0
Santa Clara Bay Area 8.7 0.6
Santa Cruz Monterey Bay Unified 0 0
Shasta Shasta County 2.9 0
Sierra* Northern Sierra No Data No Data
Siskiyou* Siskiyou County No Data 2.3
Solano Bay Area/Yolo-Solano 7.2 0.7
Sonoma Bay Area 5.9 0
Sonoma* Northern Sonoma County No Data No Data
Stanislaus San Joaquin Valley 11.6 8.0
Sutter Feather River 3.2 0.4
Tehama* Tehama County No Data 0.4
Trinity* North Coast Unified No Data 0
Tulare San Joaquin Valley 18.7 8.9
Tuolumne* Tuolumne County No Data No Data
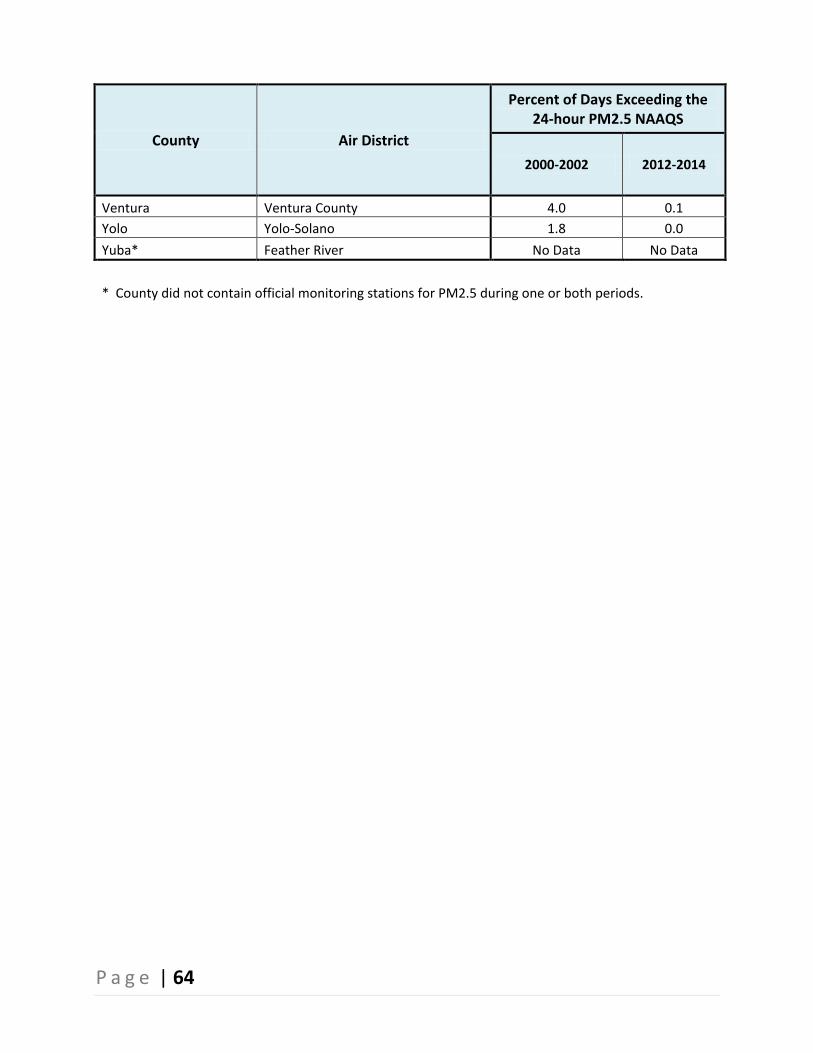
P a g e | 64
County Air District
Percent of Days Exceeding the 24-hour PM2.5 NAAQS
2000-2002 2012-2014
Ventura Ventura County 4.0 0.1
Yolo Yolo-Solano 1.8 0.0
Yuba* Feather River No Data No Data
* County did not contain official monitoring stations for PM2.5 during one or both periods.

P a g e | 65
APPENDIX G– PARTICULATE MATTER AIR QUALITY TRENDS
This table shows the percent above or below the current PM2.5 NAAQS for each county over the
comparison reporting periods of 2000-2002 and 2012-2014. This method uses the 3-year “design
values” for each county, which is the metric used to assess attainment of the NAAQS. It takes into
account both the level and the form of the federal standard for the county‟s highest station,
averaged over three years. A positive number means the county is above, or not in attainment of,
the NAAQS and a negative number or zero indicates that the county is below, or in attainment of,
the NAAQS for that period. The data in this table illustrate the changes that have occurred between
the two reporting periods.
Recent data may not be complete or finalized for some air districts and all data should be treated
as preliminary and subject to change when validated. Some of the data contributing to
exceedances of the PM2.5 NAAQS may be influenced by exceptional events, such as wildfires. In
addition, some air districts may have changed the number of stations or frequency of monitoring in
between the 2000-2002 and 2012-2014 averaging periods. Please refer to your local air district for
more specific information.
County Air District
Percent of PM2.5 Design Value Above/Below the 24-hour NAAQS
(35 µg/m3)
2000-2002 2012-2014
Alameda Bay Area 40 -23
Alpine* Great Basin Unified No Data No Data
Amador* Amador County No Data No Data
Butte Butte County 71 -26
Calaveras Calaveras County -26 -46
Colusa Colusa County 6 -40
Contra Costa Bay Area 37 -37
Del Norte* North Coast Unified No Data No Data
El Dorado* El Dorado County No Data No Data
Fresno San Joaquin Valley 129 77
Glenn* Glenn County No Data -31
Humboldt North Coast Unified -31 -34
Imperial Imperial County 43 -11
Inyo Great Basin Unified 46 -6
Kern Eastern Kern -34 -23
Kern San Joaquin Valley 157 103
Kings San Joaquin Valley 100 86
Lake Lake County -37 -63
Lassen* Lassen County No Data No Data
Los Angeles Antelope Valley -34 -37

P a g e | 66
County Air District
Percent of PM2.5 Design Value Above/Below the 24-hour NAAQS
(35 µg/m3)
2000-2002 2012-2014
Los Angeles South Coast 97 -9
Madera* San Joaquin Valley No Data 43
Marin* Bay Area No Data -37
Mariposa* Mariposa County No Data No Data
Mendocino Mendocino County -20 -40
Merced San Joaquin Valley 57 49
Modoc* Modoc County No Data No Data
Mono* Great Basin Unified No Data No Data
Monterey Monterey Bay Unified -37 -63
Napa* Bay Area No Data Insufficient Data
Nevada Northern Sierra -29 -9
Orange South Coast 65 -23
Placer Placer County 26 -34
Plumas Northern Sierra 20 29
Riverside* Mojave Desert No Data No Data
Riverside South Coast 107 9
Sacramento Sacramento Metro 71 -9
San Benito* Monterey Bay Unified No Data -63
San Bernardino Mojave Desert -26 -66
San Bernardino South Coast 94 -3
San Diego San Diego County 19 -23
San Francisco Bay Area 37 -34
San Joaquin San Joaquin Valley 54 29
San Luis Obispo San Luis Obispo County 11 -14
San Mateo Bay Area 20 -34
Santa Barbara Santa Barbara County -40 -51
Santa Clara Bay Area 80 -14
Santa Cruz Monterey Bay Unified -40 -63
Shasta Shasta County 0 -37
Sierra* Northern Sierra No Data No Data
Siskiyou* Siskiyou County No Data 20
Solano Bay Area/Yolo-Solano 49 -26
Sonoma Bay Area 14 -40
Sonoma* Northern Sonoma County No Data No Data
Stanislaus San Joaquin Valley 100 46
Sutter Feather River 20 -29

P a g e | 67
County Air District
Percent of PM2.5 Design Value Above/Below the 24-hour NAAQS
(35 µg/m3)
2000-2002 2012-2014
Tehama* Tehama County No Data -37
Trinity* North Coast Unified No Data -57
Tulare San Joaquin Valley 157 83
Tuolumne* Tuolumne County No Data No Data
Ventura Ventura County 11 -43
Yolo Yolo-Solano 0 -54
Yuba* Feather River No Data No Data
* County did not contain official monitoring stations for PM2.5 during one or both periods.

P a g e | 68
CALIFORNIA’S AIR DISTRICTS