p. diomede, d. j. economou and v. m. donnelly plasma processing laboratory, university of houston...
TRANSCRIPT
1
P. Diomede, D. J. Economou and V. M. DonnellyPlasma Processing Laboratory, University of Houston
Control of Ion Energy Distributions on Plasma Electrodes
DOE Plasma Science Center Teleseminar, February 8, 2013
2
Outline
• Introduction/Motivation• 3 Methods to control IEDs on plasma electrodes• PIC-MCC simulations and comparisons with
experiments• Model for rapid calculation of IED and comparisons
with experiments• Conclusions
3
Introduction / Motivation
• Control of the energy of ions bombarding a substrate is important for both plasma etching and PECVD.
• The ion energy must be high enough to drive anisotropic etching, but not too high to induce substrate damage and/or loss of selectivity.
• As device dimensions keep shrinking, requirements on selectivity and substrate damage become ever more stringent.
• In addition, the ion bombardment energy is critical for controlling film microstructure and properties in PECVD.
• Such requirements impose strict limits not only on the mean ion energy but also on the ion energy distribution (IED).
4
1 23
2 2/i
rf s
s M( )
eV
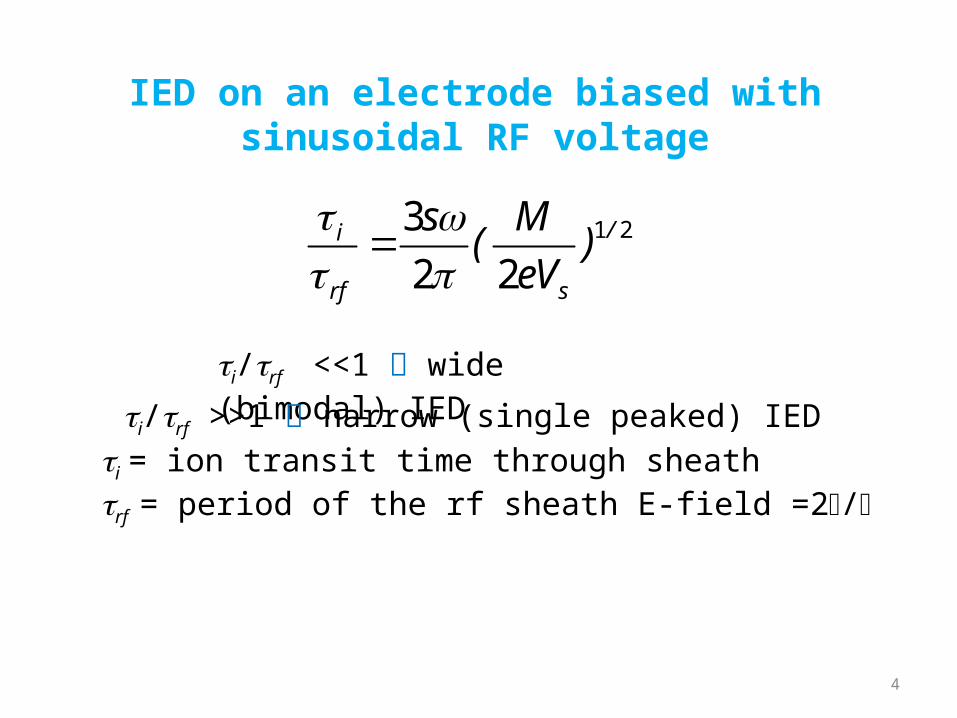
ti/trf <<1 wide (bimodal) IED
ti/trf >>1 narrow (single peaked) IED
IED on an electrode biased with sinusoidal RF voltage
ti = ion transit time through sheathtrf = period of the rf sheath E-field =2p/w
5
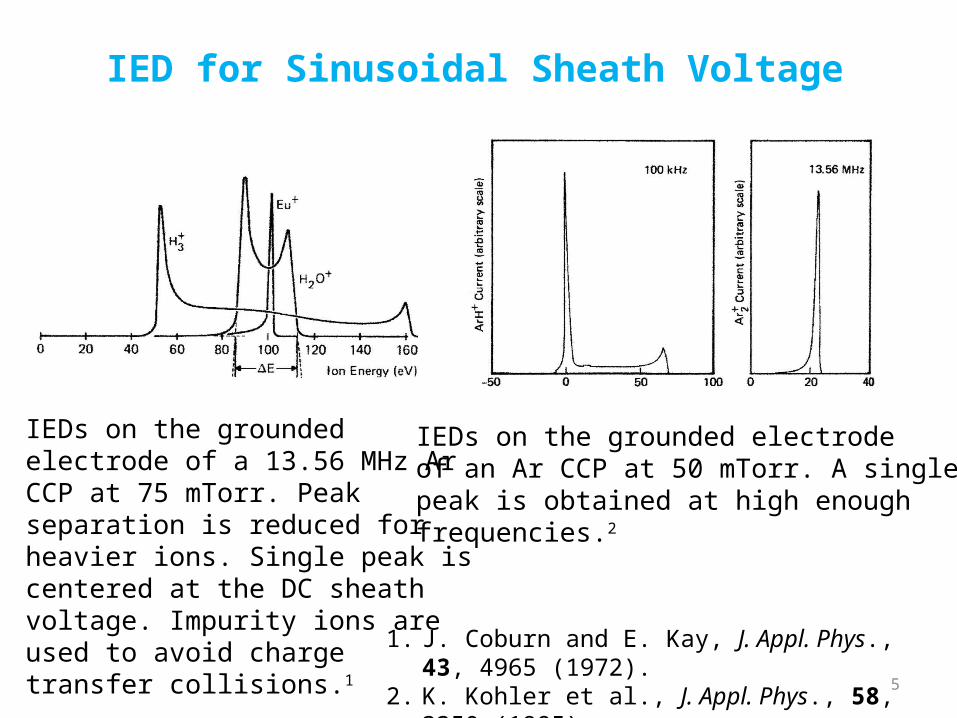
IED for Sinusoidal Sheath Voltage
IEDs on the grounded electrode of a 13.56 MHz Ar CCP at 75 mTorr. Peak separation is reduced for heavier ions. Single peak is centered at the DC sheath voltage. Impurity ions are used to avoid charge transfer collisions.1
IEDs on the grounded electrode of an Ar CCP at 50 mTorr. A singlepeak is obtained at high enough frequencies.2
1. J. Coburn and E. Kay, J. Appl. Phys., 43, 4965 (1972).2. K. Kohler et al., J. Appl. Phys., 58, 3350 (1985).
6
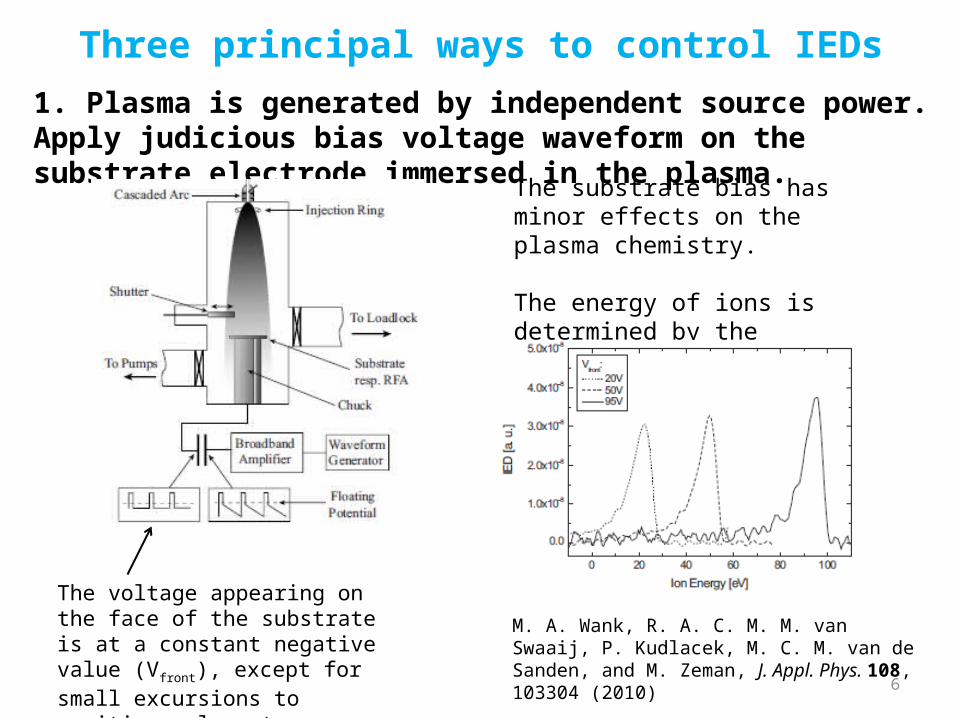
1. Plasma is generated by independent source power. Apply judicious bias voltage waveform on the substrate electrode immersed in the plasma.
M. A. Wank, R. A. C. M. M. van Swaaij, P. Kudlacek, M. C. M. van de Sanden, and M. Zeman, J. Appl. Phys. 108, 103304 (2010)
Three principal ways to control IEDs
The voltage appearing on the face of the substrate is at a constant negative value (Vfront), except for small excursions to positive values to neutralize the charge.
The substrate bias has minor effects on the plasma chemistry.
The energy of ions is determined by the substrate voltage.
7
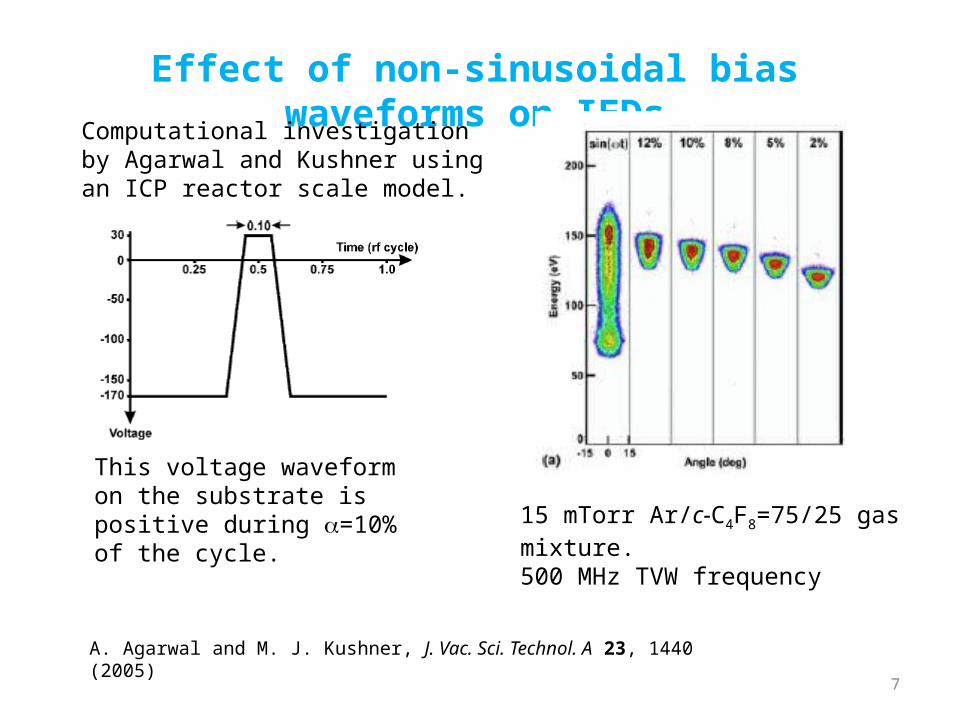
A. Agarwal and M. J. Kushner, J. Vac. Sci. Technol. A 23, 1440 (2005)
This voltage waveform on the substrate is positive during a=10% of the cycle.
Effect of non-sinusoidal bias waveforms on IEDs
Computational investigation by Agarwal and Kushner using an ICP reactor scale model.
15 mTorr Ar/c-C4F8=75/25 gas mixture.500 MHz TVW frequency
8
Three principal ways to control IEDs
• The Electrical Asymmetry Effect (EAE) provides a new method to control the ion energy distribution (IED) on plasma electrodes. Importantly, the ion flux can also be controlled, independently of the ion energy.
• A voltage of the form is applied to an electrode of a capacitively-coupled plasma (CCP) reactor, with
f2=2f1. The DC bias (thus the ion energy) can be varied simply by changing the phase q1.
• Adding higher harmonics enhances the EAE, but implementation becomes cumbersome.
• A DC bias can be imposed even on a geometrically symmetric system (equal electrode areas).
)2cos()2cos()( 22111 tfUtfUtV
2. Produce the plasma with customized voltage waveforms.
The Electrical Asymmetry Effect
9
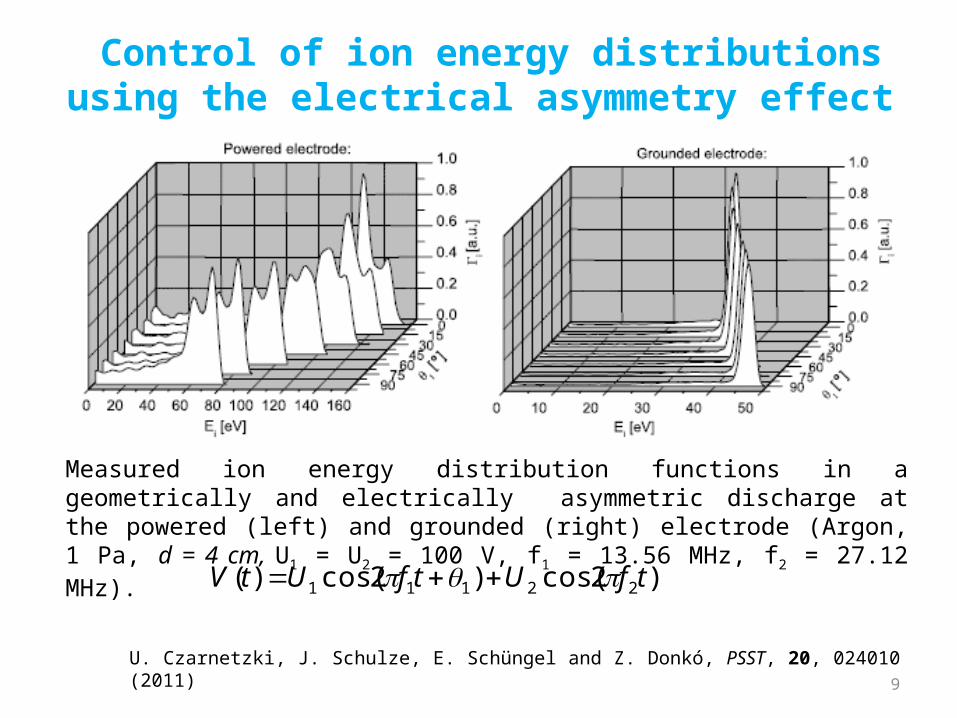
Measured ion energy distribution functions in a geometrically and electrically asymmetric discharge at the powered (left) and grounded (right) electrode (Argon, 1 Pa, d = 4 cm, U1 = U2 = 100 V, f1 = 13.56 MHz, f2 = 27.12 MHz).
)2cos()2cos()( 22111 tfUtfUtV
Control of ion energy distributions using the electrical asymmetry effect
U. Czarnetzki, J. Schulze, E. Schüngel and Z. Donkó, PSST, 20, 024010 (2011)
10
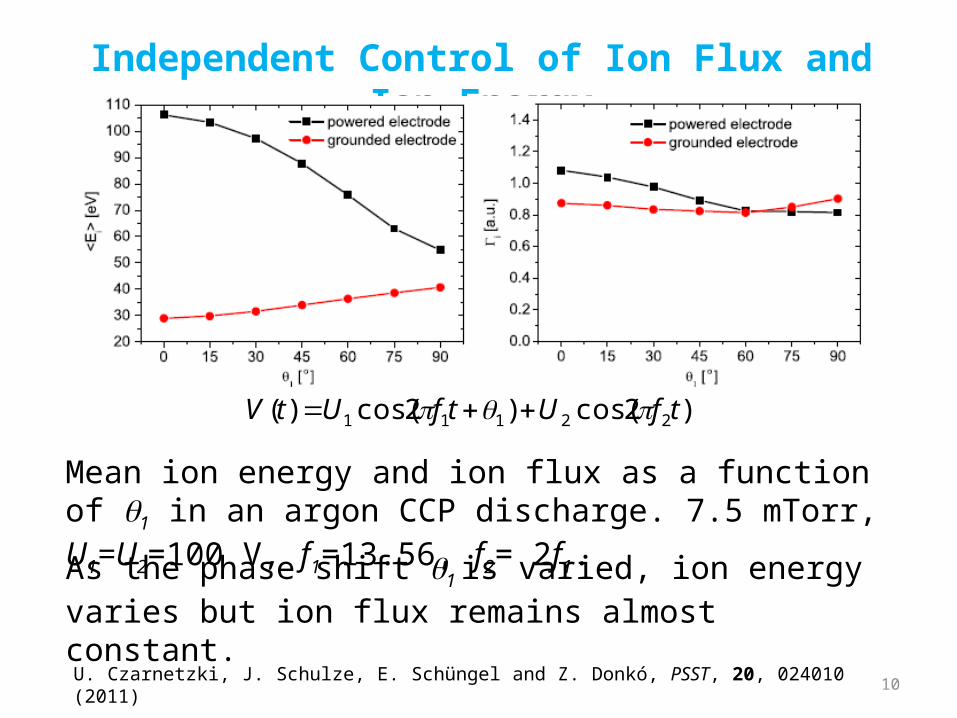
Mean ion energy and ion flux as a function of q1 in an argon CCP discharge. 7.5 mTorr, U1=U2=100 V, f1=13.56, f2= 2f1.
)2cos()2cos()( 22111 tfUtfUtV
Independent Control of Ion Flux and Ion Energy
As the phase shift q1 is varied, ion energy varies but ion flux remains almost constant.
U. Czarnetzki, J. Schulze, E. Schüngel and Z. Donkó, PSST, 20, 024010 (2011)
11
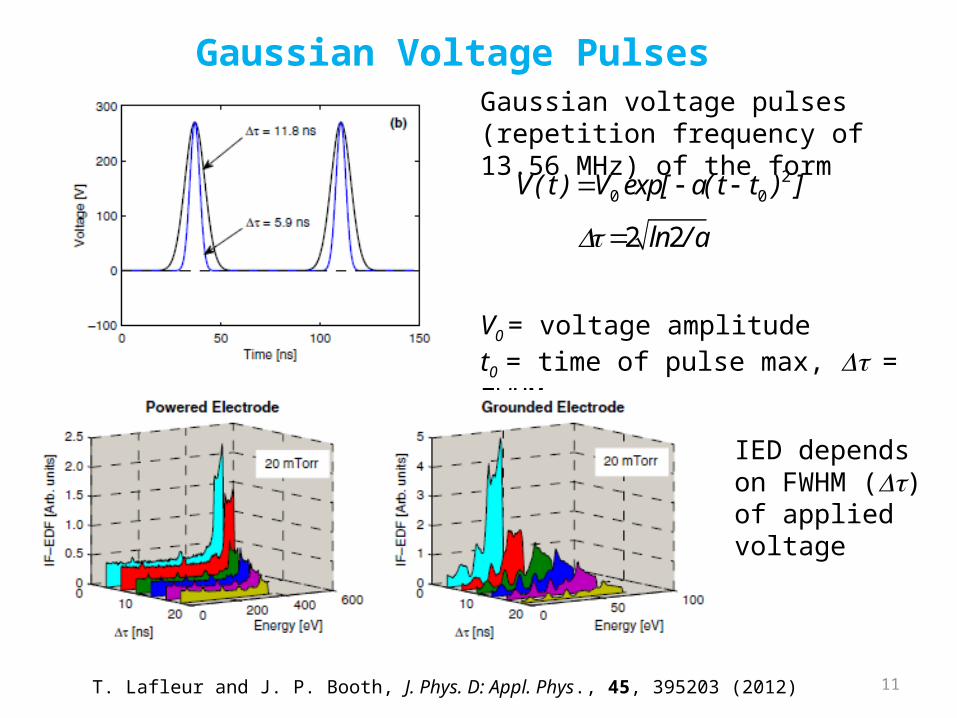
Gaussian voltage pulses (repetition frequency of 13.56 MHz) of the form
V0 = voltage amplitudet0 = time of pulse max, Dt = FWHM
20 0V( t ) V exp[ a( t t ) ]
2 2ln / a
T. Lafleur and J. P. Booth, J. Phys. D: Appl. Phys., 45, 395203 (2012)
Gaussian Voltage Pulses
IED depends on FWHM (Dt) of applied voltage

12
Three principal ways to control IEDs 3. Apply synchronous bias on boundary electrode during
afterglow of pulsed plasma
Boundary Voltage
Plasma
Boundary Electrode
Substrate
Plasma Power
Bias ON
ON OFF
For a grounded conductive substrate, the sheath voltage is equal to the plasma potential.
13
0 10 20 30 40 50 60 70 80 90 1000.0
0.5
1.0
1.5
2.0
2.5
3.0
3.5
4.0 OFFON
Te(e
V)
time (s)
0 10 20 30 40 50 60 70 80 90 1000
2
4
6
8
10
12
14
16
Vp(V
)time (s)
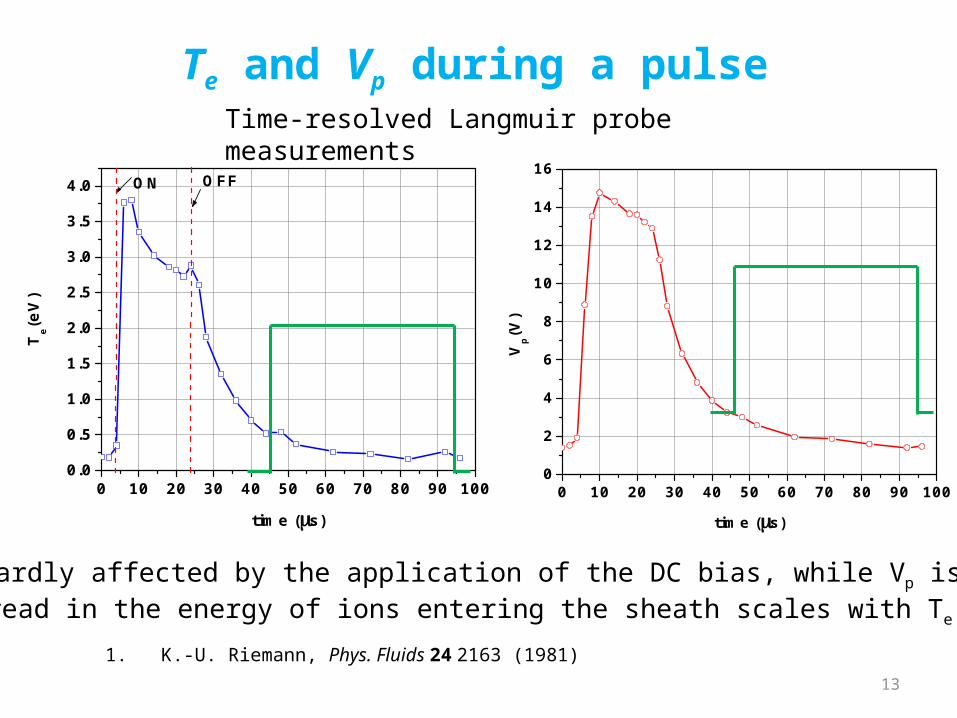
Time-resolved Langmuir probe measurements
13
• Te is hardly affected by the application of the DC bias, while Vp is raised.• The spread in the energy of ions entering the sheath scales with Te.1
1. K.-U. Riemann, Phys. Fluids 24 2163 (1981)
Te and Vp during a pulse
0 4 8 12 16 20 24 28 320.00
0.01
0.02
0.03
0.04
0.05
Tim
e-A
vera
ge
d I
on
En
erg
y D
istr
ibu
tion
Energy (eV)
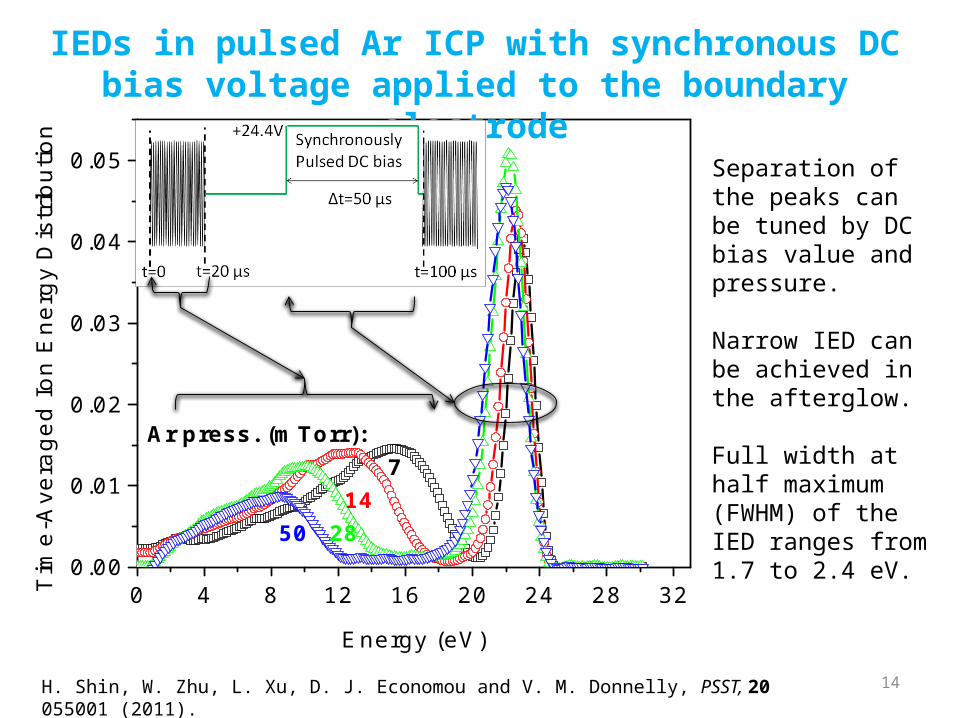
Ar press. (mTorr): 7 14 50 28
IEDs in pulsed Ar ICP with synchronous DC bias voltage applied to the boundary electrode
Separation of the peaks can be tuned by DC bias value and pressure.
Narrow IED can be achieved in the afterglow.
Full width at half maximum (FWHM) of the IED ranges from 1.7 to 2.4 eV.
14H. Shin, W. Zhu, L. Xu, D. J. Economou and V. M. Donnelly, PSST, 20 055001 (2011).
15
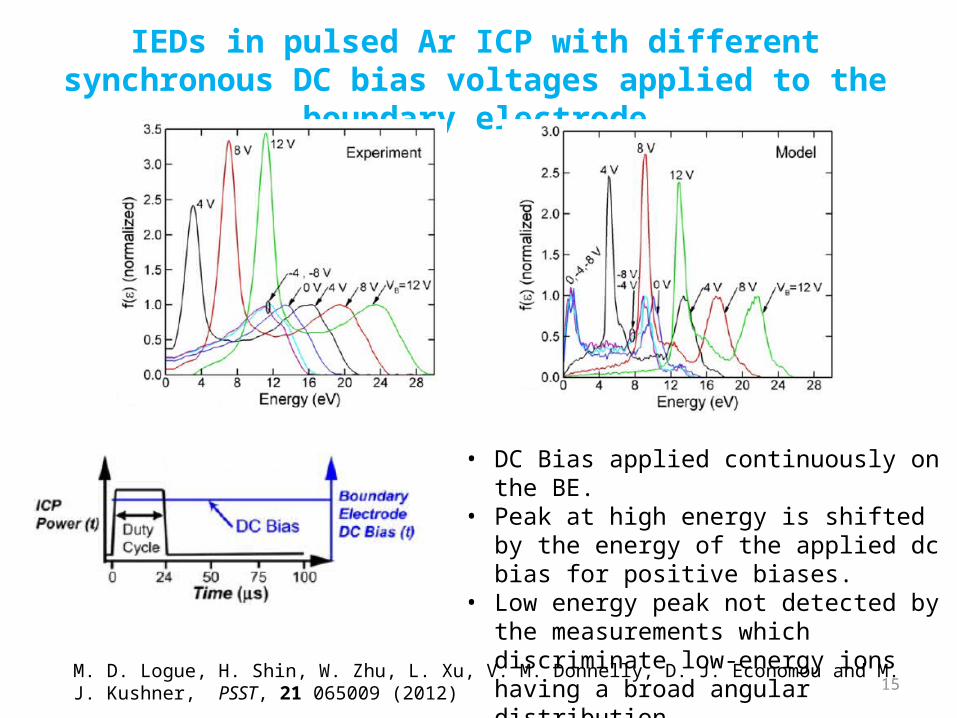
IEDs in pulsed Ar ICP with different synchronous DC bias voltages applied to the boundary electrode
M. D. Logue, H. Shin, W. Zhu, L. Xu, V. M. Donnelly, D. J. Economou and M. J. Kushner, PSST, 21 065009 (2012)
• DC Bias applied continuously on the BE.• Peak at high energy is shifted by the energy
of the applied dc bias for positive biases.• Low energy peak not detected by the
measurements which discriminate low-energy ions having a broad angular distribution.
16
PIC-MCC Simulations
• Simulation of pulsed plasma with synchronous boundary voltage.
• Comparison with experimental data.
17
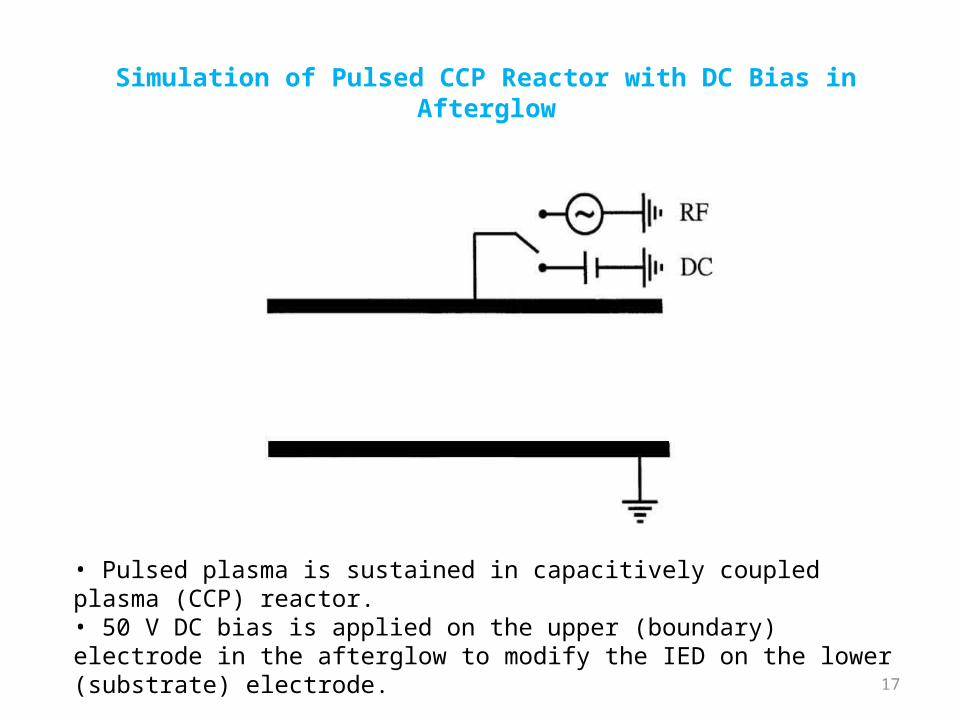
Simulation of Pulsed CCP Reactor with DC Bias in Afterglow
• Pulsed plasma is sustained in capacitively coupled plasma (CCP) reactor.• 50 V DC bias is applied on the upper (boundary) electrode in the afterglow to modify the IED on the lower (substrate) electrode.
18
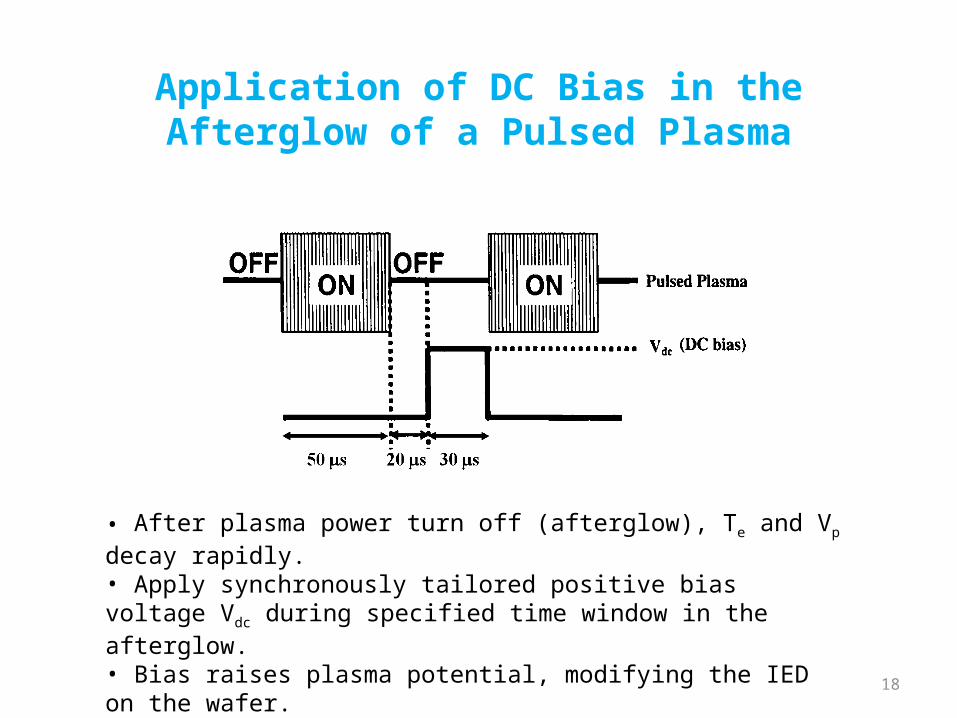
Application of DC Bias in the Afterglow of a Pulsed Plasma
• After plasma power turn off (afterglow), Te and Vp decay rapidly.• Apply synchronously tailored positive bias voltage Vdc during specified time window in the afterglow.• Bias raises plasma potential, modifying the IED on the wafer.
19
0 50 100 150 2000.0
0.2
0.4
0.6
0.8
1.0
1.2
No
rma
lize
d I
ED
Ion energy (eV)
0 50 100 150 2000.0
0.2
0.4
0.6
0.8
1.0
1.2
Nor
mal
ized
IED
Ion energy (eV)
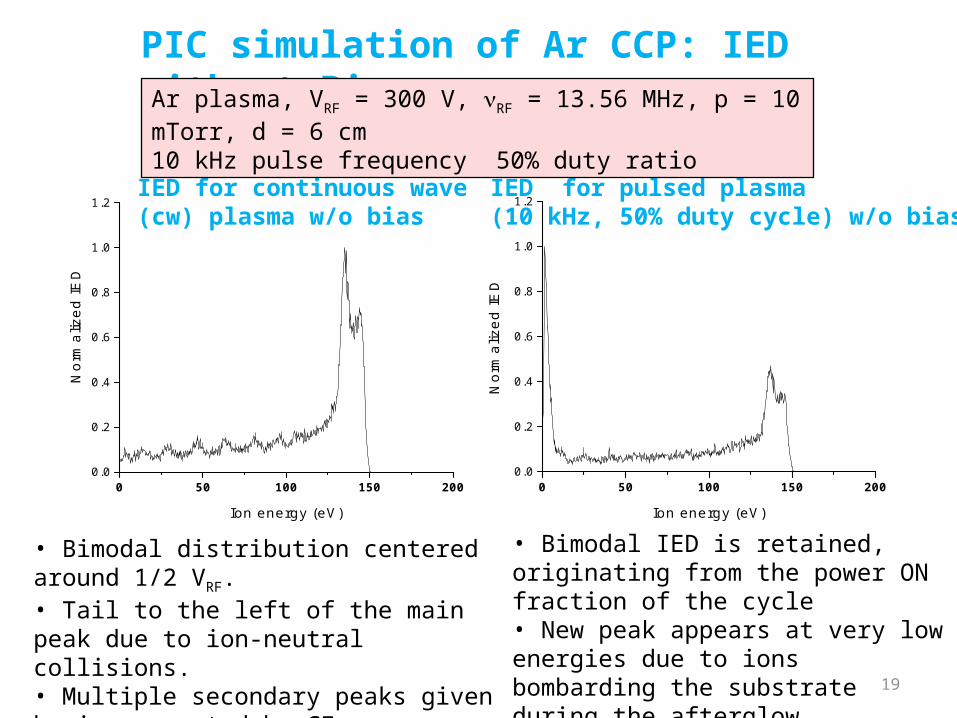
PIC simulation of Ar CCP: IED without Bias
IED for continuous wave (cw) plasma w/o bias
IED for pulsed plasma(10 kHz, 50% duty cycle) w/o bias
Ar plasma, VRF = 300 V, nRF = 13.56 MHz, p = 10 mTorr, d = 6 cm10 kHz pulse frequency 50% duty ratio
• Bimodal IED is retained, originating from the power ON fraction of the cycle• New peak appears at very low energies due to ions bombarding the substrate during the afterglow.
• Bimodal distribution centered around 1/2 VRF. • Tail to the left of the main peak due to ion-neutral collisions. • Multiple secondary peaks given by ions created by CE collisions.
20
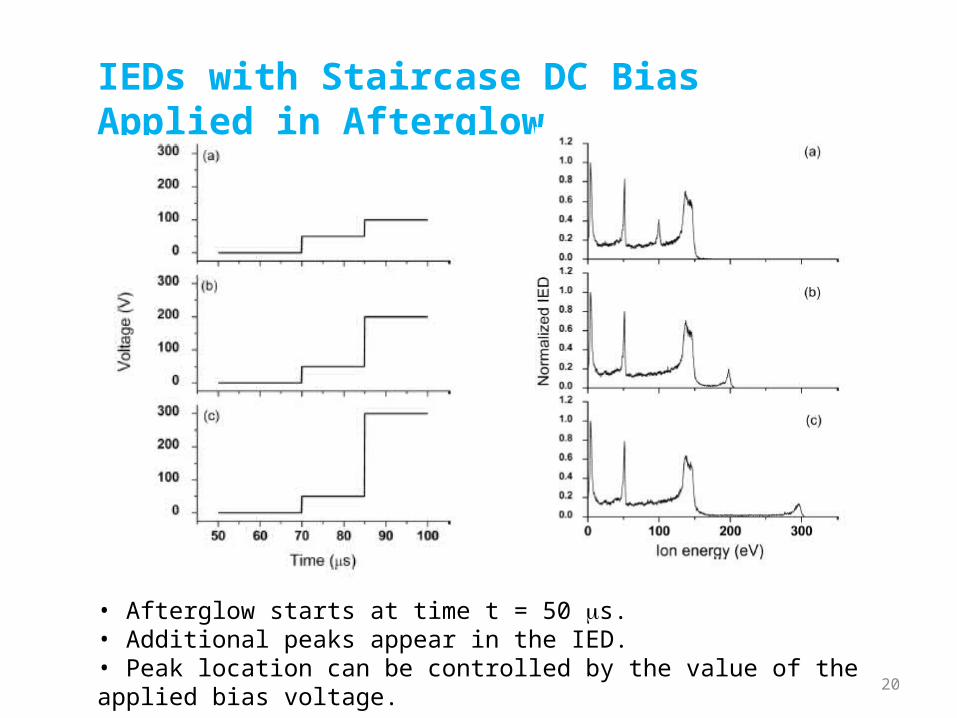
IEDs with Staircase DC Bias Applied in Afterglow
• Afterglow starts at time t = 50 ms.• Additional peaks appear in the IED.• Peak location can be controlled by the value of the applied bias voltage.
21
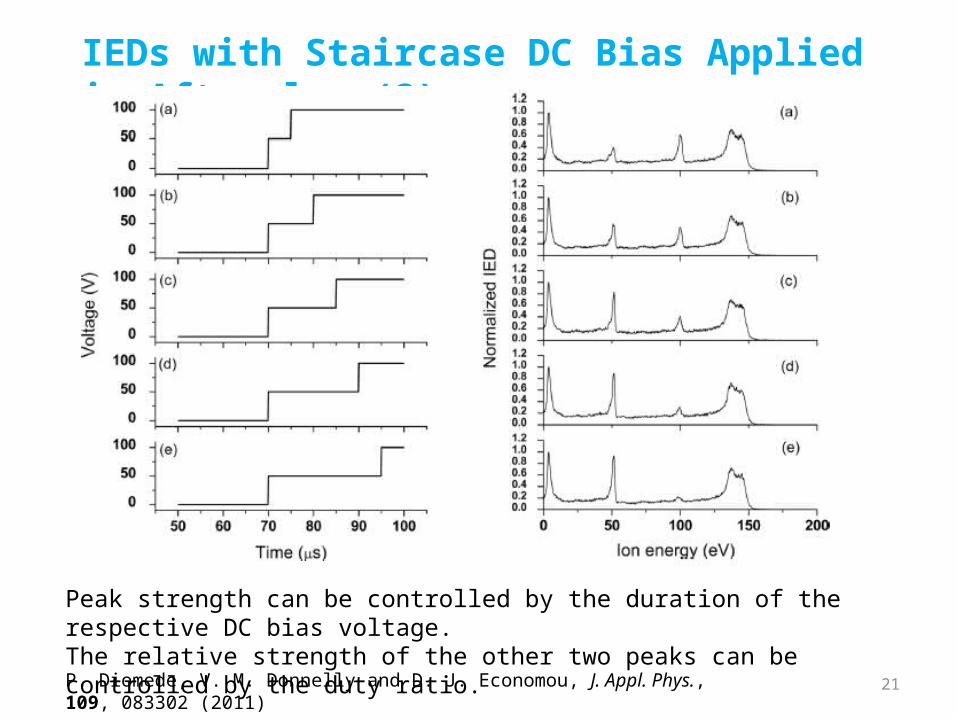
IEDs with Staircase DC Bias Applied in Afterglow (2)
Peak strength can be controlled by the duration of the respective DC bias voltage.The relative strength of the other two peaks can be controlled by the duty ratio.
P. Diomede, V. M. Donnelly and D. J. Economou, J. Appl. Phys., 109, 083302 (2011)
22
0 10 20 30 40 50 60 70 80 90 1000
1
2
3
ne (
1015
m-3)
Time (s)
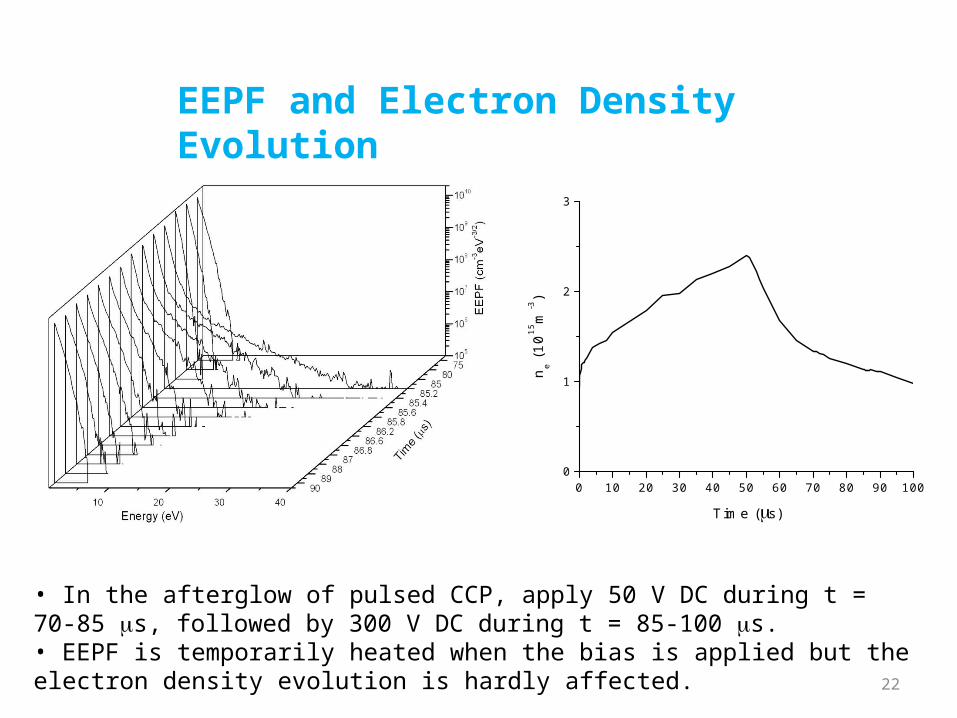
EEPF and Electron Density Evolution
• In the afterglow of pulsed CCP, apply 50 V DC during t = 70-85 ms, followed by 300 V DC during t = 85-100 ms.• EEPF is temporarily heated when the bias is applied but the electron density evolution is hardly affected.
23
30 40 50 60 70 80 90 1000.0
0.5
1.0
1.5
2.0
2.5
3.0
Time (s)
Te (
eV
)
0 2 4 6 8 10 12 14 16 18 20 22 24 26 28 30 320.00
0.01
0.02
0.03
IED
F
t = 38 s
t = 28 s
t = 18 s
t = 48 s
Energy (eV)
50-98s 60-98s 70-98s 80-98s
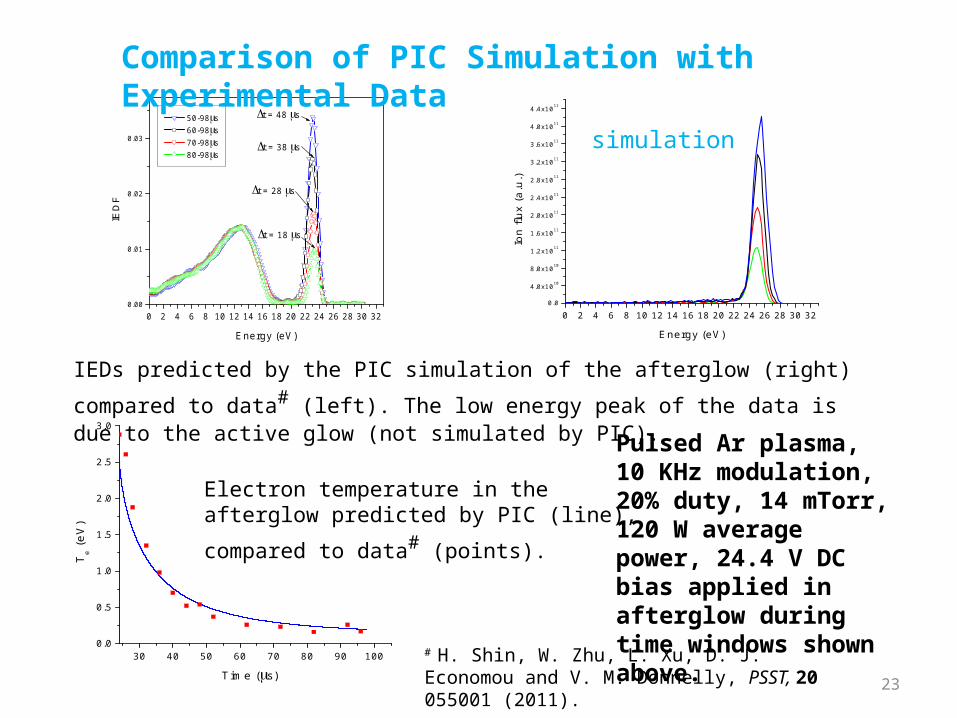
Comparison of PIC Simulation with Experimental Data
IEDs predicted by the PIC simulation of the afterglow (right) compared to data# (left). The low energy peak of the data is due to the active glow (not simulated by PIC).
Electron temperature in the afterglow predicted by PIC (line),
compared to data# (points).
Pulsed Ar plasma, 10 KHz modulation, 20% duty, 14 mTorr, 120 W average power, 24.4 V DC bias applied in afterglow during time windows shown above.
0 2 4 6 8 10 12 14 16 18 20 22 24 26 28 30 320.0
4.0x10¹⁰
8.0x10¹⁰
1.2x10¹¹
1.6x10¹¹
2.0x10¹¹
2.4x10¹¹
2.8x10¹¹
3.2x10¹¹
3.6x10¹¹
4.0x10¹¹
4.4x10¹¹
Ion
flu
x (a
.u.)
Energy (eV)
simulation
# H. Shin, W. Zhu, L. Xu, D. J. Economou and V. M. Donnelly, PSST, 20 055001 (2011).
24
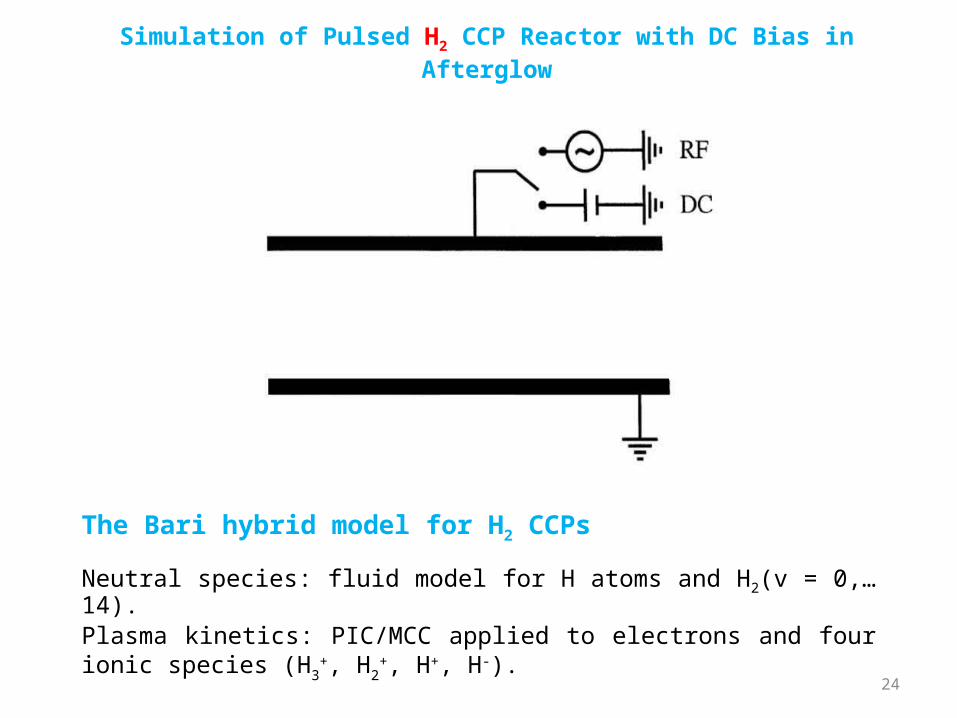
Simulation of Pulsed H2 CCP Reactor with DC Bias in Afterglow
The Bari hybrid model for H2 CCPs
Neutral species: fluid model for H atoms and H2(v = 0,…14).Plasma kinetics: PIC/MCC applied to electrons and four ionic species (H3
+, H2+, H+, H-).

25
Application of DC Bias in the Afterglow of a Pulsed Plasma
• After plasma power turn off (afterglow), Te and Vp decay rapidly.• Apply synchronously tailored positive bias voltage Vdc during specified time window in the afterglow.• Bias raises plasma potential, modifying the IED on the wafer.
26
0 10 20 30 40 50 60 70 80 90 1000
1
2
3
4
5
6
time (s)
Ele
ctro
n K
E (
eV)
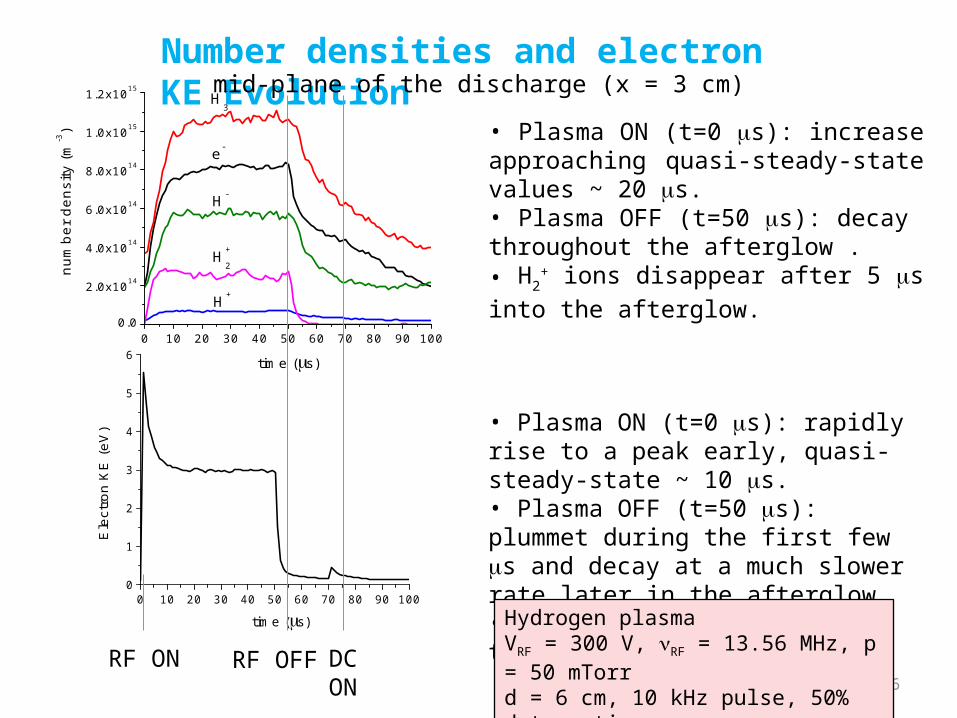
Number densities and electron KE Evolution
0 10 20 30 40 50 60 70 80 90 1000.0
2.0x10¹⁴
4.0x10¹⁴
6.0x10¹⁴
8.0x10¹⁴
1.0x10¹⁵
1.2x10¹⁵
num
ber
dens
ity (
m-3)
time (s)
H+
H+
2
H-
e-
H+
3
RF ON RF OFF DC ON
• Plasma ON (t=0 ms): increase approaching quasi-steady-state values ~ 20 ms. • Plasma OFF (t=50 ms): decay throughout the afterglow .• H2
+ ions disappear after 5 ms into the afterglow.
mid-plane of the discharge (x = 3 cm)
• Plasma ON (t=0 ms): rapidly rise to a peak early, quasi-steady-state ~ 10 ms. • Plasma OFF (t=50 ms): plummet during the first few ms and decay at a much slower rate later in the afterglow.• DC bias ON (t=70 ms): temporary heating.
Hydrogen plasmaVRF = 300 V, nRF = 13.56 MHz, p = 50 mTorrd = 6 cm, 10 kHz pulse, 50% duty ratio
27
0 50 100 1500.0
0.2
0.4
0.6
0.8
1.0
Nor
mal
ized
IED
Ion energy (eV)0 50 100 150
0.0
0.2
0.4
0.6
0.8
1.0N
orm
aliz
ed IE
D
Ion energy (eV)
H+
3
experiment
Experiments: D. O’Connell et al. Phys. Plasmas 14, 103510 (2007)
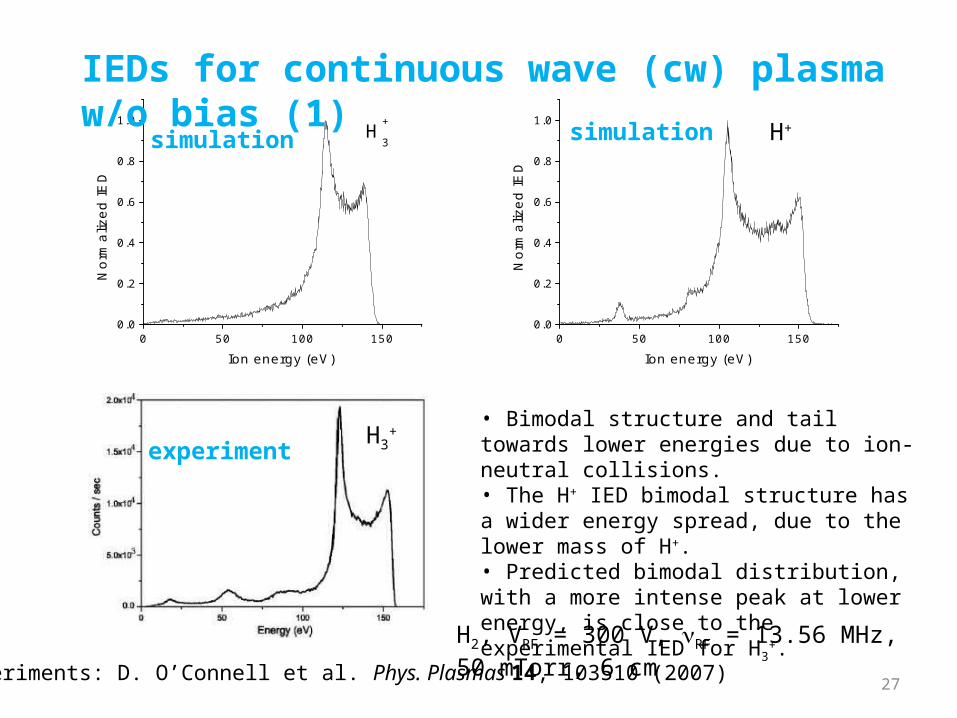
IEDs for continuous wave (cw) plasma w/o bias (1)
simulation simulation
H2, VRF = 300 V, nRF = 13.56 MHz, 50 mTorr, 6 cm
H3+
H+
• Bimodal structure and tail towards lower energies due to ion-neutral collisions. • The H+ IED bimodal structure has a wider energy spread, due to the lower mass of H+.• Predicted bimodal distribution, with a more intense peak at lower energy, is close to the experimental IED for H3
+.
28
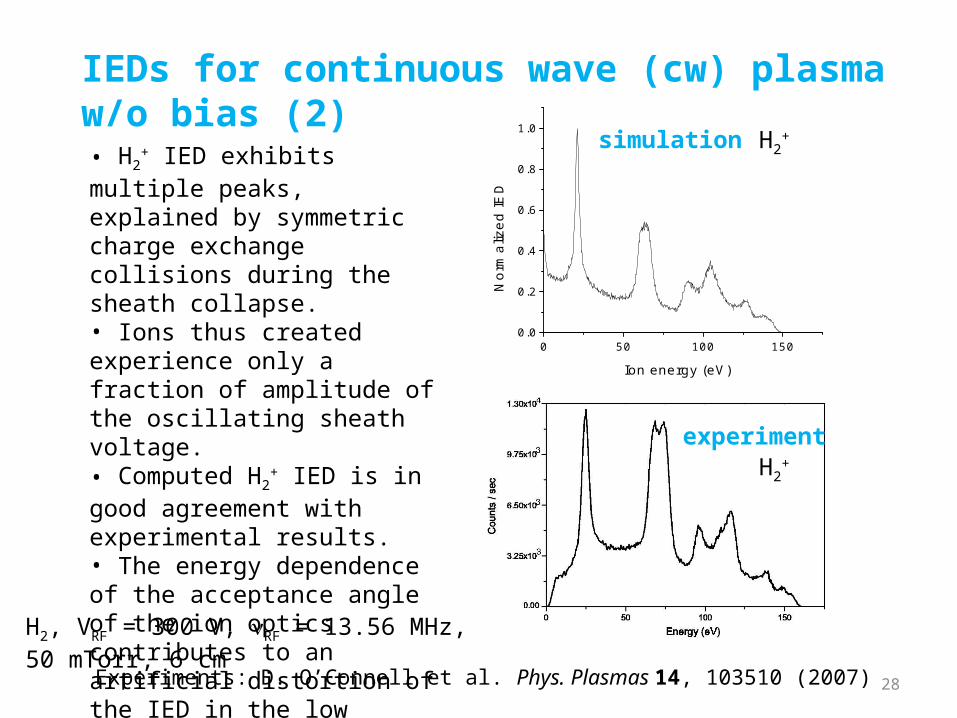
IEDs for continuous wave (cw) plasma w/o bias (2)
0 50 100 1500.0
0.2
0.4
0.6
0.8
1.0
Nor
mal
ized
IED
Ion energy (eV)
Experiments: D. O’Connell et al. Phys. Plasmas 14, 103510 (2007)
experiment
simulation
H2, VRF = 300 V, nRF = 13.56 MHz, 50 mTorr, 6 cm
H2+
H2+
• H2+ IED exhibits multiple peaks,
explained by symmetric charge exchange collisions during the sheath collapse.• Ions thus created experience only a fraction of amplitude of the oscillating sheath voltage. • Computed H2
+ IED is in good agreement with experimental results.• The energy dependence of the acceptance angle of the ion optics contributes to an artificial distortion of the IED in the low energy region.
29
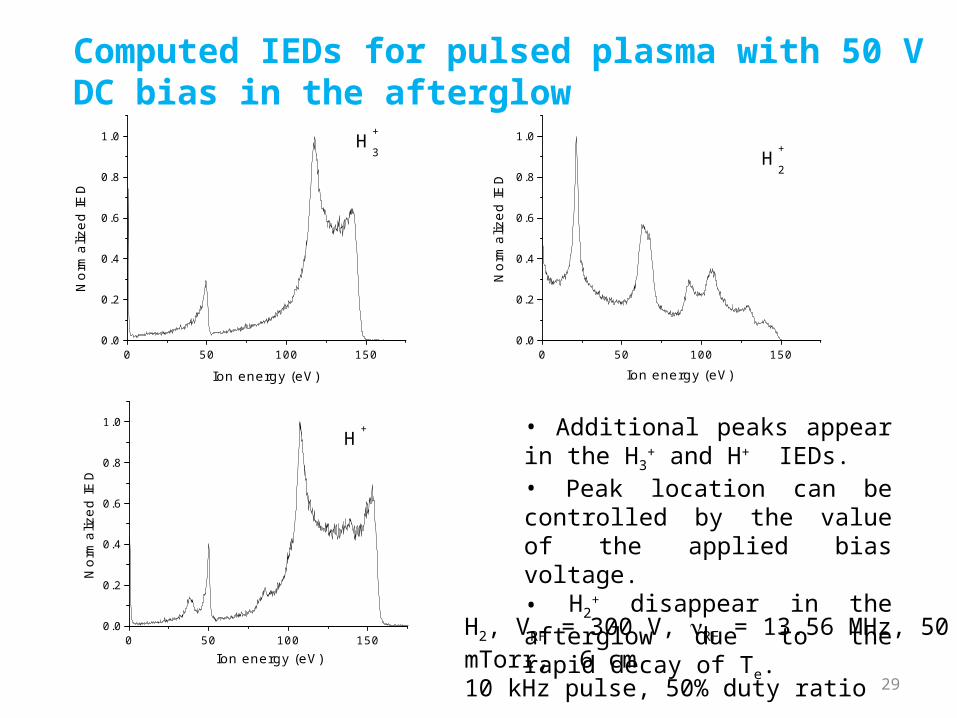
Computed IEDs for pulsed plasma with 50 V DC bias in the afterglow
0 50 100 1500.0
0.2
0.4
0.6
0.8
1.0
Nor
mal
ized
IED
Ion energy (eV)
H+
3
0 50 100 1500.0
0.2
0.4
0.6
0.8
1.0
H+
2
Nor
mal
ized
IED
Ion energy (eV)
0 50 100 1500.0
0.2
0.4
0.6
0.8
1.0H+
Nor
mal
ized
IED
Ion energy (eV)
• Additional peaks appear in the H3+
and H+ IEDs.• Peak location can be controlled by the value of the applied bias voltage.• H2
+ disappear in the afterglow due to the rapid decay of Te.
H2, VRF = 300 V, nRF = 13.56 MHz, 50 mTorr, 6 cm10 kHz pulse, 50% duty ratio
30
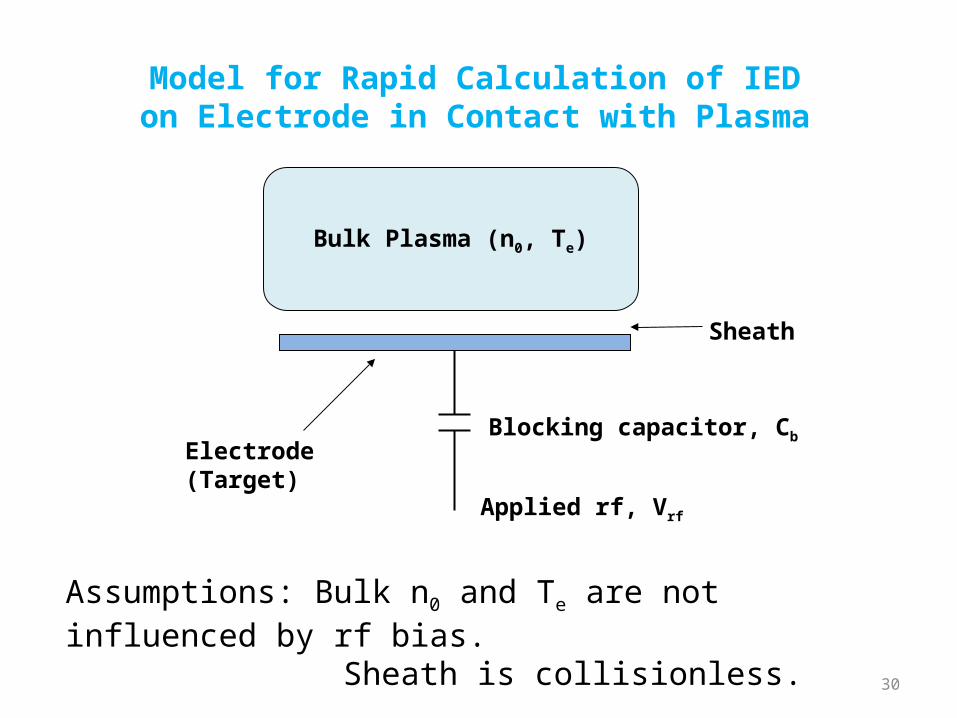
Blocking capacitor, Cb
Applied rf, Vrf
Bulk Plasma (n0, Te)
Electrode (Target)
Sheath
Assumptions: Bulk n0 and Te are not influenced by rf bias. Sheath is collisionless. Ion flux at sheath edge is time-independent.
Model for Rapid Calculation of IEDon Electrode in Contact with Plasma
31
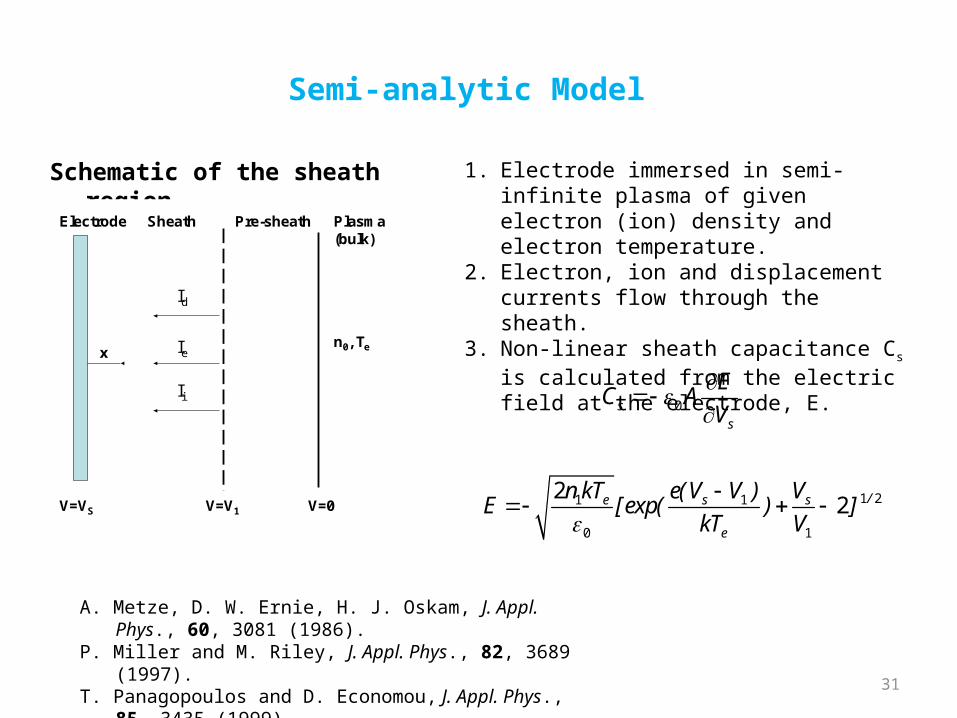
Semi-analytic Model
Schematic of the sheath region 1. Electrode immersed in semi-infinite plasma of given electron (ion) density and electron temperature.
2. Electron, ion and displacement currents flow through the sheath.
3. Non-linear sheath capacitance Cs is calculated from the electric field at the electrode, E.
1 21 1
0 1
22 /e s s
e
n kT e(V V ) VE [exp( ) ]
kT V
0ss
EC A
V
A. Metze, D. W. Ernie, H. J. Oskam, J. Appl. Phys., 60, 3081 (1986).P. Miller and M. Riley, J. Appl. Phys., 82, 3689 (1997).T. Panagopoulos and D. Economou, J. Appl. Phys., 85, 3435 (1999).
V=VS V=V1 V=0
Id
Ie
Ii
Electrode Sheath Pre-sheath Plasma (bulk)
xn0, Te
32
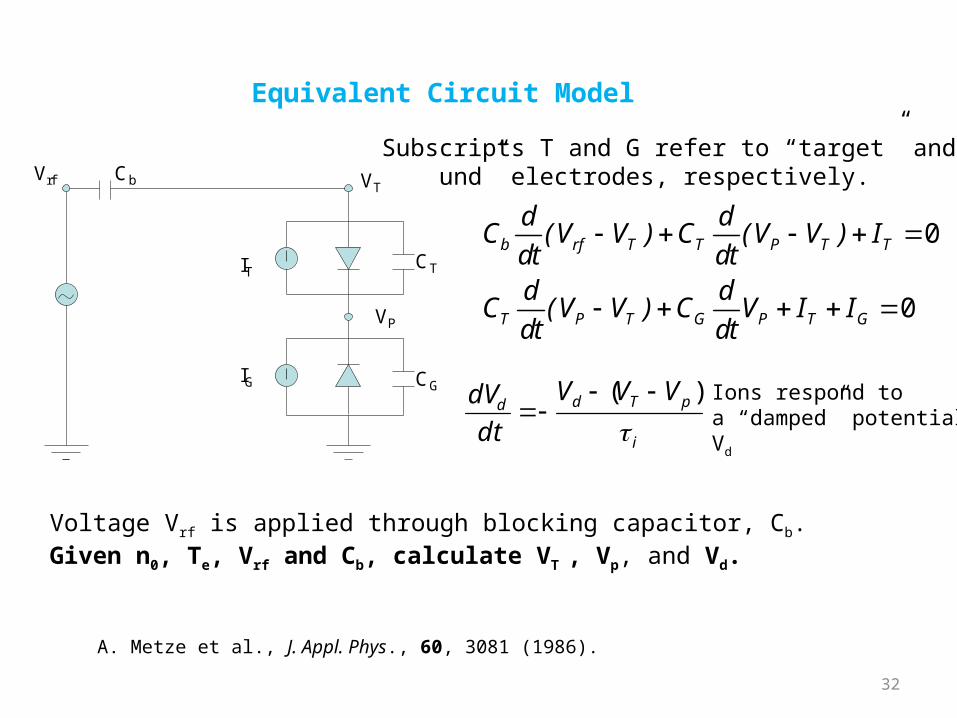
Equivalent Circuit Model
0
0
b rf T T P T T
T P T G P T G
d dC (V V ) C (V V ) I
dt dtd d
C (V V ) C V I Idt dt
Voltage Vrf is applied through blocking capacitor, Cb. Given n0, Te, Vrf and Cb, calculate VT , Vp, and Vd.
Ions respond toa “damped” potential Vd
Subscripts T and G refer to “target” and “ground” electrodes, respectively.
i
pTddVVV
dt
dV
)(
IG
IT
VP
CG
CT
VTCbVrf
A. Metze et al., J. Appl. Phys., 60, 3081 (1986).
33
# of points in 0< 2 such that
( )
1 1( )
2
( )
( )
( ) " "
d
t d
V t y
d d
f ydV
d t
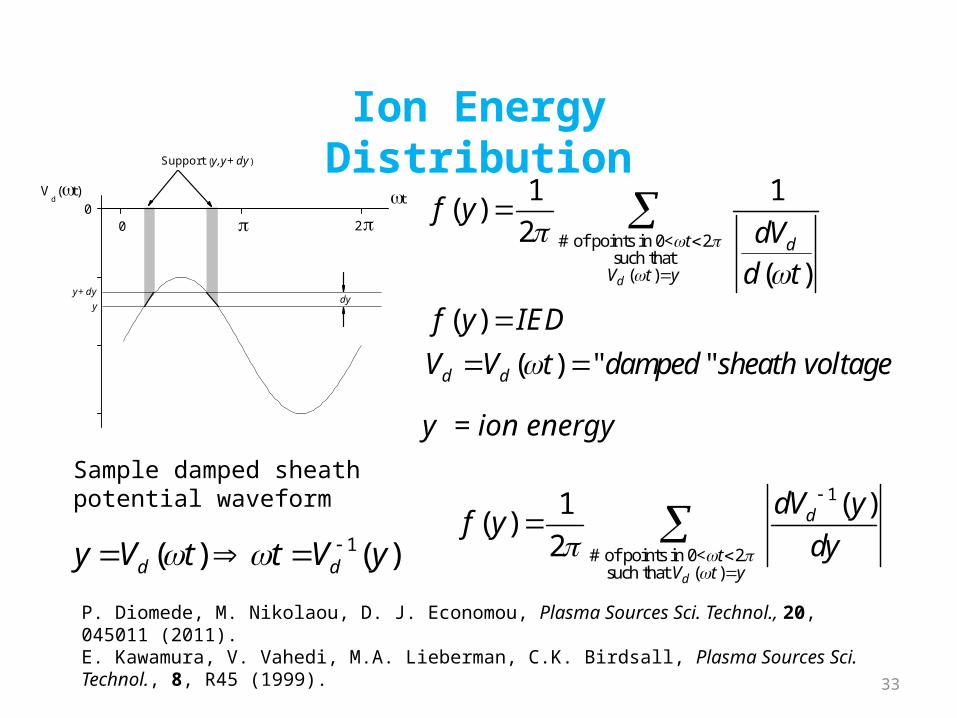
f y IED
V V t damped sheath voltage
1
# of points in 0< 2 such that ( )
( )1( )
2d
d
tV t y
dV yf y
dy
1( ) ( )d dy V t t V y
P. Diomede, M. Nikolaou, D. J. Economou, Plasma Sources Sci. Technol., 20, 045011 (2011). E. Kawamura, V. Vahedi, M.A. Lieberman, C.K. Birdsall, Plasma Sources Sci. Technol., 8, R45 (1999).
Ion Energy Distribution
Sample damped sheath potential waveform
yy+dy
t0
Vd(t)
20
dy
Support (y,y+dy)
y = ion energy
34
0 20 40 60 80 1000
5
10
15
20
Vp (
V)
Time (s)
0 5 10 15 20 25 300.0
0.2
0.4
0.6
0.8
1.0
1.2
No
rma
lize
d I
ED
Ion energy (eV)0 5 10 15 20 25 30
0.0
0.2
0.4
0.6
0.8
1.0
1.2
Nor
mal
ized
IED
Ion energy (eV)
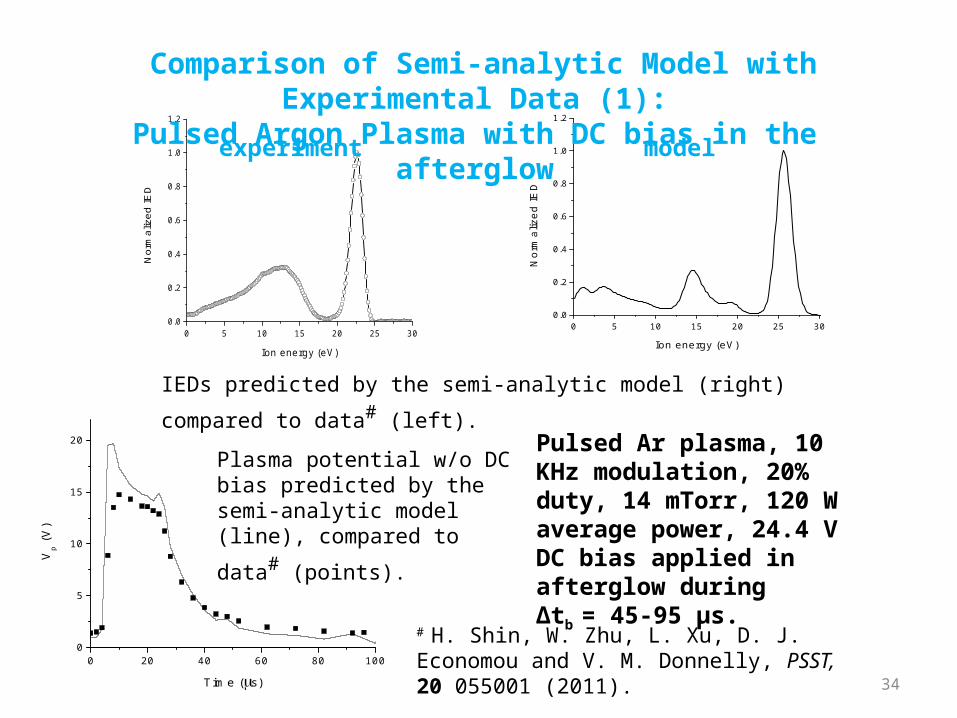
Comparison of Semi-analytic Model with Experimental Data (1):Pulsed Argon Plasma with DC bias in the afterglow
IEDs predicted by the semi-analytic model (right) compared to data# (left).
Plasma potential w/o DC bias predicted by the semi-analytic
model (line), compared to data# (points).
Pulsed Ar plasma, 10 KHz modulation, 20% duty, 14 mTorr, 120 W average power, 24.4 V DC bias applied in afterglow during ∆tb = 45-95 µs.
# H. Shin, W. Zhu, L. Xu, D. J. Economou and V. M. Donnelly, PSST, 20 055001 (2011).
modelexperiment

35
Experimental Target voltage, 500 kHz, ne = 2.6×10¹⁶ m-3, Te = 3eVX. V. Qin, Y.-H. Ting, and A. E. Wendt, PSST 19 065014 (2010).
-300
-200
-100
0 (b)
-300
-200
-100
0 (c)
0 1 2 3 4 5
-300
-200
-100
0 (d)
Time (s)
Vo
ltag
e (V
)
-300
-200
-100
0 (a)
Target voltage in the semi-analytic model
The simulated voltage waveforms are quite representative of the measured waveforms except for the “ringing”.
Comparison of Semi-analytic Model with Experimental Data (2):Helicon plasma with bias voltage waveform on the substrate
36
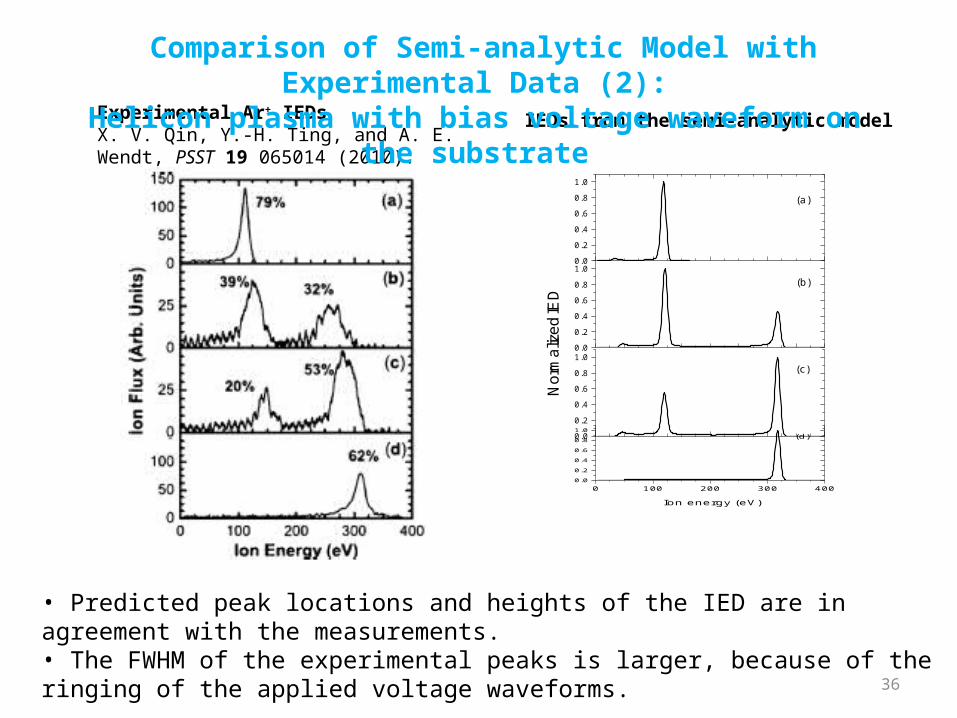
Experimental Ar+ IEDs X. V. Qin, Y.-H. Ting, and A. E. Wendt, PSST 19 065014 (2010).
0 100 200 300 4000.0
0.2
0.4
0.6
0.8
1.0
Ion energy (eV)
(d)
0.0
0.2
0.4
0.6
0.8
1.0
(a)
0.0
0.2
0.4
0.6
0.8
1.0
(b)
0.0
0.2
0.4
0.6
0.8
1.0
(c)
No
rma
lize
d IE
D
IEDs from the semi-analytic model
• Predicted peak locations and heights of the IED are in agreement with the measurements. • The FWHM of the experimental peaks is larger, because of the ringing of the applied voltage waveforms.
Comparison of Semi-analytic Model with Experimental Data (2):Helicon plasma with bias voltage waveform on the substrate
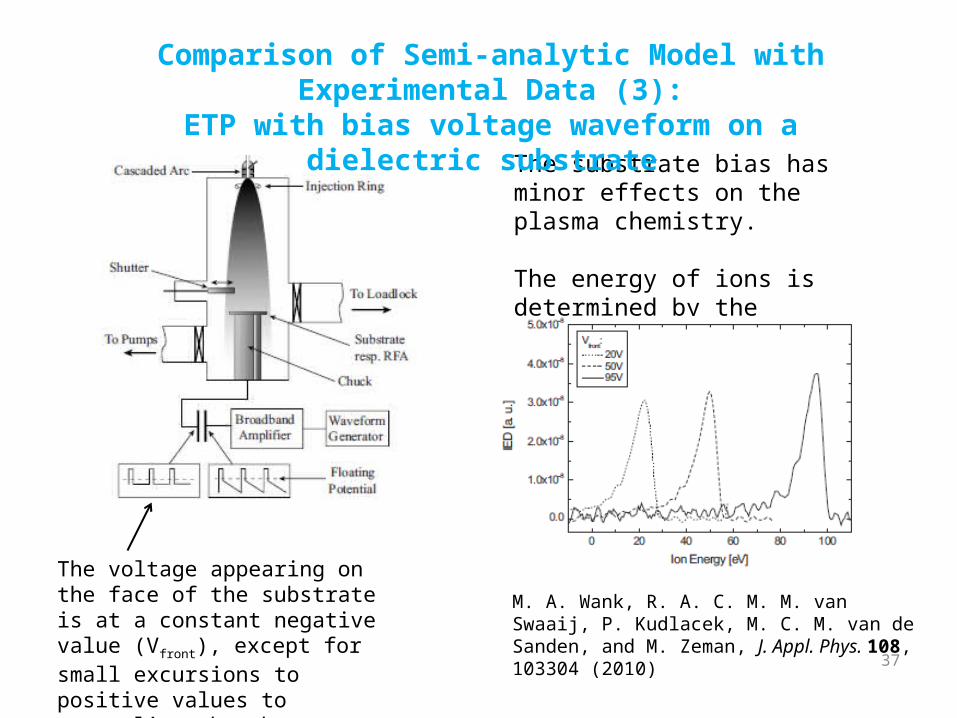
M. A. Wank, R. A. C. M. M. van Swaaij, P. Kudlacek, M. C. M. van de Sanden, and M. Zeman, J. Appl. Phys. 108, 103304 (2010)
The voltage appearing on the face of the substrate is at a constant negative value (Vfront), except for small excursions to positive values to neutralize the charge.
37
The substrate bias has minor effects on the plasma chemistry.
The energy of ions is determined by the substrate voltage.
Comparison of Semi-analytic Model with Experimental Data (3):ETP with bias voltage waveform on a dielectric substrate

38#P. Kudlacek, R. F. Rumphorst and M.C.M. van de Sanden, J. Appl. Phys., 106, 073303 (2009).
Comparison of Semi-analytic Model with Experimental Data (3):ETP with bias voltage waveform on a dielectric substrate
• Electrode downstream of expanding thermal hydrogen plasma (H3
+). • Biased through blocking capacitor, Cb = 166 pF. • Vp~0.2 V, Te = 0.15 eV, p = 18 Pa, ne = 2 x 1010 cm-3
Top figs.: Kudlacek et al.#
Bottom figs.: Semi-analytic model prediction.CB = 1.66 nF, AG/AT =25
• The energy peaks location and the voltage waveform on substrate electrode are predicted.
Voltage applied to blocking cap.
Voltage of substrate electrode.

39
Measured ion energy distribution functions in a geometrically and electrically asymmetric dual frequency discharge at the powered (left) and grounded (right) electrode (Argon, 1 Pa, d = 4 cm, U1 = U2 = 100 V, f1 = 13.56 MHz, f2 = 27.12 MHz).
)2cos()2cos()( 22111 tfUtfUtV
Comparison of Semi-analytic Model with Experimental Data (4): Control of IEDs using the electrical asymmetry effect
U. Czarnetzki, J. Schulze, E. Schüngel and Z. Donkó, PSST 20, 024010 (2011)

40
0 20 40 60 80 100 120 140 160
0.00
0.02
0.04
0.06
0.08
0
1 53 0
4 56 0
7 59 0
powered electrode
Ion energy (eV)IE
D (
a.u
.)
1 (
de
gre
es
)0 10 20 30 40 50
0.00
0.04
0.08
0.12
0.16
0.20
0
1 53 0
4 56 0
7 59 0
grounded electrode
Ion energy (eV)
IED
(a
.u.)
1 (
de
gre
es
)
Cb = 0.7 pF, AG = 2 AT , Te = 3 eV, n0 = 2 x 10¹⁵ m-3, M = 40 amu (Ar+), f1 = 13.56 MHz, f2 = 27.12 MHz, U1 = U2 = 100 V, instrumental broadening 2 eV.
Electrical Asymmetry Effect: Semi-Analytic Model Prediction
41
Concluding Remarks
Several methodologies can be implemented to tailor the ion energy distribution on plasma electrodes.
PIC-MCC and hybrid simulations of a pulsed plasma with synchronous DC bias applied in the afterglow, showed that it is possible to tailor IEDs to have distinct energy peaks with controlled energies and fraction of ions under each peak.
Simulations were in good agreement with measurements.Although PIC simulation provides detailed information (e.g., IAD
in addition to IED), fast execution of semi-analytic model is advantageous for initial screening of tailored voltage waveforms.
Models/simulations in synergy with experiments are critical to understand and predict the behavior of plasmas and to unravel new strategies for tailoring IEDs.
42
Prof. M. Nikolaou, University of HoustonDr. H. Shin, University of Houston, currently at Lam Research Corp.W. Zhu, University of Houston
Prof. S. Longo, University of Bari and CNR/IMIP, ItalyProf. M. Capitelli, University of Bari and CNR/IMIP, Italy
Financial Support: DoE Plasma Science Center NSF
Acknowledgements