p rocessing d ata u sing matlab dr. nawaporn wisitpongphan 1
TRANSCRIPT

1
PROCESSING DATA USING MATLABDr. Nawaporn Wisitpongphan
2
OUTLINEFunction in MATLAB
Lab #1: Easy “Hello World” Function Lab #2: Function with input/output
Reading Data from File Lab #3: Read file using load command Lab #4: Read file line by line using fgetl
Writing Data to File Lab #5: Preparing data
Plotting Data Lab #6: Creating 2-D plot Lab #7: Creating 3-D plot
Data Manipulation Lab #8: Scalar, array, matrix
3
FUNCTIONS IN MATLAB
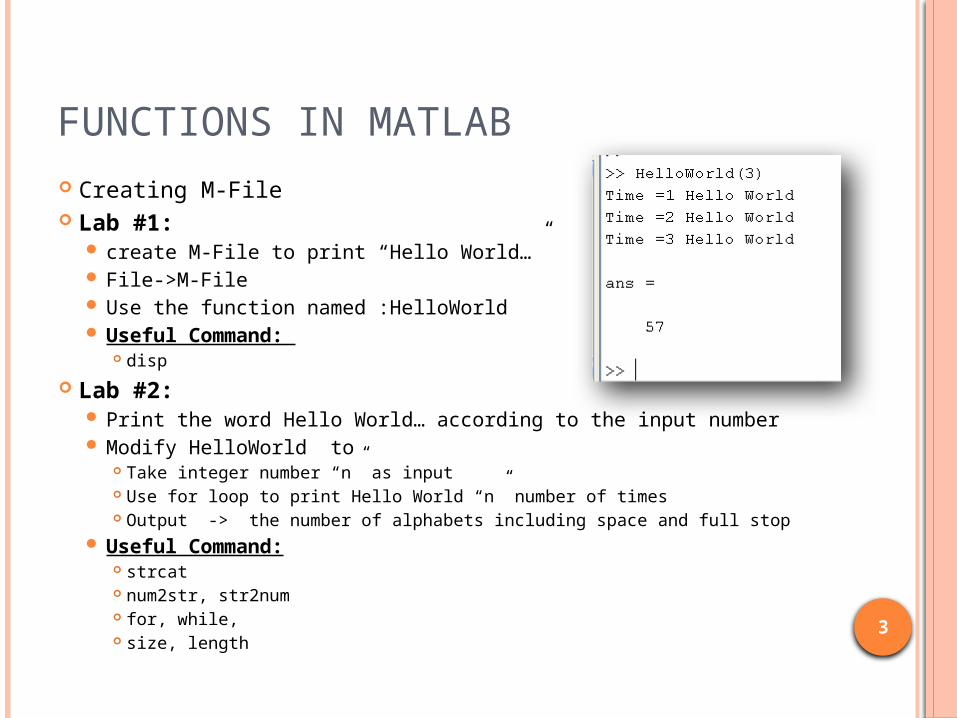
Creating M-File Lab #1:
create M-File to print “Hello World…” File->M-File Use the function named :HelloWorld Useful Command:
disp
Lab #2: Print the word Hello World… according to the input number Modify HelloWorld to
Take integer number “n” as input Use for loop to print Hello World “n” number of times Output -> the number of alphabets including space and full stop
Useful Command: strcat num2str, str2num for, while, size, length

4
READING DATA FROM A FILE: LAB 3.1
Useful Command load mean, std, min, max strfind
Lab#3.1: Read student’s score
from file using load command
Open GroupA.txt GroupB.txt and GroupC.txt
Display output according to given format

5
READING DATA FROM A FILE: LAB 3.2
Lab#3.2: Read student’s scores
from file using load command
Open file sGroupA2.txt GroupB2.txt and GroupC2.txt
Let the input be the file name and the word “Midterm” or “Final”
Display output according to the given format

6
READING DATA FROM A FILE: LAB 4
Useful Command: fopen, fgetl, fgets, fread, fscanf If, else strtok, strtrim, strcmp disp
Lab #4 Read the students’ scores using fgetl command Open and read file “lab4.txt” The input should be “file name” and “grade” Print the score of all the students who got that
grade

7
WRITING DATA TO FILE: LAB 5
Lab #5 Use Data from lab 4 Recreate the new data file
by removing the first text line and the grade column (see the format on the right)
The input to the function should be the name of the file from Lab 4 and the name of the new data file

8
PLOTTING DATA: LAB 6 & 7
Useful Command: figure, plot, subplot, hist, bar hold on, hold off xlabel, ylabel, title, legend, grid set
Lab #6 & 7 & 8: Read file from lab6.txt
column #1 = ID Column #2 = Midterm Score Column #3 = Final Score Column #4 = Total Score

9
LAB 6.1 Lab 6.1
plot 2-D graph using plot command X-axis = ID Y-axis = Midterm and Final score
Use hold on and hold off to overlay the graphs

10
LAB 6.2
Lab 6.2 1st plot = use hist command with bin size = 5 on
midterm score 2nd plot = use hist command with bin size = 5 on
finalscore 3rd plot = use bar command to compare the
midterm and final score distribution

11
PLOTTING 3D: LAB 7 Lab 7
Create vector using the following command>> x = 0:pi/50:2*pi>> y = 0:pi/50:2*pi>> z = sin(x’)* sin(y);
Plot graph using meshz, mesh, surf, and waterfall

12
USEFUL COMMAND FOR RESEARCH
Exporting the Figure print –djpeg figurename print –deps figurename print –depsc figurename
Clustering: kmeans, linkage, cluster, clusterdata, pdist
Fuzzy Logic: Fuzzy Logic Toolbox >>help fuzzy
Nuerual Network Toolbox

13
DATA MANIPULATION: LAB 8: HOMEWORK
Yodying conducts a research with undergrad students. One of her research tasks is to analyze the score of the undergrad students in Math 101 class. Since this is a mandatory class for all undergrad students, there are a total of 20 sections being offered per year. There are 30 students per section. Use Matlab to analyze the score that YodYing collected and put in the file “M101_12years.txt”. This is 12 years worth of data. Base on this score and given that the difficulty of the exam is at the same level every year, your job is to analyze the quality of the students. You may use any statistical methods to analyze the data.
Submit Matlab code along with the graphs that help in supporting your answer.