p s a pharm sci asia 2021; 48(6), 557-566 doi:10.29090/psa
TRANSCRIPT

Pharmaceutical Sciences Asia Pharm Sci Asia 2021; 48(6), 557-566
DOI:10.29090/psa.2021.06.21.017
557
HPLC and chemometrics-assisted spectroscopic methods used for determination of dissolution of paracetamol and orphenadrine citrate in a combination tablet Suttikan Sonchai1, Chutima Phechkrajang2, Piyanuch Rojsanga2* 1 Center of Analysis for Product Quality, Faculty of Pharmacy, Bangkok, Thailand 2 Department of Pharmaceutical Chemistry, Faculty of Pharmacy, Mahidol University, Bangkok, Thailand
1. INTRODUCTION
Paracetamol (4-acetamidophenol) is an effective
analgesic and antipyretic for treatment of minor, non-
inflammatory conditions1. Orphenadrine citrate ((RS)-
(dimethyl-2-(2-methylbenz-hydroxy) ethyl) amine citrate)
is employed as skeletal muscle relaxant2. Thus, tablets
containing paracetamol (PAR) and orphenadrine citrate
(OPC) show combined analgesic, antipyretic and skeletal
muscle relaxing actions. The structures of PAR and OPC
are displayed in Figure 1.
Many analytical methods have been reported on
the estimation of paracetamol and orphenadrine citrate
either separately or in combination with other drugs
in pharmaceutical dosage forms or biological fluids3-9.
However, only RP-HPLC8, and spectrophotometric10
methods have been described in the literature for the
simultaneous determination of PAR and OPC in their
combined formulations, despite the recognized com-
mercial distribution of their tablets. Moreover, there is no
official method for dissolution testing of their combined
formulations. To assay the dissolution samples of drug
products, a straightforward but broadly relevant analytical
method is always preferred. Apparently, PAR and OPC
fixed combination tablet considered to be an analytically
challenging mixture, from the spectrophotometric view-
point. This is ascribed not only to the large difference in
ratios between PAR and ORP, which exceeds 1:12,
respectively, but also the spectral overlap of both drugs.
Consequently, analysis of PAR and OPC could not be
performed concurrently by direct UV spectrophotometry
without separation.
*Corresponding author: *Piyanuch Rojsanga [email protected]
Pharmaceutical Sciences Asia © 2021 by Faculty of Pharmacy, Mahidol University, Thailand is licensed under CC BY-NC-ND 4.0. To view a copy of this license, visit https:// www.creativecommons.org/licenses/by-nc-nd/4.0/
ABSTRACT
Simultaneous determination of paracetamol and orphenadrine citrate by high-performance liquid
chromatographic (HPLC) and chemometric-assisted spectroscopic methods are described. The HPLC method
was based on RP C18 column (5 μm, 4.6 mm×150 mm) using monobasic ammonium phosphate, methanol, and
acetonitrile (400:450:150v/v/v) as a mobile phase. The flow rate was set at 1.5 mL/min with column temperature
at 40°C and UV detection at 215 nm. Paracetamol and orphenadrine citrate were separated within 7 mins by an
isocratic elution. Good linearities were obtained in concentration ranges of 5-150 μg/mL for paracetamol and
0.8-12 μg/mL for orphenadrine citrate, with correlation coefficients (r)>0.99. Recovery of the analytical method
was acceptable (102.8-104.8% for paracetamol and 92.4-102.3% for orphenadrine citrate). Relative standard
deviations (RSDs) of repeatability and intermediate precision were less than 2.0%. Likewise, the resolution has
been completed by using partial least square regression applying UV spectrum. The successive partial least squares
regression (PLSR) methods were used with UV spectra data of 200-400 nm and 5 latent factors for paracetamol
and orphenadrine citrate. Finally, the developed methods proved to be suitable to assay the dissolution samples of
paracetamol and orphenadrine citrate in the combination tablet.
Keywords: Paracetamol, Orphenadrine, HPLC-PDA, Partial least squares regression, Multicomponent analysis
Research Article

S. Sonchai et al. Pharm Sci Asia 2021; 48(6), 557-566
558
Figure 1. Chemical structure of Paracetamol and Orphenadrine citrate.
Application of chemometric approach with
spectrophotometric data may overcome this restriction.
Multivariate calibration is a chemometric method which
has been utilized for determination of drugs in combi-
nation dosage forms including tablets11-13.
In this study, chemometric-assisted spectropho-
tometry using partial least squares regression (PLSR)
was developed to analyze the dissolution sample of PAR
and OPC in combination tablet. In addition, a simple
high-performance liquid chromatography (HPLC) was
developed and validated to use as a reference method for
chemometric method.
2. MATERIALS AND METHODS
2.1. Instruments and software
The analysis was carried out using HPLC
system; a Shimadzu LC-10 system (Shimadzu, Kyoto,
Japan) equipped with a model series LC-10 ADVP pump,
SCL-10 AVP system controller, DGU-12A degasser,
SIL-10ADVP auto injector, and a SPD-M20A diode array
detector. A dual beam Shimadzu (Kyoto/Japan) UV-Vis.
spectrophotometer, model 1650 UV-PC. The utilized
software was UV-Probe personal spectroscopy software
version 2.71 (SHIMADZU). Drugs’ dissolution was tested
using a ERWEKA DT 720 (Germany) equipped with
standard USP type-II paddle.
2.2. Chemicals, reagents, and pharmaceutical formu-
lation
All chemicals were of analytical-reagent grade.
HPLC grade methanol and acetonitrile (Merk, Darmstadt,
Germany) and deionized water were used for preparing
mobile phase solutions. The standards for Paracetamol
(PAR) and Orphenadrine citrate (OPC) were kindly
supplied by Defense Pharmaceutical Factory, Bangkok,
Thailand. The purity was found to be 100.0±0.1% and
100.1±0.2% for PAR and ORP, respectively, using the
current compendial HPLC method of each drug14,15.
ORPHETAMOL® tablets, manufactured by Defense
Pharmaceutical Factory (DPF), Bangkok, Thailand, is
labeled to contain paracetamol 450 mg and orphenadrine
citrate 35 mg per tablet.
2.3. High-performance liquid chromatographic method
2.3.1. Chromatographic condition
The chromatographic separation was performed
on a column C18, Hypersil GOLD®, 5 μm, 4.6x150 mm
i.d., (Thermo, USA) with the column temperature main-
tained at 40°C. The mobile phase was obtained by
mixing 0.05 M monobasic ammonium phosphate pH 7.9:
methanol: acetonitrile (400:450:150 (v/v/v)), delivered at
a flow rate of 1.5 mL/min and detected by ultraviolet at
215 nm.
2.3.2. Solutions
Standard stock solutions of PAR and OPC in
mobile phase were separately prepared in concentration
of 12.5 mg/mL and 1 mg/mL, respectively. One milliliter
of each stock solution was transferred to a 50 mL
volumetric flask and adjusted with mobile phase to
obtain PAR and OPC in concentration of 250 µg/mL and
20 µg/mL, respectively. The working standard mixtures
were prepared at concentration levels of 5-150 µg/mL
and 0.2-12 µg/mL for PAR and OPC, respectively.
For placebo solution, 96 mg powdered placebo
was weighed and introduced in a vessel of dissolution
apparatus containing 900 mL of distilled water, thermo-
statically controlled at 37±0.5°C. A vessel content was
agitated using a paddle at a rate of 50 rpm. for 60 min.
Sample solutions prepared for recovery study
were in levels of 50% (50 µg/mL PAR, 4 µg/mL OPC),
100% (100 µg/mL PAR, 8 µg/mL OPC), 150% (150
µg/mL PAR, 12 µg/mL). Related amount of PAR, OPC
each level with 96 mg placebo was weighed and placed
in a vessel of dissolution apparatus containing 900 mL
of distilled water, thermostatically controlled at 37±
0.5°C. A vessel content was agitated using a paddle at a
rate of 50 rpm. for 60 min.
The placebo and sample solutions were
withdrawn from the dissolution medium and filtered.

Pharmaceutical Sciences Asia
559
Two milliliters of each filtrate were transferred to 50-
mL volumetric flask and adjust to volume by mobile
phase. All solutions were passed through a polytetra-
fluoroethylene (PTFE) syringe filter prior to injection.
2.3.3. Validation of HPLC method
The proposed HPLC method was validated in
term of specificity, linearity, range, accuracy, precision,
and system suitability according to the International
Council for Harmonization (ICH)16. For specificity,
the chromatograms of mobile phase, distilled water,
standard solution, and sample solution taken from
dissolution study were compared. The linearity was
assessed by analyzing the series of working standard
mixtures in mobile phase. Six concentration levels in
the range of 5-150 µg/mL and 0.2-12 µg/mL for PAR and
OPC, respectively, were prepared. A regression equation
of the calibration curve was calculated using least-square
linear regression (correlation coefficient (r) ≥ 0.990). The
accuracy was operated as described in sample solution
preparation at levels of 50% (3 samples), 100% (3
samples) and 150% (3 samples). Recovered amount of
PAR and OPC were calculated in relation to the added
amount, whereas the acceptance criteria for recovery
was 95-105%. In the precision study, repeatability and
intermediate precision were carried out by analyzing
6 sample solution preparation at level of 100% on the
same day (n=6) and 2 different analysts (n=12), respec-
tively. The acceptance criterion for RSD was ≤ 2.0%.
System suitability was determined from 5 replicate
injections of the system suitability standard (40 µg/mL
PAR and 8 µg/mL OPC) before sample analyses. The
acceptance criteria were; number of theoretical plates
(N) > 1500, tailing factor < 2 and %RSD ≤ 2.0 for peak
area.
Table 1. Composition of calibration set samples.
Calibration sample PAR (µg/mL) OPC (µg/mL) Calibration sample PAR (µg/mL) OPC (µg/mL)
1 39.1 14.8 25 19.5 7.4
2 57.7 14.3 26 28.9 7.1
3 49.8 2.8 27 24.9 1.4
4 48.5 27.2 28 24.2 13.6
5 46.4 9.3 29 23.2 4.6
6 54.1 9.4 30 27.0 4.7
7 55.6 25.5 31 27.8 12.8
8 45.6 25.6 32 22.8 12.8
9 49.6 15.9 33 22.5 7.8
10 47.5 15.7 34 24.8 8.0
11 48.6 15.0 35 23.8 7.8
12 48.6 0.0 36 24.3 7.5
13 49.1 0.0 37 24.3 0.0
14 9.2 14.9 38 24.6 0.0
15 60.6 27.5 39 4.5 7.3
16 61.9 28.4 40 31.0 14.2
17 59.7 28.5 41 29.8 14.2
18 61.9 28.8 42 24.7 7.0
19 49.9 14.0 43 24.9 6.9
20 49.4 13.8 44 19.1 0.0
21 38.8 0.0 45 29.8 2.7
22 38.3 0.0 46 29.5 2.8
23 39.0 0.0 47 29.5 2.7
24 38.7 0.0 48 29.3 2.7
Table 2. Composition of test set samples.
Test sample PAR (µg/mL) OPC (µg/mL) Test sample PAR (µg/mL) OPC (µg/mL)
1 9.0 14.7 13 29.5 2.8
2 49.4 14.1 14 29.6 2.8
3 49.9 13.8 15 29.8 2.8
4 4.6 7.4 16 29.2 2.7
5 30.3 13.8 17 29.2 2.8
6 30.9 14.4 18 43.5 2.8
7 24.9 7.0 19 44.1 2.9
8 24.7 6.9 20 43.3 2.9
9 19.4 0.0 21 43.7 2.9
10 19.5 0.0 22 43.2 2.9
11 19.4 0.0 23 42.8 2.9
12 29.2 2.8 - - -

S. Sonchai et al. Pharm Sci Asia 2021; 48(6), 557-566
560
2.4. Chemometric method
2.4.1. Spectrophotometric condition
The calibration set and test set samples were
recorded for their UV absorption data between 200-400
nm at 0.5 nm intervals using 1-cm quartz cells. The
Unscrambler 9.6 (Camo, Norway) was employed for
PLSR models construction.
Working standards solutions concentration of
250 µg/mL of PAR and 125 µg/mL OPC were prepared by
accurately weighing the working standard by analytical
balance and diluted to the desired concentration with
deionized water. These working solutions were used to
prepare calibration set and test set samples as shown in
Table 1 and Table 2.
The models with the lowest relative standard
error of prediction (RSEP) were selected as the optimum
models.
RSEP was calculated by using the following
equation.
𝑃𝐸𝑆𝑅(%) = 100√∑ (𝒚
𝒅𝒆𝒓𝒑− 𝒚
𝒆𝒓𝒓)2
𝑚
𝑖=1
𝑚
Where m is the number of samples used, yref is
the true value and ypred is the predicted value of a test set
sample.
2.4.2. Validation of chemometric method
The optimum PLSR models were internal
validated by cross-validation and external validated
by determination of test set samples those were not
contributed to models construction and compared with
HPLC results. The comparison was expressed as the
correlation plot of the results from PLSR model (y-axis)
and HPLC method (x-axis). The correlation coefficient
closes to 1.0 indicating the agreement of the results of
two methods and imply to the accuracy of chemometric
model.
2.5. Assay of dissolution solutions
An eight-vessel dissolution apparatus containing
900 mL of distilled water, thermostatically controlled at
37±0.5°C was used, the tablet was introduced into the
paddle using a rate of 50 rpm. Samples were withdrawn
from the dissolution medium after 60 min and filtered.
Two milliliters of the filtrate were transferred to 50-mL
volumetric flask and adjust to volume by either mobile
phase for HPLC method or distilled water for chemo-
metric method.
3. RESULTS AND DISCUSSION
3.1. Development of HPLC method
The method optimized for PAR and OPC was
primarily performed using various mobile phases for
improved peak shape and separation. The mobile phase
initially investigated comprised of water adjusted with
phosphoric acid to pH 2.6 and acetonitrile (500:500),
sodium dihydrogen phosphate pH 7.9 and acetonitrile
(350:650) and monobasic ammonium phosphate pH of
3.2 and acetonitrile (400:600). In most of the mobile
phases, the separation was inadequate and OPC was not
detected. The best separation was achieved using 0.05 M
monobasic ammonium phosphate pH 7.9, methanol, and
acetonitrile (400:450:150). Two different C18 columns
(Hypersil® 5 μm, 4.6 mm×250 mm and Hypersil GOLD®,
5 μm, 4.6 mm×150 mm) were tested as stationary phases
for better symmetry of OPC peak. The Hypersil GOLD®
C18 column exhibited better peak shape (tailing factor
< 2.0) and shorter analysis time. The mobile phase was
used as a better diluting solvent in this study after opti-
mization. The flow rate (1 mL/min and 1.5 mL/min),
wavelength (215 nm and 220 nm), injection volume
(10 μL and 20 μL) was examined and adjustments were
made appropriately. The optimal flow rate, wavelength,
and injection volume for the method was 1.5 mL/min,
215 nm, and 10 μL, respectively. The optimal conditions
were designated based on better separation parameters
of PAR and OPC peaks. Figure 2C and Figure 2D
illustrate the HPLC chromatograms of standard and
sample solution of PAR and OPC, respectively.
3.2. Validation of HPLC method
The chromatogram of dissolution sample exhi-
bited the good separation of PAR and OPC from other
peaks in the sample with tailing factor less than 2.0. No
major peak other than PAR and OPC in dissolution
medium (Figure 2A) and mobile phase (Figure 2B) was
observed, there was no interference between excipients
(Figure 2C and Figure 2D). Moreover, the UV spectrum
from 200-400 nm of the peak in the sample with the
retention times matching to the peaks of PAR (RT of
1.4 min) and OPC (RT of 6.3 min) standards were similar
with peak purity index more than 0.95. The calibration
curves of PAR and OPC were linear in the ranges of 5-
150 µg/mL and 0.2-12 µg/mL, respectively. The correla-
tion coefficients (r) of the linear equations were more
than 0.999, thus confirming the linearity of the methods.
The recoveries of PAR and OPC were 102.8-104.7%
and 92.4-102.3% respectively, indicated a satisfactory
accuracy. For repeatability, the %RSD values of PAR
and OPC ranged from and 0.78-1.35% and 0.82-1.14%,
respectively while the %RSD values of the intermediate
precision were 0.88 and 0.97%, respectively. The proposed
HPLC method showed acceptable validation and system
suitability parameters as shown in Table 3.

Pharmaceutical Sciences Asia
561
Fig
ure
2.
HP
LC
ch
rom
atog
ram
s o
f d
isti
lled
wat
er (
A),
mo
bil
e p
has
e (B
), s
tan
dar
d m
ixtu
re a
s 4
0µ
g/m
L o
f P
AR
and
8µ
g/m
L o
f O
PC
(C
), a
nd
dis
solu
tio
n s
amp
le (
D).

S. Sonchai et al. Pharm Sci Asia 2021; 48(6), 557-566
562
Table 3. Method validation data of PAR and OPC by the optimized HPLC method.
Validation parameter Acceptance criteria PAR OPC
Linearity r ≥0.99 y =12,614x+3,586.5 y =12,684x-1,357.1
r =0.9999 r =0.9997
Range 5-150 µg/mL 0.2-12 µg/mL
Accuracy (%R) 92-105% 102.8-104.7% 93.4-102.3%
Repeatability (%RSD, n=6) 2.0% 0.78-1.35 0.82-1.14
Intermediate precision (%RSD, n=12) 2.0% 0.89 0.97
Plates >1500 >2338 >6826
System suitability Tailing <2.0 <1.6 <1.1
%RSD <2.0 0.74 0.33
Figure 3. UV spectra of PAR (19 µg/mL) and OPC (15 µg/mL).
3.3. Development of Chemometric method
UV spectrophotometry is generally allowed for
quantitative determination of an active pharmaceutical
ingredient with high purity. Direct determination of
combination drugs by UV spectrophotometer is usually
limited from the overlapping of their UV spectra.
Several efforts were tried to overcome this limitation
including first derivative and higher order UV spectra,
mean centering of ratio spectra. The main problem of
this study is that the concentration of OPC in tablet is
very low, compares with PAR. The tablet formula in
Thailand contains 35 mg of OPC and 450 mg of PAR
per tablet. As shown in Figure 3, UV spectra of PAR
and OPC are completely overlapped in UV region. And
unfortunately, the molar absorptivity of PAR and OPC
are quite different. As seen in Figure 3, UV absorbance of
19 µg/mL of PAR is dominated and covered absorbance
signal of 15 µg/mL of OPC. Therefore, simultaneous
quantitative determination of OPC and PAR with indi-
rect UV spectrophotometric techniques as described above
were not success. In this study, partial least square regres-
sion (PLSR), a widely used chemometric technique, was
tried for determination of OPC and PAR in dissolution
samples. The success PLSR model for determination of
PAR and OPC were performed by using UV absorption
data between 200-400 nm with 5 latent factors. The
parameters of OPC and PAR optimum PLSR models are
showed in Table 4.
3.4. Validation of chemometric method
The internal validation of PLSR models were
cross-validation. The results of cross-validation of the
successive PLSR models were displayed as the plot
between actual concentrations and predicted concen-
Pharmaceutical Sciences Asia
563
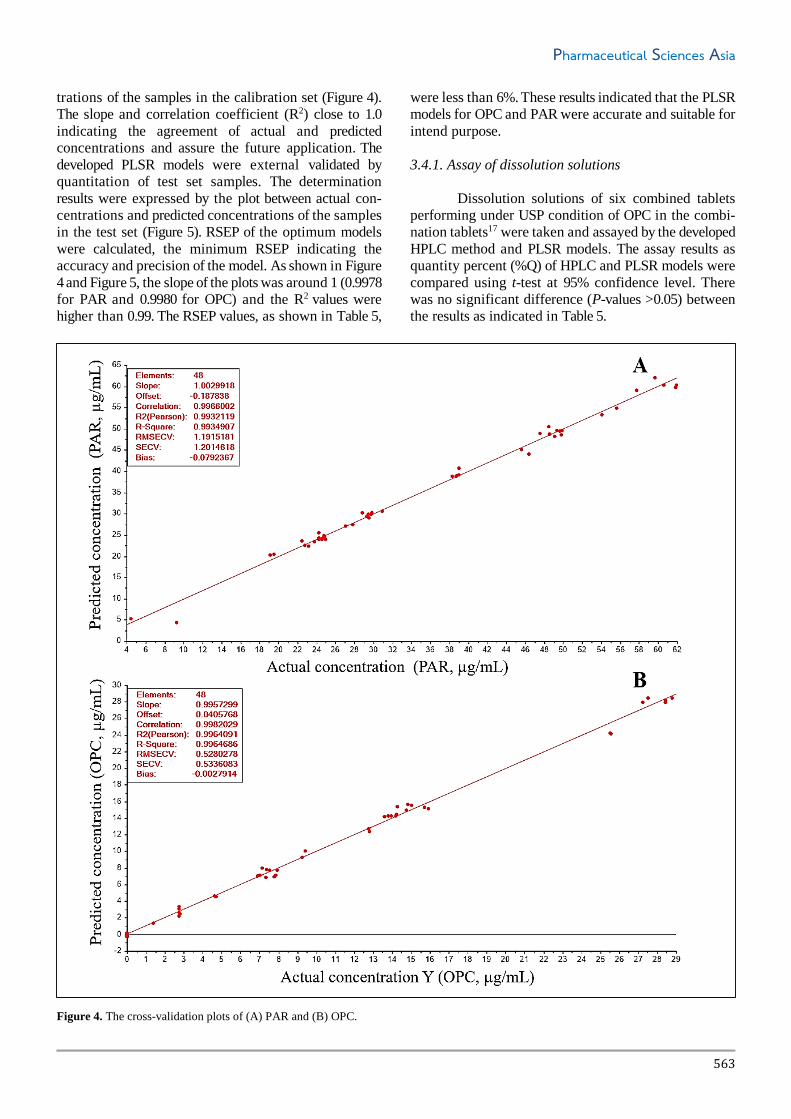
trations of the samples in the calibration set (Figure 4).
The slope and correlation coefficient (R2) close to 1.0
indicating the agreement of actual and predicted
concentrations and assure the future application. The
developed PLSR models were external validated by
quantitation of test set samples. The determination
results were expressed by the plot between actual con-
centrations and predicted concentrations of the samples
in the test set (Figure 5). RSEP of the optimum models
were calculated, the minimum RSEP indicating the
accuracy and precision of the model. As shown in Figure
4 and Figure 5, the slope of the plots was around 1 (0.9978
for PAR and 0.9980 for OPC) and the R2 values were
higher than 0.99. The RSEP values, as shown in Table 5,
were less than 6%. These results indicated that the PLSR
models for OPC and PAR were accurate and suitable for
intend purpose.
3.4.1. Assay of dissolution solutions
Dissolution solutions of six combined tablets
performing under USP condition of OPC in the combi-
nation tablets17 were taken and assayed by the developed
HPLC method and PLSR models. The assay results as
quantity percent (%Q) of HPLC and PLSR models were
compared using t-test at 95% confidence level. There
was no significant difference (P-values >0.05) between
the results as indicated in Table 5.
Figure 4. The cross-validation plots of (A) PAR and (B) OPC.

S. Sonchai et al. Pharm Sci Asia 2021; 48(6), 557-566
564
Figure 5. The correlation plots between actual and predicted concentrations of test set samples for (A) PAR and (B) OPC.
Table 4. The parameters for PAR and OPC of optimum PLSR models.
Model Parameters PAR OPC
Wavelength (nm) 200-400 200-400
Latent factors 5 5
Calibration - -
Slope 0.9978 0.9980
Offset 0.0796 0.0201
R2 0.9978 0.9980
Cross-validation - -
Slope 0.9940 0.9957
Offset 0.2163 0.0406
R2 0.9960 0.9965
RSEP (%) 5.96 3.98

Pharmaceutical Sciences Asia
565
Table 5. The comparison of %Q obtained from HPLC and PLSR methods.
Tablet number PAR OPC
HPLC PLSR HPLC PLSR
1 96.7 96.0 80.4 81.6
2 98.0 99.8 83.3 83.1
3 96.1 97.6 81.5 82.8
4 97.0 98.8 81.6 81.2
5 95.9 96.4 82.6 82.5
6 95.1 96.4 82.5 82.3
P-values 0.21 0.63
4. CONCLUSIONS
The HPLC and chemometric-assisted spectropho-
tometric methods have been proposed and successfully
applied for the simultaneous determination of PAR and
OPC. The dissolution results obtained by chemometric
method were found to be in good agreement with that
of HPLC method with the percentage release of all two
drugs were above 80% in 60 min. The HPLC method is
more specific than the chemometric-assisted spectro-
photometric method, but it requires costly equipment
and materials, for example, columns and HPLC grade
solvents. Chemometric method is less expensive and
does not need complicated instrumentation and any
separation steps. The proposed HPLC and PLSR methods
were found to be suitable and can be effectively used to
assay the dissolution samples of PAR and OPC in fixed
dose combination tablet.
5. ACKNOWLEDGEMENT
The authors acknowledge Defense Pharmaceu-
tical Factory to provide samples and placebo under study.
Conflict of interest
The authors wish to confirm that there are no known
conflicts of interest related with this publication.
Funding None to declare.
Ethics approval None to declare.
Article info:
Received February 2, 2021
Received in revised form May 9, 2021
Accepted May 10, 2021
REFERENCES 1. Chandrasekharan NV, Dai H, Roos KL, Evanson NK, Tomsik J,
Elton TS, et al. COX-3, a cyclooxygenase-1 variant inhibited by
acetaminophen and other analgesic/antipyretic drugs: cloning,
structure, and expression. Proc Natl Acad Sci U S A. 2002;99(21):
13926-31.
2. Stanko JR. Review of oral skeletal muscle relaxants for the
craniomandibular disorder (CMD) practitioner. Cranio. 1990;
8(3):234-43.
3. Yehia AM, Abd El-Rahman MK. Application of normalized
spectra in resolving a challenging Orphenadrine and Paraceta-
mol binary mixture. Spectrochim Acta A Mol Biomol Spectrosc.
2015;138:21-30.
4. Erk N, Ozkan Y, Banoglu E, Ozkan SA, Senturk Z. Simultane-
ous determination of paracetamol and methocarbamol in tablets
by ratio spectra derivative spectrophotometry and LC. J Pharm
Biomed Anal. 2001;24(3):469-75.
5. Sebaiy MM, El-Adl SM, Mattar AA. Different techniques for
overlapped UV spectra resolution of some co-administered drugs
with paracetamol in their combined pharmaceutical dosage
forms. Spectrochim Acta A Mol Biomol Spectrosc. 2020;224:
117429.
6. Lourencao BC, Medeiros RA, Rocha-Filho RC, Mazo LH,
Fatibello-Filho O. Simultaneous voltammetric determination of
paracetamol and caffeine in pharmaceutical formulations using
a boron-doped diamond electrode. Talanta. 2009;78(3):748-52.
7. Haj-Ali DN, Hamdan, II. Development of a capillary electro-
phoresis method for the determination of orphenadrine citrate
in tablets in the presence of paracetamol. Saudi Pharm J. 2010;
18(4):233-7.
8. Arayne MS, Sultana N, Siddiqui FA. Simultaneous Determi-
nation of Paracetamol and Orphenadrine Citrate in Dosage
Formulations and in Human Serum by RP-HPLC. J Chin Chem
Soc-Taip. 2009;56(1):169-74.
9. Boltia SA, Soudi AT, Elzanfaly ES, Zaazaa HE. Development
and Validation of Chromatographic Methods for Simultaneous
Determination of Paracetamol, Orphenadrine Citrate and Caffeine
in Presence of P-aminophenol; Quantification of P-aminophenol
Nephrotoxic Impurity Using LC-MS/MS. J Chromatogr Sci.
2020;58(3):223-33.
10. Sratthaphut L, Ruangwises N. Determination of paracetamol and
orphenadrine citrate in pharmaceutical tablets by modeling of
spectrophotometric data using partial least-squares and artificial
neural networks. Yakugaku Zasshi. 2007;127(10):1723-9.
11. Palur K, Archakam SC, Koganti B. Chemometric assisted UV
spectrophotometric and RP-HPLC methods for simultaneous
determination of paracetamol, diphenhydramine, caffeine and
phenylephrine in tablet dosage form. Spectrochim Acta A Mol
Biomol Spectrosc. 2020;243:118801.
12. Devi Singh V, Kumar Singh V. Chemometric assisted UV-
spectrophotometric methods for simultaneous estimation of
Darunavir ethanolate and Cobicistat in binary mixture and their
tablet formulation. Spectrochim Acta A Mol Biomol Spectrosc.
2021;250:119383.
13. Medendorp J, Colon I, Ryan T. Multivariate approaches for the
development of quality control in-situ fiber optics dissolution
methods for fixed-dose combination tablets. Drug Dev Ind Pharm.
2019;45(6):999-1008.
14. The United States pharmacopeia 43. Acetaminophen. National
formulary 38, Volume 1. Rockville (MD): United States Phar-
macopeial Convention; 2021. p. 38.
15. The United States pharmacopeia 43. Orphenadrine Citrate.

S. Sonchai et al. Pharm Sci Asia 2021; 48(6), 557-566
566
National formulary 38, Volume 1. Rockville (MD): United
States Pharmacopeial Convention; 2021. p. 328.
16. International Conference on Harmonisation. ICH Q2(R1) Valida-
tion of analytical procedures:text and methodology [document
on the Internet]. Geneva; November 2005 Available from: https://
www.ich.org/page/quality-guidelines.
17. The United States pharmacopeia 43. Orphenadrine Citrate,
Aspirin, and Caffeine Tablets. National formulary 38, Volume 2.
Rockville (MD): United States Pharmacopeial Convention; 2021.
p. 3288.