p-values: an introduction matt kramer nea statistics group
TRANSCRIPT

Once upon a time, there was a brilliant scientist who invented a way to tell the difference between signal and noise in messages from data. His method was not perfect, but it worked well provided the message had been carefully crafted in advance to fit a particular format.
Unfortunately, because the method could be purged of ideas and reduced to a single number, well-meaning journal editors were led to declare, "Our journal will publish only signal, never noise."
Understandably, well-meaning authors, under pressure to publish, were motivated to make their messages look to editors like signal, never noise.
Reality intruded. Because many messages had not been carefully crafted, their content was mostly noise.
Thus was born the industry of trying to make noise look like signal. (This last is a lie, of course, or at least an anachronism. The industry of making noise look like signal was invented by politicians thousands of years before Fisher. Statisticians merely fortified the hoax by attaching numbers.)
The moral: Teaching the p-value as an abstract mathematical construct stripped of its context mainly contributes to the noise in the channel of science. Detecting the signal requires thought. Study design matters.
George Cobb (2017)

Outline
Test statistic distributionsWhat are p-values?What is good and bad about them?Are confidence intervals better?Conclusion
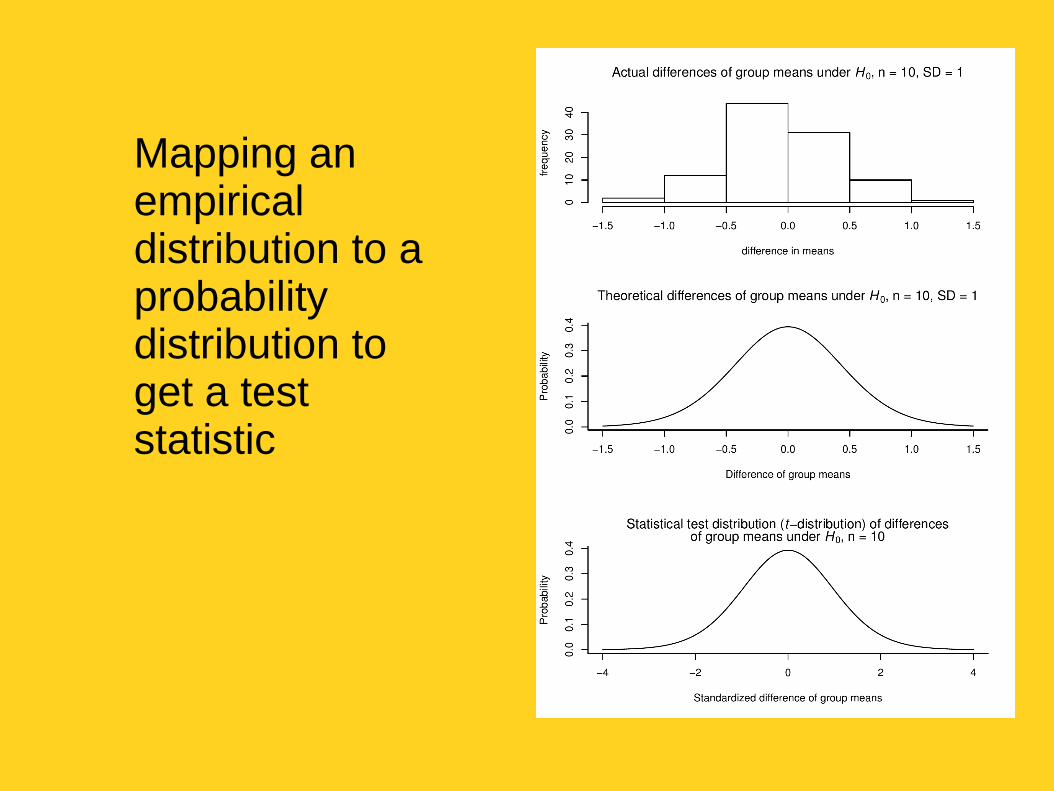
Mapping an empirical distribution to a probability distribution to get a test statistic

What is a p-value?
The probability of getting results at least as extreme as the ones you observed, given that the null hypothesis is correct (if the null hypothesis is true, how surprised are you at the results obtained?).
Pro
babi
lity
Values expected under H0
What is a p-value?
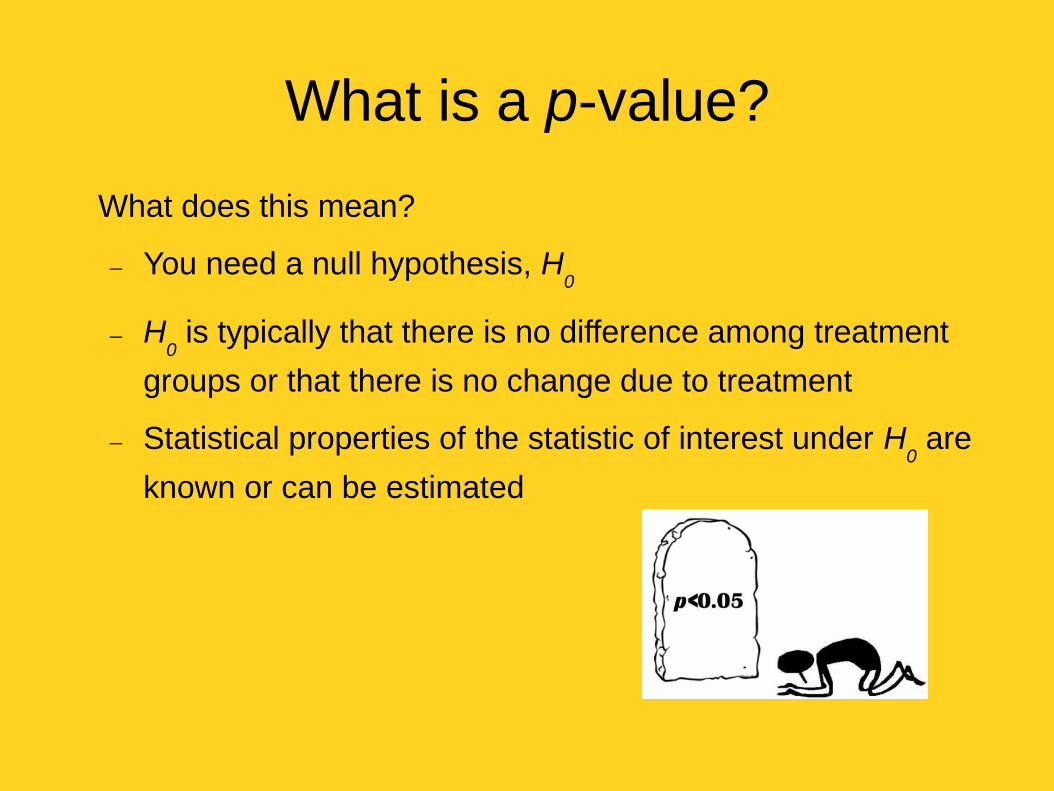
What does this mean?
You need a null hypothesis, H0
H0 is typically that there is no difference among treatment
groups or that there is no change due to treatment
Statistical properties of the statistic of interest under H0 are
known or can be estimated

Example
“Imagine that you have a coin that you suspect is weighted toward heads. (Your null hypothesis is then that the coin is fair.) You flip it 100 times and get more heads than tails. The p-value won’t tell you whether the coin is fair, but it will tell you the probability that you’d get at least as many heads as you did if the coin was fair.”
- Stuart Buck
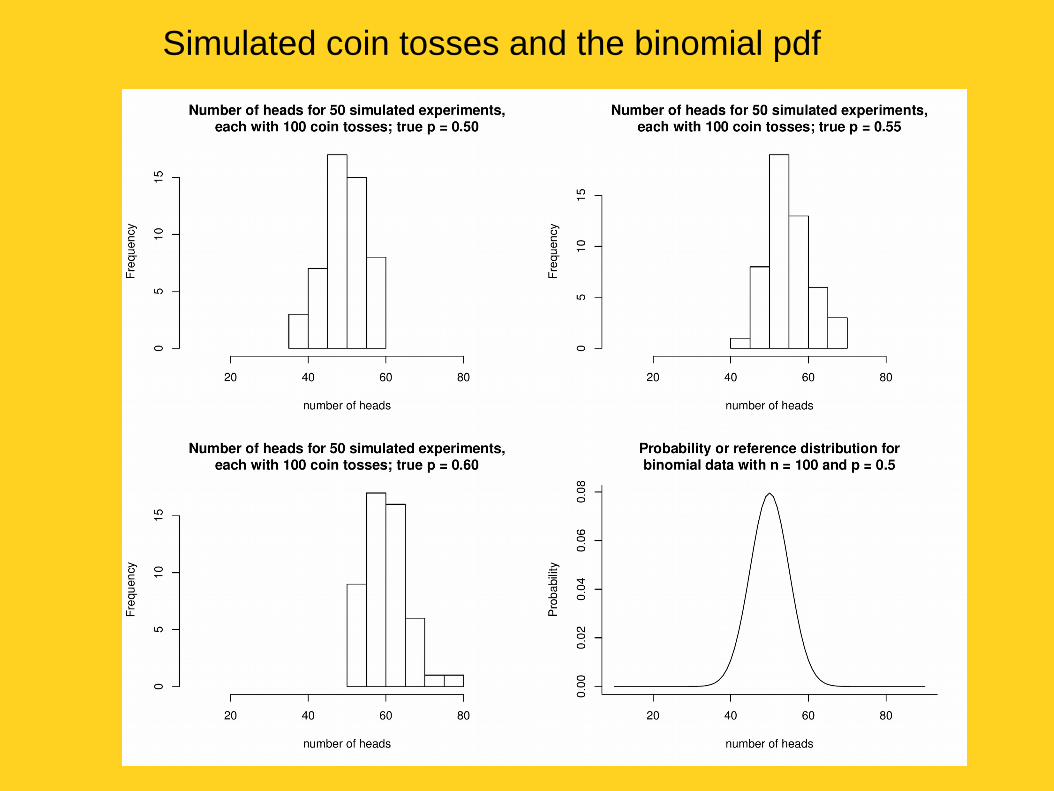
Simulated coin tosses and the binomial pdf

One versus two-tailed tests
or
● One-tailed test: Directional—you only look at one of the tails of the distribution of your test statistic. E.g., H0: the coin is fair or it is weighted towards tails; HA: the coin is not fair, it is weighted towards heads.
One versus two-tailed tests
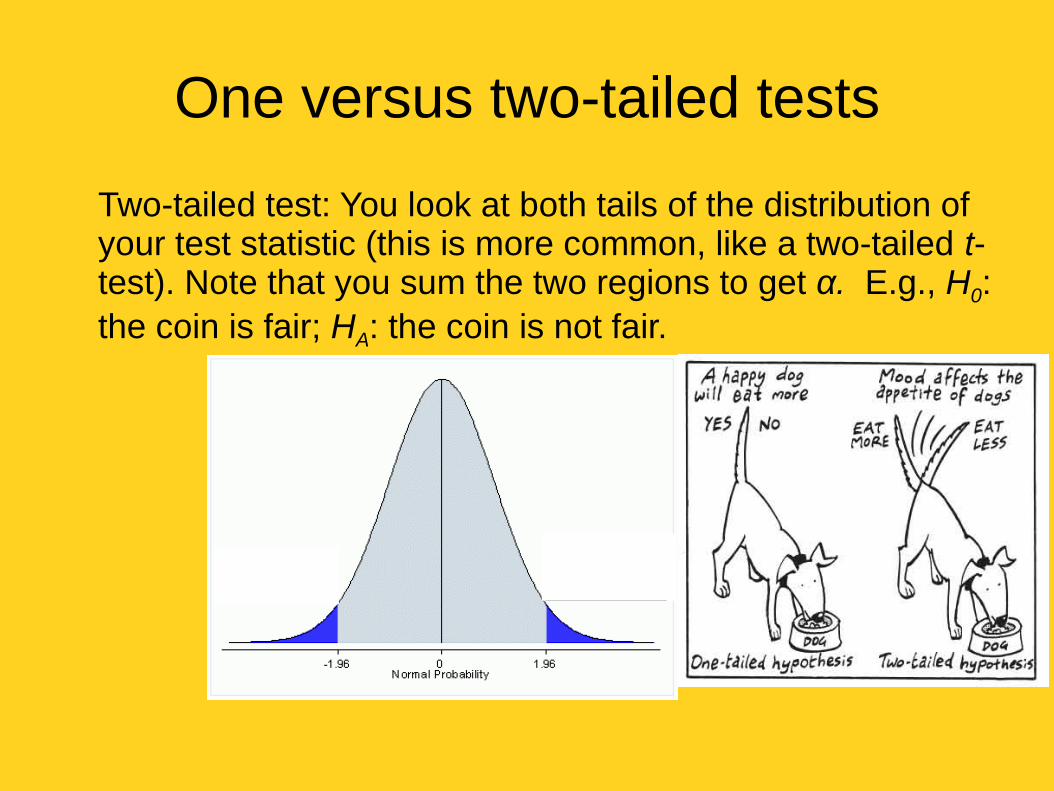
Two-tailed test: You look at both tails of the distribution of your test statistic (this is more common, like a two-tailed t-test). Note that you sum the two regions to get α. E.g., H0: the coin is fair; HA: the coin is not fair.
Where do p-values come from?
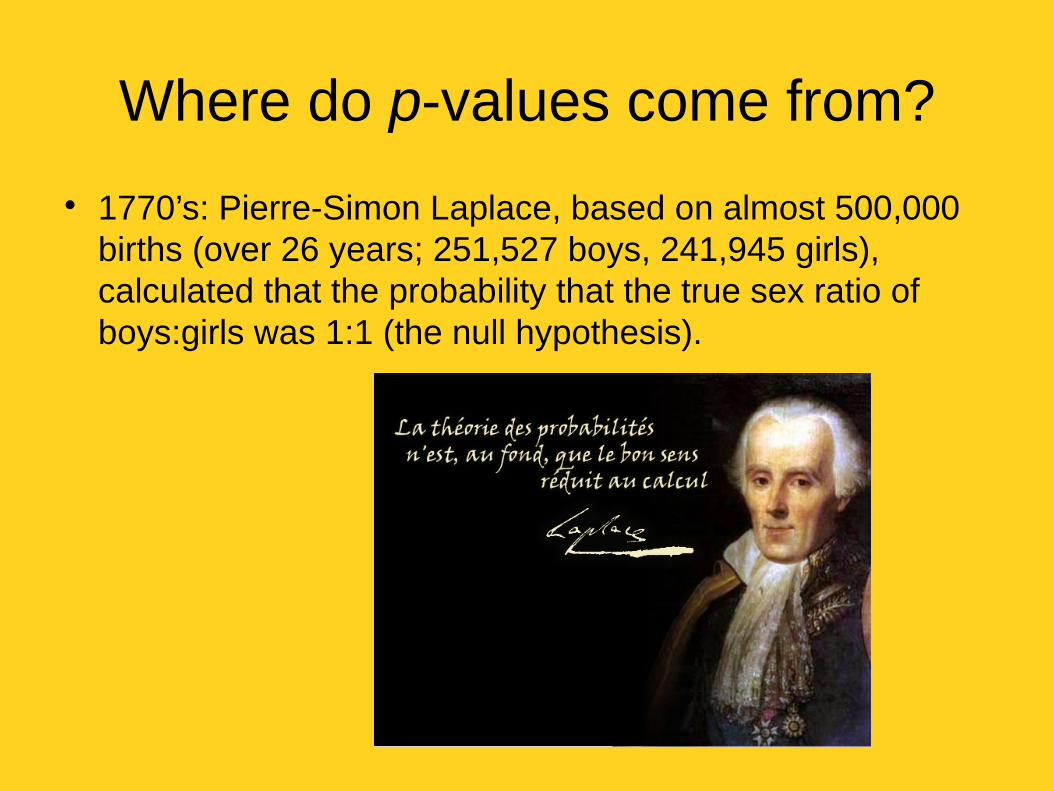
1770’s: Pierre-Simon Laplace, based on almost 500,000 births (over 26 years; 251,527 boys, 241,945 girls), calculated that the probability that the true sex ratio of boys:girls was 1:1 (the null hypothesis).

Where do p-values come from?
1902: Karl Pearson showed how to evaluate p-values for the goodness-of-fit chi-square test.

Where do p-values come from?
● 1926: popularized by Sir R. A. Fisher, who established 0.05, 0.02 and 0.01 as convenient cutoffs for significance testing (but also stated that this should not be the only criterion).
Where do p-values come from?
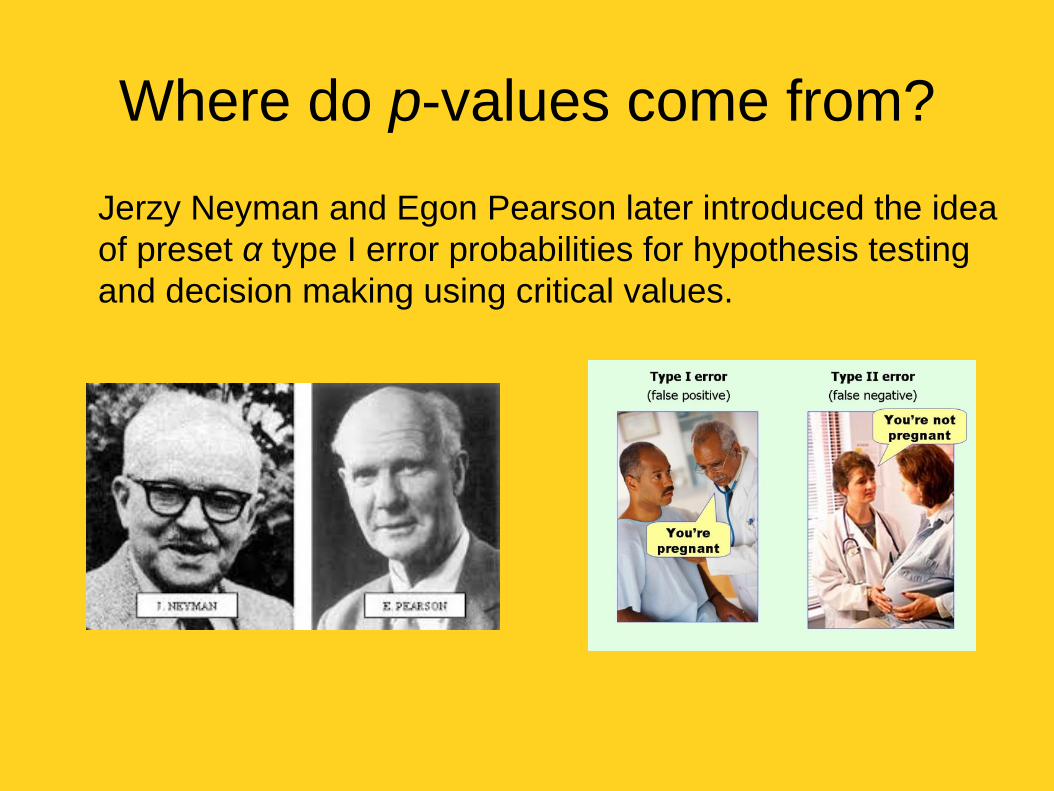
Jerzy Neyman and Egon Pearson later introduced the idea of preset α type I error probabilities for hypothesis testing and decision making using critical values.

Where do p-values come from?
● Significance testing and hypothesis testing were later melded together to give us our current use.
● Fisher: the p-value is interpreted as a continuous measure of evidence against the null hypothesis. There is no particular value at which the results become 'significant'; rather, ‘what is the strength of the signal’?.
● Neyman-Pearson framework: The study is designed (e.g. with a power analysis) to differentiate between two exclusive hypotheses based on a pre-determined error rate, α. Compare the calculated p-value to α and reject the null hypothesis if p < α; otherwise, fail to reject the null hypothesis. This is a decision making process.
Reasoning behind α = 0.05
There is no statistical justification for this number Establishment due to acceptance early on and since
then, convention/inertia This is part of why there is controversy surrounding
the use of p-values and what value of α should be used (and should it be the same in every field?)
Is there really a difference between two replicated experiments, one which found a p-value of 0.049 and the other a p-value of 0.051?
Small p-values
If H0 is true and the test’s assumptions are
satisfied, the observed results are unlikelyNot a measure of the strength of an effect or relationship (can come about if the effect is huge or if a tiny effect is measured very accurately)
Does not tell you if the effect has any practical value
Does not tell you that your results are right

Large p-values
A large p-value is not very informative, it can result from many causes
Some examples: ―sample size too small given the biological variability
―test assumptions not met―effect size is small―missing factors or covariates in statistical model
Additional problems with p-values
Often calculated incorrectly (e.g. statistical model is not appropriate)
Often misinterpreted (e.g. p < 0.05, so my results are important)
Often not adjusted when adjustment is needed (e.g. to control experiment-wise error rate)
Not intuitive: it is the probability of the data given H
0, not the probability of H
0 given the data
p-values cannot be compared unless sample sizes are equal

Good things about p-values
Simple: gives the signal/noise ratio as a single value
The interpretation is consistent across most statistical hypothesis tests
Produced by statistical software

Are confidence intervals better?
Yes A CI tells you how large the effect is and has a
biological interpretation. If the 95% (or 99%) CI does not overlap with what is expected under H
0, then p < 0.05 (or < 0.01)
Can be presented as a figure, or stated, e.g. “H
0 was rejected,
95% CI of diff. = (0.56, 0.78)”

Conclusions
● p-values, as currently used in biology and other fields, were developed ad-hoc, rather than from a theoretical framework.
● A small p-value by itself is not sufficient for a claim of scientific importance
Thanks for listening!