p324 03a hwk 05 ideal dd bu - texas a&m university 5.9636 4795.67 204.327 98.024 16.4370 35...
TRANSCRIPT

Petroleum Engineering 324 — Well Performance Homework 5 — Analysis and Interpretation of a Pressure Drawdown/Buildup Test Sequence
26 February 2003 — Due: Friday 7 March 2003 (turn in after exam)
Homework 5: Analysis and Interpretation of a Pressure Drawdown/Buildup Test Sequence
Introduction: READ THIS FIRST!
This problem consists of a pressure drawdown/buildup test sequence — but one with a very significant twist — the drawdown test was conducted early in the life of the well, and the pressure buildup test was conducted approximately 3 years later.
You should also note that a major well workover occurred shortly after the initial completion, and the "final" well completion is considerably different. You should expect differences in calculated para-meters — formation permeability should be unaffected, but parameters related to the well completion may vary for the two cases.
Other points:
l The "first" pressure drawdown test was terminated prematurely due to a miscommunication be-tween field and service personnel (the pressure gauge was removed from the well too soon). As such, this test may present analysis and interpretation challenges as the recovered test data show the significant influence of wellbore storage effects.
l The workover consisted of changing the packer assembly and performing a small hydraulic fracture treatment to remove near-well skin damage.
Given:
These data are for a pressure drawdown/buildup test sequence run on a producing oil well in a regular (40 acre) pattern development (assume that the well is centered in a bounded square reservoir). The data plots (Cartesian, semilog, and log-log plots) are attached.
Reservoir properties: φ=0.10 rw=0.33 ft ct=15x10-6 psia-1 h=150 ft
Oil properties: Bo=1.2 RB/STB µo=1.5 cp
Production parameters:
Event
Duration of Event
(hr)
Pressure at start of Event
(psia)
Oil Flowrate (STB/D)
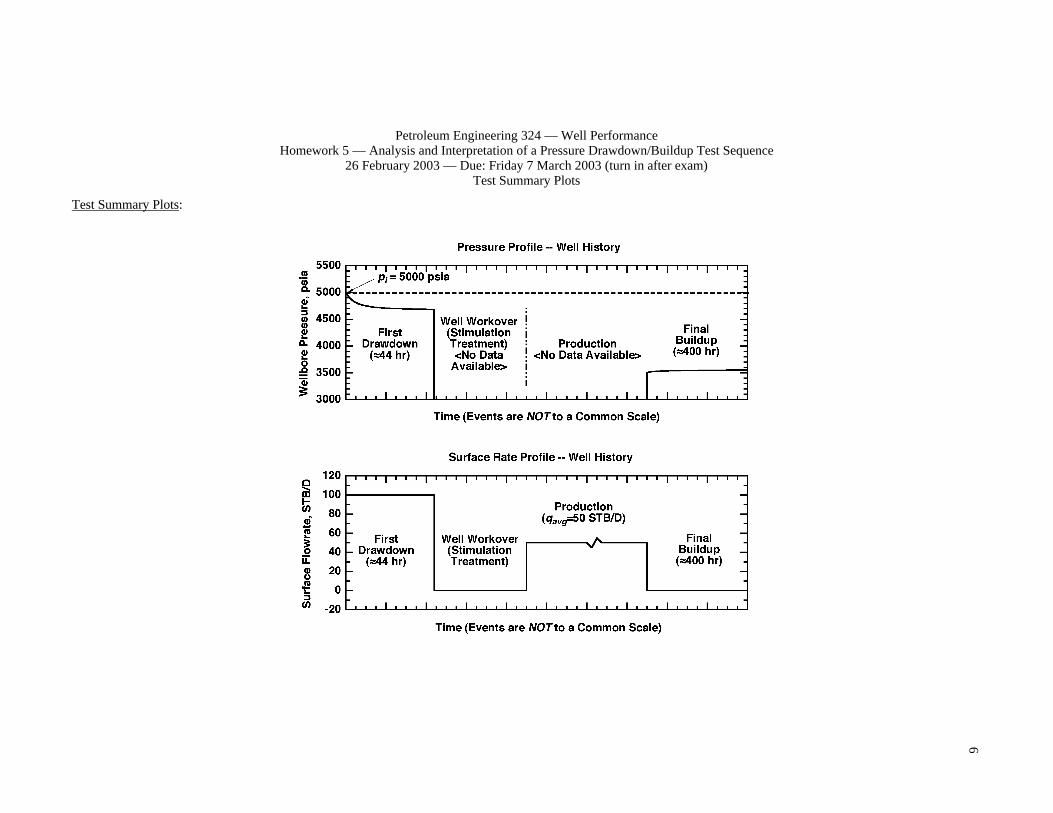
1. First Drawdown Test ˜ 44 pi=5000 100 2. Well Workover 336 (2 weeks) N/A 0 3. Production Sequence 26,280 (3 years) N/A 50 4. Final Buildup Test ˜ 400 pwf(∆t=0)=3502 0
Note: The solution to this homework is available in file (P324_99A_Exam_1_Prob_5.pdf). You are encouraged to make use of this solution — but you remain responsible for all calculations, graphical analysis, etc. Failure to provide all details will result in severe grading penalties.

2
Petroleum Engineering 324 — Well Performance Homework 5 — Analysis and Interpretation of a Pressure Drawdown/Buildup Test Sequence
26 February 2003 — Due: Friday 7 March 2003 (turn in after exam) Required Results — Pressure Drawdown Case
Required: Drawdown Case
You are to estimate the following:
l Log-log analysis: a. The wellbore storage coefficient, Cs. b. The formation permeability, k.
l Cartesian analysis of "early" time (wellbore storage distorted) data: a. The pressure at the start of the test, pi. b. The wellbore storage coefficient, Cs.
l Semilog analysis of "middle" time (radial flow) data: a. The formation permeability, k. b. The near well skin factor, s. c. The radius of investigation, rinv, at the end of radial flow.
l Cartesian analysis of "late" time (boundary-dominated flow) data: a. The reservoir drainage area, A. b. The oil-in-place, N.
l Material balance equation: a. Estimate the average reservoir pressure, p , at the end of the test (the last point).
Results: Drawdown Case
Log-log Analysis:
Wellbore storage coefficient, Cs = RB/psia
Formation permeability, k = md
Cartesian Analysis: Early Time Data
Pressure at start of test, pi = psia
Wellbore storage coefficient, Cs = RB/psia
Semilog Analysis:
Formation permeability, k = md
Near well skin factor, s =
Radius of Investigation, rinv (end of radial flow) = ft
Cartesian Analysis: Late Time Data
Reservoir drainage area, A = acres
The oil-in-place, N = STB
Average reservoir pressure, p (material balance Eq.) = psia

3
Petroleum Engineering 324 — Well Performance Homework 5 — Analysis and Interpretation of a Pressure Drawdown/Buildup Test Sequence
26 February 2003 — Due: Friday 7 March 2003 (turn in after exam) Required Results — Pressure Buildup Case
Required: Buildup Case
You are to estimate the following:
l Log-log analysis: a. The wellbore storage coefficient, Cs. b. The formation permeability, k.
l Cartesian analysis of "early" time (wellbore storage distorted) data: a. The pressure at the start of the test, pwf(∆t=0). b. The wellbore storage coefficient, Cs.
l Semilog analysis of "middle" time (radial flow) data: a. The formation permeability, k. b. The near well skin factor, s. c. The radius of investigation, rinv, at the end of radial flow. d. The extrapolated pressure, p*. e. Average reservoir pressure, p (MBH technique)
l Cartesian analysis of "late" time (boundary-dominated) data: "Muskat Plot" a. Average reservoir pressure, p . Results: Buildup Case
Log-log Analysis:
Wellbore storage coefficient, Cs = RB/psia
Formation permeability, k = md
Cartesian Analysis: Early Time Data
Pressure at start of test, pwf(∆t=0) = psia
Wellbore storage coefficient, Cs = RB/psia
Semilog Analysis: (MDH and Horner analysis)
Formation permeability, k = md
Near well skin factor, s =
Radius of Investigation, rinv (end of radial flow) = ft
Extrapolated pressure, p* (from Horner analysis) = psia
Average reservoir pressure, p (MBH technique) = psia
Cartesian Analysis: Late Time Data ("Muskat Plot")
Average reservoir pressure, p = psia

4
Petroleum Engineering 324 — Well Performance Homework 5 — Analysis and Interpretation of a Pressure Drawdown/Buildup Test Sequence
26 February 2003 — Due: Friday 7 March 2003 (turn in after exam) Drawdown Test Data
Data Functions: Pressure Drawdown Case
Point
t (hr)
pwf (psia)
∆p (psi)
∆p' (psi)
(dp/dt) (psi/hr)
1 0.0083 4999.29 0.711 0.711 85.8142 2 0.0101 4999.14 0.862 0.866 85.6028 3 0.0124 4998.96 1.044 1.047 84.7530 4 0.0151 4998.74 1.263 1.266 84.0212 5 0.0184 4998.47 1.529 1.532 83.2880 6 0.0225 4998.15 1.851 1.854 82.6013 7 0.0274 4997.76 2.240 2.241 81.7694 8 0.0335 4997.29 2.710 2.708 80.9295 9 0.0408 4996.72 3.278 3.270 80.0612
10 0.0499 4996.04 3.964 3.946 79.1595 11 0.0608 4995.21 4.791 4.761 78.2594 12 0.0743 4994.21 5.789 5.736 77.2448 13 0.0907 4993.01 6.990 6.906 76.1820 14 0.1106 4991.56 8.437 8.308 75.0800 15 0.1351 4989.83 10.175 9.976 73.8605 16 0.1649 4987.74 12.261 11.960 72.5508 17 0.2012 4985.24 14.760 14.311 71.1217 18 0.2456 4982.25 17.747 17.083 69.5525 19 0.2998 4978.69 21.309 20.336 67.8326 20 0.3659 4974.46 25.544 24.129 65.9381 21 0.4467 4969.44 30.560 28.514 63.8377 22 0.5452 4963.52 36.475 33.537 61.5113 23 0.6655 4956.58 43.417 39.225 58.9414 24 0.8123 4948.49 51.513 45.577 56.1073 25 0.9915 4939.11 60.890 52.545 52.9941 26 1.2103 4928.34 71.657 60.020 49.5922 27 1.4773 4916.10 83.899 67.819 45.9085 28 1.8032 4902.34 97.658 75.670 41.9652 29 2.2010 4887.09 112.910 83.192 37.7979 30 2.6866 4870.45 129.551 89.911 33.4670 31 3.2792 4852.62 147.379 95.280 29.0555 32 4.0027 4833.92 166.079 98.734 24.6669 33 4.8857 4814.77 185.231 99.766 20.4198 34 5.9636 4795.67 204.327 98.024 16.4370 35 7.2793 4777.19 222.811 93.425 12.8345 36 8.8852 4759.86 240.144 86.232 9.7051 37 10.8454 4744.13 255.870 77.049 7.1043 38 13.2380 4730.32 269.682 66.765 5.0434 39 16.1585 4718.53 281.465 56.379 3.4891 40 19.7233 4708.70 291.296 46.812 2.3734 41 24.0746 4700.59 299.412 38.710 1.6079 42 29.3858 4693.86 306.137 32.359 1.1012 43 35.8687 4688.18 311.817 27.716 0.7727 44 43.7819 4683.24 316.762 24.501 0.5596

5
Petroleum Engineering 324 — Well Performance Homework 5 — Analysis and Interpretation of a Pressure Drawdown/Buildup Test Sequence
26 February 2003 — Due: Friday 7 March 2003 (turn in after exam) Pressure Buildup Test Data
Data Functions: Pressure Buildup Case
Point
∆t (hr)
∆te (hr)
Horner Time
pws (psia)
∆p (psi)
∆p' (psi)
(dp/d∆t) (psi/hr)
1 0.0101 0.0101 2.5943E06 3502.23 0.235 0.235 23.2673 2 0.0126 0.0126 2.0824E06 3502.29 0.291 0.287 22.7179 3 0.0157 0.0157 1.6696E06 3502.36 0.359 0.351 22.2935 4 0.0196 0.0196 1.3401E06 3502.44 0.442 0.429 21.9021 5 0.0245 0.0244 1.0748E06 3502.54 0.545 0.526 21.4969 6 0.0305 0.0305 8.6249E05 3502.67 0.670 0.642 21.0633 7 0.0380 0.0380 6.9176E05 3502.82 0.822 0.782 20.5712 8 0.0474 0.0473 5.5502E05 3503.01 1.008 0.950 20.0612 9 0.0590 0.0590 4.4527E05 3503.23 1.233 1.151 19.5002
10 0.0736 0.0736 3.5726E05 3503.51 1.506 1.391 18.9057 11 0.0917 0.0917 2.8659E05 3503.83 1.835 1.675 18.2661 12 0.1143 0.1143 2.2992E05 3504.23 2.230 2.007 17.5617 13 0.1425 0.1425 1.8446E05 3504.70 2.703 2.395 16.8070 14 0.1776 0.1776 1.4799E05 3505.27 3.266 2.842 16.0012 15 0.2213 0.2213 1.1873E05 3505.93 3.932 3.352 15.1416 16 0.2759 0.2759 9.5249E04 3506.72 4.715 3.927 14.2311 17 0.3439 0.3439 7.6416E04 3507.63 5.630 4.563 13.2689 18 0.4287 0.4287 6.1305E04 3508.69 6.689 5.258 12.2644 19 0.5343 0.5343 4.9183E04 3509.90 7.904 6.000 11.2279 20 0.6660 0.6660 3.9459E04 3511.28 9.284 6.773 10.1694 21 0.8302 0.8302 3.1656E04 3512.83 10.834 7.557 9.1024 22 1.0348 1.0348 2.5397E04 3514.55 12.552 8.324 8.0439 23 1.2899 1.2898 2.0375E04 3516.43 14.434 9.046 7.0132 24 1.6078 1.6077 1.6346E04 3518.46 16.465 9.691 6.0275 25 2.0041 2.0039 1.3114E04 3520.63 18.625 10.229 5.1043 26 2.4980 2.4978 1.0521E04 3522.89 20.889 10.638 4.2585 27 3.1137 3.1133 8.4411E03 3525.23 23.226 10.903 3.5017 28 3.8812 3.8806 6.7722E03 3527.61 25.605 11.023 2.8402 29 4.8378 4.8369 5.4333E03 3529.99 27.994 11.008 2.2754 30 6.0301 6.0287 4.3591E03 3532.37 30.366 10.876 1.8035 31 7.5164 7.5143 3.4974E03 3534.70 32.698 10.654 1.4174 32 9.3690 9.3657 2.8060E03 3536.97 34.974 10.369 1.1068 33 11.6782 11.6730 2.2513E03 3539.18 37.183 10.046 0.8603 34 14.5566 14.5485 1.8064E03 3541.32 39.319 9.704 0.6667 35 18.1444 18.1318 1.4494E03 3543.38 41.380 9.354 0.5155 36 22.6165 22.5970 1.1630E03 3545.37 43.365 9.000 0.3980 37 28.1908 28.1606 9.3322E02 3547.27 45.273 8.640 0.3065 38 35.1391 35.0922 7.4888E02 3549.10 47.102 8.264 0.2352 39 43.8000 43.7271 6.0100E02 3550.85 48.847 7.864 0.1795 40 54.5955 54.4823 4.8236E02 3552.50 50.503 7.422 0.1359 41 68.0518 67.8760 3.8718E02 3554.06 52.058 6.921 0.1017 42 84.8248 84.5518 3.1082E02 3555.50 53.497 6.354 0.0749 43 105.7318 105.3081 2.4955E02 3556.81 54.806 5.682 0.0537 44 131.7918 131.1342 2.0041E02 3557.95 55.954 4.884 0.0371 45 164.2750 163.2545 1.6098E02 3558.92 56.919 3.992 0.0243 46 204.7644 203.1813 1.2934E02 3559.68 57.681 3.050 0.0149 47 255.2334 252.7784 1.0396E02 3560.24 58.238 2.131 0.0084 48 318.1416 314.3363 8.3605E01 3560.60 58.603 1.326 0.0042 49 396.5550 390.6601 6.7271E01 3560.81 58.811 0.583 0.0015
6
Petroleum Engineering 324 — Well Performance Homework 5 — Analysis and Interpretation of a Pressure Drawdown/Buildup Test Sequence
26 February 2003 — Due: Friday 7 March 2003 (turn in after exam) Test Summary Plots
Test Summary Plots:

7
Petroleum Engineering 324 — Well Performance Homework 5 — Analysis and Interpretation of a Pressure Drawdown/Buildup Test Sequence
26 February 2003 — Due: Friday 7 March 2003 (turn in after exam) Log-Log Plot (Pressure Drawdown Case)
Log-Log Plot: Pressure Drawdown Case — Pressure Drop and Pressure Drop Derivative Data

8
Petroleum Engineering 324 — Well Performance Homework 5 — Analysis and Interpretation of a Pressure Drawdown/Buildup Test Sequence
26 February 2003 — Due: Friday 7 March 2003 (turn in after exam) Early-Time Cartesian Plot (Pressure Drawdown Case)
Early-Time Cartesian Plot: Pressure Drawdown Case
9
Petroleum Engineering 324 — Well Performance Homework 5 — Analysis and Interpretation of a Pressure Drawdown/Buildup Test Sequence
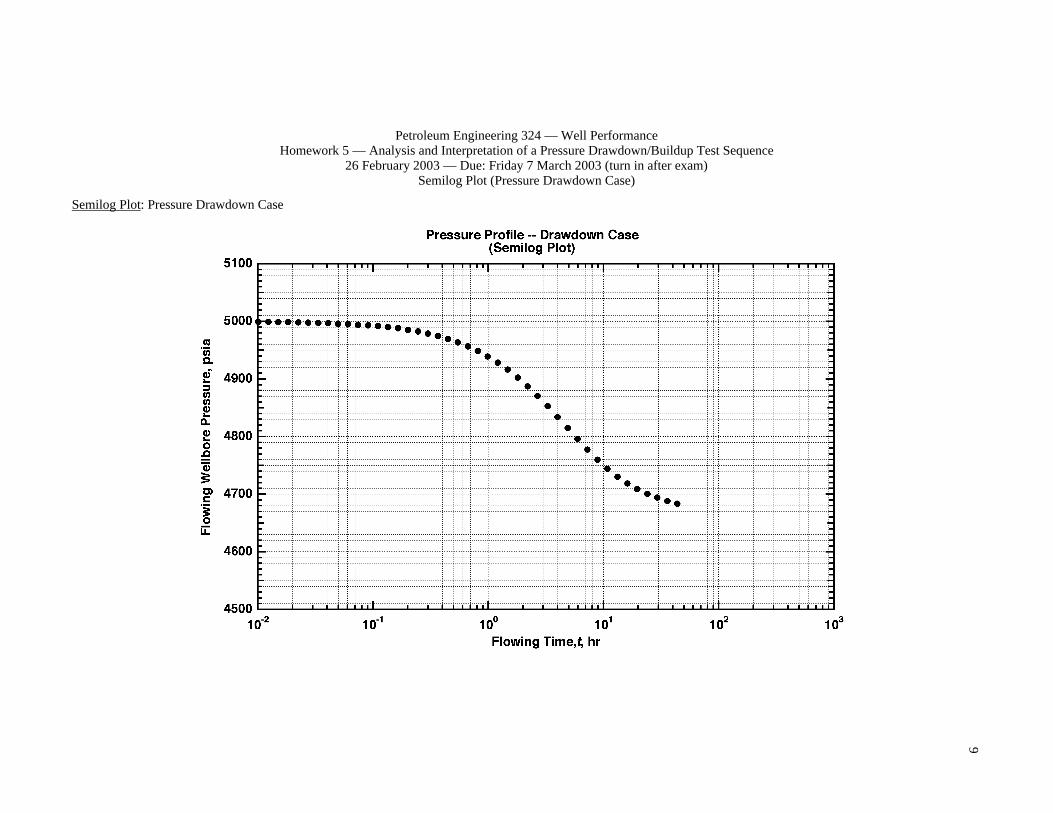
26 February 2003 — Due: Friday 7 March 2003 (turn in after exam) Semilog Plot (Pressure Drawdown Case)
Semilog Plot: Pressure Drawdown Case

10
Petroleum Engineering 324 — Well Performance Homework 5 — Analysis and Interpretation of a Pressure Drawdown/Buildup Test Sequence
26 February 2003 — Due: Friday 7 March 2003 (turn in after exam) Late-Time Cartesian Plot (Pressure Drawdown Case)
Late-Time Cartesian Plot: Pressure Drawdown Case

11
Petroleum Engineering 324 — Well Performance Homework 5 — Analysis and Interpretation of a Pressure Drawdown/Buildup Test Sequence
26 February 2003 — Due: Friday 7 March 2003 (turn in after exam) Log-Log Plot (Pressure Buildup Case — No Rate History)
Log-Log Plot: Pressure Buildup Case — Pressure Drop and Pressure Drop Derivative Data
12
Petroleum Engineering 324 — Well Performance Homework 5 — Analysis and Interpretation of a Pressure Drawdown/Buildup Test Sequence
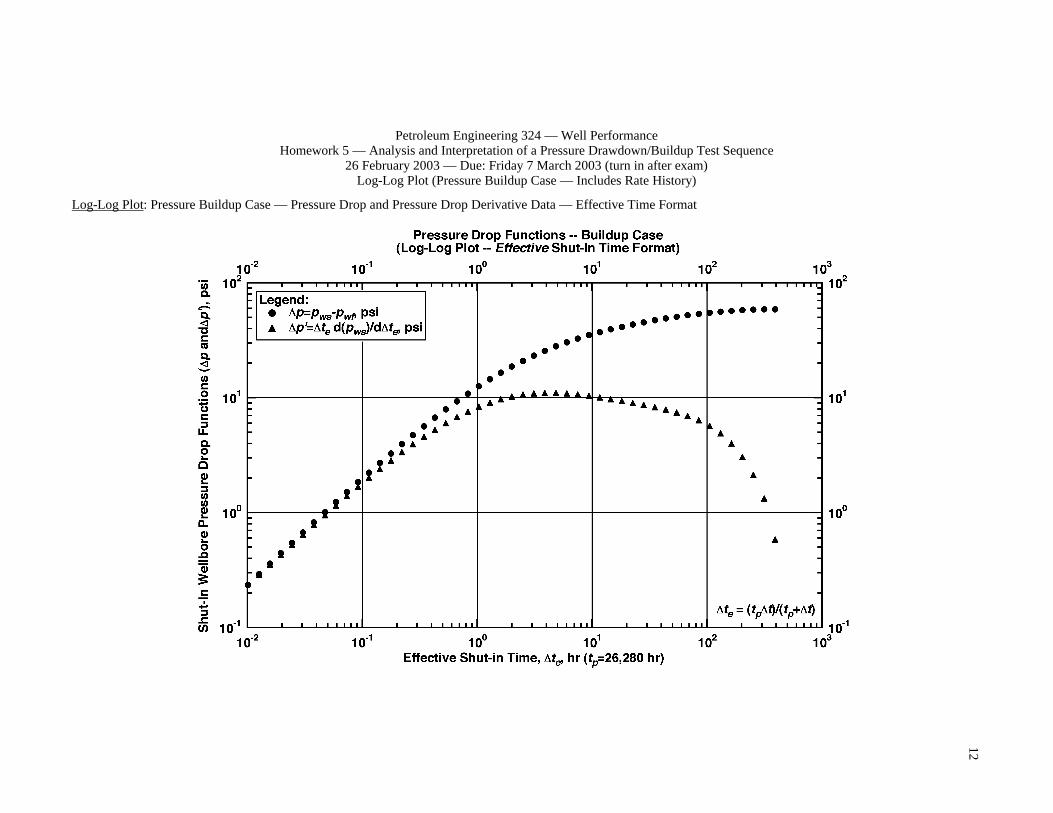
26 February 2003 — Due: Friday 7 March 2003 (turn in after exam) Log-Log Plot (Pressure Buildup Case — Includes Rate History)
Log-Log Plot: Pressure Buildup Case — Pressure Drop and Pressure Drop Derivative Data — Effective Time Format

13
Petroleum Engineering 324 — Well Performance Homework 5 — Analysis and Interpretation of a Pressure Drawdown/Buildup Test Sequence
26 February 2003 — Due: Friday 7 March 2003 (turn in after exam) Early-Time Cartesian Plot (Pressure Buildup Case)
Early-Time Cartesian Plot: Pressure Buildup Case
14
Petroleum Engineering 324 — Well Performance Homework 5 — Analysis and Interpretation of a Pressure Drawdown/Buildup Test Sequence
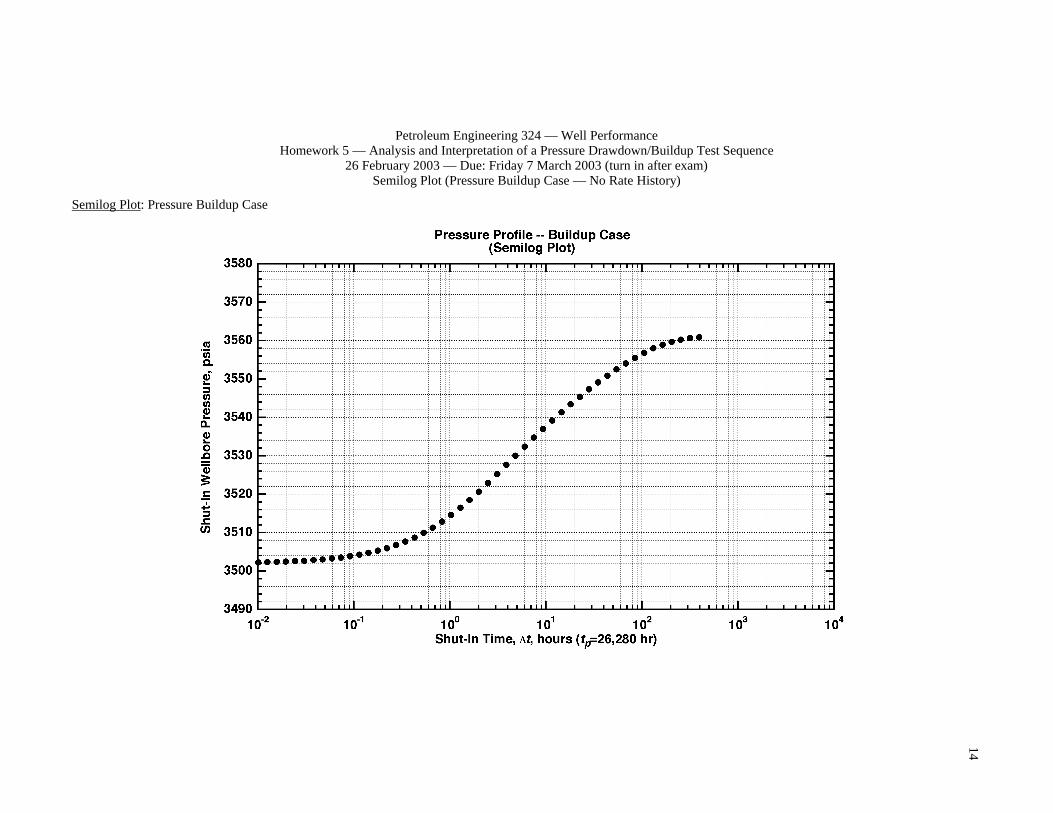
26 February 2003 — Due: Friday 7 March 2003 (turn in after exam) Semilog Plot (Pressure Buildup Case — No Rate History)
Semilog Plot: Pressure Buildup Case

15
Petroleum Engineering 324 — Well Performance Homework 5 — Analysis and Interpretation of a Pressure Drawdown/Buildup Test Sequence
26 February 2003 — Due: Friday 7 March 2003 (turn in after exam) Horner Semilog Plot (Pressure Buildup Case — Includes Rate History)
Horner Semilog Plot: Pressure Buildup Case

16
Petroleum Engineering 324 — Well Performance Homework 5 — Analysis and Interpretation of a Pressure Drawdown/Buildup Test Sequence
26 February 2003 — Due: Friday 7 March 2003 (turn in after exam) Late-Time Cartesian Plot ("Muskat Plot") (Pressure Buildup Case)
Late-Time Cartesian Plot ("Muskat Plot"): Pressure Buildup Case