p53-independent epigenetic repression of the p21 gene in t-cell
TRANSCRIPT

p53-independent Epigenetic Repression of the p21WAF1 Genein T-cell Acute Lymphoblastic Leukemia*□S
Received for publication, June 19, 2011, and in revised form, September 6, 2011 Published, JBC Papers in Press, September 8, 2011, DOI 10.1074/jbc.M111.272336
Carwyn Davies‡, Linda A. Hogarth§, Philipp A. Dietrich‡, Petra S. Bachmann‡, Karen L. Mackenzie‡, Andrew G. Hall§,and Richard B. Lock‡1
From the ‡Children’s Cancer Institute Australia for Medical Research, Lowy Cancer Research Centre, University of New South Wales,Sydney, New South Wales 2052, Australia and §Northern Institute for Cancer Research, Newcastle University, Newcastle,NE2 4HH, United Kingdom
The p53 protein is a primary mediator of cellular apoptosisand growth arrest after exposure toDNA-damaging agents. Pre-vious work has shown that the majority of childhood acute lym-phoblastic leukemia (ALL) cases express a wild type p53 gene,although the functionality of the p53 pathway has rarely beenvalidated. In the present study, the integrity of the p53 pathwaywas investigated in a panel of ALL cell lines and xenograftsestablished from direct patient explants in immune-deficientmice. A focused real-time quantitative reverse transcriptionPCR array of known p53-regulated genes identified p21WAF1
(CDKN1A) as the highest ranked gene to be differentiallyexpressed between B-cell precursor (BCP)-ALL and T-ALLxenografts following exposure to the DNA-damaging drug eto-poside. Lack of p21WAF1 induction was observed in six of sevenT-ALL xenograft lines, as well as primary T-ALL cells followingirradiation exposure, despite an otherwise functional p53response. Repression of p21WAF1 in T-ALL cells was associatedwith decreased acetylated H3K9 localized at its promoter com-pared with BCP-ALL cells, together with increased CpG meth-ylation within the first exon and intron. Although the histonedeacetylase inhibitor vorinostat failed to induce p21WAF1 inT-ALL samples, the combination of vorinostat and the dem-ethylating agent decitabine reactivated expression of thesilenced p21WAF1 gene in the Molt-4 T-ALL cell line. Consider-ing the known anti-apoptotic function of p21WAF1, our findingshave significant implications for the responses ofT- versusBCP-ALL cells to chemotherapeutic drugs that induce p21WAF1.
Combination chemotherapy is highly effective in the treat-ment of childhood acute lymphoblastic leukemia (ALL)2 (1),
and the efficacy of chemotherapeutic drugs is thought to bedependent on their ability to induce apoptosis in leukemia cells(2). The p53 protein and its signaling pathway play a central rolein modulating the cellular response to DNA-damaging drug-induced apoptosis (3) or cell cycle arrest (4). Wild type p53 canactivate an apoptotic response through a transcription-depen-dent or -independent mechanism (5). The ability of p53 toinduce cell cycle arrest depends on the transcriptional activa-tion of a number of target genes, including p21WAF1 (CDKN1A)(6).A high proportion of cancers express a mutated or deleted
form of the p53 gene, resulting in an impaired response tochemotherapy agents (7). Such p53 gene mutations have rarelybeen described in primary childhoodALL cells, with the overallincidence at diagnosis reported to be 1–2% (8), increasing to19% in B-lineage and 33% of T-lineage relapse cases (9). How-ever as an alternative to p53 mutations, it has been suggestedthat inactivation of wild type p53 in leukemia cells may occurthrough binding to its principal cellular regulator human hom-olog of mouse double minute 2 (Hdm-2) (10). Although defec-tive p53 function itself cannot entirely account for the preva-lence of faulty responses to chemotherapy, deficiencies in othergenes within the p53 pathwaymay be involved in impaired apo-ptotic responses leading to the emergence of chemotherapyresistance.The cyclin-dependent kinase inhibitor, p21WAF1, is a well
characterized modulator of p53-induced cell cycle arrest afterDNA damage (6) and is recognized as an important tumor sup-pressor gene.Defective p21WAF1 activation has been implicatedin leukemogenesis (11), which appears to conflict with itsapparent role in cell death inhibition. Reports have demon-strated that p21WAF1 expression is sufficient to protect cellsfrom apoptotic stimuli (12, 13), whereas suppression ofp21WAF1 by extrinsic means enhances sensitivity to drug-in-duced cell death (14–17). An absence of p21WAF1 expressionhas been noted in T-ALL cells (18), whereas high levels ofp21WAF1 in acutemyeloid leukemia cells were associated with apoor prognosis (19). Although inactivation of p21WAF1 mRNAcould also be mediated by the miR-106b family (20), other epi-genetic processes could likewise play a role in transcriptionalinactivation of p21WAF1, as mutations in the p21WAF1 gene arerare in human malignancies (21) .Epigenetic gene regulation is characterized bymethylation of
CpG dinucleotides and remodeling of the chromatin structureby post-translational histone modifications. Methylation of
* This work was supported by the Children’s Cancer Institute Australia forMedical Research, a senior research fellowship (to R. B. L.) from the Austra-lian National Health and Medical Research Council, an Australian postgrad-uate award (to C. D.), a university postgraduate award (to P. S. B.) and theJGW Patterson Foundation (Newcastle upon Tyne, UK) (to L. A. H.). TheChildren’s Cancer Institute Australia for Medical Research is affiliated withthe University of New South Wales and Sydney Children’s Hospital.
□S The on-line version of this article (available at http://www.jbc.org) containssupplemental Methods, Tables S1–S4, and Figs. S1–S5.
1 To whom correspondence should be addressed: Children’s Cancer InstituteAustralia for Medical Research, Lowy Cancer Research Centre, University ofNew South Wales, PO Box 81, Randwick NSW 2031, Australia. Tel.: 61-2-9385-2513; Fax: 61-2-9662-6583; E-mail: [email protected].
2 The abbreviations used are: ALL, acute lymphoblastic leukemia; BCP, B-cellprecursor; T-ALL, T-cell ALL; DMSO, dimethyl sulfoxide; RT-qPCR, real-timequantitative reverse transcription PCR; TSS, transcription start site.
THE JOURNAL OF BIOLOGICAL CHEMISTRY VOL. 286, NO. 43, pp. 37639 –37650, October 28, 2011© 2011 by The American Society for Biochemistry and Molecular Biology, Inc. Printed in the U.S.A.
OCTOBER 28, 2011 • VOLUME 286 • NUMBER 43 JOURNAL OF BIOLOGICAL CHEMISTRY 37639
by guest on March 26, 2018
http://ww
w.jbc.org/
Dow
nloaded from

CpG islands in promoter regions is strongly associated withgene silencing (22), whereas histone deacetylation leads to tran-scriptionally inert chromatin (23). DNA hypermethylation ofthe p21WAF1 gene has been reported in p21WAF1-silenced cells,including at the distal promoter in rhabdomyosarcoma cells(24) and across the Sp1/Sp3 binding sites in ALL primary sam-ples (25), T-ALL cell lines, adult T-cell leukemia/lymphomacells (26), and lung cancer cells (27). CpG methylation acrossexon 1/intron 1 of the rat p21WAF1 gene also has been reported(28). Hemizygous CpGmethylation has been described in ALLcell lines (29, 30). However in contrast to these reports, CpGmethylation was not detectable in a range of neoplastic cells,including ALL patient blasts where p21WAF1mRNA disruptionwas evident (29–33).This report characterizes p53-induced signaling pathways in
leukemia cell lines, patient-derived ALL xenografts and pri-mary blasts by assessing their response to the DNA-damagingagents, etoposide and irradiation, and the Hdm-2 small mole-cule inhibitor, nutlin-3. Although p53 transcriptional activitywas intact, we reveal a lineage-dependent epigenetic repressionof the p21WAF1 gene in T-ALL, but not B-cell precursor (BCP)-ALL, cells that could be reversed by simultaneous exposure ofcells to the histone deacetylase inhibitor vorinostat and thedemethylating agent decitabine. Our study provides novelobservations on the differential lineage-dependent regulationof p21WAF1 expression in leukemia cells.
EXPERIMENTAL PROCEDURES
Patient Clinical Samples—Leukemia cells were obtainedfrom the Centre for Children’s Cancer and Blood Disorders atSydney Children’s Hospital from children presenting with ALLat initial diagnosis or at bonemarrow relapsewhowere enrolledin the Australia and New Zealand Children’s Cancer StudyGroup Study VII (1998–2001) or Study VIII (2002 to present),or from theRoyal Victoria Infirmary,Newcastle uponTyne,UK(from June 2002 to June 2009). The protocol for harvesting andstorage of the specimens is detailed in previous work (34). Bonemarrow mononuclear cells were isolated by density gradientcentrifugation using Lymphoprep (Axis-Shield, Oslo, Norway).Isolated leukemic blasts were cryopreserved in 10% dimethylsulfoxide (DMSO) (v/v) in FBS (Thermo Trace, Victoria, Aus-tralia). Thawed patient blasts were resuspended and seeded at5 � 105/ml in RPMI 1640 medium containing glutamine (bothfrom Invitrogen) and 10% FBS and exposed to irradiation orMG132 (Sigma-Aldrich) dissolved in DMSO (Sigma-Aldrich).The use of patient-derived leukemia cells was approved byregional ethical committee approval for Australian and UKsamples. Minimal residual disease in BCP-ALL patients, 28days after start of treatment, was measured as described previ-ously (35).In Vitro Culture and Cytotoxicity Assays of Cell Lines and
Xenografted Patient Cells—BCP-ALL (PreB-697, Reh,Nalm-6),BCP lymphoblastoid (TK6), or T-ALL (CCRF-CEM (CEM),Jurkat, Molt-4) cell lines were obtained either from the ATCC(Manassas, VA) or the European Collection of Cell Cultures(Salisbury, UK) and were maintained in RPMI 1640 mediumsupplemented with 10% FBS and penicillin (100 units/ml),streptomycin (100 �g/ml), and L-glutamine (2 mM) supplied
from Invitrogen. Xenografts were previously established fromdirect patient explants (36) and are representative of BCP-ALLand T-ALL derived from patients with diverse treatment out-comes (see supplemental Table S1). Xenograft cells wereretrieved from cryostorage and prepared for in vitro culture asdescribed previously (37).For in vitro drug exposure experiments, cells were equili-
brated in a humidified atmosphere overnight at 37 °C, 5% CO2,prior to the addition of etoposide (Sigma-Aldrich), vorinostat(kindly provided by Merck, Sharp and Dohme Corp. (Rahway,NJ) and the National Cancer Institute (Bethesda, MD)), nut-lin-3 or decitabine (Sigma-Aldrich), or an equivalent volume ofDMSO. In vitro sensitivity was assessed and viability calculatedafter 48 h exposure to nutlin-3 using the colorimetric methyl-thiazolyl-tetrazolium (Sigma-Aldrich) assay, as described pre-viously (37).Analysis of mRNA Expression by Real-time PCR and
RT-qPCR Array—RNA extraction and real-time quantitativereverse transcription PCR (RT-qPCR) of gene expression incells exposed to etoposide or vorinostat was carried out asdescribed previously (37). Primers and probes for p21WAF1
(Hs00355782_m1) were purchased from Applied Biosystems(Foster City, CA). Elongation factor-1� (EF-1�) was used as aninternal standard in each reaction (primers EF-1�F, 5�-CT-GAACCATCCAGGCCAAAT-3�; EF-1�R, 5�-GCCGTGTG-GCAATCCAAT-3�; probe, 5�-VIC-AGCGCCGGCTATGC-CCCTG-TAMRA-3�). RNA from irradiated primary ALL cellsand cell lines was extracted using the Qiagen RNeasy Mini kit(Qiagen, Crawley, UK), and cDNA synthesis was carried outusing the Applied Biosystem High-Capacity cDNA ReverseTranscriptase kit. Primers and probes for p21WAF1
(Hs00355782_m1) and �-actin (VIC-TAMARA, endogenouscontrol, catalog no. 4310881E) were purchased from AppliedBiosystems. Triplicate samples were assayed with the ABI 7500or 7700 Fast Real-time PCR System (Applied Biosystems) usingthe TaqMan® Universal PCRMasterMix (Applied Biosystems),and RT-qPCR was carried out according to the manufacturer’sinstructions. The p21WAF1mRNA levels of irradiated cells werenormalized to an endogenous gene and expressed relative top21WAF1 mRNA expression in a control cell line. Specificdetails can be found in the figure legends.For RT-qPCR arrays, total RNA was isolated as described in
the manufacturer’s protocol for the RT2-qPCR RNA isolationkit (SABiosciences, SuperArray, Frederick, MD) from xeno-graft cells that had been exposed to etoposide (5 �M for 3 or12 h). The quality and concentration of extracted RNA wasevaluated with a Nanodrop ND-1000 spectrophotometer(Thermo Scientific) and a Bioanalyzer 2100 (Agilent Technol-ogies) according to the manufacturer’s instructions. cDNAwassynthesized using the RT2 Profiler PCR array first strand kit(SABiosciences) following the manufacturer’s recommenda-tions. cDNA samples were loaded into individual wells of aHuman p53 Signaling Pathway RT-qPCR array (SABiosci-ences). Samples were subsequently assayed on anABI 7700 FastReal-time PCR System (Applied Biosystems) and analyzedaccording to the manufacturer’s protocol. The acquired datawere log-transformed using log10(x), where x is the sample��Ct value. Log-transformed data from individual arrays were
p53-independent Epigenetic Repression of p21WAF1 in T-ALL
37640 JOURNAL OF BIOLOGICAL CHEMISTRY VOLUME 286 • NUMBER 43 • OCTOBER 28, 2011
by guest on March 26, 2018
http://ww
w.jbc.org/
Dow
nloaded from
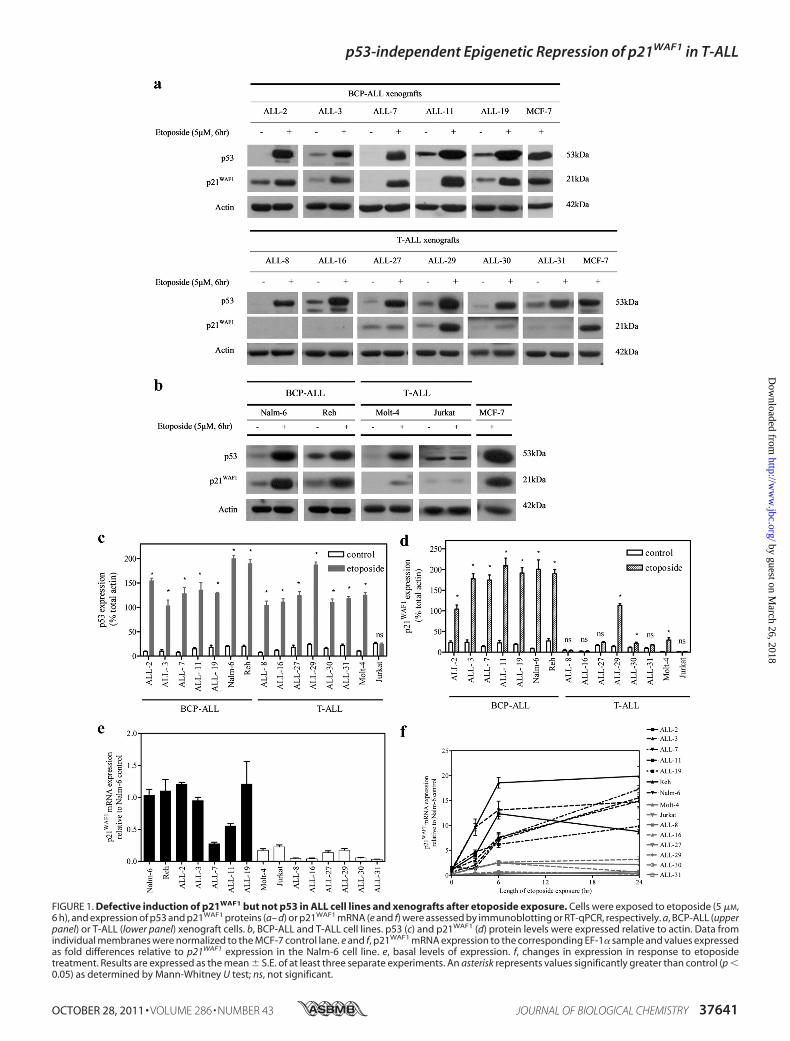
FIGURE 1. Defective induction of p21WAF1 but not p53 in ALL cell lines and xenografts after etoposide exposure. Cells were exposed to etoposide (5 �M,6 h), and expression of p53 and p21WAF1 proteins (a– d) or p21WAF1 mRNA (e and f) were assessed by immunoblotting or RT-qPCR, respectively. a, BCP-ALL (upperpanel) or T-ALL (lower panel) xenograft cells. b, BCP-ALL and T-ALL cell lines. p53 (c) and p21WAF1 (d) protein levels were expressed relative to actin. Data fromindividual membranes were normalized to the MCF-7 control lane. e and f, p21WAF1 mRNA expression to the corresponding EF-1� sample and values expressedas fold differences relative to p21WAF1 expression in the Nalm-6 cell line. e, basal levels of expression. f, changes in expression in response to etoposidetreatment. Results are expressed as the mean � S.E. of at least three separate experiments. An asterisk represents values significantly greater than control (p �0.05) as determined by Mann-Whitney U test; ns, not significant.
p53-independent Epigenetic Repression of p21WAF1 in T-ALL
OCTOBER 28, 2011 • VOLUME 286 • NUMBER 43 JOURNAL OF BIOLOGICAL CHEMISTRY 37641
by guest on March 26, 2018
http://ww
w.jbc.org/
Dow
nloaded from
p53-independent Epigenetic Repression of p21WAF1 in T-ALL
37642 JOURNAL OF BIOLOGICAL CHEMISTRY VOLUME 286 • NUMBER 43 • OCTOBER 28, 2011
by guest on March 26, 2018
http://ww
w.jbc.org/
Dow
nloaded from

analyzed using the GenePattern limma module to assess thedegree of differential gene expression comparing BCP-ALLwith T-ALL (38). Results were visualized on a heat map andgenes are shown in descending significance of induction inBCP-ALL relative to T-ALL.Analysis of Protein Expression—Whole cell lysates were pre-
pared from xenograft cells and leukemia cell lines as describedpreviously (37). Equal amounts of protein (25 �g) were sepa-rated by NuPAGE gel electrophoresis and electro-transferredto PVDF membranes according to the manufacturer’s instruc-tions (Invitrogen).Membranes were probedwith antibodies forp21WAF1 (BD Transduction Laboratories, San Diego, CA), wildtype p53 (SantaCruzBiotechnology, SantaCruz, CA), and actin(Sigma-Aldrich), followed by HRP-conjugated donkey anti-rabbit or sheep anti-mouse secondary antibody (GE Health-care). Bound secondary antibodies were detected by chemilu-minescence and visualized by autoradiography detection andphosphorimaging using a VersaDoc 5000 Imaging System (Bio-Rad). Data were analyzed using QuantityOne software (version4.00; Bio-Rad). For irradiated primary ALL cells and cell lines,lysates were separated on 4–20% Tris-glycine gels (Invitrogen)and electro-transferred onto a PVDFmembrane. Immunoblotswere probed for p21WAF1 (clone SX118BD or 70; BD Biosci-ences), p53 (Clone D0–7, Novacastra, Newcastle upon Tyne,UK), tubulin (Sigma-Aldrich), or actin (Clone JLA20, Calbi-ochem, Nottingham, UK) and detected with HRP-conjugatedsecondary antibodies (Dako, Ely, UK). The densitometry ofscanned immunoblots was carried out using AIDA image anal-ysis software (Straubenhardt, Germany).ChIP Assays—ChIP analysis of histone acetylation was con-
ducted as described previously (39), using immunoglobulinraised against acetyl-histone 3 (Lys-9/14(H3K9)) (Millipore,Billerica, MA), and processed according to the manufacturer’sinstructions. DNA fromprotein-associated complexes and cor-responding input samples was recovered using the QIAquickPCR purification kit (Qiagen, Hilden, Germany) and assayed bySYBR-Green qPCR under standard conditions (supplementalTable S2). The fold enrichment of samples was expressed rela-tive to mock-treated control and normalized to acetylatedH3K9 at theGAPDH locus in each PCR sample (40). PCR prod-ucts were separated by PAGE, gels were stained with SYBRGreen and imaged using a VersaDoc 5000 Imaging System(Bio-Rad).SEQUENOM Cytosine Methylation Analysis—Quantitative
high-throughput methylation analysis of CpG sites in thep21WAF1 gene was carried out using the MassARRAY® Epityp-erTM system (Sequenom, San Diego, CA) as described previ-ously (41). Briefly, genomic DNA was isolated from leukemiacells as described previously (39), and these samples were sent
to Australian Genome Research Facility (University of Queen-sland, Brisbane, Australia) for sample preparation and analysis.Two bisulfite reactions (regions 4 and 5) were designed, whichcovered all CpGs across the island. The primer sequences areshown in supplemental Table S2.After determiningCpGmeth-ylation byMALDI-TOFMS, data were quantified by Quantita-tive Methylation Analysis software (Sequenom), and methyla-tion ratios were plotted from the mean value of three replicateamplicons using Heatmap.2 in R software.Statistical Comparison and Data Analysis—Unless other-
wise stated, all data were compiled and analyzed usingGraphPad Prism software (version 4.00). The Mann-WhitneyU test and the Student’s t test were utilized to determinewhether differences between non-normally and normally dis-tributed data, respectively, were significant. The significancelevel was set at p � 0.05.
RESULTS
Attenuated p21WAF1 Response in T-ALL Cells with Func-tional p53 Activity—Previous sequence analysis has identifiedno mutations compared with published wild type sequences ofthe entire p53 coding region (exons 2 to 11) forALL-2, -3, -7, -8,-11, -16, and -19 xenografts (34). Cell lines were verified againstthe p53 coding regions listed on the International Agency forResearch in Cancer TP53 database and the COSMIC database.The Jurkat, CEM, and Reh cell lines are reported to containmutations in their coding region, whereas different sources oftheMolt-4 cell line has been identified as mutant and wild type(42, 43). TheNalm-6 and TK6 line were listed as wild type, withno record of the PreB-697 cell line on either databases.To evaluate the functionality of the p53 pathway in ALL cell
lines and in vitro-cultured xenograft cells, p53 and p21WAF1
protein levels were assessed by immunoblotting after exposureto etoposide. Treatment with etoposide (5 �M, 6 h) induced anincrease in p53 protein expression in the Molt-4, Reh, andNalm-6 cell lines, as well as the panel of 11 ALL xenografts (Fig.1, a–c). In contrast, there was no change in p53 expression inthe Jurkat cell line, reflecting an abnormal response to DNAdamage. Induction of p21WAF1 protein in response to etoposidewas observed in BCP-ALL xenografts and cell lines (Fig. 1, a,upper panel, b, and d), whereas only negligible p21WAF1 levelswere detected in the T-ALL Jurkat andMolt-4 cell lines (Fig. 1,b and d). Although induction of p53 occurred in response toetoposide in all T-ALL xenografts (Fig. 1, a, lower panel, and c),notable induction of p21WAF1 occurred in only one of sixT-ALL xenograft samples (ALL-29, Fig. 1, a, bottom panel, andd). The basal level of p21WAF1 mRNA was also lower in T-ALLcompared with BCP-ALL cells (Fig. 1e). Expression of p21WAF1
mRNA was also measured up to 24 h after etoposide exposure
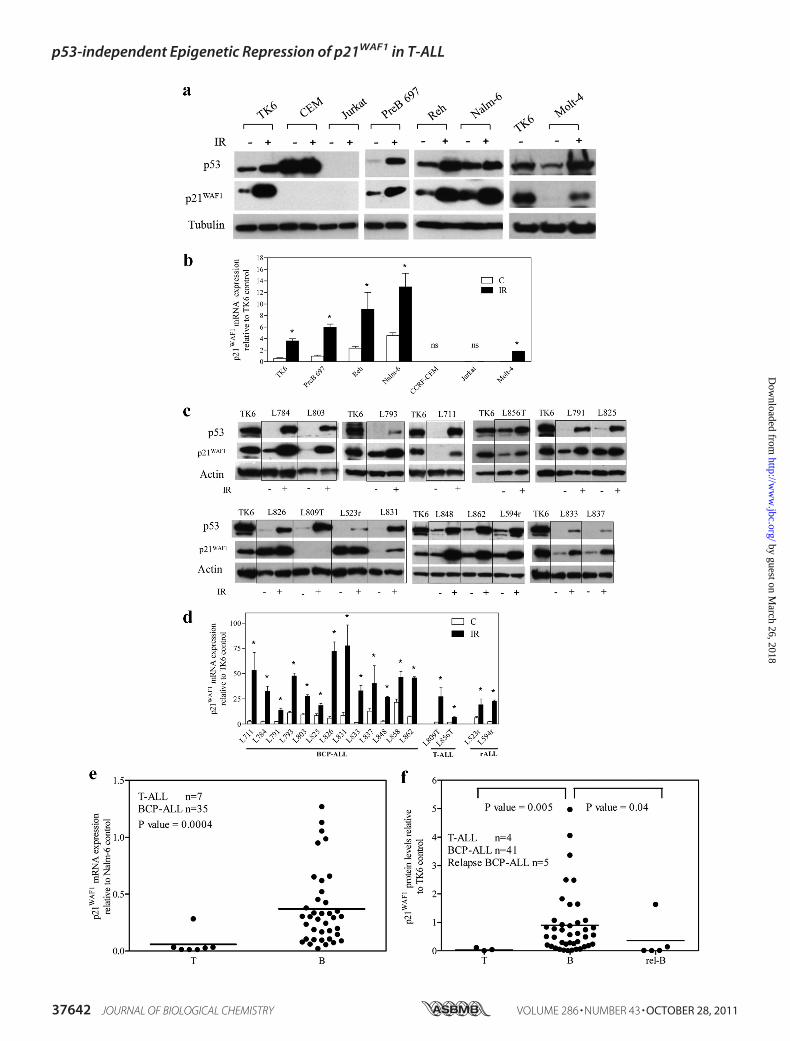
FIGURE 2. Defective induction after irradiation exposure and reduced basal expression of p21 WAF1 protein and mRNA in ALL cell lines and primarycells. ALL cell lines (a and b) or primary cells (c and d) were irradiated (IR) (3.5 cGy), and 6 h later expression of p53 or p21WAF1 proteins (a and c) and mRNA (band d) were assessed by immunoblot or RT-qPCR, respectively. a and c, a representative blot is shown from at least three independent experiments. c and d,primary T-ALL samples are suffixed with T and bone marrow relapse lysates suffixed with r. b and d, p21WAF1 mRNA expression was normalized to actin andexpressed relative to p21WAF1 expression in the untreated TK6 cell line. Results represent the mean � S.E. of three independent measurements. An asteriskrepresents a value significantly greater than control (C) (p � 0.05) as determined by paired t test, on log transformed data to equalize variance; ns, notsignificant. e, expression of p21WAF1 mRNA in primary ALL samples was analyzed by RT-qPCR and normalized to the corresponding EF-1� sample, and valueswere expressed as fold differences relative to p21WAF1 expression in Nalm-6 cells. f, p21WAF1 protein expression was assessed by immunoblot and normalizedto TK6 control cells. In e and f, each symbol represents the mean expression of a primary sample calculated from three individual experiments. Differencesbetween groups were compared using the Mann-Whitney U test. Bars represent the median.
p53-independent Epigenetic Repression of p21WAF1 in T-ALL
OCTOBER 28, 2011 • VOLUME 286 • NUMBER 43 JOURNAL OF BIOLOGICAL CHEMISTRY 37643
by guest on March 26, 2018
http://ww
w.jbc.org/
Dow
nloaded from

(5 �M). Only a minimal response in p21WAF1 mRNA inductionwas observed in T-ALL samples (Fig. 1f).The capacity of the ALL cells to induce p53 and p21 in
response to irradiation (6 h, 3.5 cGy) was also assessed. Irradi-ation-induced up-regulation of p53 and p21WAF1 mRNA andprotein reflected those seen with etoposide, with robust induc-tion in the BCP-ALL cell lines Reh and Nalm-6, very low levelinduction in Molt-4, and no apparent induction in Jurkat (Fig.2a & b). Consistent with the BCP-ALL panel, an additionalBCP-ALL cell line, Pre B-697 and the BCP lymphoblastoid cellline, TK6, showed induction of both p53 and p21WAF1 mRNAand protein to irradiation. In contrast, the p53 mutant T-ALLcell line, CEM, failed to induce p53 or p21WAF1. Irradiationinduced p53 protein and p21WAF1 mRNA and protein in BCP-ALL and T-ALL primary patient leukemic blasts, with theexception of one of the two T-ALL samples (L809T) (Fig. 2, cand d). In case L809T p21WAF1 protein was not induced despitep21WAF1 mRNA induction (Fig. 2c and supplemental Fig. S1, aand b). However, concurrent exposure of this T-ALL sample tothe proteasomal inhibitor MG132 (5 �M) and 3.5 cGy for 6 hresulted in p21WAF1 protein induction (supplemental Fig. S1c).To confirm that irradiation-induced apoptosis was not the rea-son for p21WAF1 protein degradation in L809T, the viability ofprimary cells after irradiation exposure was confirmed byannexinV/ethidiumbromide staining (supplemental Table S3).The results demonstrate that primary cells L711, L803, andL856, with similar or even greater levels of apoptosis as L809T6 h post-irradiation, induced p21WAF1 protein, suggesting thatloss of p21WAF1 protein induction in L809T was not due toincreased apoptosis in these cells.To examine whether low basal levels of p21WAF1 expression
in T-ALL xenografts and cell lines observed above was an arti-fact of xenografting or establishing cell lines, mRNA was ana-lyzed in independent (Australian) primary ALL samples by RT-qPCR. Basal p21WAF1 mRNA levels were significantly lower inT-ALL samples compared with BCP-ALL samples (p � 0.0004;Fig. 2e). Consistent with this finding, measurement of basallevels of p21WAF1 protein by immunoblotting in a separatecohort of ALL patients also showed significantly lower levels infour presentation T-ALL samples compared with 41 presenta-tion and five relapsed BCP-ALL samples (p � 0.005 and p �0.04 respectively, Fig. 2f and supplemental Fig. S2a). Theseresults indicate that in comparison to BCP-ALL samples,p21WAF1 expression is low in T-ALL primary samples, xeno-grafts, and cell lines. Basal p21WAF1 protein levels in 33 primaryBCP-ALL, as assessed by immunoblotting (supplemental Fig.S2a), showed no correlation with presenting white blood cell
FIGURE 3. Heat map of p53 target genes from RT-qPCR array in ALL xeno-grafts. BCP-ALL (ALL-3 and ALL-19) and T-ALL (ALL-8 and ALL-16) xenograftswere exposed to etoposide (5 �M for 3 h and 12 h) and RNA isolated. AnRT-qPCR array was conducted on 84 p53-target genes and log-transformeddata from individual replicates were visualized in heat map format. Each col-umn represents an individual replicate for the RT-qPCR array, and each rowrepresents a gene. Genes are listed in order of differential expression of induc-tion between BCP-ALL and T-ALL xenografts. Genes highlighted in blue aresignificantly up-regulated in BCP-ALL over T-ALL samples, whereas geneshighlighted in red are significantly up-regulated in T-ALL over BCP-ALLsamples.
p53-independent Epigenetic Repression of p21WAF1 in T-ALL
37644 JOURNAL OF BIOLOGICAL CHEMISTRY VOLUME 286 • NUMBER 43 • OCTOBER 28, 2011
by guest on March 26, 2018
http://ww
w.jbc.org/
Dow
nloaded from

p53-independent Epigenetic Repression of p21WAF1 in T-ALL
OCTOBER 28, 2011 • VOLUME 286 • NUMBER 43 JOURNAL OF BIOLOGICAL CHEMISTRY 37645
by guest on March 26, 2018
http://ww
w.jbc.org/
Dow
nloaded from

counts (p � 0.69, supplemental Fig. S2b) or blast count at day 8of induction therapy (p � 0.94, supplemental Fig. S2c).To assess the functionality of the p53 pathway in BCP or
T-ALL xenografts derived frompatients with diverse treatmentoutcomes (supplemental Table S1), two BCP-ALL (ALL-3, -19)and two T-ALL (ALL-8, -16) xenografts were exposed in vitroto etoposide and expression of 84 p53-regulated genes assessedrelative to control at 3 and 12 h by focused RT-qPCR array.Consistent with an intact p53 response, p53-regulated genessuch as Bax, GADD45�, and Hdm-2 were induced for at leastone time point for all samples (Fig. 3 and supplemental TableS4). In contrast, the T-ALL samples failed to show p21WAF1
(CDKN1A) induction despite robust induction in ALL-3 andALL-19. The data were analyzed using the GenePattern limmamodule in an unbiased fashion to compare differential geneexpression in BCP-ALL with T-ALL xenografts (supplementalTable S4). Of the 84 p53-target genes, 35 genes showed signif-icant differential expression between the lineages, with 10 sig-nificantly up-regulated genes in BCP-ALL samples and 25 sig-nificantly up-regulated genes in the T-ALL samples. Thesignificantly up-regulated genes in the BCP-ALL samples havefunctional roles in the negative regulation of cell cycle prolifer-ation (n � 3; BTG2, BAI, IL6), positive regulation of cell prolif-eration (n � 1; CDK4), cell cycle arrest (n � 1; p21WAF1), apo-ptosis (n � 2; FASLG,GML), and anti-apoptosis (n � 2;MCL1,RELA). Of the genes significantly up-regulated in T-ALL sam-ples, these have a functional role in apoptosis (n � 11; APAF1,BID, CASP2, E124, FADD, FOXO3, LRDD, PCBP4, P53AIP1,SIAH1, SIRT1), cell cycle regulation (n � 9; BRCA2, CCNG2,CDC25C, E2F1, E2F3, IFNB1, MSH2, PRC1, TADA3L), cellproliferation (n � 3;MDM4, PCAF, PPMID), cell growth (n �1,MYOD1), and also an anti-apoptotic function (n� 1; IGF1R).The p21WAF1 gene demonstrated the most significant differ-ence in expression between the two cell lineages (p � 1.285 �10�9).To confirm p53 functionality in different ALL lineages,
ALL-3, ALL-8, and Jurkat cells were exposed to etoposide (5�M) or theHdm-2 inhibitor, nutlin-3 (10�M), and p53 localiza-tion determined by subcellular fractionation and immunoblot-ting. Increases in p53 proteinwere observed in the nuclear frac-tions of ALL-3 and ALL-8 after etoposide and nutlin-3exposure, with a negligible increase in Jurkat cells (supplemen-tal Fig. S3), whereas cytoplasmic p21WAF1 levels only increasedin ALL-3 cells. To further confirm p53 functionality, the sensi-tivity of xenografts and cell lines to the death-inducing effects ofnutlin-3 was tested by methyl-thiazolyl-tetrazolium assay.Although all xenografts and Reh, Nalm-6, andMolt-4 cell linesexhibited IC50 values�10�M, the IC50 values of the p53mutantcell lines (CEM and Jurkat) were �100 �M (data not shown).Vorinostat Fails to Induce p21WAF1 Expression in T-ALL Cell
Lines and Xenografts—Vorinostat has been shown to inducep21WAF1 transcription independently of p53 function (44). This
drug was therefore utilized to determine whether defectivep21WAF1 induction in T-ALL cells was specific to p53-inducingagents. Nuclear localization of p53 was used as a marker of p53transcriptional activity in vorinostat- and etoposide-treatedcells. Vorinostat failed to cause increased nuclear localizationof p53 in either ALL-3 or ALL-19, which was in contrast to theresponse of these xenograft cells to etoposide (supplementalFig. S4, a and b). The ALL xenografts and cell lines were thenincubated with vorinostat (5 �M, 6 h), which resulted in a sig-nificant induction of p21WAF1, but not p53,mRNA, and proteinin BCP-ALL cells (Fig. 4a, upper panel, and b–d), and minimalinduction inT-ALL cells (Fig. 4, a, lower panel, and b–d). Theseresults reinforce that T-ALL cells exhibit p53-independenttranscriptional repression of the p21WAF1 gene.Epigenetic regulation of the p21WAF1 gene locus—To deter-
mine whether differential acetylation of histone tails couldexplain the decreased transcription of p21WAF1 in T-ALL cells,enrichment of acetylated H3K9 (H3K9Ac) was interrogatedover three regions of the p21WAF1 promoter in xenografts byChIP analysis (Fig. 5a). Decreased H3K9Ac enrichment wasevident in T-ALL xenografts (ALL-8 and ALL-16) relative tothe BCP-ALL xenografts (ALL-3, -11, and -19) over all threeregions (Fig. 5b), which was confirmed by ChIP-qPCR (supple-mental Fig. 5b). Moreover, exposure of xenograft cells to vori-nostat (5�M, 6 h) resulted in increasedH3K9Acwithin all threep21WAF1 promoter regions of the BCP-ALL xenografts, with aminimal increase in the T-ALL xenografts (supplemental Fig. 5,a and b). These results indicate a dominant mechanism ofp21WAF1 repression in T-ALL cells that is not relieved by inhi-bition of histone deacetylase activity.The p21WAF1 locus includes a CpG island spanning the pro-
moter region, transcription start site (TSS), exon 1, and intron 1(Fig. 5a). Methylation of the p21WAF1 CpG island was analyzedby SEQUENOM MassARRAY Epityper® after amplification oftwo PCRproducts, termed region 4 (�131 to97 bp in relationto the TSS) and region 5 (73 to 617 bp; Fig. 5a). Low CpGmethylation was observed across both regions in three BCP-ALL xenografts (ALL-2, ALL-3, ALL-19), and across region 4 insix T-ALL xenografts (ALL-8, ALL-16, ALL-27, ALL-29, ALL-30, and ALL-31) (Fig. 5c). In contrast, analysis of region 5revealed a close relationship between the level of CpG methy-lation and p21WAF1 expression. Methylation levels were lowacross region 5 in the p21WAF1 functional BCP-ALL xenografts,greatly increased at specific CpG sites in the T-ALL samplesthat lacked p21WAF1 (ALL-8, ALL-16) and moderatelyincreased at various CpG sites in the xenograft cells thatexpressed minimal p21WAF1 (ALL-27, ALL-29, ALL-30, ALL-31) (Fig. 5c).Reversal of p21WAF1 Methylation and Repression by Com-
bined Histone Deacetylase/Methyltransferase InhibitorTreatment—To testwhether the combination of vorinostat andthe methyltransferase inhibitor decitabine could reduce CpG
FIGURE 4. a, induction of p21WAF1 protein after exposure of ALL xenograft cells to vorinostat. ALL xenograft cells were exposed to vorinostat (5 �M, 6 h), andexpression of p53 or p21WAF1 proteins (a– c) and p21WAF1 mRNA (d) were assessed by immunoblot or RT-qPCR, respectively. a, representative blots of p53 andp21WAF1 proteins in BCP-ALL (upper panel) and T-ALL (lower panel) xenografts. Expression of p53 (b) and p21WAF1 (c) proteins were expressed relative to actin,and data from individual membranes were normalized to the MCF-7 control lane. An asterisk represents values significantly greater than control (p � 0.05) asdetermined by Mann-Whitney U test; ns, not significant. d, p21WAF1 mRNA expression was normalized to untreated Nalm-6 cells. All quantitative data areexpressed as the mean � S.E. from three separate experiments.
p53-independent Epigenetic Repression of p21WAF1 in T-ALL
37646 JOURNAL OF BIOLOGICAL CHEMISTRY VOLUME 286 • NUMBER 43 • OCTOBER 28, 2011
by guest on March 26, 2018
http://ww
w.jbc.org/
Dow
nloaded from

methylation in the p21WAF1 gene locus and reconstitutep21WAF1 expression, the p21WAF1-defective cell line Molt-4and the p21WAF1 functional Nalm-6 cell line were exposed toDMSO (vehicle control), vorinostat, decitabine, or the combi-
nation prior to CpG methylation quantification by SEQUE-NOM MassARRAY analysis (Fig. 5d). Increased basal levels ofmethylation at specific CpG sites within region 5 were detectedin Molt-4 cells (CpG 31–32, 43–45, 50–51, and 52–53) com-
p53-independent Epigenetic Repression of p21WAF1 in T-ALL
OCTOBER 28, 2011 • VOLUME 286 • NUMBER 43 JOURNAL OF BIOLOGICAL CHEMISTRY 37647
by guest on March 26, 2018
http://ww
w.jbc.org/
Dow
nloaded from

paredwithNalm-6 cells. Decitabine alone caused a reduction inCpG methylation in Molt-4 cells to levels observed in decit-abine-treated Nalm-6 cells, particularly at sites between 31 and53. Vorinostat alone also caused a decrease in CpGmethylationat specific sites (e.g. 31–32) in Molt-4 cells, although its effectswere more restricted compared with decitabine. The combina-tion of decitabine and vorinostat induced a greater decrease inCpG methylation levels in region 5 than either drug alone, tolevels similar to basal CpG methylation in Nalm-6 cells.Expression of p21WAF1 was evaluated after exposure to the
above epigenetic modifiers to determine whether the decreasein CpG methylation corresponded with p21WAF1 induction.Extended exposure of Molt-4 cells to vorinostat (500 nM, 96 h)failed to increase p21WAF1, whereas decitabine alone inducedmodest p21WAF1 expression (Fig. 5e). Vorinostat and decit-abine in combination increased p21WAF1 expression to agreater extent than either drug alone, consistent with theireffects on CpG methylation. The addition of etoposide for thelast 6 h of drug treatmentwith vorinostat and decitabine did notfurther increase p21WAF1 protein levels inMolt-4 cells, demon-strating that induction of p21WAF1 by DNA-damaging agentsand epigeneticmodifications are not additive. Both single drugsincreased p21WAF1 expression in Nalm-6 cells, although thecombination was not synergistic.
DISCUSSION
This work has shown that, in contrast to BCP-ALL, p53-independent epigenetic repression of p21WAF1 is prevalent inT-ALL cell lines, xenografts, and primary biopsy specimens,and is associated with reduced H3K9Ac in the p21WAF1 pro-moter and increased CpG methylation in the first intron/exonof the gene. Impaired p53 function can result in reduced sensi-tivity of tumor cells to chemotherapeutic drugs (45) and lead top21WAF1 repression. However, in this analysis, p53 functional-ity was confirmed by sequencing of the p53 coding region (34),induction and nuclear localization of p53 after exposure toDNA damaging agents, and robust induction of other p53 tar-get genes that were previously used to confirm wild type p53transcriptional activity after DNA damage, including Bax (5),GADD45� (46), andHdm-2 (47). Moreover, reduced basal lev-els of p21WAF1 mRNA and protein in T-ALL versus BCP-ALLwere demonstrated in independent cohorts of patients on sep-arate continents, which strengthens the validity of our observa-tions. The down-regulation of p21WAF1 has been previouslyhighlighted in T-ALL cell lines (18, 26, 48) and primary cells
(49), although a mechanistic explanation of this phenomenonhas yet to be presented.In this study, the mechanisms and modulation of epigenetic
p21WAF1 repression were explored. Vorinostat inducedp21WAF1 in BCP-ALL xenografts and cell lines independentlyof p53 activation, as demonstrated by the lack of p53 inductionin whole cell lysates and in nuclear fractions after drug expo-sure. However, it remains possible that vorinostat acetylateslysine residues on the p53 protein, leading to increased DNAbinding affinity without increasing protein expression (50).Vorinostat-mediated induction of p21WAF1 in a variety of celltypes has been comprehensively characterized by others. How-ever, the present study of ALL cells shows that p21WAF1 induc-tion following vorinostat treatment was a lineage specificresponse. Although T-ALL cells showed minimal induction ofp21WAF1, BCP-ALL cells exhibited robust induction ofp21WAF1 after vorinostat treatment. Together, these resultsstrongly suggest that p21WAF1 is inactivated by epigeneticmod-ification inT-ALL cells. The induction of p21WAF1 in the L809Tprimary T-ALL sample by the combination of the proteasomalinhibitor MG132 and irradiation highlights the possibility thatp21WAF1 may also be inhibited by enhanced degradationpathways.The epigenetic markers evaluated for the p21WAF1 locus in
this study included H3K9Ac and CpG methylation. Histonedeacetylation is necessary for stable gene silencing (22). Inabil-ity to induce p21WAF1 mRNA after vorinostat exposure corre-spondedwith decreasedH3K9Acwithin the p21WAF1promoterregion in ALL-8 and ALL-16. Although vorinostat induced anincrease in H3K9Ac enrichment across the promoter region inBCP-ALL xenografts, there were minimal changes in T-ALLxenografts, and among these, this did not result in p21WAF1
induction, indicating that histone acetylation alone did notexplain the complete lack of induction seen in T-ALL samples.Methylation of the CpG island in the p21WAF1 promoter
region was investigated as another mechanism of gene silenc-ing. There is currently no general consensus on the prevalenceand role of CpG methylation in cells with a silenced p21WAF1
gene. The majority of studies to date have been limited tofocused regions of the promoter region. To date, there has beenonly one report on themethylation status of theCpG island thattraverses the most proximal end of the promoter region, TSS,exon 1, and 5� region of intron 1 of the rat p21WAF1 gene. Forthis reason, only limited conclusions can be drawn on the roleof CpG methylation on p21WAF1 silencing in human cells. In
FIGURE 5. Decreased H3K9Ac and increased CpG methylation at the p21WAF1 locus of T-ALL cells. a, representation of the p21WAF1 genomic locus,illustrating a region spanning �4000 bp from the TSS to the first exon and intron of the p21WAF1 gene. The locations of three regions (1, 2, and 3) amplified byPCR for ChIP analysis are indicated, corresponding to between �2224 bp and 100 bp from the TSS. The TSS is indicated by an arrow at 1. Regions 4 and 5represent two areas of PCR amplification analyzed for CpG methylation. Region 4 spans from �131 to 97 bp relative to the TSS and contains 25 CpGdinucleotides. Region 5 spans from 73 to 617 bp with 53 CpG nucleotides in this region. b, semi-quantitative ChIP analysis of cells from two T-ALL (ALL-8 andALL-16) and three BCP-ALL xenografts (ALL-3, ALL-11, and ALL-19) for basal H3K9Ac in regions 1, 2, and 3. Mock samples were treated with IgG only. c and d, CpGmethylation at basal levels in nine xenografts (c) or in response to exposure of ALL cell lines to epigenetic modifiers (d) was analyzed by SEQUENOM Epityperassays, which calculates methylation at individual CpG sites across the p21WAF1 locus. Due to the limitations of MALDI-TOF MS to differentiate between CpGsites in close proximity and T-cleavage reactions producing fragments with more than one CpG site, some of the sites could not be resolved individually.Therefore, each colored box shown represents the methylation value for a cluster of CpG sites (e.g. CpG 2–7). Quantified methylation at each site is representedas a heat map ranging from purple (0%) to yellow (100%), with white boxes representing non-detected. In d, Molt-4 and Nalm-6 cells were treated with DMSOcontrol (C), decitabine (D; 500 nM for 96 h), vorinostat (V; 500 nM for 96 h), or a combination of both (DV). e, cells were treated as in d, and p21WAF1 protein levelswere assessed by immunoblotting. Molt-4 cells were also treated with the epigenetic modifying agents and etoposide (5 �M, for the last 6 h of 96 h drugexposure). MCF-7, positive control MCF-7 lysate run concurrently on each gel.
p53-independent Epigenetic Repression of p21WAF1 in T-ALL
37648 JOURNAL OF BIOLOGICAL CHEMISTRY VOLUME 286 • NUMBER 43 • OCTOBER 28, 2011
by guest on March 26, 2018
http://ww
w.jbc.org/
Dow
nloaded from

this study, quantitative methylation analysis was conductedacross thisCpG island.CpGhypermethylationwas not found inthe promoter region immediately upstream of the TSS in any ofthe ALL samples. However, increased methylation wasobserved at the 3� end of exon 1 and 5� region of intron 1 inT-ALL xenografts that silenced p21WAF1, as well as in theMolt-4 cell line. These results are in accord with a study ofsilencing in the rat p21WAF1 gene (28). Although many studiessuggest that methylation must occur in the promoter regionsfor a gene to be silenced, studies of theCDKN2B gene have alsoshown that hypermethylation of a CpG island in the 5� region,including exons and introns, correlateswith gene silencing (51).It was also reported that methylation of the 5�-untranslatedexon and first intron, but not with the promoter region per se,correlated with silencing of the ubiquitin 1 gene in the barleyplant (52). In a recent comprehensive study of methylation lev-els across 24,376 genes from genomic DNA derived from theM091 cell line,methylation downstreamofTSS, in the region ofthe first exon, was demonstrated to be more closely correlatedwith transcriptional silencing thanCpGmethylation in the pro-moter region of the gene (53).Methylation in CpG islands can repress gene expression by
providing a site formethyl binding proteins such asMeCP1 andMeCP2 to attach (54) or sterically interfere with the binding oftranscription factors. Although this study has demonstratedincreased methylation at sites that have not been previouslyshown as specific binding sites of transcription factors orenhancers, the precise mechanism of transcriptional inactiva-tion of p21WAF1 observed in T-ALL samples remainsspeculative.An important finding of the current study is that vorinostat
and decitabine acted synergistically to decrease methylation ina cluster of CpG sites across exon 1 and intron 1 of the p21WAF1
gene and to reactivate p21WAF1 in T-ALL cells. Overall, ourresults indicate divergent and lineage-dependent mechanismsby which the p21WAF1 gene is regulated and repressed in ALLcells. p21WAF1 reactivation in T-ALL cells by combined treat-mentwith histone deacetylase inhibitors andDNAdemethylat-ing drugs warrants further investigation as a means to specifi-cally modulate the anti-leukemic effects of chemotherapeuticdrugs.
Acknowledgments—We gratefully acknowledge the staff and patientsof the Centre for Children’s Cancer and BloodDisorders, Sydney Chil-dren’s Hospital, Australia, and the Royal Victoria Infirmary, New-castle, UK, for provision of primary ALL samples. Vorinostat wasgenerously provided by Merck, Sharpe and Dohme, Corp. and theNational Cancer Institute, National Institutes of Health. We thankDr. Nicola Brown for assistance with experimental methodology andDr. Vivek A. Bhadri for assistance with data analysis.
REFERENCES1. Pui, C. H., and Evans, W. E. (2006) N. Engl. J. Med. 354, 166–1782. Holleman, A., den Boer, M. L., Kazemier, K. M., Janka-Schaub, G. E., and
Pieters, R. (2003) Blood 102, 4541–45463. Brown, J. M., and Wouters, B. G. (1999) Cancer Res. 59, 1391–13994. Rokudai, S., Aikawa, Y., Tagata, Y., Tsuchida,N., Taya, Y., andKitabayashi,
I. (2009) J. Biol. Chem. 284, 237–244
5. Chipuk, J. E., Kuwana, T., Bouchier-Hayes, L., Droin, N. M., Newmeyer,D. D., Schuler, M., and Green, D. R. (2004) Science 303, 1010–1014
6. el-Deiry, W. S., Tokino, T., Velculescu, V. E., Levy, D. B., Parsons, R.,Trent, J. M., Lin, D., Mercer, W. E., Kinzler, K. W., and Vogelstein, B.(1993) Cell 75, 817–825
7. Wattel, E., Preudhomme, C., Hecquet, B., Vanrumbeke, M., Quesnel, B.,Dervite, I., Morel, P., and Fenaux, P. (1994) Blood 84, 3148–3157
8. Wada,M., Bartram, C. R., Nakamura, H., Hachiya,M., Chen, D. L., Boren-stein, J., Miller, C. W., Ludwig, L., Hansen-Hagge, T. E., Ludwig, W. D., etal. (1993) Blood 82, 3163–3169
9. Blau, O., Avigad, S., Stark, B., Kodman, Y., Luria, D., Cohen, I. J., andZaizov, R. (1997) Leuk. Res. 21, 721–729
10. Marks, D. I., Kurz, B. W., Link, M. P., Ng, E., Shuster, J. J., Lauer, S. J.,Brodsky, I., and Haines, D. S. (1996) Blood 87, 1155–1161
11. Peterson, L. F., Yan, M., and Zhang, D. E. (2007) Blood 109, 4392–439812. Jung, C., Motwani,M., Kortmansky, J., Sirotnak, F.M., She, Y., Gonen,M.,
Haimovitz-Friedman, A., and Schwartz, G. K. (2003) Clin. Cancer Res. 9,6052–6061
13. Mahyar-Roemer, M., and Roemer, K. (2001) Oncogene 20, 3387–339814. Javelaud, D., and Besancon, F. (2002) J. Biol. Chem. 277, 37949–3795415. Tian, H., Wittmack, E. K., and Jorgensen, T. J. (2000) Cancer Res. 60,
679–68416. Crescenzi, E., Palumbo, G., de Boer, J., and Brady, H. J. (2008)Clin. Cancer
Res. 14, 1877–188717. Lazzarini, R., Moretti, S., Orecchia, S., Betta, P. G., Procopio, A., and Cata-
lano, A. (2008) Clin. Cancer Res. 14, 5099–510718. Scott, S. A., Kimura, T., Dong, W. F., Ichinohasama, R., Bergen, S., Kervi-
che, A., Sheridan, D., and DeCoteau, J. F. (2004) Leuk. Res. 28, 1293–130119. Zhang, W., Kornblau, S. M., Kobayashi, T., Gambel, A., Claxton, D., and
Deisseroth, A. B. (1995) Clin. Cancer Res. 1, 1051–105720. Ivanovska, I., Ball, A. S., Diaz, R. L., Magnus, J. F., Kibukawa, M., Schelter,
J. M., Kobayashi, S. V., Lim, L., Burchard, J., Jackson, A. L., Linsley, P. S.,and Cleary, M. A. (2008)Mol. Cell Biol. 28, 2167–2174
21. Shiohara,M., el-Deiry,W. S.,Wada,M., Nakamaki, T., Takeuchi, S., Yang,R., Chen, D. L., Vogelstein, B., and Koeffler, H. P. (1994) Blood 84,3781–3784
22. Jaenisch, R., and Bird, A. (2003) Nat. Genet. 33, 245–25423. Ng, H. H., Zhang, Y., Hendrich, B., Johnson, C. A., Turner, B. M., Erdju-
ment-Bromage, H., Tempst, P., Reinberg, D., and Bird, A. (1999) Nat.Genet. 23, 58–61
24. Chen, B., He, L., Savell, V. H., Jenkins, J. J., and Parham, D. M. (2000)Cancer Res. 60, 3290–3298
25. Roman-Gomez, J., Castillejo, J. A., Jimenez, A., Gonzalez, M. G., Moreno,F., Rodriguez Mdel, C., Barrios, M., Maldonado, J., and Torres, A. (2002)Blood 99, 2291–2296
26. Watanabe, M., Nakahata, S., Hamasaki, M., Saito, Y., Kawano, Y., Hidaka,T., Yamashita, K., Umeki, K., Taki, T., Taniwaki, M., Okayama, A., andMorishita, K. (2010) J. Virol. 84, 6966–6977
27. Zhu, W. G., Srinivasan, K., Dai, Z., Duan, W., Druhan, L. J., Ding, H., Yee,L., Villalona-Calero, M. A., Plass, C., and Otterson, G. A. (2003)Mol. CellBiol. 23, 4056–4065
28. Allan, L. A., Duhig, T., Read, M., and Fried, M. (2000) Mol. Cell Biol. 20,1291–1298
29. Chim, C. S., Wong, A. S., and Kwong, Y. L. (2005) Am. J. Hematol. 80,282–287
30. Ying, J., Srivastava, G., Gao, Z., Zhang, X., Murray, P., Ambinder, R., andTao, Q. (2004) Blood 103, 743–746
31. Majid, S., Kikuno, N., Nelles, J., Noonan, E., Tanaka, Y., Kawamoto, K.,Hirata, H., Li, L. C., Zhao, H., Okino, S. T., Place, R. F., Pookot, D., andDahiya, R. (2008) Cancer Res. 68, 2736–2744
32. Shen, L., Kondo, Y., Issa, J. P., and Garcia-Manero, G. (2002) Blood 100,3432–3433; author reply 3433–3434
33. Shin, J. Y., Kim, H. S., Park, J., Park, J. B., and Lee, J. Y. (2000) Cancer Res.60, 262–265
34. Lock, R. B., Liem,N., Farnsworth,M. L.,Milross, C.G., Xue, C., Tajbakhsh,M.,Haber,M.,Norris,M.D.,Marshall, G.M., andRice, A.M. (2002)Blood99, 4100–4108
35. Irving, J., Jesson, J., Virgo, P., Case, M., Minto, L., Eyre, L., Noel, N., Jo-
p53-independent Epigenetic Repression of p21WAF1 in T-ALL
OCTOBER 28, 2011 • VOLUME 286 • NUMBER 43 JOURNAL OF BIOLOGICAL CHEMISTRY 37649
by guest on March 26, 2018
http://ww
w.jbc.org/
Dow
nloaded from

hansson, U., Macey, M., Knotts, L., Helliwell, M., Davies, P., Whitby, L.,Barnett, D., Hancock, J., Goulden, N., and Lawson, S. (2009) Haemato-logica 94, 870–874
36. Liem, N. L., Papa, R. A., Milross, C. G., Schmid, M. A., Tajbakhsh, M.,Choi, S., Ramirez, C. D., Rice, A.M., Haber,M., Norris,M. D.,MacKenzie,K. L., and Lock, R. B. (2004) Blood 103, 3905–3914
37. Bachmann, P. S., Gorman, R., Papa, R. A., Bardell, J. E., Ford, J., Kees, U. R.,Marshall, G. M., and Lock, R. B. (2007) Cancer Res. 67, 4482–4490
38. Smyth, G. K. (2004) Stat. Appl. Genet. Mol. Biol. 3, Article 3, DOI:10.2202/1544-6115.1027
39. Bachmann, P. S., Piazza, R. G., Janes, M. E., Wong, N. C., Davies, C.,Mogavero, A., Bhadri, V. A., Szymanska, B., Geninson, G., Magistroni, V.,Cazzaniga, G., Biondi, A., Miranda-Saavedra, D., Göttgens, B., Saffery, R.,Craig, J. M.,Marshall, G.M., Gambacorti-Passerini, C., Pimanda, J. E., andLock, R. B. (2010) Blood 116, 3013–3022
40. Kimura, A. P., Liebhaber, S. A., and Cooke, N. E. (2004)Mol. Endocrinol.18, 1018–1032
41. Ehrich, M., Nelson, M. R., Stanssens, P., Zabeau, M., Liloglou, T., Xinaria-nos, G., Cantor, C. R., Field, J. K., and van den Boom, D. (2005) Proc. Natl.Acad. Sci. U.S.A. 102, 15785–15790
42. Petitjean, A., Mathe, E., Kato, S., Ishioka, C., Tavtigian, S. V., Hainaut, P.,and Olivier, M. (2007) Hum. Mutat. 28, 622–629
43. Forbes, S. A., Bindal, N., Bamford, S., Cole, C., Kok, C. Y., Beare, D., Jia,M.,Shepherd, R., Leung, K., Menzies, A., Teague, J. W., Campbell, P. J., Strat-ton, M. R., and Futreal, P. A. (2011) Nucleic Acids Res. 39, D945–950
44. Richon,V.M., Sandhoff, T.W., Rifkind, R.A., andMarks, P. A. (2000)Proc.Natl. Acad. Sci. U.S.A. 97, 10014–10019
45. El-Deiry, W. S. (2003) Oncogene 22, 7486–749546. Hollander,M.C., Alamo, I., Jackman, J.,Wang,M.G.,McBride,O.W., and
Fornace, A. J., Jr. (1993) J. Biol. Chem. 268, 24385–2439347. Barak, Y., Juven, T.,Haffner, R., andOren,M. (1993)EMBO J.12, 461–46848. Min, D. J., Moskowitz, N. P., Brownstein, C., Lee, H., Horton, T. M., and
Carroll, W. L. (2006) Apoptosis 11, 1977–198649. Chang, P. Y., and Miyamoto, S. (2006)Mol. Cancer Res. 4, 101–11250. Gu, W., and Roeder, R. G. (1997) Cell 90, 595–60651. Merlo, A., Herman, J. G., Mao, L., Lee, D. J., Gabrielson, E., Burger, P. C.,
Baylin, S. B., and Sidransky, D. (1995) Nat. Med. 1, 686–69252. Meng, L., Bregitzer, P., Zhang, S., and Lemaux, P.G. (2003)PlantMol. Biol.
53, 327–34053. Brenet, F., Moh, M., Funk, P., Feierstein, E., Viale, A. J., Socci, N. D., and
Scandura, J. M. (2011) PLoS One 6, e1452454. Lewis, J. D., Meehan, R. R., Henzel, W. J., Maurer-Fogy, I., Jeppesen, P.,
Klein, F., and Bird, A. (1992) Cell 69, 905–914
p53-independent Epigenetic Repression of p21WAF1 in T-ALL
37650 JOURNAL OF BIOLOGICAL CHEMISTRY VOLUME 286 • NUMBER 43 • OCTOBER 28, 2011
by guest on March 26, 2018
http://ww
w.jbc.org/
Dow
nloaded from

Mackenzie, Andrew G. Hall and Richard B. LockCarwyn Davies, Linda A. Hogarth, Philipp A. Dietrich, Petra S. Bachmann, Karen L.
Lymphoblastic Leukemia Gene in T-cell AcuteWAF1p53-independent Epigenetic Repression of the p21
doi: 10.1074/jbc.M111.272336 originally published online September 7, 20112011, 286:37639-37650.J. Biol. Chem.
10.1074/jbc.M111.272336Access the most updated version of this article at doi:
Alerts:
When a correction for this article is posted•
When this article is cited•
to choose from all of JBC's e-mail alertsClick here
Supplemental material:
http://www.jbc.org/content/suppl/2011/09/07/M111.272336.DC1
http://www.jbc.org/content/286/43/37639.full.html#ref-list-1
This article cites 54 references, 34 of which can be accessed free at
by guest on March 26, 2018
http://ww
w.jbc.org/
Dow
nloaded from