p7: limiting factors in ecosystems - globe · globe® 2005 p7: limiting factors in ecosystems...
TRANSCRIPT

GLOBE® 2005 P7: Limiting Factors in Ecosystems Learning Activity - 1 Earth System Science
Ap
pen
dix
Welco
me
Intro
du
ction
Pro
toco
lsLearn
ing A
ctivities!
?P7: Limiting Factors in Ecosystems
PurposeTo understand that physical factors—temperature and precipitation—limit the growth of vegetative ecosystems
OverviewStudents correlate graphs of vegetation vigor with those of temperature and precipitation data for four diverse ecosystems to determine which climatic factor is limiting growth. These ecosystems range from near-equatorial to polar, and span both hemispheres. The activity begins with a class discussion in which data from two of the ecosystems are analyzed and then students work in small groups to analyze two others. They then come together again to discuss their findings with the class.
Student OutcomesAbility to use X-Y graph to analyze patterns in data
Understanding of relationships between visualizations and graphs
Ability to describe global limiting factors in ecosystem growth
Science ConceptsPhysical Sciences
Sun is a major source of energy for changes on the Earth’s surface.
Earth and Space SciencesWeather changes from day to day and
over the seasons.Seasons result from variations in solar
insolation resulting from the tilt of the Earth’s rotation axis.
The sun is the major source of energy at Earth’s surface.
Life SciencesOrganisms can only survive in
environments where their needs are met.
Earth has many different environments that support different combinations of organisms.
Organisms’ functions relate to their environment.
Organisms change the environment in which they live.
Humans can change natural environments.
Plants and animals have life cycles.Ecosystems demonstrate the
complementary nature of structure and function.
All organisms must be able to obtain and use resources while living in a constantly changing environment.
Sunlight is the major source of energy for ecosystems.
The number of animals, plants and microorganisms an ecosystem can support depends on the available resources.
Humans can change ecosystem balance.
Energy for life derives mainly from the sun.
Living systems require a continuous input of energy to maintain their chemical and physical organizations.
Scientific Inquiry AbilitiesAnalyzing graphs to find patterns and to
correlate variablesUsing evidence to support conclusionsDiscriminating among different factors
that can affect ecosystem growthPresenting material to a groupUse appropriate tools and techniques.Develop explanations and predictions
using evidence.Recognize and analyze alternative
explanations.Communicate results and explanations.

GLOBE® 2005 P7: Limiting Factors in Ecosystems Learning Activity - 2 Earth System Science
TimeTwo 45-minute class periods
LevelMiddle, Secondary
MaterialsOverhead projector and transparencies (4)
or color visualization pages
PreparationMake copies of the Work Sheets for all of the student groups.
PrerequisitesExperience working with visualizations. See Learning Activities, Learning to Use Visualizations: An Example with Elevation and Temperature and Draw Your Own Visualization, or the GLOBE Visualization Web Server.
Ability to read an X-Y graph
Familiarity with MUC land cover types
BackgroundThe influence of the environment on plant growth can be readily seen in gardens and houseplants. Many plants grow best in fertile, well-drained soil, while others have evolved to grow in more extreme soil conditions. Some plants are shade tolerant; others thrive under lots of daily sunlight. Gardens and houseplants represent small-scale ecosystems that we can influence by changing the environment. One of the features of an ecosystem is that its growth is limited under normal conditions by competition for resources within the system and by external factors such as environmental changes. If the presence or absence of a factor limits the growth of the ecosystem elements, it is called a limiting factor. There are several fundamental factors that limit ecosystem growth, including temperature, precipitation, sunlight, soil configuration, and soil nutrients.
Two readily observed limiting factors are temperature and precipitation. Scientists can measure, on the scale of very large regions of land, how these factors shape the kinds of ecosystems that exist in those regions. Global satellite measurements of vegetation vigor, or the amount of plant growth, can be compared against other factors to understand how climate factors limit vegetation growth.
It is easiest to understand how environmental factors influence vegetation growth by looking at ecosystems in very different geographical
regions. Near the northern polar region there is a flat, treeless zone of Dwarf-Shrubland land cover called tundra. (“Dwarf-shrubland” is the Level 1 Modified UNESCO Classification (MUC) term.) Tundra vegetation consists of low-growing shrubs, grasses, and mosses that can tolerate short growing seasons and permafrost. North of the Tropic of Cancer in the temperate zone there is a region characterized by conifers and broad-leaved trees. This area is the boreal (meaning cold temperate climate) zone of mainly Evergreen Forest (MUC 01). Elsewhere in the Northern Hemisphere temperate zone, we find grasslands containing grasses and grass-like plants, (MUC 41-43, Graminoid classification). Such grasslands also occur in the tropical zone and may grow with trees to form plant communities called wooded grassland or, in the MUC system, Graminoid with Trees.
Scientists are interested in the season when vegetation comes out of winter dormancy, grows, and reproduces, called the growing season. They are concerned, for example, that a lengthening of the growing season in the temperate and boreal zones could be an indication of global warming. In order to understand the growing season, scientists look at global changes in plant growth (green-up) and decline (green-down). Sensors on satellites can measure how much vegetation is covering parts of the Earth and scientists use this to determine vegetation vigor. Scientists look at changes in vegetation

GLOBE® 2005 P7: Limiting Factors in Ecosystems Learning Activity - 3 Earth System Science
Ap
pen
dix
Welco
me
Intro
du
ction
Pro
toco
lsLearn
ing A
ctivities
vigor to determine maximum green-up (when the vegetation starts to grow the most) and maximum green-down (when it stops growing the most). The growing season is the time from the start of maximum green-up to the start of maximum green-down. This activity will look at two factors in a variety of ecosystems that can limit green-up and green-down.
What To Do and How To Do It1. Conduct a class discussion to familiarize
students with the graphs and land cover visualization.
2. Facilitate small group work in which students solve problems using the graphs.
3. Facilitate a class discussion based on presentations from each group during which the class attempts to reach a consensus on the explanation of limiting factors.
Step 1. Class Discussion
Use a class discussion to orient students to the visualization and graphs. Each visualization (Figures EA-P7-1, EA-P7-2, and EA-P7-3) should be an overhead transparency or printout that students can share. Figure EA-P7-1 shows the geographic regions that will be studied in this activity, with the regions of interest shaded to make them stand out. Figures EA-P7-2 and EA-P7-3 each depict three graphs of one year of data of vegetation vigor, surface temperature, and precipitation for two regions: North American tundra and South Africa wooded grassland (a shorthand for “Graminoid with Trees,” the MUC term).
Start by introducing the geographic regions that will be studied, using Figure EA-P7-1. Follow this with an analysis of the graphs of vegetation vigor, temperature, and precipitation for one or two areas, marking values on the overhead to demonstrate how students will do the same on the Work Sheet. The class discussion will introduce students to the reasoning process they will use during the small group activities.
Vegetation Vigor of North American Tundra1. Figure EA-P7-2a shows a graph of
vegetation vigor for one year for the North American tundra. The world-wide range for vegetation vigor is between 0 and 0.65. To make sense of these values, present the following landmark values: rainforest has a value of about 0.50 year round, and desert has a value of about 0.08 year round. This tundra region varies from 0 to 0.20.
2. Focus on the changes for vegetation vigor throughout the year. Ask students to find (1) when it starts increasing, (2) when it peaks, (3) when it starts decreasing, and (4) when the largest increase and decrease occur. From January to April the tundra hardly grows at all. From April to August the vegetation vigor increases, and the largest increase is between June and July: this is called maximum green-up. The vegetation vigor peaks in August (maximum greenness), then decreases from August to November. The largest decrease is from September to October (maximum green-down). Overall, the decline occurs faster (over 2 months) than the increase (over 3 months).
3. Explain maximum green-up, maximum green-down, maximum greenness, and growing season and show them on the graph.
• For the tundra, maximum greenup occurs between June and July, and maximum green-down occurs between September and October.
• Students can confuse maximum green- up and green-down with maximum greenness, so be sure to explain the difference. Maximum greenness occurs in August.
• The growing season is the period from the start of maximum green-up (June) and ending with the start of maximum green-down (September). Mark it on the graph.

GLOBE® 2005 P7: Limiting Factors in Ecosystems Learning Activity - 4 Earth System Science
Vegetation Locations
Equator
�Wooded Grasslands
Boreal�Forest
�Grasslands
� � Tundra
Figure EA-P7-1: Limiting Factors in Ecosystems

GLOBE® 2005 P7: Limiting Factors in Ecosystems Learning Activity - 5 Earth System Science
�
Veg. Vigor
Surface Temperature
Veg. Vigor
Monthly Precipitation
JAN FEB MAR APR MAY JUN JUL AUG SEP OCT NOV DEC
0.05
0.10
0.15
0.20
0.25
0.30
0.35
0.40
0.45
-25
-20
-15
-10
-5
0
5
10
15
20
25
0.05
0.10
0.15
0.20
0.25
0.30
0.35
0.40
0.45
JAN FEB MAR APR MAY JUN JUL AUG SEP OCT NOV DEC
1
2
3
4
5
6
7
8
9
10
Figure EA-P7-2b: Vegetation Vigor vs. Surface Temperature Figure EA-P7-2c: Vegetation Vigor vs. Monthly Precipitation
JAN FEB MAR APR MAY JUN JUL AUG SEP OCT NOV DEC
0.05
0.10
0.15
0.20
0.25
0.30
0.35
0.40
0.45
ND
VI
�Figure EA-P7-2a: Vegetation Vigor
Veg. Vigor
�
�
Month
MonthMonth
ND
VI
ND
VI
Surface Tem
perature (C)
Monthly P
recipitation (cm)
North American Tundra
Figure EA-P7-2a, 2b, 2c

GLOBE® 2005 P7: Limiting Factors in Ecosystems Learning Activity - 6 Earth System Science
South African Wooded Grassland
Figure EA-P7-3a, 3b, 3c�
��Figure EA-P7-3a: Vegetation Vigor
Figure EA-P7-3b: Vegetation Vigor vs. Surface Temperature Figure EA-P7-3c: Vegetation Vigor vs. Monthly Precipitation
JAN FEB MAR APR MAY JUN JUL AUG SEP OCT NOV DEC
0.05
0.10
0.15
0.20
0.25
0.30
0.35
0.40
0.45
ND
VI
Surface Tem
perature (C)
-25
-20
-15
-10
-5
0
5
10
15
20
25
0.05
0.10
0.15
0.20
0.25
0.30
0.35
0.40
0.45
ND
VI
Monthly P
recipitation (cm)
JAN FEB MAR APR MAY JUN JUL AUG SEP OCT NOV DEC
2
4
6
8
10
12
14
16
18
JAN FEB MAR APR MAY JUN JUL AUG SEP OCT NOV DEC
0.05
0.10
0.15
0.20
0.25
0.30
0.35
0.40
0.45N
DVI
Veg. Vigor
SurfaceTemperature
Veg. Vigor
Monthly Precipitation
Veg. Vigor
Month
MonthMonth

GLOBE® 2005 P7: Limiting Factors in Ecosystems Learning Activity - 7 Earth System Science
Ap
pen
dix
Welco
me
Intro
du
ction
Pro
toco
lsLearn
ing A
ctivities
Limiting Factor for North American Tundra1. Understanding X-YY Graphs. Figure
EA-P7-2b shows a combined graph of vegetation vigor and surface temperature and Figure 2c shows vegetation vigor and precipitation. In order to make it easier to compare the overall shape of the curves, both data sets are shown on an X-YY graph. The vegetation vigor Y-axis is on the left and the axis for temperature or precipitation is on the right.
2. Reading the Graphs. To be sure they understand how to read the graph, ask students which lines correspond to vegetation vigor, surface temperature, and precipitation. For each line, ask students to identify the maximum and minimum values and to describe the overall shape. Students will be working with graphs that look like this in their Work Sheets.
3. Temperature. The growing season requires liquid water, so the potential growing season can be defined as the time when the surface temperature is above freezing. In this example, the surface temperature rises above freezing between May and June and falls below freezing between September and October so the potential growing season is May to October. Mark the potential growing season on the overhead.
4. Precipitation. Amount of rainfall also limits vegetation vigor. Use the graph to show when the maximum increase and decrease in monthly precipitation occur. For an ecosystem that is limited by precipitation, vegetation will grow the most when the total amount of rain in a month increases the most, and will decline when the rains cease. For the tundra, the maximum precipitation increase occurs between June and July, and the maximum decrease occurs between September and October. Mark these values on the overhead.
5. Limited by temperature. Ask students whether they think that the North American tundra ecosystem is limited
by temperature or precipitation. Ask students to explain their reasons and point out evidence from the graphs that support their decision. In this example, the vegetation vigor period shown on the graph more closely corresponds to the potential growing season based on temperature. The decline in vegetation vigor does not correspond to a change in precipitation. Connect the values from the graph to the ecosystem by talking about how the tundra grows: the one month delay between the change in temperature and the start of the growing season is likely due to the time needed for ground thaw.
South Africa Grassland with TreesFigures EA-P7-3a-3c show the same data for a region of wooded grassland in the Southern Hemisphere that is limited by precipitation.
1. Vegetation Vigor. Vegetation vigor for this region peaks in December and March, so these months have the maximum greenness values. Maximum green-up is between November and December, and maximum green-down is between April and May. This shows that the actual growing season is from November to April.
2. Temperature. The potential growing season covers almost the entire year because the temperature rarely dips below freezing.
3. Precipitation. The maximum increase in precipitation occurs between November and December, and the maximum decrease in precipitation occurs between March and April.
4. Limited by Precipitation. The evidence shows that growth in the South Africa wooded grassland ecosystem is limited by precipitation rather than by temperature. The temperature remains relatively constant and warm enough for the vegetation to thrive; yet the vegetation vigor shows large changes that match changes in precipitation.

GLOBE® 2005 P7: Limiting Factors in Ecosystems Learning Activity - 8 Earth System Science
Step 2. Group Problem-Solving
Students will analyze two different ecosystems in small groups, the North American Grassland (MUC Graminoid classification) and the Boreal Evergreen Forest. Use the visualization in Figure EA-P7-1 to show where these occur on Earth. Have students work in small groups to fill out the Work Sheets, determine which factor is limiting each ecosystem, and explain how they reached their conclusions. Instead of having each group analyze both ecosystems, you could assign half of the groups to analyze Boreal Evergreen Forest and the other half North American Grassland, and then have the groups present their results.
Step 3. Group Presentation
Bring students back together for a discussion of the results. Emphasize the important differences between the ecosystem dynamics of each region in terms of the limiting factors, and suggest other factors that might limit vigor for different regions. The GLOBE Earth as a System poster shows other factors. As students present their answers, watch for opportunities to encourage them to support their ideas with evidence from the graphs, what the graphs mean, and what they know about the ecosystems. Instead of focusing only on how they found the right answer, encourage students to think about the scientific meaning and to provide good evidence of why their answer is correct.
Further InvestigationsChart the limiting factors for your own ecosystem. Using the data that your school has collected as part of the atmosphere and phenology protocols, plot temperature, precipitation, and phenology data to decide whether growth in your local ecosystem is limited by temperature or precipitation, or by some other factor.
Another important limiting factor is light: both intensity and duration. You can explore how seasonal changes in light correspond to periods of high and low vegetation vigor on the graphs used in the Work Sheets by adding another line that indicates amount of daylight.
ResourcesUsing the spreadsheet option for the GLOBE Visualization Server, visualizations of land cover factors such as budburst may be analyzed in relationship to other variables such as temperature and soil moisture. Also, see the Match the Biome activity on the GLOBE Web Site (under News and Events). This activity asks students to connect climate diagrams showing temperature and precipitation with land cover types depicted in photographs.
Soil type (and the resulting moisture content) is also an important factor in plant growth and can act as a limiting factor in some ecosystems. The GLOBE Earth Systems Poster shows monthly values for soil moisture that can be compared to values for vegetation vigor on the same poster.
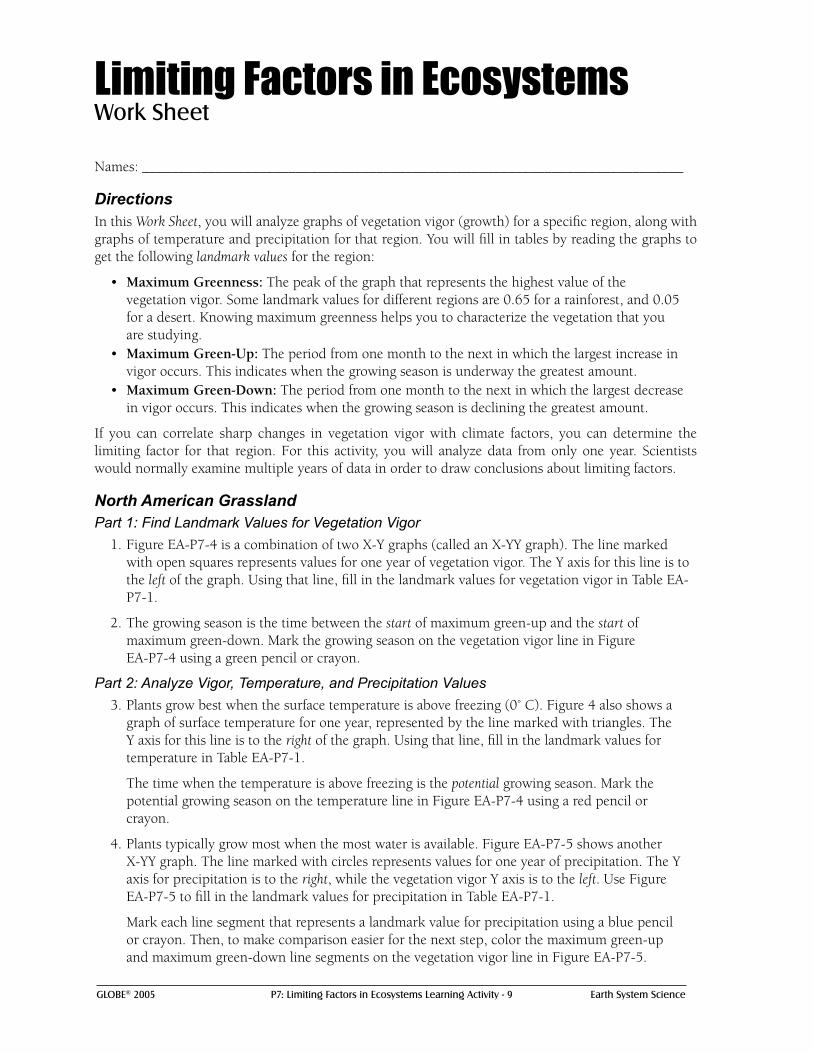
GLOBE® 2005 P7: Limiting Factors in Ecosystems Learning Activity - 9 Earth System Science
Limiting Factors in EcosystemsWork Sheet
Names: __________________________________________________________________________
DirectionsIn this Work Sheet, you will analyze graphs of vegetation vigor (growth) for a specific region, along with graphs of temperature and precipitation for that region. You will fill in tables by reading the graphs to get the following landmark values for the region:
• Maximum Greenness: The peak of the graph that represents the highest value of the vegetation vigor. Some landmark values for different regions are 0.65 for a rainforest, and 0.05 for a desert. Knowing maximum greenness helps you to characterize the vegetation that you are studying.
• Maximum Green-Up: The period from one month to the next in which the largest increase in vigor occurs. This indicates when the growing season is underway the greatest amount.
• Maximum Green-Down: The period from one month to the next in which the largest decrease in vigor occurs. This indicates when the growing season is declining the greatest amount.
If you can correlate sharp changes in vegetation vigor with climate factors, you can determine the limiting factor for that region. For this activity, you will analyze data from only one year. Scientists would normally examine multiple years of data in order to draw conclusions about limiting factors.
North American GrasslandPart 1: Find Landmark Values for Vegetation Vigor
1. Figure EA-P7-4 is a combination of two X-Y graphs (called an X-YY graph). The line marked with open squares represents values for one year of vegetation vigor. The Y axis for this line is to the left of the graph. Using that line, fill in the landmark values for vegetation vigor in Table EA-P7-1.
2. The growing season is the time between the start of maximum green-up and the start of maximum green-down. Mark the growing season on the vegetation vigor line in Figure EA-P7-4 using a green pencil or crayon.
Part 2: Analyze Vigor, Temperature, and Precipitation Values3. Plants grow best when the surface temperature is above freezing (0˚ C). Figure 4 also shows a
graph of surface temperature for one year, represented by the line marked with triangles. The Y axis for this line is to the right of the graph. Using that line, fill in the landmark values for temperature in Table EA-P7-1.
The time when the temperature is above freezing is the potential growing season. Mark the potential growing season on the temperature line in Figure EA-P7-4 using a red pencil or crayon.
4. Plants typically grow most when the most water is available. Figure EA-P7-5 shows another X-YY graph. The line marked with circles represents values for one year of precipitation. The Y axis for precipitation is to the right, while the vegetation vigor Y axis is to the left. Use Figure EA-P7-5 to fill in the landmark values for precipitation in Table EA-P7-1.
Mark each line segment that represents a landmark value for precipitation using a blue pencil or crayon. Then, to make comparison easier for the next step, color the maximum green-up and maximum green-down line segments on the vegetation vigor line in Figure EA-P7-5.
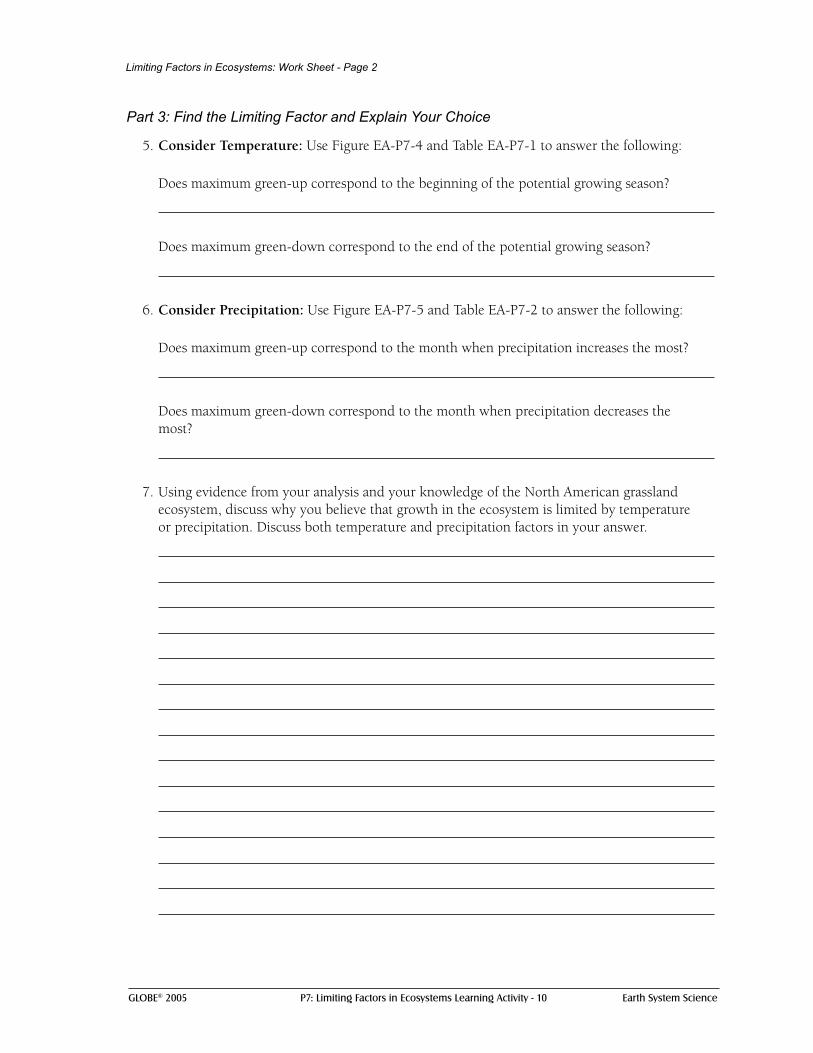
GLOBE® 2005 P7: Limiting Factors in Ecosystems Learning Activity - 10 Earth System Science
Part 3: Find the Limiting Factor and Explain Your Choice
5. Consider Temperature: Use Figure EA-P7-4 and Table EA-P7-1 to answer the following:
Does maximum green-up correspond to the beginning of the potential growing season?
Does maximum green-down correspond to the end of the potential growing season?
6. Consider Precipitation: Use Figure EA-P7-5 and Table EA-P7-2 to answer the following:
Does maximum green-up correspond to the month when precipitation increases the most?
Does maximum green-down correspond to the month when precipitation decreases the
most?
7. Using evidence from your analysis and your knowledge of the North American grassland
ecosystem, discuss why you believe that growth in the ecosystem is limited by temperature or precipitation. Discuss both temperature and precipitation factors in your answer.
Limiting Factors in Ecosystems: Work Sheet - Page 2

GLOBE® 2005 P7: Limiting Factors in Ecosystems Learning Activity - 11 Earth System Science
Figure EA-P7-4: Vegetation Vigor and Surface Temperature by Month
Limiting Factors in Ecosystems: Work Sheet - Page 3
Landmark Values for Vegetation Vigor
Maximum Greeness
Start Month End Month
Maximum Green-up
Maximum Green-Down
Landmark Values for Temperature Start Month End Month
Temperature Above 0˚
Landmark Values for Precipitation Start Month End Month
Maximum Increase in Rainfall
Maximum Decrease in Rainfall
Table EA-P7-1: Landmark Values for North American Grassland
North American Grasslands
Figure EA-P7-5: Vegetation Vigor and Precipitation by Month
�
0.05
-0.05
0.15
0.25
0.35
0.45
JAN FEB MAR APR MAY JUN JUL AUG SEP OCT NOV DEC-30
-20
-10
0
10
20
Veg
etat
ion
Vig
or
Sur
face
Tem
pera
ture
Vegetation Vigor Surface Temperature(C)�
0.05
-0.05
0.15
0.25
0.35
0.45
JAN FEB MAR APR MAY JUN JUL AUG SEP OCT NOV DEC0
2
4
6
8
10
Veg
etat
ion
Vig
or
Mon
thly
Pre
cipi
tatio
n
Vegetation Vigor Monthly Precipitation
GLOBE® 2005 P7: Limiting Factors in Ecosystems Learning Activity - 12 Earth System Science
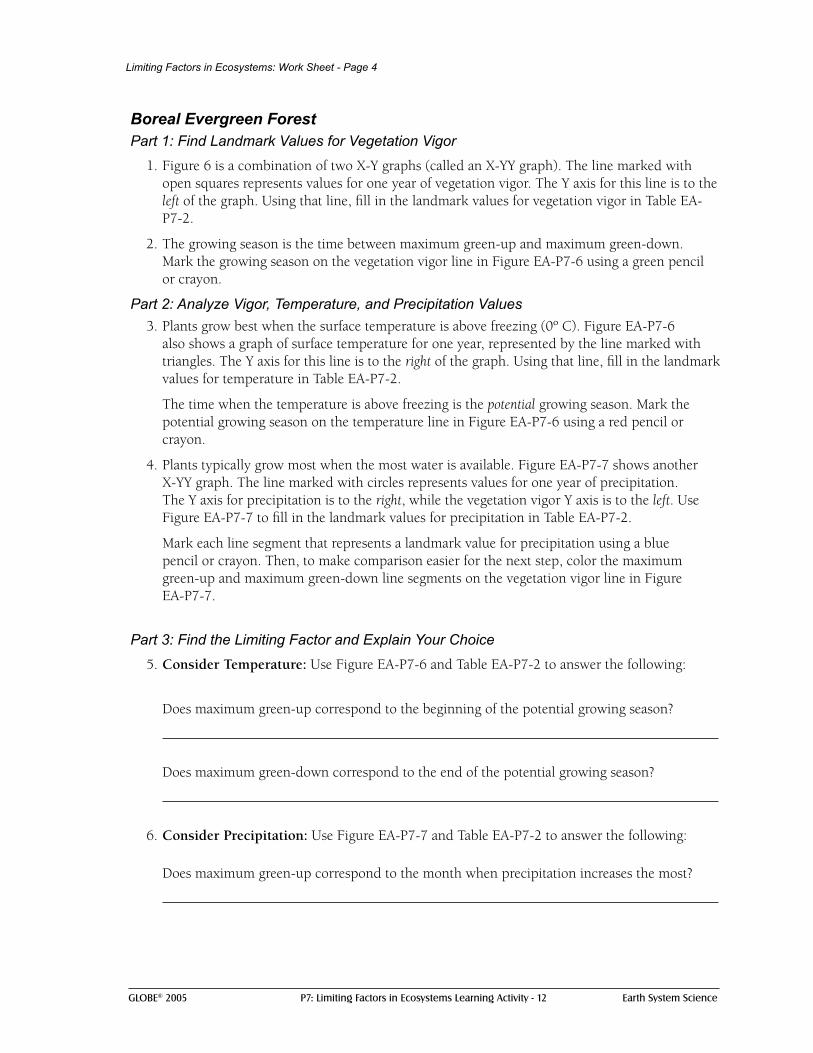
Boreal Evergreen Forest Part 1: Find Landmark Values for Vegetation Vigor
1. Figure 6 is a combination of two X-Y graphs (called an X-YY graph). The line marked with open squares represents values for one year of vegetation vigor. The Y axis for this line is to the left of the graph. Using that line, fill in the landmark values for vegetation vigor in Table EA-P7-2.
2. The growing season is the time between maximum green-up and maximum green-down. Mark the growing season on the vegetation vigor line in Figure EA-P7-6 using a green pencil or crayon.
Part 2: Analyze Vigor, Temperature, and Precipitation Values3. Plants grow best when the surface temperature is above freezing (0º C). Figure EA-P7-6
also shows a graph of surface temperature for one year, represented by the line marked with triangles. The Y axis for this line is to the right of the graph. Using that line, fill in the landmark values for temperature in Table EA-P7-2.
The time when the temperature is above freezing is the potential growing season. Mark the potential growing season on the temperature line in Figure EA-P7-6 using a red pencil or crayon.
4. Plants typically grow most when the most water is available. Figure EA-P7-7 shows another X-YY graph. The line marked with circles represents values for one year of precipitation. The Y axis for precipitation is to the right, while the vegetation vigor Y axis is to the left. Use Figure EA-P7-7 to fill in the landmark values for precipitation in Table EA-P7-2.
Mark each line segment that represents a landmark value for precipitation using a blue pencil or crayon. Then, to make comparison easier for the next step, color the maximum green-up and maximum green-down line segments on the vegetation vigor line in Figure EA-P7-7.
Part 3: Find the Limiting Factor and Explain Your Choice
5. Consider Temperature: Use Figure EA-P7-6 and Table EA-P7-2 to answer the following:
Does maximum green-up correspond to the beginning of the potential growing season?
Does maximum green-down correspond to the end of the potential growing season?
6. Consider Precipitation: Use Figure EA-P7-7 and Table EA-P7-2 to answer the following:
Does maximum green-up correspond to the month when precipitation increases the most?
Limiting Factors in Ecosystems: Work Sheet - Page 4

GLOBE® 2005 P7: Limiting Factors in Ecosystems Learning Activity - 13 Earth System Science
Does maximum green-down correspond to the month when precipitation decreases the most?
7. Using evidence from your analysis and your knowledge of the boreal evergreen forest
ecosystem, discuss why you believe that growth in the ecosystem is limited by temperature or precipitation. Discuss both temperature and precipitation factors in your answer.
Limiting Factors in Ecosystems: Work Sheet - Page 5

GLOBE® 2005 P7: Limiting Factors in Ecosystems Learning Activity - 14 Earth System Science
Landmark Values for Vegetation Vigor
Maximum Greeness
Start Month End Month
Maximum Green-up
Maximum Green-Down
Landmark Values for Temperature Start Month End Month
Temperature Above 0˚
Landmark Values for Precipitation Start Month End Month
Maximum Increase in Rainfall
Maximum Decrease in Rainfall
Table EA-P7-2: Landmark Values for Boreal Ever
Figure EA-P7-6: Vegetation Vigor and Surface Temperature by Month
Boreal Evergreen Forest
Figure EA-P7-7: Vegetation Vigor and Precipitation by Month
Limiting Factors in Ecosystems: Work Sheet - Page 6
�
0.05
-0.05
0.15
0.25
0.35
0.45
JAN FEB MAR APR MAY JUN JUL AUG SEP OCT NOV DEC-30
-20
-10
0
10
20
Veg
etat
ion
Vig
or
Sur
face
Tem
pera
ture
Vegetation Vigor Surface Temperature (C)�
0.1
0
0.2
0.3
0.4
0.5
JAN FEB MAR APR MAY JUN JUL AUG SEP OCT NOV DEC-1
1
3
5
7
9
11
Veg
etat
ion
Vig
or
Mon
thly
Pre
cipi
tatio
n
Vegetation Vigor Monthly Precipitation

GLOBE® 2005 P7: Limiting Factors in Ecosystems Learning Activity - 15 Earth System Science
Limiting Factors in EcosystemsRubric
For each criterion, evaluate student work using the following score levels and standards.
3 = Shows clear evidence of achieving or exceeding desired performance
2 = Mainly achieves desired performance
1 = Achieves some parts of the performance, but needs improvement
0 = Answer is blank, entirely arbitrary or inappropriate
North American GrasslandPart 1: Landmark Values for Vegetation Vigor
1. Maximum Greenness (Table EA-P7-1)
Score Level Description
3 Student identifies June as the month of maximum greenness.
1 Student answers some other month indicating that he/she became confused about the definitions.
0 Answer left blank or is arbitrary.
Maximum Green-Up (Table EA-P7-1)
Score Level Description
3 Student identifies the start month as April and the end month as May.
1 Student confuses the definition with that of maximum green-up, or student fills in only the correct start month or end month, or start and end months are not consecutive.
0 Answer left blank or is arbitrary.
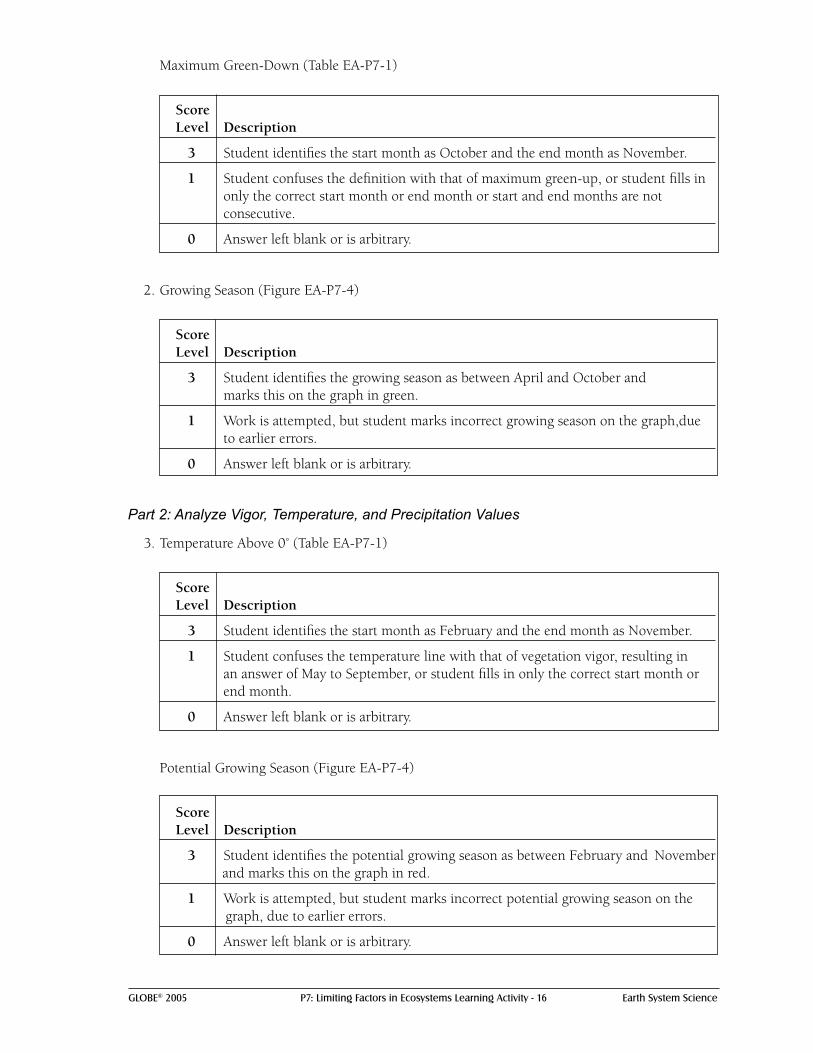
GLOBE® 2005 P7: Limiting Factors in Ecosystems Learning Activity - 16 Earth System Science
Maximum Green-Down (Table EA-P7-1)
Score Level Description
3 Student identifies the start month as October and the end month as November.
1 Student confuses the definition with that of maximum green-up, or student fills in only the correct start month or end month or start and end months are not consecutive.
0 Answer left blank or is arbitrary.
2. Growing Season (Figure EA-P7-4)
Score Level Description
3 Student identifies the growing season as between April and October and marks this on the graph in green.
1 Work is attempted, but student marks incorrect growing season on the graph,due to earlier errors.
0 Answer left blank or is arbitrary.
Part 2: Analyze Vigor, Temperature, and Precipitation Values
3. Temperature Above 0˚ (Table EA-P7-1)
Score Level Description
3 Student identifies the start month as February and the end month as November.
1 Student confuses the temperature line with that of vegetation vigor, resulting in an answer of May to September, or student fills in only the correct start month or end month.
0 Answer left blank or is arbitrary.
Potential Growing Season (Figure EA-P7-4)
Score Level Description
3 Student identifies the potential growing season as between February and November and marks this on the graph in red.
1 Work is attempted, but student marks incorrect potential growing season on the graph, due to earlier errors.
0 Answer left blank or is arbitrary.

GLOBE® 2005 P7: Limiting Factors in Ecosystems Learning Activity - 17 Earth System Science
4. Rainfall (Table EA-P7-1)
Score Level Description
3 Student identifies the months with the maximum increase as April to May, and the months with the maximum decrease as September to October.
1 Student confuses the precipitation line with that of vegetation vigor, or student only marks the first month of the change (such as April) or the months marked are not consecutive.
0 Answer left blank or is arbitrary.
Rainfall (Figure EA-P7-5)
Score Level Description
3 Student marks the line segment between April and May, and the one between September and October.
1 Student marks the entire period between April and October, or student marks lines incorrectly based on earlier errors.
0 Answer left blank or is arbitrary.
Maximum Green-Up and Green-Down (Figure EA-P7-5)
Score Level Description
3 Student marks the line segment between April and May, and the one between October and November.
1 Student marks the entire period between April and October, or student marks lines incorrectly based on earlier errors.
0 Answer left blank or is arbitrary.

GLOBE® 2005 P7: Limiting Factors in Ecosystems Learning Activity - 18 Earth System Science
Part 3: Find the Limiting Factor and Explain Your Choice
5. Consider Temperature
Score Level Description
3 The student offers a negative answer for these two temperature-related questions.
1 The student answers incorrectly based on previous errors.
0 Answer left blank or is arbitrary.
6. Consider Precipitation
Score Level Description
3 The student offers a positive answer for these two precipitation-related questions.
1 The student answers incorrectly based on previous errors.
0 Answer left blank or is arbitrary.
7. Limiting Factors
Score Level Description
3 Student answers “precipitation” and an explanation that stresses the following points: The periods of maximum green-up and green-down fall well within the potential growing season as defined by the temperature curve, so temperature cannot be the cause. The periods of maximum green-up and green-down correspond to the periods of maximum increase and decrease in the precipitation curve, so precipitation is the cause.
2 Student answers “precipitation” and an explanation is present but insufficient, offering minimal evidence or logical argument.
1 Either answer is given but with no rationale.
0 No answer given or an answer other than temperature or precipitation.

GLOBE® 2005 P7: Limiting Factors in Ecosystems Learning Activity - 19 Earth System Science
Boreal Evergreen ForestPart 1: Find Landmark Values for Vegetation Vigor
1. Maximum Greenness (Table EA-P7-2)
Score Level Description
3 Student identifies July as the month of maximum greenness.
1 Student answers some other month indicating that he/she became confused about the definitions.
0 Answer left blank or is arbitrary.
Maximum Green-Up (Table EA-P7-2)
Score Level Description
3 Student identifies the start month as April and the end month as May.
1 Student confuses the definition with that of maximum green-down, or student fills in only the correct start month or end month, or start and end months are not consecutive.
0 Answer left blank or is arbitrary.
Maximum Green-Down (Table EA-P7-2)
Score Level Description
3 Student identifies the start month as October and the end month as November.
1 Student confuses the definition with that of maximum green-up, or student fills in only the correct start month or end month or start and end months are not consecutive.
0 Answer left blank or is arbitrary.
2. Growing Season (Figure EA-P7-6)
Score Level Description
3 Student identifies the growing season as between April and October and marks this on the graph.
1 Work is attempted, but student marks incorrect growing season on the graph, due to earlier errors.
0 Answer left blank or is arbitrary.

GLOBE® 2005 P7: Limiting Factors in Ecosystems Learning Activity - 20 Earth System Science
Part 2: Analyze Vigor, Temperature, and Precipitation Values
3. Temperature above 0º (Table EA-P7-2)
Score Level Description
3 Student identifies the start month as May and the end month as October.
1 Student confuses the temperature line with that of vegetation vigor, resulting in an answer of some other month, or student fills in only the correct start month or end month.
0 Answer left blank or is arbitrary.
Potential Growing Season (Figure EA-P7-6)
Score Level Description
3 Student identifies the potential growing season as between May and October and marks this on the graph.
1 Work is attempted, but student marks incorrect potential growing season on the graph, due to earlier errors.
0 Answer left blank or is arbitrary.
4. Rainfall (Table EA-P7-2)
Score Level Description
3 Student identifies the months with the greatest increase as May to June, and the months with the greatest decrease as August to September.
1 Student confuses the precipitation line with that of vegetation vigor, or student only marks the first month of the change (such as May) or the months marked are not consecutive.
0 Answer left blank or is arbitrary.

GLOBE® 2005 P7: Limiting Factors in Ecosystems Learning Activity - 21 Earth System Science
Rainfall (Figure EA-P7-7)
Score Level Description
3 Student marks the line segment between May and June, and the one between August and September.
1 Student marks the entire period between May and September, or student marks lines incorrectly based on earlier errors.
0 Answer left blank or is arbitrary.
Maximum Green-Up and Green-Down (Figure EA-P7-7)
Score Level Description
3 Student marks the line segment between April and May, and the one between October and November.
1 Student marks the entire period between April and November, or student marks lines incorrectly based on earlier errors.
0 Answer left blank or is arbitrary.
Part 3: Find the Limiting Factor and Explain Your Choice
5. Consider Temperature
Score Level Description
3 The student offers a positive answer for these two temperature-related questions.
1 The student answers incorrectly based on previous errors.
0 Answer left blank or is arbitrary.
6. Consider Precipitation
Score Level Description
3 The student offers a negative answer for these two precipitation-related questions.
1 The student answers incorrectly based on previous errors.
0 Answer left blank or is arbitrary.

GLOBE® 2005 P7: Limiting Factors in Ecosystems Learning Activity - 22 Earth System Science
7. Limiting Factors
Score Level Description
3 Student answers “temperature” and an explanation that stresses the following points: The periods of maximum green-up and green-down correspond directly to the potential growing season as defined by the temperature curve. The periods of maximum green-up and green-down do not directly correspond to the periods of maximum increase and decrease in the precipitation curve.
2 Student answers “temperature” and an explanation is present but insufficient, offering minimal evidence or logical argument.
1 Either answer is given but with no rationale.
0 No answer given or an answer other than temperature or precipitation.