paat technical and scientific series 11
TRANSCRIPT

ISSN 1020-7163
PAATTECHNICAL
ANDSCIENTIFIC
SERIES
11
Intervening againstbovine trypanosomosisin eastern Africa:mapping the costs and benefits
PAAT INFORMATION SERVICE PUBLICATIONS
Eastern Africa’s livestock keepers face many challenges, not least the widespread prevalence of endemic diseases which both undermine animals’ productivity and increase livestock mortality. Tsetse-transmitted trypanosomosis causes significant economic losses, in particular in cattle. This study analyses these losses in a spatially explicit framework for the six tsetse-infested countries of the Intergovernmental Authority on Development (IGAD) region: Ethiopia, Kenya, Somalia, South Sudan, Sudan and Uganda. The cattle production systems of the region are diverse, ranging from pastoralism to agropastoralist and mixed crop-livestock farming. Some areas make extensive use of draught cattle or of high yielding crossbred dairy cows. Based on these features, twelve cattle production systems in the region were characterized and mapped. In these systems, the potential incomes from cattle production were modeled for a situation with and without trypanosomosis; the models looked at mortality, fertility, other productivity parameters and cattle population growth and expansion. The results of the analysis were used to generate a map of the potential benefits of controlling the disease. Estimates were then made of the costs of tsetse and trypanosomosis control using a range of techniques, namely: trypanocidal drugs; control or localized elimination of tsetse flies using insecticide-treated cattle or targets, aerial spraying and the sterile insect technique. The mapped potential benefits and mapped estimated costs were combined in order to produce a series of benefit-cost maps which illustrate what techniques are likely to be the most economically attractive in different areas of the study region. The suite of tools and economic analyses documented in this paper provide essential information to decision makers for comparing and prioritizing interventions in the region.
Interven
ing
again
st bo
vine tryp
ano
som
osis in
eastern A
frica: map
pin
g th
e costs an
d b
enefi
tsFA
O

FOOD AND AGRICULTURE ORGANIZATION OF THE UNITED NATIONSRome, 2017
ISSN 1020-7163
PAATTECHNICAL
ANDSCIENTIFIC
SERIES
11
Intervening againstbovine trypanosomosisin eastern Africa:mapping the costs and benefits
Alexandra ShawWilliam WintGiuliano CecchiStephen TorrCharles WaiswaTemesgen AlemuMichael EregaeAbdullatif AbdiSolomon MuchinaSamuel MugasiRaffaele MattioliandTimothy Robinson
The designations employed and the presentation of material in this information product do not imply the expression of any opinion whatsoever on the part of the Food and Agriculture Organization of the United Nations (FAO) concerning the legal or development status of any country, territory, city or area or of its authorities, or concerning the delimitation of its frontiers or boundaries. The mention of specific companies or products of manufacturers, whether or not these have been patented, does not imply that these have been endorsed or recommended by FAO in preference to others of a similar nature that are not mentioned.
The designations employed and the presentation of material in the map(s) do not imply the expression of any opinion whatsoever on the part of FAO concerning the legal or constitutional status of any country, territory or sea area, or concerning the delimitation of frontiers.
The views expressed in this information product are those of the author(s) and do not necessarily reflect the views or policies of FAO.
ISBN 978-92-5-109781-6
© FAO, 2017
FAO encourages the use, reproduction and dissemination of material in this information product. Except where otherwise indicated, material may be copied, downloaded and printed for private study, research and teaching purposes, or for use in non-commercial products or services, provided that appropriate acknowledgement of FAO as the source and copyright holder is given and that FAO’s endorsement of users’ views, products or services is not implied in any way.
All requests for translation and adaptation rights, and for resale and other commercial use rights should be made via www.fao.org/contact-us/licence-request or addressed to [email protected].
FAO information products are available on the FAO website (www.fao.org/publications) and can be purchased through [email protected]

Contents
Authors vAcknowledgements viiAcronyms ixExecutive summary xi
Chapter 1INTRODUCTION 1
Background 1
Methodology 3
Data and information collection 5
The geographic distribution of tsetse flies and cattle 7
Chapter 2MAPPING CATTLE PRODUCTION SYSTEMS 9
Defining and mapping livestock production systems 9
Defining and mapping cattle production systems 13
Chapter 3ChARACTERIzING CATTLE PRODUCTION SYSTEMS 21
Prices and production parameters 21
The productivity of work oxen 23
The productivity of smallholder grade dairy cattle 26
Chapter 4IDENTIfYING ThE bENEfITS 29
The impact of trypanosomosis on productivity 29
Structure of the herd models and economic methodology 31
Assumptions used in the herd models 33
Herd model results 36
Chapter 5MAPPING LIvESTOCk POPULATION SPREAD 39
Approach 39
Mapping maximum stocking rates 39
The spread model 42
iv
Chapter 6MAPPING ThE bENEfITS 47
The benefit map 47
Interpreting the benefit map 50
Chapter 7fACTORING IN ThE COSTS 53
Options for intervention 54
Estimating the costs of intervening 59
Chapter 8MAPPING bENEfIT-COST RATIOS 65
Adjusting costs and benefits for mapping 65
The continuous control scenario maps 66
The elimination scenario maps 67
Exploring changes in assumptions – some sensitivity analyses 73
Interpreting the benefit-cost maps 76
Chapter 9CONCLUSIONS 79
The maps as decision support 79
Informing the what, where and how of interventions 80
against tsetse and trypanosomosis
Looking to the future 85
REfERENCES 89

v
Authors
Alexandra Shaw is an economist who has worked extensively on the problem of tsetse and trypanosomosis in Africa. She and a group of colleagues developed the concept of ‘mapping the benefits’ and tested it in West Africa. She is currently working on the economic aspects of the interface between livestock and human health: the zoonotic diseases.
William Wint is a spatial analyst, working for the Environmental Research Group Oxford. He has been working with the Food and Agriculture Organization of the United Nations (FAO) for a number of years to produce much of the data that underlie the mapping the benefits work, most notably the livestock and vector distributions.
Giuliano Cecchi is an environmental engineer and a specialist in Geographic Information Systems. Since 2005, he has been working for FAO, particularly within the Programme Against African Trypanosomosis (PAAT). He is currently based in Addis Ababa, Ethiopia, at the FAO Subregional Office for Eastern Africa.
Steve Torr is a vector biologist with more than 30 years’ experience of field-based research on tsetse biology and control in western, central, southern and eastern Africa. Within the Intergovernmental Authority on Development (IGAD) region, he has made important contributions to tsetse research and control projects in Ethiopia, Kenya, Somalia and Uganda. He is a Professor of Neglected Tropical Diseases at the Liverpool School of Tropical Medicine, UK.
Charles Waiswa is a veterinarian who has worked widely in the area of parasitology and epidemiology of zoonotic diseases, both in academia at Makerere University, where his focus was on training veterinarians and scientists in the area of veterinary clinical medicine, parasitology and epidemiology, and with the private sector on tsetse control activities. Currently, he is Executive Director of the Coordinating Office for Control of Trypanosomiasis in Uganda (COCTU).
Temesgen Alemu is a veterinarian who has specialized in the impact of tsetse-transmitted trypanosomosis in Ethiopia. He has been working for 30 years with the Ministry of Agriculture and Ministry of Science and Technology in Ethiopia as Research Officer and National Coordinator on programmes and projects related to tsetse and trypanosomosis control/eradication financed by international organizations and donor agencies.
Michael Eregae is a veterinarian who has worked in pastoral areas of Kenya, Somalia and Sudan with the Government of Kenya and non-governmental organizations in the area of livestock development. He has a PhD degree in veterinary epidemiology from the University of Guelph in Ontario, Canada. He currently works as a Project Epidemiologist for the European Union-funded Project for Reinforcing Animal Health Services in Somalia.

vi
Abdullatif Abdi is a veterinary scientist and livestock consultant working on trade and marketing throughout eastern Africa, towards the Middle East and beyond, currently involved in livelihood programmes and livestock policy and legislation. He has been Somali National Coordinator, both for the Pan African Control of Epizootics (PACE)and the IGAD Drought Disaster Resilience Sustainability Initiative. He has lectured at the Somali National University and managed emergency relief and rehabilitation activities in Somalia.
Solomon Muchina Munyua is Director of the IGAD Centre for Pastoral Areas and Livestock Development (ICPALD), which he was tasked with setting up in 2011. He has lectured on animal science and veterinary medicine at the University of Nairobi. His focus has been on livelihood support and institution-building/strengthening in pastoralist areas of the IGAD region, in particular working for the African Union Inter-African Bureau for Animal Resources (AU-IBAR), the European Union (EU) and the World Bank in South Sudan and for FAO Somalia.
Samuel Mugasi is an agricultural economist who has worked extensively on livestock related research and has also worked on the tsetse and trypanosomosis problem in Uganda. He is currently Executive Director of the National Agricultural Advisory Services (NAADS) in Uganda and has also lectured in the Department of Agricultural Economics and Agribusiness at Makerere University, Kampala.
Raffaele Mattioli began working on tsetse and trypanosomosis in West Africa in 1984 as a veterinary epidemiologist with an FAO regional project, and subsequently with theInternational Livestock Research Institute (ILRI) and the International TrypanotoleranceCentre. Since 2000, he has been based at FAO in Rome. He is now in charge of PAAT, disease ecology (mainly vector-borne diseases) and Livestock and Gender.
Timothy Robinson is currently a Livestock Policy Officer, having returned to FAO after four years with the International Livestock Research Institute. Within the Livestock Information, Sector Analysis and Policy Branch he is responsible for developing livestock information systems and exploring opportunities to increase the sustainability of the global livestock sector. He has more than 25 years’ experience working in the field of spatial analysis in relation to agriculture, food security and poverty alleviation.

vii
Acknowledgements
This work was carried out by the PPLPI, IGAD LPI and PAAT (please refer to the list of acronyms). Funding under the PPLPI programmes was provided by the European Commission (EC grant: GCP/INT/963/EC) and the UK Department for International Development (DFID – grant: GCP/INT/804/UK). Under PAAT, funding was provided by the International Fund for Agricultural Development (IFAD – grants GCP/RAF/403/IFA: Strengthening the Information System of PAAT, GCP/RAF/442/IFA: Pro-poor Integrated Packages to Enhance Policy and Decision Making against the African Animal Disease Burden in sub-Saharan Africa) and by the Government of Italy (Improving Food Security in sub-Saharan Africa by Supporting the Progressive Reduction of Tsetse-transmitted Trypanosomosis in the Framework of the NEPAD - GTFS/RAF/474/ITA and GCP/RAF/502/ITA).
The support of PAAT, the DFID Animal Health Programme and Professor Ian Maudlin in the initial development of the mapping the benefits methodology is gratefully acknowledged, along with Guy Hendrickx’s and Marius Gilbert’s key roles in developing the approaches used. Udo Feldmann kindly added useful suggestions on the cost work and Rafael Argilés Herrero provided valuable comments on the draft. The authors would also like to express their gratitude to Professor David Rogers and his Trypanosomiasis and Land–use in Africa (TALA) Research Group at the University of Oxford for providing the satellite imagery used to model the vector and livestock distributions. In addition we are much indebted to Richard Kangethe and Anni McLeod, who kindly reviewed the whole document for FAO, and whose useful comments and corrections were very much appreciated. Our thanks also go to the anonymous reviewers who invested time and thought in the published papers reporting on this work, and whose suggestions helped to improve them.
The translation of livelihood zones into livestock production system maps relied on inputs from many individuals. We are grateful to all the institutions that promoted and carried out the collection of data on livelihood zones: ECHO, FEWS-NET, FAO, FSAU, IC, KFSM, SC-UK, SSCCSE, SIDA, EWU-MAAIF, UDDM, UNOCHA, USAID and WFP. In particular, we wish to thank Paul Anywayo, Michael Arunga, Alemu Asfaw, Agnes Atyang, Yergalem Beraki, Owen Calvert, Alexandra Crosskey, Joe Crowley, Francesco Del Re, Jan Delbaere, Gideon Galu, Jessi Grillo, Cindy Holleman, Jackson Kangethe, Mark McGuire, Calum McLean, Daniel Molla, Alycan Mushayabasa, Andrew Mutengu, Billy Mwiinga, Byron Ponce Segura, Francesca Pozzi, Luca Russo, Kedir Shemsu, Mark Smoulders, James Tefft and Kamau Wanjohi, who assisted us in gathering livelihood data. Joel Kanunga and Martin Barasa are thanked for providing additional information on cattle production and prices in Kenya and Sudan.Timothy Robinson also acknowledges support from the CGIAR Research Programmeson the Humidtropics; Climate Change, Agriculture and Food Security (CCAFS); and Agriculture for Nutrition and Health (A4NH). Dennis Muhanguzi, Walter

viii
Okello, Anne Holm Rannaleet, John David Kabasa and Sue Welburn of the Stamp out Sleeping Sickness project in Uganda and the Integrated Control of Neglected Zoonoses in Africa (ICONZ) EU Framework 7 project are thanked for providing information on the field costs of using insecticide-treated cattle and trypanocides in Uganda. Alexandra Shaw acknowledges support from ICONZ, as well as from the project Targeting Tsetse: Use of Targets to Eliminate African Sleeping Sickness, BGMF /LSTM 1017770. Thanks go to Vanja Kovacic, Mike Lehane, Iñaki Tirados, Johan Esterhuizen and Clement Mangwiro for information on the costs of deploying tiny targets, undertaken under the latter project.
Dedication Professor Albert Ilemobade 1936-2015
We dedicate this publication to the memory of Professor Albert Ilemobade, a much loved friend, colleague and mentor. Within the Programme Against African Trypanosomosis (PAAT), first as a committee member and later as chairman, he steered the tsetse and trypanosomosis community with great diplomacy, good humour and competence. His solid scientific knowledge of the disease and its control and his many years of experience, both in the field and as an academic and researcher, will be sorely missed. He offered help, suggestions and encouragement to the authors of this publication. We are grateful for the privilege of having known him and worked with him.

ix
Acronyms
AAT animal African trypanosomosisACDI/VOCA Agricultural Cooperative Development International and Volunteers in Overseas Cooperative Assistance (USA)ADB African Development BankADF African Development Fund AGAL Livestock Information, Sector Analysis and Policy Branch (FAO)AU-IBAR African Union - Inter-African Bureau for Animal ResourcesBCR benefit-cost ratioC total household income deriving from cropsCC carrying capacityDFID Department for International Development (UK)DPPA Disaster Prevention and Preparedness Agency, EthiopiaEC European CommissionEU European UnionECF East Coast feverECHO European Civil Protection and Humanitarian Aid Operations ECSA Ethiopia Central Statistical AgencyEWU Early Warning Unit (MAAIF Uganda)FAO Food and Agriculture Organization of the United NationsFEWS-NET Famine Early Warning System NetworkFITCA Farming in tsetse controlled areas (Ethiopia, Kenya, Tanzania, Uganda)FSAU Food Security Analysis Unit (Somalia)GIS geographic information systemGLW Gridded livestock of the worldHAT human African trypanosomosisHEA Household Economy ApproachIC Italian CooperationIAEA International Atomic Energy AgencyIFAD International Fund for Agricultural DevelopmentIGAD Intergovernmental Authority on DevelopmentILRI International Livestock Research InstituteISCTRC International Scientific Council for Trypanosomosis Research and ControlITC insecticide-treated cattlekm kilometrekm-2 per square kilometreKARI Kenya Agricultural Research InstituteKFSM Kenya Food Security Meeting L total household income deriving from livestock

x
LGP length of growing periodLPI Livestock Policy Initiative (IGAD)MAAIF Ministry of Agriculture, Animal Industries and Fisheries (Uganda)MOARD Ministry of Agriculture and Rural Development (Kenya)mm millimetreMTB mapping the benefitsNFIS National Food Information System (Eritrea)NGO non-governmental organizationOAU/STRC Organization of African Union/ Scientific, Technical and Research CommissionPAAT Programme Against African Trypanosomosis (FAO)PATTEC Pan-African Tsetse and Trypanosomosis Eradication CampaignPAAT-IS PAAT Information SystemPAAT-T&S PAAT Technical and Scientific (series of PAAT-IS papers)PPLPI Pro-poor Livestock Policy Initiative (FAO)SAT sequential aerosol techniqueSC-UK Save the Children-United KingdomSDP The Smallholder Dairy (Research and Development) Project (Kenya)SIDA Swedish International Development Cooperation AgencySIT sterile insect techniqueSSCCSE Southern Sudan Centre for Census, Statistics and EvaluationT&T tsetse and trypanosomosisTBD tick-borne diseasetryps trypanosomosisUS$, $ United States dollarsUBOS Uganda Bureau of StatisticsUDDM Ugandan Department of Disaster ManagementUNHS Uganda National Household SurveyUNOCHA United Nations Office for the Coordination of Human AffairsUSAID United States Agency for International DevelopmentWHO World Health Organization of the United NationsWRI World Resources InstituteWFP World Food Programme

xi
Executive summary
For livestock keepers in Africa, the presence of endemic chronic diseases is a constantdrain on their animals’ productivity and on their financial resources. One of these diseases, tsetse-transmitted trypanosomosis, is widely considered as a major constrainton livestock production and rural development in sub-Saharan Africa. Six member states of the Intergovernmental Authority on Development (IGAD) are affected by trypanosomosis: Ethiopia, Kenya, Somalia, South Sudan, Sudan and Uganda. These countries’ tsetse-infested zones are hugely diverse, marked by different climates, a range of production systems and variable livestock population densities. The range of options for dealing with the disease is also broad, from using trypanocidal drugs to various ways of controlling or eliminating the tsetse vector. With such wide variation and limited resources, evidence-based tools for prioritizing where and how to intervene are crucial.
The idea of producing monetary maps showing the potential benefits of dealing with tsetse and trypanosomosis was initially tested in West Africa (Shaw et al., 2006). In the present paper, the concept is further developed and applied to eastern Africa. A novel dimension is introduced by incorporating the costs of intervening against tsetse and trypanosomosis, thereby making it possible to map benefit-cost ratios. Different components of this study have already been published in peer reviewed journals (Cecchi et al., 2010, Shaw et al., 2013a, Shaw et al., 2014 and Shaw et al., 2015b). In this Programme Against African Trypanosomosis (PAAT) paper, the methodology andresults are described in more detail, and additional background information, maps anddata are provided.
The map of potential benefits is the result of a four stage process. The first involved mapping the production systems. Three livestock production systems were initially classified on the basis of data assembled for livelihoods analysis. The systems were defined according to the ratio of livestock- (L) to crops-derived (C) income. Thresholdsfor this ratio, and the livestock production systems thereof, are: L/C ≥ 4 (pastoral systems); 1 < L/C < 4 (agropastoral systems) and L/C ≤ 1 (mixed farming systems). Subsequently, the husbandry methods for cattle were mapped, with a focus on work oxen and crossbred ‘grade’ dairy animals. This yielded a total of twelve different cattleproduction systems:
• one pastoral;• four agropastoral, with low, medium and high oxen use, and with low oxen use
plus a high proportion of grade dairy animals;• four mixed farming in Kenya, Somalia, South Sudan, Sudan and Uganda, with low, medium and high oxen use, and with low oxen use plus a high proportion of grade dairy animals;• three mixed farming in Ethiopia, which has markedly different characteristics from the other countries, with low, medium and high oxen use.

xii
Information from census data, published and unpublished reports and local informantswas used to derive maps of these systems.
The second stage involved the development of cattle herd models for each system. These made use of published information on cattle productivity (fertility, mortality, sales, milk yields) in the absence or presence of trypanosomosis. Information was also collected in each country on how work oxen were used (number of days worked, activities undertaken, hire fees) and on livestock input and output prices (meat, milk, trypanocides, costs of keeping livestock). The herd models enabled calculation of the potential growth of cattle populations in two scenarios, i.e. in the absence or presenceof trypanosomosis. Income from these populations over a 20-year period could also beestimated. The income difference in the two scenarios provides a measure of total lossesdue to the disease. These losses can be considered as the maximum potential monetarybenefit that could be obtained by livestock keepers from interventions against tsetse and trypanosomosis. In order for this information to be mapped, it was calculated as amonetary amount per bovine, and subsequently rendered as an amount per km2.
The presence of high cattle densities in some areas of the study region made a third model component necessary. Over the 20-year period, both in the presence and absenceof trypanosomosis, cattle densities in some areas are expected to rise well beyond carrying capacity. A stepwise spatial expansion model was therefore used to estimate how these populations might migrate to new areas in search of grazing. For cattle ‘exported’ in this way from the core areas where these populations are currently located, the potential benefits over 20 years were calculated separately for ‘core’ and ‘export’ cattle, and subsequently cumulated.
The resulting map of the potential benefits of dealing with tsetse and bovine trypanosomosis in the IGAD region showed benefits to be both very high and very variable, ranging from under US$50 per km2 to more than $12 500 over the 20-year period, discounted at 10 percent. For this period, the total estimated benefit to the IGAD region amounts to about $2.5 billion – an average of approximately $3 500 per tsetse-infested km2. The greatest total benefits accrue to Ethiopia, due to its very high livestock population and the importance of animal traction; but even the lower benefits estimated for South Sudan and Sudan amount to a substantial sum – more than $500 million or over $1 500 per km2. The greatest benefits are shown to accrue along the fringes of the tsetse belts in southwest Ethiopia, parts of western, central and coastal Kenya, and southwestern and central Uganda. Comparatively lower benefits are estimated for much of the Sudanese tsetse belts, with the notable exceptions of those areas bordering northwest Uganda, and parts of western Ethiopia. The lower benefits in the Sudanese tsetse belts reflect current lower cattle stocking rates; over a longer timehorizon (> 20 years), potential benefits would be higher.
After mapping the benefits, the next step was to calculate benefit-cost ratios. For this,costs were estimated for eight scenarios. Four of these focused on control operations, costed as being undertaken continuously throughout the 20-year study period. Thesecontrol scenarios included the use of trypanocides and vector control with insecticide-treated cattle (ITC), insecticide-impregnated targets and aerial spraying using the

xiii
Sequential Aerosol Technique (SAT). Four different scenarios simulated the creation and maintenance of tsetse-free zones protected by barriers to reinvasion, described as localized ‘elimination’. The techniques mapped were again insecticide-treated cattle, targets and SAT. To these was added use of the sterile insect technique (SIT), which canbe deployed where other methods are expected to be unable to achieve elimination.
Mapping costs highlighted some of the practical differences between the techniques and how these impact on costs. The costs of using trypanocides and of treating cattle with insecticides are proportional to the size of the cattle population. For the other techniques, costs are proportional to the size of the treated area. The costs of targets vary greatly, according to whether only riverine, only savannah or both groups of tsetseflies are present. Physical constraints to the deployment of specific techniques were alsoconsidered in the analysis. For example, aerial spraying using fixed wing aircraft is not feasible in very rugged terrain, while the cost of releasing sterile males increases with the number of tsetse species present. Both SAT and SIT are subject to substantial economies of scale. The cost calculations were informed by recent field experiences, and some sensitivity analysis was undertaken with respect to key variables. Results indicate that the cost differences between techniques can be substantial, rising to fivefold or more, depending on the technique, cattle population and fly species involved.
Finally, the maps of benefit-cost ratios were obtained by dividing benefits by costs on a pixel-by-pixel basis. Again, a wide variability emerged, ranging from locations and interventions that cannot even be expected to cover costs, to those that could yield benefit-cost ratios of more than 20. In the case of continuous control strategies, while all techniques were profitable in some areas, in many areas of low cattle population density only the use of trypanocides yielded a benefit-cost ratio greater than one. In these areas, cattle populations are too low to support the large scale use of ITC, and neither SAT nor targets yield high benefits, although, where only riverine tsetse species are present, targets may sometimes be economically viable. At higher cattle population densities, all vector control scenarios consistently offer benefit-cost ratios greater than five.
As expected, elimination scenarios showed higher returns than continuous control. However, this must be balanced against several factors. The modelling for elimination was based on much larger-scale interventions than for control, and was predicated on a successful intervention (including prevention of tsetse reinvasion), backed up by a limited (five-year) investment in barriers to reinvasion. There are other uncertainties. SIT has not been field tested on such a large scale. ITC has been successful in reducingtsetse populations in a control scenario, but has not yet been deployed in the field witha tsetse elimination objective. Historically, most attempts at elimination have either failed to remove all flies, or the cleared territory has gradually been reinvaded. In most situations where elimination is the objective, different techniques may need to be combined, which could lead to some increase in overall costs.
The study outputs clearly point to certain areas where intervention is most urgently needed and likely to offer good economic returns. These are the high oxen use areas of Ethiopia, the northern shore of Lake Victoria, from Kenya extending beyond Lake Kyoga in Uganda, the high dairy use areas of central Kenya and west-central Ethiopia,

xiv
Uganda’s ‘cattle corridor’, and along the coasts of Kenya and Somalia. The benefit-costmaps also indicate that throughout the tsetse-infested region, the benefits of certain interventions will exceed their costs. In some areas, this is only true for trypanocides,but in many locations, tsetse control using insecticide-treated cattle or targets yields high returns. The substantial geographical differences in loss levels, in the costs of interventions and hence in benefit-cost ratios, underline how important this sort of information is to effective planning.
Importantly, this study is solely based on losses in cattle, as a proxy for total losses due to animal trypanosomosis. Were human African trypanosomosis to be factored in,some shifts in the priority areas would be likely to emerge.
As with any modelling exercise of this scope, this study relies on assumptions and generalizations and cannot replace detailed ground-truthing and pre-intervention planning at local level. Nevertheless, the maps have clear and unequivocal implicationsfor all those involved in planning and decision-making in the field of tsetse and trypanosomosis: there is no one-size-fits-all solution. Both disease impacts and the costs of interventions vary greatly between strategic objectives, intervention techniques and geographical locations. As a result, each situation needs to be individually assessed and approached with an open mind, while considering available resources and local needs.
The ‘mapping the benefits’ concept has now been demonstrated for tsetse and trypanosomosis in two African regions. The innovation of extending this to include costs by mapping benefit-cost ratios yielded further insights. The concept of monetarymaps, and its potential application in a wide range of contexts – from looking at the impact of other diseases and production constraints to overall assessments of the relative contributions made by different livestock species or crops in terms of monetary output– makes it a planning tool of considerable strength.

1
Chapter 1Introduction
1.1 bACkGROUNDAt the start of the new millennium, policy-makers, researchers and those directly involved in interventions against tsetse and trypanosomosis faced a marked decrease in funding from all sources, together with a general lack of donor interest in livestock development in Africa. Since then, much has been achieved in attempting to bring these issues into public prominence and to attract funding and manpower. This was spearheaded by the historic declaration of Africa’s leaders at Lomé and the subsequent formation of the African Union Pan-African Tsetse and Trypanosomosis Eradication Campaign (AU-PATTEC).
Clear goals and priorities are crucial to tackling trypanosomosis effectively on a national level, and even more so on a continental level. Goals and priorities inevitably reflect the perceived severity of the problem in the affected human and livestock popu-lations. In the field of human health, the serious resurgence of human African trypa-nosomosis (HAT) during the 1990s has provided clear focus areas for intervention. In the veterinary field, it has been more difficult to highlight areas where the problem was most economically significant.
In the field of tsetse and trypanosomosis control, while PATTEC has focused on long-term and permanent solutions to the trypanosomosis problem in the form of creating sustainable tsetse free zones (ADF, 2004) other crises, such as the widespread resurgence of HAT (Smith et al., 1998), or on a more specific, smaller scale, the threat-ened geographical overlap between the acute East African rhodesiense form of HAT and its chronic West and Central gambiense form in Uganda, have required other forms of intervention (Welburn et al., 2006).
Meanwhile, throughout Africa, livestock keepers have continued to protect or cure their cattle as best they could using trypanocides or by undertaking tsetse control on a small scale using insecticide pour-on or sprays on their cattle, traps, targets or insecti-cide-impregnated fences. Veterinary departments and non-governmental organizations (NGOs) have also implemented initiatives to mitigate the effect of trypanosomosis (for example, the FITCA Kenya Project, 2005).
In the field of decision support systems, over the past two decades, advances in remote sensing, geographic information systems (GIS) and spatial statistics have trig-gered the development of modelling approaches to tsetse distribution mapping (Rogers and Randolph, 1993; Robinson et al., 1997 and Rogers and Robinson, 2004). These exercises were possible due to the tight correlation between tsetse distribution and defined environmental and climatic conditions. Turning to the disease, the human form (sleeping sickness) is characterized by a pronounced focal nature, with the distribution

Intervening against bovine trypanosomosis in eastern Africa: mapping the costs and benefits2
of endemic foci remaining remarkably stable over the last century (Simarro et al., 2010), with a few notable exceptions (e.g. Fèvre et al., 2001). In recent years, systematic data collation and mapping have made it possible to represent the distribution of HAT in both endemic and non-endemic countries (Cecchi et al., 2009a; Simarro et al., 2010; Simarro et al., 2012a), to estimate the population at risk (Simarro et al., 2012b; Simarro et al., 2015), and to map the coverage of diagnostic and treatment facilities (Simarro et al., 2014). In domestic animals, although the prevalence of the disease varies between populations and localities, trypanosomosis generally presents as an endemic disease, with a widespread presence in livestock populations across the tsetse-infested area of sub-Saharan Africa. The use of GIS and satellite imagery to map animal trypanosomosis has been explored (Hendrickx et al., 2000; de la Rocque et al., 2005; Bouyer et al., 2006) and recently work has begun on mapping the distribution of animal trypanosomosis, as well as tsetse at a continental level (Cecchi et al., 2014, 2015).
Alongside spatially explicit data on the vector and the parasite, decision-making in the field of trypanosomosis control and elimination also requires other factors to be considered. In a number of studies in Zambia (Robinson, 1998, Robinson et al., 1997, 2002) and Uganda (Gerber et al., 2008), a variety of GIS and decision support approach-es has been used to combine proxies for disease risk – usually the probability of tsetse presence – with other criteria, including human population and poverty, cattle density, land use and land tenure, agricultural potential and environmental fragility. Ultimately, these approaches have been addressing the same question: where are the benefits of intervention likely to outweigh the costs, be they financial, environmental or social? The present analysis addresses this question from an economics perspective.
In the early 2000s, a range of mapped variables (such as cattle population densities and probabilities of tsetse presence) were already being used to support prioritization in the field of tsetse and trypanosomosis control in Western Africa (Gilbert et al., 2001, Pender et al., 2001, Wint et al., 2002a). On the economics side, work started in 2003 on a project to add monetary values to the other mapped variables (Shaw et al., 2005, Shaw et al., 2006 and Shaw et al., 2007).
With the setting up the Intergovernmental Authority on Development Livestock Policy Initiative (IGAD LPI), the need for similar information to underpin decision-making in the Horn of Africa was identified. Of the eight IGAD countries, six have areas of tsetse infestation (i.e. Ethiopia, Kenya, Somalia, South Sudan, Sudan and Uganda) and livestock is of crucial importance to all of them. Therefore, understanding the benefits and costs of intervening to control tsetse and trypanosomosis is crucial to policy-makers. To this end, a study was conducted on the comparative costs of different approaches to creating tsetse free zones (Shaw et al., 2007). Also, efforts were made to map the losses due to trypanosomosis in eastern Africa (Wint et al., 2011).
The body of work developed for eastern Africa was summarized in four papers. They deal with:
• mapping and characterizing livestock production systems (Cecchi et al., 2010);• estimating the costs of different intervention techniques against tsetse and trypano-
somosis (Shaw et al., 2013a);

3Introduction
• mapping losses to cattle keepers from trypanosomosis, and thus the potential ben-efits from interventions (Shaw et al., 2014);
• combining estimated costs and benefits to map benefit-cost ratios (Shaw et al., 2015b).
This PAAT paper brings together the work presented in those four papers, as well as a range of additional data, maps and analyses that were used either as inputs or as intermediate steps in the modelling. These include details on the spread model and its associated maps (Chapter 5), modelled distributions of work oxen and exotic dairy cat-tle, background tables on cattle productivity and the impacts of trypanosomosis and some sensitivity analyses on selected control costs. A much fuller list of the published and grey literature sources consulted is also included.
1.2 METHODOLOGYThe objective of the study in the IGAD region was to map the maximum economic gain if losses due to trypanosomosis in cattle were to be removed. At a regional level, the map shows where the benefits of controlling the disease would be highest. Different approaches to dealing with either tsetse or trypanosomosis would enable some or all of these benefits to be realized, over smaller or larger areas.
Three components were used to produce a monetary map of the potential benefits of removing trypanosomosis (Figure 1). These benefits can be seen as equivalent to the disease’s economic impact on cattle production.
Firstly, the cattle production systems needed to be defined and mapped to allow areas with distinct cattle keeping practices to be analysed separately (Chapter 2). Due to the very diverse agro-ecological zones of the IGAD region, this proved to be extremely challenging. The resulting maps offer new insights into the distribution of the region’s cattle production systems, determined as a function of a) the proportion of income derived from livestock, b) the use of animal traction, and c) the presence of crossbred ‘grade’ dairy cattle kept by rural smallholders.
Secondly, having defined, mapped and characterized the cattle production systems, bio-economic herd models were constructed that provide estimates of the value of output and growth, with or without trypanosomosis. These incorporate productivity parameters, such as mortality and fertility, which are strongly affected by trypano-somosis. These parameters were linked with other variables that determine the value of outputs from cattle: milk yield, use of animal traction and offtake of animals for sale or slaughter. Prices for livestock and livestock outputs were also added. The herd models were used to project cattle populations over a 20-year period, and the mon-etary benefits of interventions against tsetse and trypanosomosis were estimated as the difference in the value of the outputs in the presence and absence of the disease.
Thirdly, the ways in which cattle populations might spread in the absence or pres-ence of the disease were modelled. The maximum stocking density was estimated and mapped. Then, by applying the herd growth rates, it was possible to identify areas where future cattle populations might expand, once the maximum stocking rates have been exceeded.

Intervening against bovine trypanosomosis in eastern Africa: mapping the costs and benefits4
These three modelling exercises were subsequently combined by:• mapping the cattle populations in each cattle production system;• working out where the final cattle population would be located after 20 years in
the absence or presence of trypanosomosis; and• allocating modelled financial benefit per bovine to the cattle population, in
each cattle production system, to produce a final map of the total potential monetary benefits per km2 over 20 years from interventions against tsetse and trypanosomosis.
Once the benefit maps had been produced, the next step was to integrate the costs. These were modelled for eight different scenarios: four for continuous control activi-ties spanning a 20-year period, and four for the creation and maintenance of tsetse-free zones. Within each of the two strategy clusters, each scenario covered a different intervention technique (e.g. trypanocides, insecticide-treated cattle, etc.).
It was necessary to choose a consistent mappable indicator linking the benefits to the costs of different approaches for dealing with tsetse and trypanosomosis. For this, the benefit-cost ratio was used. As a ratio, it is independent of the scale of an operation, but still gives a clear idea of the return on an investment. Importantly, using a ratio leaves it open to the user to decide what level of return is acceptable.
Following the usual convention in economic analysis, a process known as dis-counting was used to convert monetary amounts received or spent in different years to a single figure. In this context, discounting refers to the conversion of future
FIGURE 1The methodology of ’mapping the benefits’: the three integrated components
MONETARYBENEFITS OVER
20 YEARSMAPPED
Cattleproduction
systems
Cattlepopulation
spread
20-year herdand outputprojection
1
2 3

5Introduction
sums of money to a single present value, using a pre-selected discount rate. This is a process that is exactly analogous to removing compound interest from future sums of money. Non-economists should note that this process is not in any way related to inflation. It weights future as against present income, and the discount rate can be seen as representing the minimum acceptable annual real rate of return on invest-ments. Both benefits and costs incurred were accordingly ‘discounted’ to a single present value, using a discount rate of 10 percent. This is the same rate as that used in Shaw et al. (2006). This relatively high discount rate was selected as reflecting both the higher returns expected from investments in livestock (when compared, for example, with human health interventions), and the economic growth rates and real interest rates in the study region, which are higher than those currently experienced in Europe and North America. The African Development Bank currently applies 12 percent as the opportunity cost of capital for its projects in the region. In the case of the benefit maps, the choice of the discount rate does not affect the relative benefit levels depicted, or the priority areas that emerge. The principle of discounting can be consulted in standard economic textbooks and is discussed in the context of tsetse and trypanosomosis control in Shaw (2003).
All monetary amounts were converted to United States dollars (US$) at the exchange rate applicable when they were collected. The price data for cattle outputs and production costs were mostly collected in 2009, when this part of the study was undertaken, whereas the cost data were based on 2013 price levels. Thus, in addition to discounting, some adjustments for inflation were necessary when it came to creat-ing the benefit-cost maps. These are explained in Section 7.2.1.
1.3 DATA AND INFORMATION COLLECTION The analysis reported here required a diverse range of information in various for-mats. Information underpinning the calculation of benefits was obtained from a number of sources.
Within each country, data on the following areas were collected:• published and unpublished articles, reports, studies and theses on livestock pro-
duction systems, animal disease, livestock productivity and more specifically on trypanosomosis and its impact on livestock;
• published and unpublished information on costs and methods for controlling tsetse and trypanosomosis, including farmers’ expenditures;
• prices for meat, livestock, milk and hiring animal traction;• costs of keeping cattle within each production system;• costs of treating cattle with curative and prophylactic trypanocides; • organizations and projects working on livestock and animal health;• cattle production parameters within the cattle production systems; and• expert opinion on the distribution of the main cattle production systems.This information was supplemented by Internet searches and by drawing on the
authors’ own document collections. In all, more than 250 sources were consulted. The livestock production system mapping (Cecchi et al., 2010) relied on datasets

Intervening against bovine trypanosomosis in eastern Africa: mapping the costs and benefits6
collected in the framework of livelihood analysis. In particular, input data were gathered between 2000 and 2007 by various emergency and development agencies for Djibouti, Eritrea, Kenya, Somalia, Uganda and parts of Ethiopia, South Sudan and Sudan.
On the cost side, the framework used was based on that developed in Shaw et al. (2007) and updated in Shaw et al. (2013a). Information from a number of recent field studies was incorporated, as explained in Chapter 7.
Other important variables for the analysis were the modelled distributions of the tsetse vector, used as a proxy for trypanosomosis risk and for estimating the costs of tsetse control, and the modelled distribution of cattle populations that could benefit from measures to mitigate the impact of trypanosomosis on their productivity.
FIGURE 2Presence of tsetse vectors: predicted areas of suitability
Indian Oce
an
South Sudan
Sudan
Ethiopia
Kenya
Somalia
Uganda
Eritrea
Djibouti
4 5° E3 0° E
N
15° N
0°
P red icted presence
P red icted ab sence0 1000500
Kilometres
7Introduction
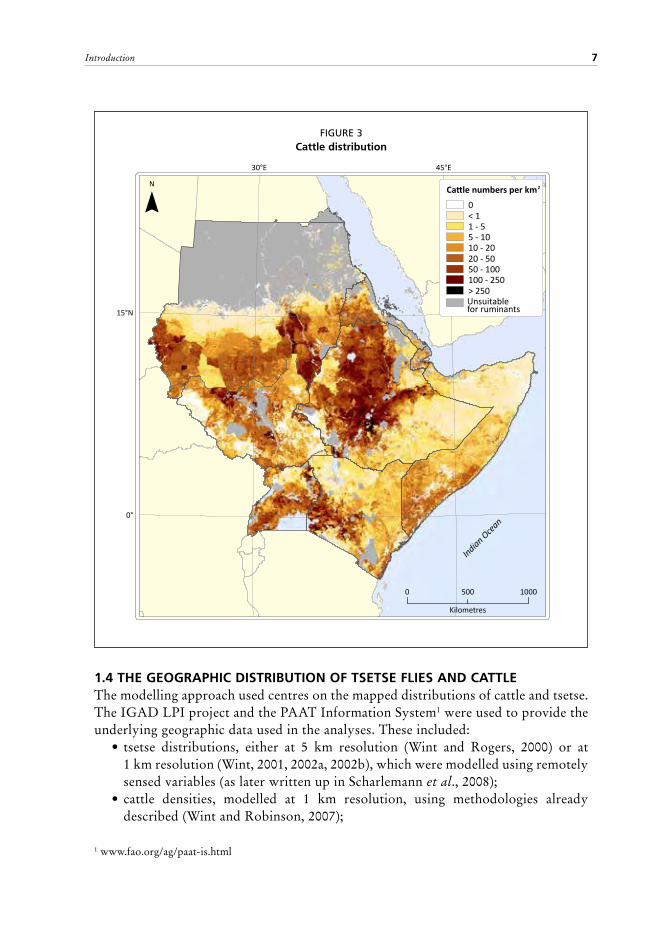
1.4 THE GEOGRAPHIC DISTRIBUTION OF TSETSE FLIES AND CATTLEThe modelling approach used centres on the mapped distributions of cattle and tsetse. The IGAD LPI project and the PAAT Information System1 were used to provide the underlying geographic data used in the analyses. These included:
• tsetse distributions, either at 5 km resolution (Wint and Rogers, 2000) or at 1 km resolution (Wint, 2001, 2002a, 2002b), which were modelled using remotely sensed variables (as later written up in Scharlemann et al., 2008);
• cattle densities, modelled at 1 km resolution, using methodologies already described (Wint and Robinson, 2007);
FIGURE 3Cattle distribution
Indian Oce
an
4 5° E3 0° E
15° N
0°
0 1000500
Kilometres
Cattle numbers per km 2
Unsuitab le f or ruminants
> 2 50100 - 2 5050 - 1002 0 - 5010 - 2 05 - 101 - 5< 10
N
1 www.fao.org/ag/paat-is.html

Intervening against bovine trypanosomosis in eastern Africa: mapping the costs and benefits8
• human population data extracted from the Global Rural Urban Mapping Project coverage2; and
• travel time to populated places (Pozzi and Robinson 2008; Pozzi et al., 2010). There are six important tsetse species in the area. Four belong to the morsitans (or
savannah) fly group: Glossina pallidipes, G. morsitans, G. swinnertoni, and G. austeni. Two belong to the palpalis (or riverine) group: G. fuscipes and G. tachinoides. Figure 2 shows the areas of the IGAD region with suitable habitat for one or more of these species (where the probability of presence is ≥50 %), covering a total of 653 000 km2. This map highlights the fragmented nature of the vector distribution in the region, with some more isolated populations in Ethiopia, contrasting with South Sudan, western Sudan, Kenya and Uganda, where the tsetse populations are on the fringes of solidly infested areas in the Democratic Republic of the Congo and Tanzania (see inset). Figure 2 thus defines the area within which livestock populations exist that could benefit from measures to deal with animal trypanosomosis.
Figure 3 shows cattle population densities (from the IGAD LPI data archive), also modelled at 1 km resolution using environmental, climatic and demographic variables as predictors, adopting the approach set out in Wint and Robinson (2007), based on customized forward stepwise multiple regression. Covariates included remotely sensed indices of temperature and vegetation derived from Fourier processed MODIS satellite imagery (Scharlemann et al., 2008), as well as topographic and demographic parameters, such as elevation, population density and travel time. The resulting model explains some 61 percent of the variance in the response variable, so with a dataset sample of n>5000, has a significance level of p <0.001. In the present study, as in Shaw et al., 2006, the focus was on cattle, since the most economically significant livestock losses due to trypanosomosis occur in this species (see discussion in Section 2.2). A notable feature of cattle populations in the Horn of Africa is that certain areas sup-port extremely high stocking rates, especially in the Ethiopian and Kenyan highlands and on the Kenyan (eastern) shores of Lake Victoria. Parts of South Sudan and Sudan also show high stocking rates – particularly close to the Gezira and Managil irrigation schemes near the confluence of the Blue and White Nile rivers.
2 http://sedac.ciesin.columbia.edu/gpw/global.jsp

9
Chapter 2Mapping cattle production systems
The task of mapping cattle production systems for the IGAD region was a challenging one. In the West African study (Shaw et al., 2006), cattle breed was used as a reliable indicator of the predominant production system. Thus it was possible to stratify the analysis into a series of cattle breed/production systems within which the impact of trypanosomosis could be expected to be similar. In East Africa, a much more heterogeneous mosaic of production systems presented itself, which was less closely associated with cattle breed and therefore called for the development of a different, more articulated mapping approach.
Two hierarchical levels were distinguished for mapping production systems in the IGAD region. At a first level of classification, three major livestock systems were distinguished: pastoral, agropastoral and mixed farming. At a second level, specific to cattle, information on the use of work oxen and the presence of grade dairy cattle was added, thus enabling the three major livestock production systems to be further disaggregated into 12 cattle production systems.
2.1 DEFINING AND MAPPING LIVESTOCK PRODUCTION SYSTEMS In East Africa, as in many developing countries, spatially explicit information on the degree to which rural households rely on livestock remains poor, despite the key role that livestock play in providing food, income and other services, especially among the poorest segments of society. Numerous studies and projects conducted by national institutions, international organizations, research institutes and NGOs have collected a wide range of agricultural data, which often include information on livestock. However, most of these studies focus on the local, subnational or national level, as a number of hurdles hinder the collation and analysis of data at a regional and continental level.
However, substantial information, showing a fair degree of consistency, has been collected in recent years in the framework of livelihood analysis, which provides extensive baseline data on livelihoods in East Africa. These were used to define and map pastoral, agropastoral and mixed farming systems (Cecchi et al., 2010).
2.1.1 Livelihood analysis and livelihood mapsDifferent conceptual frameworks developed for livelihood analysis include the sustainable livelihood framework (Scoones, 1998; Carney, 2003) and the Household Economy Approach (HEA) (Seaman et al., 2000). The latter, in particular, has been extensively applied in the Horn of Africa. The HEA was developed in the early 1990s by Save the Children-United Kingdom (SC-UK), with the initial goal of improving the ability to predict short-term changes in access to food. It is a framework for analysing
Intervening against bovine trypanosomosis in eastern Africa: mapping the costs and benefits10
the way people obtain the assets and resources that they need, and it aims to help improve emergency response and disaster mitigation, as well as to support long-term development.
One of the objectives of the HEA is to analyse the possible outcomes of various hazards or shocks on livelihoods. Outcomes are measured against a baseline, which includes, among other pieces of information, the sources of food and cash income in a reference year. For the purpose of mapping livestock production systems, crucial information can be derived from these baseline assessments.
A livelihood may be characterized as the sum of activities and resources through which households fulfil both their basic and non-basic needs. In livelihood analysis, homogenous areas within which people share the same pattern of livelihood – including such aspects as agricultural production characteristics, consumption, expenditure, trade and exchange – are defined as livelihood zones. The geographic distribution of livelihood zones is depicted in livelihood maps. In principle, spatial delineation of livelihood zones should be made considering aspects related to geography, agricultural production and
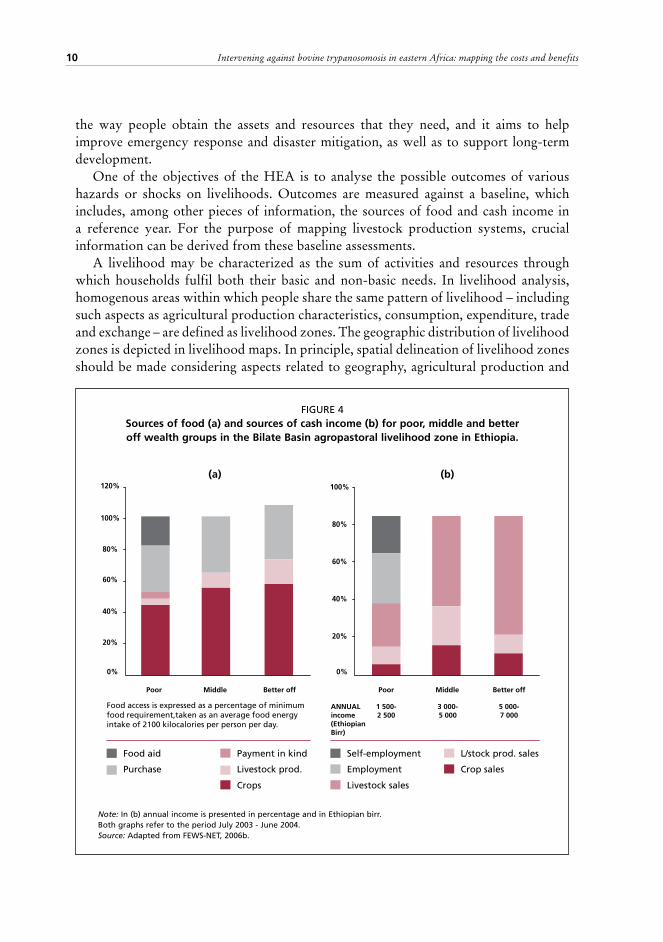
FIGURE 4Sources of food (a) and sources of cash income (b) for poor, middle and better off wealth groups in the Bilate Basin agropastoral livelihood zone in Ethiopia.
Poor
0%
20%
40%
60%
80%
120%
100%
Middle
ANNUALincome(Ethiopian Birr)
1 500-2 500
3 000-5 000
5 000-7 000
Better off
Food aid
Purchase
Payment in kind
Livestock prod.
Crops
Self-employment
Employment
Livestock sales
L/stock prod. sales
Crop sales
Poor
0%
20%
40%
60%
80%
100%
Middle Better off
Food access is expressed as a percentage of minimumfood requirement,taken as an average food energy intake of 2100 kilocalories per person per day.
Note: In (b) annual income is presented in percentage and in Ethiopian birr. Both graphs refer to the period July 2003 - June 2004.Source: Adapted from FEWS-NET, 2006b.
(a) (b)

11Mapping cattle production systems
markets. Nevertheless, as resource allocation and decisions for service provision are often made at the level of administrative units, it is common to use administrative boundaries to demarcate at least part of the livelihood zones’ limits.
While methods to collect data for livelihood analysis may vary, the method of summarizing and presenting them is fairly similar in most livelihood studies. Figure 4 shows how the contributions of crops and livestock to the food basket (a) and to cash income (b) are clearly distinguished. In this example, information is further disaggregated by wealth group.
Data gathered in the framework of livelihood analysis can be compiled in different formats, including a) reports; b) spreadsheets and databases (which provide information on the relative contribution of livestock and crops to total income, as exemplified by Figure 4); and c) maps, which delineate the geographic position and extent of the different livelihood zones.
Most livelihood studies in eastern Africa have generated livelihood maps in GIS format, though for a minority of studies maps were only available as graphic files. In those cases, we geo-referenced and digitized the maps to generate the corresponding GIS files.
Livelihood studies conducted for all or parts of the IGAD member states provided the input to map livestock production systems (FEWS-NET, 2004; FEWS-NET, 2006-2007; FEWS-NET, 2006a; FEWS-NET, 2006b; FSAU and SC-UK, 2000-2001-2002; KFSM, 2006; NFIS, 2006; SC-UK and DPPA, 2001-2002-2004-2005; SSCCSE and SC-UK, 2005; UDDM et al., 2005 – for further explanation please refer to the Acronyms section).
2.1.2 From livelihood maps to maps of livestock production systems The dominant livestock production system was defined within each livelihood zone, according to the relative dependence of households on livestock. If L and C are defined as the total household income derived from livestock and crops respectively, and total income is the sum of the value of the marketed and subsistence production (see Otte and Chilonda, 2002), then the ratio L/C can be used to define three systems as follows (Cecchi et al., 2010):
• pastoral systems: where L/C ≥ 4;• agropastoral systems: where 1 < L/C < 4; and• mixed farming systems: where L/C ≤ 1. L/C can be estimated for all households or household groups, including those for
which waged labour, remittances or commerce contribute to income in a substantial manner. Therefore, an ‘urban and other areas’ category was also introduced for households where agriculture, both crop and livestock, contributes less than 10 percent of total income. This is most frequently the case in urban areas, or in those where tourism, trade or fishing predominate. A fifth class, designated as ‘protected areas’, accounts for national parks and other reserves, as they are sometimes depicted on livelihood maps.
Quantitative information on livestock and crop-derived income was not available in some livelihood studies (most notably in Eritrea and Uganda). In these areas, production systems were assigned according to the livelihood profiles and descriptions

Intervening against bovine trypanosomosis in eastern Africa: mapping the costs and benefits12
of production systems therein. These normally include explicit, if qualitative reference to the dominance of either pastoral, agropastoral or mixed farming systems. Livelihood information in these areas was complemented by expert opinion (see Acknowledgments).
The combined use of quantitative and qualitative information made it possible to produce a map of the three basic livestock production systems to be derived for all areas of eastern Africa where livelihood analysis has been conducted (Cecchi et al., 2010).
2.1.3 Using statistical modelling to fill the gaps in the livelihood-based map of livestock production systems At the time of the study, livelihood data were not available for large areas of Ethiopia and Sudan. The gaps in the observed distribution of the livelihood-based livestock production systems were filled with stochastic spatial modelling techniques based on logistic regression, thereby providing complete regional coverage. These techniques
FIGURE 5Livestock production systems in the IGAD region
Indian Oce
an
Djibouti
Eritrea
Uganda
Somalia
Kenya
Ethiopia
Sudan
South Sudan
4 5° E3 0° E
15° N
0°
0 1000500
Kilometres
Unsuitab le f or ruminantsM ix ed f armingAgropastoralP astoralN
Source: Cecchi et al., 2010

13Mapping cattle production systems
have been widely used to model a range of agro-ecological and epidemiological parameters that are likely to be related to climate, topography and other environmental variables (e.g. Wint et al., 2002b; Gilbert et al., 2005). Such approaches were used here to model the presence or absence of each of the three defined livestock production systems.
Logistic regression models were generated using data extracted for each of a regular grid of sample points, spaced approximately 15 km apart. For each point, the presence or absence of a livestock production system was extracted, together with values for a suite of potential predictor variables (the same as those used for modelling the distributions of tsetse and cattle, described above).
Separate models were constructed for each of the three defined livestock production systems, each with a predictive accuracy in excess of 85 percent, implying a significance level of P < 0.001. The regression relationships were then applied back to the selected predictor datasets to provide a 1 km resolution image of the probability of occurrence for each livestock production system. Each pixel was then assigned the system with the highest predicted probability.
The modelled distribution of pastoral, agropastoral and mixed farming systems was used to fill the gaps in the basic map, so as to produce a complete map for the study area as shown in Figure 5. Areas unsuitable for cattle – including high elevation areas, urban centres, water bodies, forests and protected areas – have been masked out.
2.2 DEFINING AND MAPPING CATTLE PRODUCTION SYSTEMSHaving mapped the main livestock production systems, the cattle production systems within them were considered. The potential benefits of dealing with trypanosomosis were estimated for cattle populations kept by rural households under more or less traditional management systems. There were several reasons for focusing on cattle. Cattle account for about 70 percent of the ruminant livestock biomass in the affected areas. Evidence-based information on disease impact is really only available for cattle production systems (Shaw, 2004; Swallow, 2000), and even the evidence from cattle relates to specific areas and production systems and does not adequately cover all the economic impacts of animal trypanosomosis. Furthermore, the consensus from many studies is that the bulk of losses due to animal trypanosomosis are linked directly or indirectly to cattle production.
The focus of this study has been on rural areas. In urban areas, there is almost no direct impact from trypanosomosis, and in peri-urban areas, the impact is limited. Urban, and to some extent peri-urban areas were already excluded in the livestock production systems mapping based on livelihood zones. From the cattle keeping point of view, peri-urban production is often atypical, including intensive and commercialized forms of farming, such as fattening, even some feedlots, or intensive dairying in large units. As in West Africa, the majority of cattle are kept in extensive and semi-extensive systems or by smallholders. Intensive production systems were not considered explicitly, although in the economic modelling (Chapter 4) for dairy systems, the parameters for zero-grazing were taken into account. Due to a lack of consistent information, it was not possible to deal with ranching explicitly as a production system. Areas where ranching occurs are most likely to be included

Intervening against bovine trypanosomosis in eastern Africa: mapping the costs and benefits14
in pastoral or agropastoral livestock production systems, so the herd models were parameterized accordingly.
Thus, looking at cattle, the next step in deriving a map of cattle production systems suitable for modelling the economics of trypanosomosis was to focus on those components of cattle keeping in pastoral, agropastoral and mixed farming communities which particularly impact on their economics. This involved paying special attention to two high value categories of cattle: work oxen and grade dairy cattle.
2.2.1 Mapping the distribution of work oxenIn many areas, animal traction is critical to the economics of tsetse and trypanosomosis control. Cattle are particularly important and males, both bulls and castrates, are used. Both are generically referred to as work oxen – the term used in this report. The analysis in West Africa demonstrated that the potential benefits of reducing the incidence of animal African trypanosomosis (AAT) increase in line with the proportion of work oxen in the cattle population. Likewise, the overall results are strongly influenced by the assumptions used to quantify the impact of trypanosomosis on work oxen use and performance. Accordingly, for this analysis in eastern Africa, special attention was paid to collecting information on work oxen and to estimating the value of their labour.
Information on the location of work oxen was taken from census data, as well as from the grey literature and published sources. Country livestock censuses usually provide some information on the numbers of different cattle types. For example, in Uganda there is good information on the use of exotic animals (at the time of the analysis the results from the 2008 Ugandan census were not yet available), and on the presence of oxen and bulls in the cattle population, albeit without specification as to whether they are used for draught. In data from Kenya, the focus is more on smallholder dairy production. Only Ethiopia regularly collects explicit information on the numbers of draught animals in the population.
It was immediately evident that the five countries show great variation in the use of oxen. The proportion of oxen in the cattle herd varied from almost 0 percent (usually in pastoral or dairy production areas) to more than 40 percent (in some parts of Ethiopia). Accordingly, three levels of oxen use were distinguished for the purpose of mapping, in terms of the percentage of the cattle herd comprising work oxen:
• low: 0%-less than 10%• medium: 10 %-20 %• high: over 20%
Based on these definitions, the levels of oxen use were assessed as discussed below. In Kenya, and to some extent Uganda, people who use cattle for growing crops
tend to be described as agropastoralists, so that making use of draught power is seen as a characteristic of agropastoralism, rather than of mixed farming. In this report, the livelihood-based, quantitative definitions developed in Section 2.1.2 to separate pastoralism, agropastoralism and mixed farming were used as a basis for then classifying cattle production systems within these three basic livestock production systems, according to the extent of their use of draught power.

15Mapping cattle production systems
In Kenya, work oxen are widely distributed, but their use in significant numbers is limited to specific regions. Numbers of draught animals (cattle and donkeys) were estimated at 700 000 in 1995 (Starkey and Kaumbutho, 1999). According to Rege et al. (2001), reporting on a study of three districts: “The zebu is used more as a source of draft power in Makueni (30.6%) and Kitui (24%) Districts than in Taita Taveta (10%) and Kajiado (4.4%) Districts. This difference can be attributed to differences in traditions between the communities inhabiting these districts. The Kamba communities that inhabit the Makueni and Kamba Districts have long been known to use cattle for draft power. While the Taita Taveta and Maasai communities have learnt this quite recently; the use of cattle as a source of draft power is still very low among the Maasai tribe who regard the use of cattle for draft as a form of slavery”. The use of draught power by the Kamba tribe is well known. Itty (1992), in his study of the Muhaka area of Kwale District, notes the use of work oxen by immigrant Kamba settlers. Machila (2005), also working in Kwale District, noted that 93 percent of farmers used draught power, 67 percent owning their own draught animals and the others hiring them, whereas in Busia district, 46 percent of farmers hired draught animals, with only 2 percent owning their own. High numbers of oxen are also recorded in Kuria district in western Kenya. In Kenya, high levels of oxen use are thus found in the Kamba heartlands (Makueni and Kamba Districts), in areas along the coast to which they have migrated, and where there are high levels of cattle ownership (Kwale District), and in some districts of western Kenya (Busia and Kuria).
In Uganda, the use of work oxen is particularly high around the Lake Kyoga area, especially to the north, such as in Soroti District. Here, after years of conflict and danger, the security situation has improved markedly of late, and people have been restocking with cattle. Their reliance on draught power is highlighted in the paper by Ocaido et al. (2005). This states that in Serere County, 95 percent of people rely on traction using “bulls and steers for ploughing; and transportation of building materials, harvest from the fields and firewood”. This reliance on ox traction is reflected in cattle prices and in a well developed market for hiring work oxen. Female cattle are hardly ever used for draught work, since their use for this type of labour tends to be regarded as taboo, and cows are only used as a last resort – for example if a male falls sick. The herd structure reflects this reliance on draught power: 36.4 percent of the herd in Serere were bulls or steers, compared with 9 percent in the cattle corridor area of Mbarara; in Serere, only 45.4 percent of the herd is female, compared with 75 percent among the Bahima pastoralists (Ocaido et al., 2005). Livelihood analysis in Uganda (UDDM et al., 2005) provided further information as to areas where work oxen are present in significant numbers:
• the ‘cotton simsim’ zone in the districts of eastern Arua, Nebbi Yumbe and southern Adjumani and Moyo Districts has generally flat land “suitable for animal traction especially in the large cotton fields”, reflecting an association between cotton growing and the use of draught power similar to that in West Africa;
• the ‘pulses-cassava’ zone covering most of Apac and southern Lira Districts; and• the ‘cassava-livestock’ zone which covers “most of central and northern Nakasongola,
Intervening against bovine trypanosomosis in eastern Africa: mapping the costs and benefits16
northern Kayunga, southern Apac and northern Kaberamaido, the whole of Katakwi District, most of central and eastern Kumi and eastern Soroti Districts”.
Further local knowledge identified Amuria, Kaberamaido, Kumi and Soroti as areas of high oxen use (more than 20 percent of the cattle herd), with Bugiri, Kaliro, Iganga, Namutumba and Pallisa Districts as areas of medium oxen use (10 percent or more).
There are thus two main areas of oxen use – a focus around Lake Kyoga, with higher levels of use to the north, and a focus in the cotton-growing areas of northwestern Uganda.
In South Sudan and Sudan, the most relevant information was obtained from the study of livelihoods (SSCCSE and SC-UK, 2005) and from local sources. Use of cattle for draught power is limited to a few areas. In the Western Flood Plains area, most (80 percent) of the population is agropastoral, but there is a growing use of ox ploughs, purchased mainly by the better off. The use of draught cattle is also increasing in the Ironstone Plateau area. However, overall numbers remain low, so these areas have been classified as ‘low oxen’.
Somalia’s cattle populations are primarily pastoral. Among the agropastoral and mixed farming populations, there are some where there is limited use of cattle for ploughing or for transporting water and harvested crops from the field to stores. These areas would be in the far north, in the Awdal and Woqooyi Galbeed Regions. Thus the mixed and agropastoral areas of Somalia were all classified as ‘low oxen’ use. Various projects are helping farmers to acquire and use oxen (IFAD, 2006).
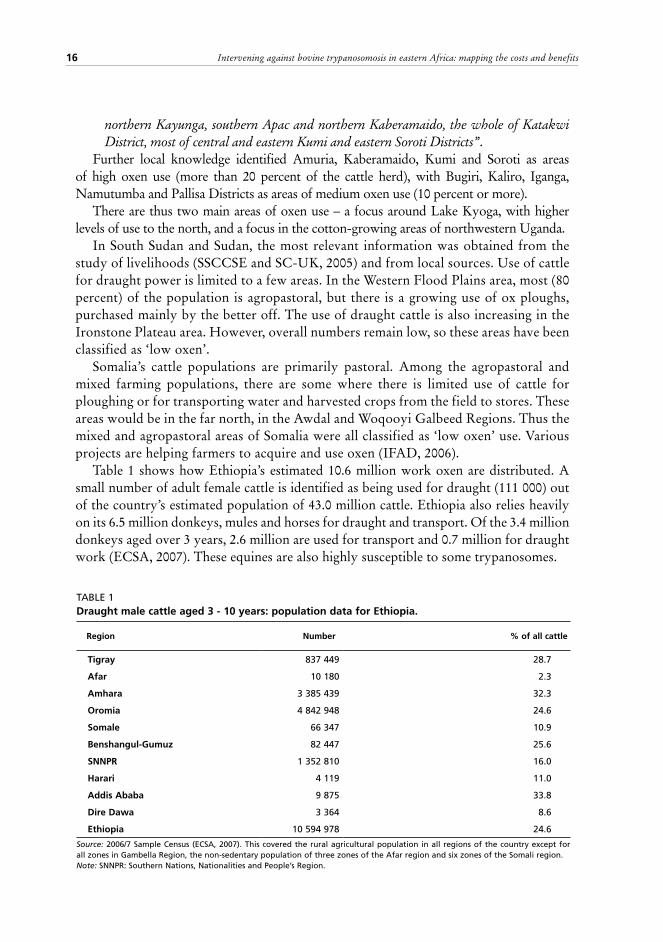
Table 1 shows how Ethiopia’s estimated 10.6 million work oxen are distributed. A small number of adult female cattle is identified as being used for draught (111 000) out of the country’s estimated population of 43.0 million cattle. Ethiopia also relies heavily on its 6.5 million donkeys, mules and horses for draught and transport. Of the 3.4 million donkeys aged over 3 years, 2.6 million are used for transport and 0.7 million for draught work (ECSA, 2007). These equines are also highly susceptible to some trypanosomes.
TABLE 1Draught male cattle aged 3 - 10 years: population data for Ethiopia.
Region Number % of all cattle
Tigray 837 449 28.7
Afar 10 180 2.3
Amhara 3 385 439 32.3
Oromia 4 842 948 24.6
Somale 66 347 10.9
Benshangul-Gumuz 82 447 25.6
SNNPR 1 352 810 16.0
Harari 4 119 11.0
Addis Ababa 9 875 33.8
Dire Dawa 3 364 8.6
Ethiopia 10 594 978 24.6
Source: 2006/7 Sample Census (ECSA, 2007). This covered the rural agricultural population in all regions of the country except for all zones in Gambella Region, the non-sedentary population of three zones of the Afar region and six zones of the Somali region.Note: SNNPR: Southern Nations, Nationalities and People’s Region.

17Mapping cattle production systems
The map of oxen use was thus compiled from three sources:• the descriptions of the livelihood zones used to define the main livestock
production systems; • expert knowledge and local studies; and• for Ethiopia, census data. Figure 6 shows how these systems were distributed in the IGAD region. It can be seen
that evidence for significant oxen use was restricted to three countries (Ethiopia, Kenya and Uganda), with Ethiopia having by far the most widespread use.
FIGURE 6The use of work oxen
Indian Oce
an
Djibouti
Eritrea
Uganda
Somalia
Kenya
Ethiopia
Sudan
South Sudan
4 5° E3 0° E
15° N
0°
0 1000500
Kilometres
rk en as al attle
Unsuitab le f or ruminants< 10 ( L ow ox en)10 - 2 0 ( M edium ox en)> 2 0 ( H igh ox en)
N

Intervening against bovine trypanosomosis in eastern Africa: mapping the costs and benefits18
2.2.2 Mapping the distribution of smallholder dairy productionEastern Africa, especially its highland regions, has seen the development of a smallholder dairy industry based on cattle that contain varying degrees of exotic blood – usually of the main European dairy breeds. These cattle are referred to as ‘exotic’, ‘improved’ or, more often ‘grade’ cattle. The latter term will be retained here.
As explained in the introduction to this chapter, only rural dairy production by smallholders using grade cattle was considered, thereby excluding specialized intensive production units usually associated with peri-urban, urban or irrigated areas.
Qualitative evidence for substantial rural dairy production was restricted to Kenya and Uganda, and specific quantitative measures of the number of dairy cattle were limited to livestock census data for Kenya. Figures were also available, however, for the number of exotic cattle from the Uganda livestock census, and these were taken as a proxy for dairy, based on the assumption that the use of exotic livestock for beef production is very limited in the rural areas of Uganda. This match between exotic cattle and areas of high milk production was corroborated by information from the livelihoods study (UDDM et al., 2005), from the literature and from in-country district by district analysis.
Both dairy and exotic cattle numbers were available for administrative units: the relatively small counties for Uganda and the much larger districts for Kenya. In order to increase the resolution of the comparatively coarse Kenya data, the proportion of dairy
FIGURE 7 The modelled distribution of the percentage of grade dairy cattle in Kenya and Uganda
KenyaUgandaSomalia
South Sudan Ethiopia
4 0° E3 0° E
0°
a r r e attle as al attle
3 0 - 4 04 0 - 5050 - 6 0> 6 0
0 5002 50
KilometresUnsuitab le f or ruminants< 1010 - 2 02 0 - 3 0
19Mapping cattle production systems
or exotic cattle was subjected to the same forwards stepwise multiple linear regression modelling procedures used to produce the cattle distributions of the Gridded Livestock of the World datasets (Wint and Robinson, 2007). Data points were sampled in the same way as for the livestock production systems, as described in Section 2.1.3., and the same covariates were used as for the cattle and tsetse distributions (Section 1.4) and livestock production systems (Section 2.1.3). The resulting model explained in excess of 60 percent of the response variable variation, with a significance value of p<<0.001.
The resulting 1 km resolution distribution model gave a good fit with the Kenyan data, but a much less good fit with Uganda data. This was most probably because of the relatively dispersed and restricted distributions in Uganda, and also reflected the fact that in Kenya, dairying is a highland phenomenon, and highland habitats, especially in semi-arid regions, are readily picked out by environmental modelling approaches.
Accordingly, the modelled data for Kenya was combined with the original, fine scale, administrative zone level information for Uganda to produce a final map of dairy production as inferred by the percentage of grade (i.e. ‘exotic’ or ‘dairy’) cattle.
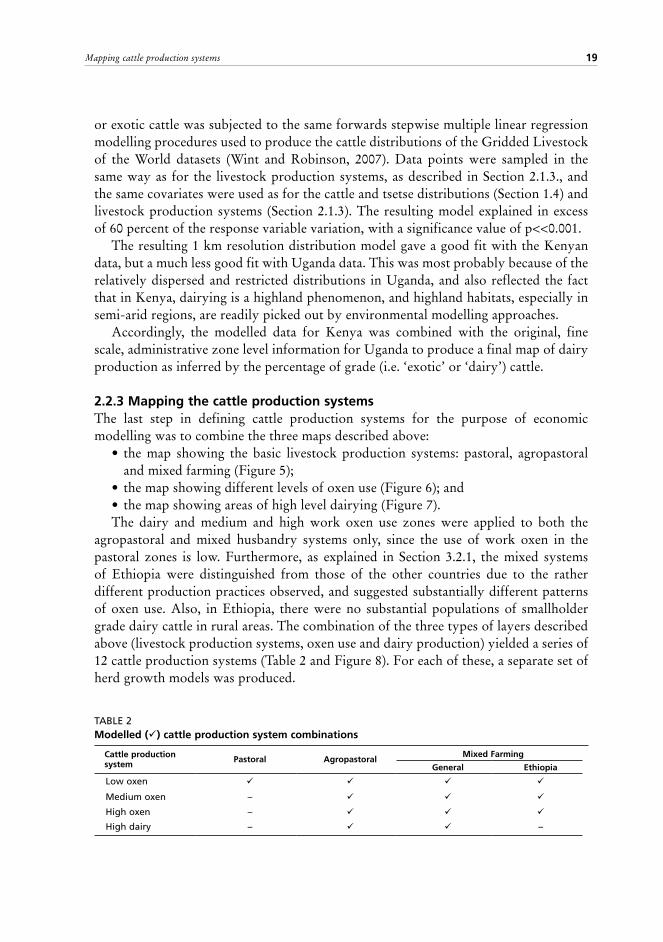
2.2.3 Mapping the cattle production systems The last step in defining cattle production systems for the purpose of economic modelling was to combine the three maps described above:
• the map showing the basic livestock production systems: pastoral, agropastoral and mixed farming (Figure 5);
• the map showing different levels of oxen use (Figure 6); and• the map showing areas of high level dairying (Figure 7). The dairy and medium and high work oxen use zones were applied to both the
agropastoral and mixed husbandry systems only, since the use of work oxen in the pastoral zones is low. Furthermore, as explained in Section 3.2.1, the mixed systems of Ethiopia were distinguished from those of the other countries due to the rather different production practices observed, and suggested substantially different patterns of oxen use. Also, in Ethiopia, there were no substantial populations of smallholder grade dairy cattle in rural areas. The combination of the three types of layers described above (livestock production systems, oxen use and dairy production) yielded a series of 12 cattle production systems (Table 2 and Figure 8). For each of these, a separate set of herd growth models was produced.
TABLE 2Modelled () cattle production system combinations
Cattle productionsystem Pastoral Agropastoral
Mixed Farming
General Ethiopia
Low oxen
Medium oxen –
High oxen –
High dairy – –

Intervening against bovine trypanosomosis in eastern Africa: mapping the costs and benefits20
FIGURE 8 Map of cattle production systems
Indian Oce
an
Djibouti
Eritrea
Uganda
Somalia
Kenya
Ethiopia
Sudan
South Sudan
4 5° E3 0° E
15° N
0°
0 1000500
Kilometres
Areas unsuitab le f or ruminants
P astoral Agropastoral
H igh dairyH igh ox enM edium ox enL ow ox en
M ix ed f arming ( general)
H igh dairyH igh ox enM edium ox enL ow ox en
M ix ed f arming ( Ethiopia)
H igh ox enM edium ox enL ow ox en
A number of features stand out in Figure 8. Perhaps most striking is the predominance of high oxen systems in Ethiopia. In Kenya, both the agropastoral and mixed farming systems show a marked tendency to make good use of oxen or dairy cattle – in contrast to Somalia, South Sudan, Sudan and western Uganda, where the mixed farming areas are less specialized. Uganda’s cattle corridor stands out as an area of agropastoralism, running from the southwest to the northeast of the country.

21
Chapter 3 Characterizing cattle production systems
In Chapter 2, twelve cattle production systems were identified and mapped. This chapter describes the basic production parameters that were assigned to each system. As far as possible, the parameters were selected from studies of production systems in tsetse-infested areas. They form the baseline from which, in the absence of trypanosomosis, an improvement would be expected. In Chapter 4, the impact on these parameters of removing trypanosomosis is investigated, and used to estimate the economic impact of trypanosomosis on cattle production.
3.1 PRICES AND PRODUCTION PARAMETERS Before incorporating variations based on different levels of work oxen use and the presence of smallholder dairy cattle, production parameters for the three main livestock production systems (pastoral, agropastoral and mixed) were derived. Various sources were consulted. Of particular help across all systems were Otte and Chilonda (2002) and Peeler and Omore (1997). For the pastoralist systems within the tsetse-infested zones, additional useful sources were Coppock (1994), Hanks and Hogg (1992) and Roderick et al. (1998, 1999, 2000). For the agropastoralist and mixed farming systems, Itty (1992), Itty et al. (1995), Grimaud et al. (2007), GRM (1994), Laker (1998), Machila (2005), Maichomo et al. (2005), Muraguri (2000), Musa et al. (2006), Omore et al. (1999), Rege et al. (2001), Thuranira (2005) and Thuranira-McKeever et al. (2010) provided useful information. Although there have been fewer studies in recent years, those such as Okello et al. (2015), and updated versions of the Ethiopian Central Statistical Agency (ECSA) agricultural sample census survey indicate that the parameters recorded remain valid.
In the sections below, the parameters found in the literature are discussed. These necessarily vary greatly from situation to situation and from study to study. This reflects not just the differences in the situations, due to location and possibly other factors, such as whether the study was undertaken during a high or low rainfall year, but also the impact of human decision-making – such as whether to retain or cull stock, depending on current needs for cash.
In order to derive parameters for use in the herd models, the calving, mortality and offtake rates obtained from the literature were tried in each model, so as to check whether they yielded results that were consistent with independently observed herd population growth rates, offtake rates and, in particular, herd compositions. The parameters were revised using an iterative process, until consistent results were obtained and then adjusted to provide a baseline ‘with trypanosomosis’ steady state herd, with constant birth, death, offtake and population growth rates.

Intervening against bovine trypanosomosis in eastern Africa: mapping the costs and benefits22
The parameters thus finally selected as inputs for the ‘with trypanosomosis’ situation for the main cattle production systems are given in Table 3. These were chosen as representative of the tsetse-infested areas of the countries studied.
Cattle mortality rates in the IGAD region tend to be high, reflecting not just the presence of trypanosomosis, but also of tick-borne diseases (TBDs), especially East Coast fever (ECF) (Minjauw and McLeod, 2003) and, locally, very high stocking rates leading to nutritional stress, especially in parts of the Ethiopian highlands (Wilson et al., 2002). Adult mortality rates, at well over 5 percent, are noticeably higher than in West Africa (Shaw et al., 2006). Calf mortality rates are high and, even where there is a large proportion of work oxen, they show the usual divergence between female and male calf death rates, with the former faring better. Coppock (1994) cites a number of
TABLE 3Key baseline input parameters for basic cattle systems with trypanosomosis
Parameter Basic System
Mixed
Pastoral AgropastoralGrade dairyGeneral Ethiopia
regionMortality (% per year)
Female calves 20 18 16 24 21
Male calves 25 20 18 26 26
Adult females 7.5 7.0 8.0 9.0 12
Work oxen 9.0 8.5 9.0 10 -
Fertility and milk
Calving rate (% per year) 54 52 51 49 53
Lactation offtake (litres) 275 285 300 280 1900
Weight of adult female (kg) 215 240 220 205 295
Days oxen work per year 80 100 130 80 0
Prices and costs (US$)
Litre of milk 0.33 0.33 0.33 0.33 0.33Average ox day’s worka 2.1 2.1 2.1 2.6 -
Breeding female 225 240 255 250 570
Breeding male 275 295 320 300 450
Working ox 270 300 370 360 -Basic production costsb 18 22 25 20 75
Dose of trypanocidec 1.45 2.35 3.85 2.85 6.35
Number of trypanocide doses per year
Work oxen 2.0 2.2 2.0 2.5 -Adult females 1.5 1.8 1.5 2.0 2.2
Rest of the herd 1.25 1.5 1.25 1.25 1.75a The price difference reflects the proportion of ploughing days at US$2.75 to other days at $1.50.b These double for work oxen.c The variation in price reflects the cost of administering the trypanocide, which increases in production systems where animal health workers rather than livestock keepers undertake this task.
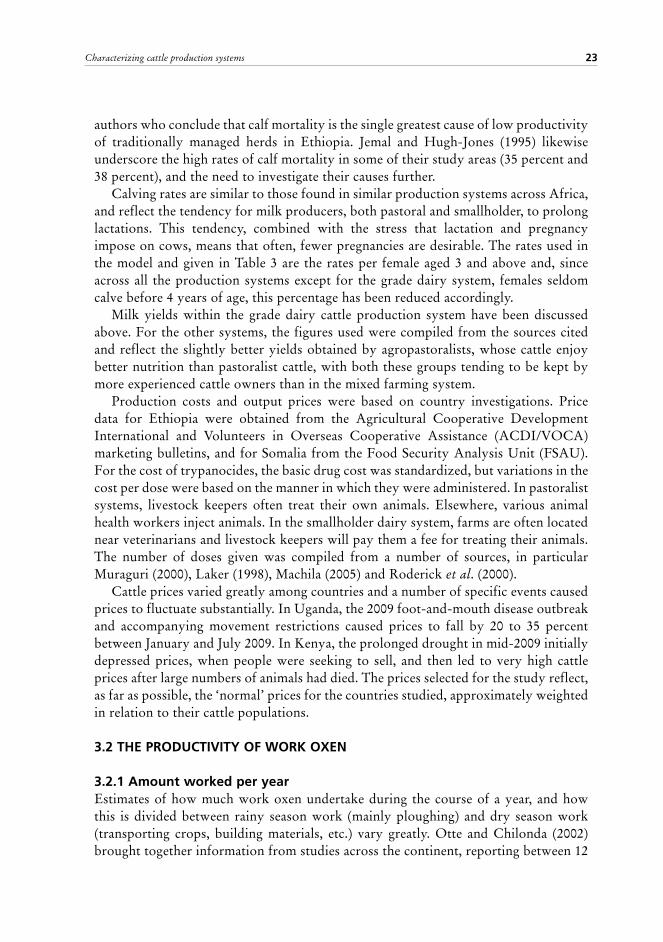
23Characterizing cattle production systems
authors who conclude that calf mortality is the single greatest cause of low productivity of traditionally managed herds in Ethiopia. Jemal and Hugh-Jones (1995) likewise underscore the high rates of calf mortality in some of their study areas (35 percent and 38 percent), and the need to investigate their causes further.
Calving rates are similar to those found in similar production systems across Africa, and reflect the tendency for milk producers, both pastoral and smallholder, to prolong lactations. This tendency, combined with the stress that lactation and pregnancy impose on cows, means that often, fewer pregnancies are desirable. The rates used in the model and given in Table 3 are the rates per female aged 3 and above and, since across all the production systems except for the grade dairy system, females seldom calve before 4 years of age, this percentage has been reduced accordingly.
Milk yields within the grade dairy cattle production system have been discussed above. For the other systems, the figures used were compiled from the sources cited and reflect the slightly better yields obtained by agropastoralists, whose cattle enjoy better nutrition than pastoralist cattle, with both these groups tending to be kept by more experienced cattle owners than in the mixed farming system.
Production costs and output prices were based on country investigations. Price data for Ethiopia were obtained from the Agricultural Cooperative Development International and Volunteers in Overseas Cooperative Assistance (ACDI/VOCA) marketing bulletins, and for Somalia from the Food Security Analysis Unit (FSAU). For the cost of trypanocides, the basic drug cost was standardized, but variations in the cost per dose were based on the manner in which they were administered. In pastoralist systems, livestock keepers often treat their own animals. Elsewhere, various animal health workers inject animals. In the smallholder dairy system, farms are often located near veterinarians and livestock keepers will pay them a fee for treating their animals. The number of doses given was compiled from a number of sources, in particular Muraguri (2000), Laker (1998), Machila (2005) and Roderick et al. (2000).
Cattle prices varied greatly among countries and a number of specific events caused prices to fluctuate substantially. In Uganda, the 2009 foot-and-mouth disease outbreak and accompanying movement restrictions caused prices to fall by 20 to 35 percent between January and July 2009. In Kenya, the prolonged drought in mid-2009 initially depressed prices, when people were seeking to sell, and then led to very high cattle prices after large numbers of animals had died. The prices selected for the study reflect, as far as possible, the ‘normal’ prices for the countries studied, approximately weighted in relation to their cattle populations.
3.2 THE PRODUCTIVITY OF WORK OXEN
3.2.1 Amount worked per yearEstimates of how much work oxen undertake during the course of a year, and how this is divided between rainy season work (mainly ploughing) and dry season work (transporting crops, building materials, etc.) vary greatly. Otte and Chilonda (2002) brought together information from studies across the continent, reporting between 12

Intervening against bovine trypanosomosis in eastern Africa: mapping the costs and benefits24
and 60 days’ work in lowland Africa and 60 to 180 days’ work in highland areas. Many studies focus on ploughing and crop related work, so that dry season activities were left out. In West Africa, Shaw et al. (2006) found high numbers of days being reported (Benin: 180; Burkina Faso: 70-120, Ghana: 80-180; Togo:120).
For the IGAD region, information on draught use was drawn from a number of studies in Ethiopia. Two of these focused on tsetse-infested areas (Morton, 2001 and Rutebuka, 2006). The number of days reported as worked ranged from 34 to 180 (Table 4). It is difficult to generalize, although it did seem that the days worked were higher in the highland sites. There is a general consensus among almost all the sources that the average time per day spent on ploughing is 5 to 6 hours, except in Kenya, where using four oxen, a shorter ploughing day is often worked.
Wilson et al. (2002) comment on a number of studies and strongly emphasizes how the need for draught power in Ethiopia dominates cattle production, and not always in a beneficial sense. “Draught power is truly a critical precondition of crop production in Ethiopia because of the emphasis on small grains cereal production and the mostly heavy soils.” The high proportion of draught males necessarily means there are fewer adult females as a proportion of the herd, and this in turn depresses population growth. He goes on to say that “the oxen, which comprise the bulk of the herd in both numbers and live weight biomass, are used for a limited number of hours on only a few days in the year”.
Overstocking, reflecting the high demand for traction, therefore reduces productivity: “Oxen do receive priority in supplementary feeding of hay and crop residues. The amounts available and their quality are, however, inadequate to mitigate completely the stressed condition of the oxen that is primarily due to under and malnutrition that is probably compounded by subclinical disease and the presence of internal and external parasites. Draught animals are thus usually most debilitated at the time of the year when they are called upon for work.” This perfectly expresses why the issue of tsetse and trypanosomosis is so critical. Firstly, in Ethiopia, livestock populations are constrained by the lack of tsetse-free grazing resources. Secondly, since work oxen are kept in tsetse-infested zones, trypanosomosis is a major source of clinical and subclinical disease, surfacing just at the time when work demands are greatest.
TABLE 4Annual workload for draught cattle in Ethiopia
Source Location Information Implied total days/ox/year
Rutebuka (2006)* Wilson et al. (2002) GRM (1994)
Southern Rift Valley North Wollo
5 or 6 hours worked per day on ploughing Oxen work 25% to 30% of time 600 - 650 hours per year
34 90-110
100-130
Goe (1987)Gryssels (1988)
Highlands Debre Berhan
60 days ploughing and threshing, 120 days during the rest of the year 900 hours per year
180 150-180
Morton (2001) Alemu et al. (1998)
Konso Highlands
2 - 5 months per year, 5 to 6 days a week Days worked
45-126 60-70
Urga et al. (2007) Debre Berhan 3.75 months during the peak season only 59 (peak season)
Note: *This is based on a partial analysis of unpublished data on the number of hours and days worked in the Southern Tsetse Eradication Project (STEP) area of Ethiopia, kindly supplied by U. Feldmann and A. Rutebuka.

25Characterizing cattle production systems
The information from Kenya and Uganda on workloads showed that, in general, fewer animals were kept, but that they were working more days in the year. In Uganda, 150 working days a year is considered normal. In Soroti District, oxen work 85 days a year ploughing and a further 48 days on other activities (personal communication, Charles Waiswa). A selection of questionnaires administered to cattle keepers in the districts of Apac, Amolatar, Kaberamaido, Dokolo and Lira showed an average of 168 days worked per year (unpublished data, Alexandra Shaw and Charles Waiswa). In Kenya, work oxen spent 5 to 6 weeks a year ploughing and worked for ten days a month on other activities, so that a total of 110 to 130 days are generally worked (personal communication, J. Kanunga).
The number of oxen used for ploughing is variable. In Ethiopia, ploughing is usually done by a pair of oxen, although shortages of oxen mean that some farmers plough with one animal. In Uganda, cattle usually plough in pairs, although sometimes four animals are used. In Kenya, four oxen are traditionally used, though this figure sometimes rises to six. One of the Farming in Tsetse Controlled Areas (FITCA) project’s initiatives in Kenya was to promote the use of a single pair of oxen for various activities (FITCA, 2005).
From the discussion above, which is further substantiated by a body of literature, it is clear that oxen in Ethiopia are used in very different ways from those in the rest of the tsetse-infested regions of the IGAD countries. The very high stocking rates and consequent land pressure mean that resources for feeding work oxen are stretched and their productivity – as well as survivability – is adversely affected. The oxen work for a shorter period of the year, and this work consists overwhelmingly of ploughing the land, often several times (Wilson et al., 2002). This explains the decision to model the Ethiopian mixed farming system separately from that of the other four countries, so as to reflect both a different use of work oxen and lower overall cattle productivity, in particular higher mortality rates.
3.2.2. The value of work oxen’s labourIn most parts of Africa where oxen are used, a variety of arrangements for sharing or hiring out the animals has evolved, and it is possible to assign a monetary value to these. Accordingly, information gathering for this analysis in the IGAD member states focused on hire costs and sharing arrangements.
These arrangements are also described in the literature. Urga and Abayneh (2007), writing about Ethiopia, state that there were “1.35 oxen per household, … lower than a pair normally required for tillage work … owing to the shortage of oxen, about 23% of the farmers were engaged in different forms of draught oxen sharing arrangements”. Similarly, Itty (1992, 1995) writes about the Ghibe area of Ethiopia: “Peasants who did not have their own pair of oxen had to rely on the goodwill of friends and relatives to either rent or lend these. Two kinds of payment existed for this service which was generally temporary (in case of loss of oxen for example): either a share of the crops harvested was given to the oxen owner, or, more often, the borrower had to plough the owner’s fields during two or three days for each day he ploughed for himself. In case no one was disposed to lend or rent oxen, the peasant was forced to seek employment

Intervening against bovine trypanosomosis in eastern Africa: mapping the costs and benefits26
until able to buy his own pair of oxen”. Wilson et al. (2002) also mentions “two day’s labour as being provided in exchange for one day’s draught use”. Morton (2001), writing about Konso in Ethiopia, undertook a more detailed estimate of the value of ox labour. Where money was paid, it was between 10 and 12 Ethiopian birr per day for a pair of oxen, plus food for the handler; when paid in kind, the ratio of two human labour days to one for a pair of oxen was maintained. The unpublished data from the Rutebuka (2006) study indicated rates of 44-55 birr per day. Describing the Kamba in Kenya’s Kwale District, Itty (1992) states that “renting of oxen was common”. Ocaido et al. (2005) describe oxen hire as standard practice in Serere County in Uganda.
Information obtained in 2008/09 from in-country sources confirmed these orders of magnitude and showed remarkable similarities among countries. In South Sudan, the rate of two days of labour for one day’s oxen use was also reported. In Ethiopia, the rate was between two and three times the local labour rate, depending on whether one or two oxen were used. Money charges per acre were quoted in Kenya: standard rate of 2 400 Kenyan shillings (US$30.50) using four oxen, which would take about six hours spread over two days, and in Uganda where 30 000 Ugandan shillings ($15.40) was charged using two oxen, which would take 10-12 hours spread over 2 to 2.5 days. In all countries, the usual practice is for the oxen to come with their own handler and equipment, so that the charge levied is effectively for the animals’ and their owner’s labour – although the time spent ploughing is less than a normal working day and often food has to be provided for the work oxen handler. The various rates were taken, converted to US dollars, adjusted for the time required to do the work, deducting the handler’s time and food, and weighted by the size of the different countries’ oxen populations. A weighted mean estimate of $2.75 as the value of a single oxen ploughing day was thus obtained. Information on dry season activities and their value was patchy, varying from a charge for transporting sacks of grain, a charge per mile to the cost of hiring a pair of oxen with a cart to transport building materials. A value of $1.50 per oxen day was assigned to dry season work. These estimated values are robust and particularly encouraging, because remarkably similar results were obtained for the cost of ploughing in all three countries – and these again were similar to those found for West Africa (Shaw et al., 2006).
The values selected for the number of oxen days worked in the absence and presence of trypanosomosis are given in Tables 3 and 9.
3.3 THE PRODUCTIVITY OF SMALLHOLDER GRADE DAIRY CATTLEThere is a substantial volume of literature on the development of dairying, especially in Kenya. In this work, the parameters used have been based as far as possible on studies undertaken in areas affected by tsetse, rather than in the tsetse-free highlands. The main studies consulted were: Laker (1998), Muraguri (2000), Machila (2005), Thuranira (2005), Thuranira-McKeever et al. (2010), Mudvadi et al. (2001), Fonteh et al. (2005), Grimaud et al. (2007), Mburu et al. (2007a, 2007b), Muraguri et al. (2004, 2005), Nakinganda et al. (2006), Ongadi et al. (2006, 2007) and Swai et al. (2005).
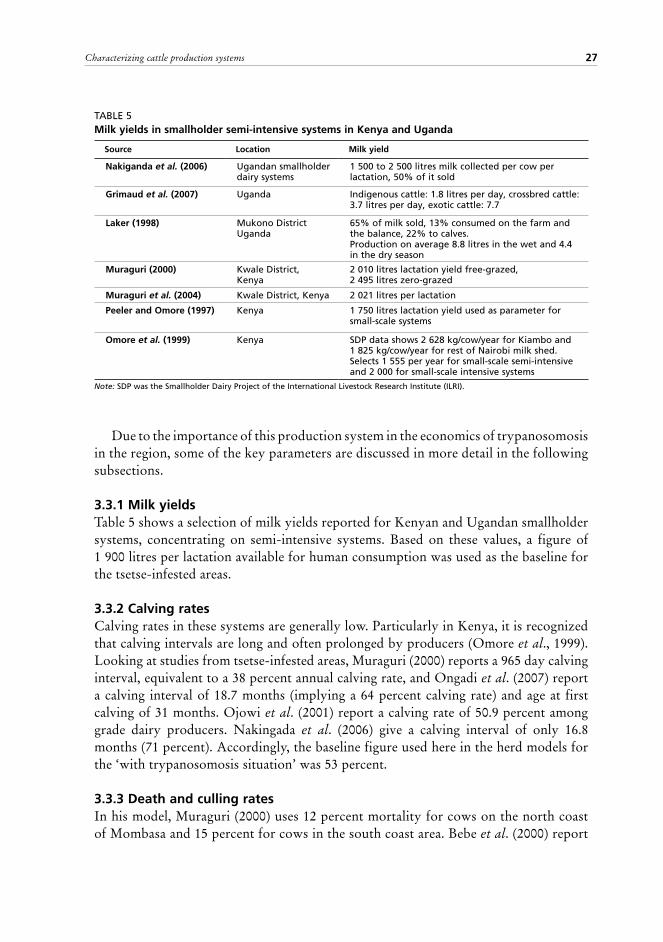
27Characterizing cattle production systems
Due to the importance of this production system in the economics of trypanosomosis in the region, some of the key parameters are discussed in more detail in the following subsections.
3.3.1 Milk yieldsTable 5 shows a selection of milk yields reported for Kenyan and Ugandan smallholder systems, concentrating on semi-intensive systems. Based on these values, a figure of 1 900 litres per lactation available for human consumption was used as the baseline for the tsetse-infested areas.
3.3.2 Calving ratesCalving rates in these systems are generally low. Particularly in Kenya, it is recognized that calving intervals are long and often prolonged by producers (Omore et al., 1999). Looking at studies from tsetse-infested areas, Muraguri (2000) reports a 965 day calving interval, equivalent to a 38 percent annual calving rate, and Ongadi et al. (2007) report a calving interval of 18.7 months (implying a 64 percent calving rate) and age at first calving of 31 months. Ojowi et al. (2001) report a calving rate of 50.9 percent among grade dairy producers. Nakingada et al. (2006) give a calving interval of only 16.8 months (71 percent). Accordingly, the baseline figure used here in the herd models for the ‘with trypanosomosis situation’ was 53 percent.
3.3.3 Death and culling ratesIn his model, Muraguri (2000) uses 12 percent mortality for cows on the north coast of Mombasa and 15 percent for cows in the south coast area. Bebe et al. (2000) report
TABLE 5Milk yields in smallholder semi-intensive systems in Kenya and Uganda
Source Location Milk yield
Nakiganda et al. (2006) Ugandan smallholder dairy systems
1 500 to 2 500 litres milk collected per cow per lactation, 50% of it sold
Grimaud et al. (2007) Uganda Indigenous cattle: 1.8 litres per day, crossbred cattle: 3.7 litres per day, exotic cattle: 7.7
Laker (1998) Mukono District Uganda
65% of milk sold, 13% consumed on the farm and the balance, 22% to calves. Production on average 8.8 litres in the wet and 4.4 in the dry season
Muraguri (2000) Kwale District, Kenya
2 010 litres lactation yield free-grazed, 2 495 litres zero-grazed
Muraguri et al. (2004) Kwale District, Kenya 2 021 litres per lactation
Peeler and Omore (1997) Kenya 1 750 litres lactation yield used as parameter for small-scale systems
Omore et al. (1999) Kenya SDP data shows 2 628 kg/cow/year for Kiambo and 1 825 kg/cow/year for rest of Nairobi milk shed. Selects 1 555 per year for small-scale semi-intensive and 2 000 for small-scale intensive systems
Note: SDP was the Smallholder Dairy Project of the International Livestock Research Institute (ILRI).

Intervening against bovine trypanosomosis in eastern Africa: mapping the costs and benefits28
mortality rates of cows in free-grazing, semi-zero and zero-grazing systems of 11, 15 and 12 percent respectively, and culling/sale rates of 8, 12 and 13 percent respectively in these systems. They calculate that per cow, only 25 percent of heifers born in the free-grazing system reach breeding age, and that this percentage falls to 16 percent for the other two systems. Approximately half of these exits are in the forms of sales; the other half are due to mortality. Nearly 40 percent of the cows and heifers sold (36 and 38 percent respectively) are culled due to disease.
Pre-weaning mortality rates are high. Omore et al. (1999) estimate rates of 15 percent in exotic crosses in the small-scale semi-intensive system and 20 percent in the small-scale intensive system. Bebe et al. (2000) reported 29 percent heifer pre-weaning mortality in the free-grazing system and 21 percent in the semi-zero and zero-grazing systems. In this study, for the baseline ‘with trypanosomosis’ herd model, mortality during the first year of life was fixed, after the iterative modelling described in Section 3.1, at 21 percent for female calves, 26 percent for male calves and 12 percent for adult females. ECF takes a particularly high toll of cows.
Herd compositions are also indicative of herd dynamics: Laker (1998) recorded that 52 percent of a herd are cows, while for Muraguri (2000), this fraction was 49.5 percent. The baseline model here results in 49.7 percent of the herd being cows.
3.3.4 Production costsA number of detailed studies have investigated the costs of smallholder milk production, especially in Kenya. For Kiambu, Nakuru and Nyandarua Districts, Staal et al. (2003) report variable costs of more than $200 per cow per year. Similarly high levels are found by Mburu et al. (2007a). In Vihiga District, Ongadi et al. (2006) found costs per cow per year of $107 for systems using grazing only, $152 for those using grazing with some stall feeding, $184 for stall feeding with some grazing and $192 for stall feeding only. Removing the labour component reduces the costs to $33, $46 and $25 respectively, these being the costs for feed, veterinary inputs, artificial insemination and replacement stock. In Kwale District, Muraguri (2000) calculated variable costs (feed, veterinary and AI) of $32 per head in free-grazed herds and $43 in zero-grazed herds.
In the 1997 edition of their manual, Peeler and Omore used a cost of $45 per head. Information obtained in 2009 from in-country sources arrived at a figure of $66 per head for dairying in Kenya.
In Uganda, Laker (1998) estimated variable costs of $113 per head per year in Mukono District, with fixed costs of $164 and labour of $40 per head. For farms in Jinga and Mpigi Districts, Fonteh et al. (2005) recorded variable costs of $40 and $90 per cow respectively, and fixed costs of $17 and $19.
For the modelling exercise, an estimate has to be made of production costs per bovine, and this is intended to capture the full value of variable costs and the main fixed costs. A value of $75 per head of the herd was selected – a figure falling somewhere between the reported extremes and close to the most often cited amounts.

29
Chapter 4 Identifying the benefits
The economic impact of trypanosomosis on cattle production in the IGAD region was estimated in a three step process. Firstly, the various studies on the disease’s impact were reviewed. Secondly, herd models were constructed for estimating the potential benefits to livestock keepers. And thirdly, the herd models were run for each of the cattle production systems.
4.1 THE IMPACT OF TRYPANOSOMOSIS ON PRODUCTIVITYEstimating how a particular disease affects livestock productivity in the field, rather than experimental conditions, inevitably depends on data from various studies undertaken in different circumstances and on different populations. Such studies are relatively expensive, and rely on careful comparisons in an attempt to isolate the impact of disease. They therefore tend to be relatively few in number and very location specific. For trypanosomosis, Swallow (2000) produced a comprehensive summary of existing knowledge, which was updated in Shaw (2004). In Table 6, some of the results of studies of particular relevance to the IGAD region are summarized. Table 7 gives details for Somalia from Hanks and Hogg (1992), as this source is difficult to obtain.
Although quite a few such studies exist, the wide variability in the way in which trypanosomosis affects productivity, coupled with the wide range of production systems in the region, means that knowledge about impact in East Africa remains comparatively sparse. As Swallow (2000) found, it is difficult to generalize from studies conducted in different ways and in different locations. There have been few recently published studies measuring the productivity impacts of trypanosomosis on cattle. Not listed here is the large number of historical and more recent studies that tested animals in order to establish the prevalence of the disease from blood samples. The latter provides a measure of disease occurrence, but not a direct measure of disease impact.
4.2 STRUCTURE OF THE HERD MODELS AND ECONOMIC METHODOLOGYThe usefulness of bio-economic herd simulation models in analysing and comparing livestock production systems has long been recognized (Dahl and Hjort, 1976, Upton, 1989). Livestock productivity in Africa has been comprehensively modelled (Otte and Chilonda, 2002) using the FAO Livestock Development Planning System Version 2 (LDPS-2) model (Lalonde and Sukigara, 1997). Such models have been used to analyse the impacts of trypanosomosis on cattle production since the early 1980s (Camus, 1981, Brandl, 1985, Rushton, 2009). Their use has been described in Shaw et al., 2006. Some examples are provided in Itty (1992) and Kristjanson et al. (1999) – both of whom
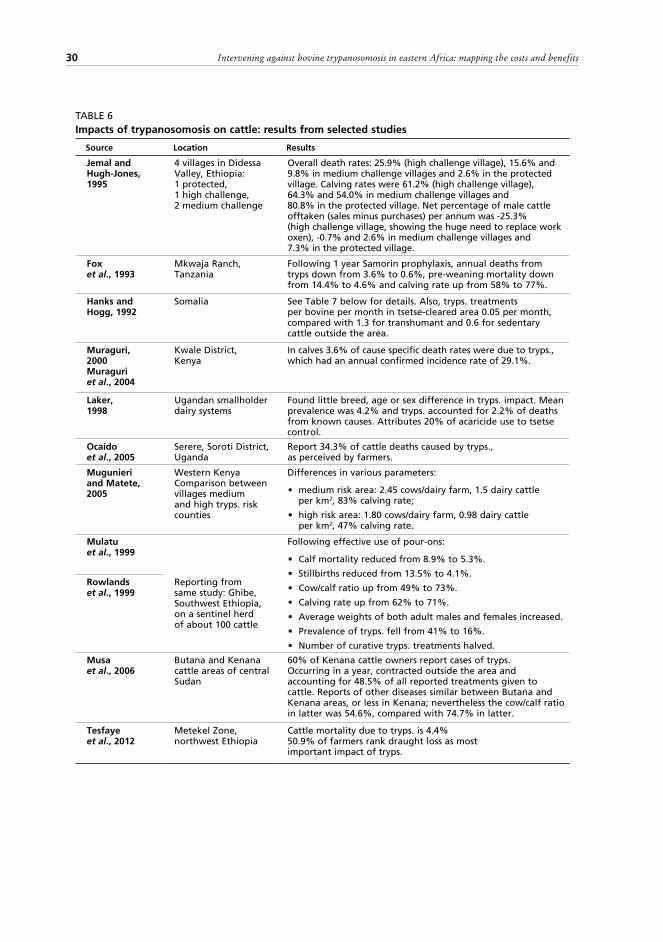
Intervening against bovine trypanosomosis in eastern Africa: mapping the costs and benefits30
TABLE 6Impacts of trypanosomosis on cattle: results from selected studies
Source Location Results
Jemal and Hugh-Jones, 1995
4 villages in Didessa Valley, Ethiopia: 1 protected, 1 high challenge, 2 medium challenge
Overall death rates: 25.9% (high challenge village), 15.6% and 9.8% in medium challenge villages and 2.6% in the protected village. Calving rates were 61.2% (high challenge village), 64.3% and 54.0% in medium challenge villages and 80.8% in the protected village. Net percentage of male cattle offtaken (sales minus purchases) per annum was -25.3% (high challenge village, showing the huge need to replace work oxen), -0.7% and 2.6% in medium challenge villages and 7.3% in the protected village.
Fox et al., 1993
Mkwaja Ranch, Tanzania
Following 1 year Samorin prophylaxis, annual deaths from tryps down from 3.6% to 0.6%, pre-weaning mortality down from 14.4% to 4.6% and calving rate up from 58% to 77%.
Hanks and Hogg, 1992
Somalia See Table 7 below for details. Also, tryps. treatments per bovine per month in tsetse-cleared area 0.05 per month, compared with 1.3 for transhumant and 0.6 for sedentary cattle outside the area.
Muraguri, 2000 Muraguri et al., 2004
Kwale District, Kenya
In calves 3.6% of cause specific death rates were due to tryps., which had an annual confirmed incidence rate of 29.1%.
Laker, 1998
Ugandan smallholder dairy systems
Found little breed, age or sex difference in tryps. impact. Mean prevalence was 4.2% and tryps. accounted for 2.2% of deaths from known causes. Attributes 20% of acaricide use to tsetse control.
Ocaido et al., 2005
Serere, Soroti District, Uganda
Report 34.3% of cattle deaths caused by tryps., as perceived by farmers.
Mugunieri and Matete, 2005
Western Kenya Comparison between villages medium and high tryps. risk counties
Differences in various parameters:
• medium risk area: 2.45 cows/dairy farm, 1.5 dairy cattle per km2, 83% calving rate;
• high risk area: 1.80 cows/dairy farm, 0.98 dairy cattle per km2, 47% calving rate.
Mulatu et al., 1999
Following effective use of pour-ons:
• Calf mortality reduced from 8.9% to 5.3%.
• Stillbirths reduced from 13.5% to 4.1%.
• Cow/calf ratio up from 49% to 73%.
• Calving rate up from 62% to 71%.
• Average weights of both adult males and females increased.
• Prevalence of tryps. fell from 41% to 16%.
• Number of curative tryps. treatments halved.
Rowlands et al., 1999
Reporting from same study: Ghibe, Southwest Ethiopia, on a sentinel herd of about 100 cattle
Musa et al., 2006
Butana and Kenana cattle areas of central Sudan
60% of Kenana cattle owners report cases of tryps. Occurring in a year, contracted outside the area and accounting for 48.5% of all reported treatments given to cattle. Reports of other diseases similar between Butana and Kenana areas, or less in Kenana; nevertheless the cow/calf ratio in latter was 54.6%, compared with 74.7% in latter.
Tesfaye et al., 2012
Metekel Zone, northwest Ethiopia
Cattle mortality due to tryps. is 4.4% 50.9% of farmers rank draught loss as most important impact of tryps.
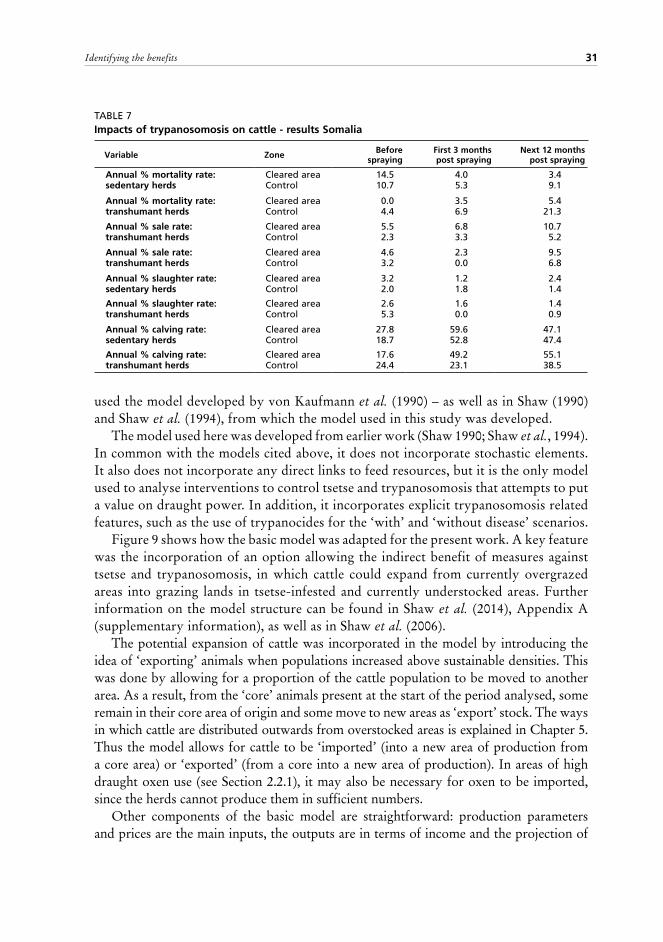
31Identifying the benefits
TABLE 7Impacts of trypanosomosis on cattle - results Somalia
Variable Zone Before spraying
First 3 months post spraying
Next 12 months post spraying
Annual % mortality rate: sedentary herds
Cleared area Control
14.5 10.7
4.0 5.3
3.4 9.1
Annual % mortality rate: transhumant herds
Cleared area Control
0.0 4.4
3.5 6.9
5.4 21.3
Annual % sale rate: transhumant herds
Cleared area Control
5.5 2.3
6.8 3.3
10.7 5.2
Annual % sale rate: transhumant herds
Cleared area Control
4.6 3.2
2.3 0.0
9.5 6.8
Annual % slaughter rate: sedentary herds
Cleared area Control
3.2 2.0
1.2 1.8
2.4 1.4
Annual % slaughter rate: transhumant herds
Cleared area Control
2.6 5.3
1.6 0.0
1.4 0.9
Annual % calving rate: sedentary herds
Cleared area Control
27.8 18.7
59.6 52.8
47.1 47.4
Annual % calving rate: transhumant herds
Cleared area Control
17.6 24.4
49.2 23.1
55.1 38.5
used the model developed by von Kaufmann et al. (1990) – as well as in Shaw (1990) and Shaw et al. (1994), from which the model used in this study was developed.
The model used here was developed from earlier work (Shaw 1990; Shaw et al., 1994). In common with the models cited above, it does not incorporate stochastic elements. It also does not incorporate any direct links to feed resources, but it is the only model used to analyse interventions to control tsetse and trypanosomosis that attempts to put a value on draught power. In addition, it incorporates explicit trypanosomosis related features, such as the use of trypanocides for the ‘with’ and ‘without disease’ scenarios.
Figure 9 shows how the basic model was adapted for the present work. A key feature was the incorporation of an option allowing the indirect benefit of measures against tsetse and trypanosomosis, in which cattle could expand from currently overgrazed areas into grazing lands in tsetse-infested and currently understocked areas. Further information on the model structure can be found in Shaw et al. (2014), Appendix A (supplementary information), as well as in Shaw et al. (2006).
The potential expansion of cattle was incorporated in the model by introducing the idea of ‘exporting’ animals when populations increased above sustainable densities. This was done by allowing for a proportion of the cattle population to be moved to another area. As a result, from the ‘core’ animals present at the start of the period analysed, some remain in their core area of origin and some move to new areas as ‘export’ stock. The ways in which cattle are distributed outwards from overstocked areas is explained in Chapter 5. Thus the model allows for cattle to be ‘imported’ (into a new area of production from a core area) or ‘exported’ (from a core into a new area of production). In areas of high draught oxen use (see Section 2.2.1), it may also be necessary for oxen to be imported, since the herds cannot produce them in sufficient numbers.
Other components of the basic model are straightforward: production parameters and prices are the main inputs, the outputs are in terms of income and the projection of

Intervening against bovine trypanosomosis in eastern Africa: mapping the costs and benefits32
the herd, giving its annual growth rate and final herd numbers. The projections are all undertaken for a period of 20 years.
In order to calculate the economic impact of trypanosomosis, four separate models are required, depending on the ways in which cattle may relocate. The first distinction is:
• the core herd remaining in the core area (which could be all the cattle)• the export herd in its export area (which could be zero cattle), And for each of these:• in the presence of trypanosomosis (the ‘with disease’ situation)• in the absence of trypanosomosis (the ‘without disease’ situation)Figure 10 shows the linkages between these four models. If drawn to scale the export
herd boxes would all be slightly smaller, since the modelling assumes that while some animals leave the core area, a substantial number remain. The ‘with’ trypanosomosis herds are also smaller, in each case, than the ‘without’ trypanosomosis herds, which are both larger and more productive – hence the potential benefits from dealing with the disease.
In each case, the potential benefits derived from removal of the disease were simply calculated as the difference, year by year over 20 years, between output without trypanosomosis and output with the disease. This stream of benefits was then discounted to its present value, as explained in Section 1.2.
In order to map the benefits, the figures obtained were expressed as a single monetary amount per bovine present at the end of the modelled period. This was done by assigning a US dollar value to each of the three options for each cattle production system:
• a ‘no exports’ baseline situation, where the animals all stay in the core area, and
HERD INPUT PARAMETERS;Mortality, offtake and fertility
rates; milk yield; draught animalnumbers and days worked
PRICES
INCOME CALCULATION;Value of milk, draught power,animals sold, slaughtered or
exported; minus animals imported;plus change in herd value;
minus input costs
HERD PROJECTIONOVER 20 YEARS
Cattle ‘exported’
Cattle slaughtered or sold = offtake
Cattle ‘imported’
Young males importedfor draught
FIGURE 9 Structure of the basic herd model

33Identifying the benefits
‘CORE’ HERDincome over 20 years
withouttrypanosomosis
‘EXPORT’ HERDincome over 20 years
withouttrypanosomosis
‘EXPORT’ HERDincome over 20 years
withtrypanosomosis
‘EXPORT’ HERDpotential benefit
from trypanosomosis removal
Cattle ‘exported’
Cattle ‘imported’
Cattle ‘exported’
Cattle ‘imported’
‘CORE’ HERDincome over 20 years
withtrypanosomosis
‘CORE’ HERD:potential benefit
from trypanosomosis removal
FIGURE 10 Linkage between the four herd models for each cattle production system
benefits are mapped as US dollar per bovine present at the end of 20 years in that core area;• a ‘with exports’ situation, where benefits are mapped for bovines remaining in the
core area at the end of 20 years; and• a ‘with exports’ situation, where benefits are mapped per bovine ‘exported’ and
found in the ‘export’ area at the end of 20 years.
4.3 ASSUMPTIONS USED IN THE HERD MODELSUsing the information on the impact of trypanosomosis from Tables 6 and 7, and from the other sources (Swallow, 2000; Shaw, 2004; Shaw et al., 2006), a set of coherent assumptions was made on how the disease might impact key parameters in each production system. These are given in Table 8.
The grade dairy system is listed as a separate category, since exotic crossbred cattle are distinct from the zebu cattle used in the other production systems. The two populations of cattle – grade and local breeds – exist alongside each other, often within the same farming household. In the case of Vihiga District in Kenya, Ongadi et al. (2007) noted not only the grade dairy cattle kept by smallholders, but also the zebu cattle kept alongside them. Households practising extensive grazing management kept similar numbers of each (3.6 and 3.5 head, respectively). This proportion gradually shifted as production became more intensive; those practising stall feeding only kept 3.7 grade and 1.9 zebu cattle. Labour is a major limiting factor in keeping cattle, especially dairy cattle, so that with the more intensive systems, fewer zebu cattle were kept – possibly also because grazing in these areas was more limited. Accordingly, the herd model for

Intervening against bovine trypanosomosis in eastern Africa: mapping the costs and benefits34
TABLE 8Assumptions made about the impact of removing trypanosomosis on key production parameters
Basic system
Parameter Pastoral Agropastoral Mixedgeneral
Mixed Ethiopian
region
Gradedairy
Mortality (% per year)Female and female calves Adult females Work oxen
-3% pointsa
-1% point -20%
-3% points -1% point -20%
-3% points -1% point -20%
-4% points -1.5% point -20%
-3% points -2% point -
Fertility and milk Calving rate (% per year)Lactation offtake (litres)
+4% points +7.5%
+4% points +7.5%
+4% points +7.5%
+5% points +7.5%
+4% points +7.5%
Days oxen work per year +7.6 +8.0 +8.7 +6.1 -
Use of trypanocidesbReduced by 90%
Reduced by 95%
Reduced to nil
Reduced to nil
Reduced to nil
a Impacts are described as percentage points, so a reduction of 3 percentage points means that a mortality of, say 15% per annum would be reduced to 12%, or in terms of the overall reduction in the parameter, so that a 7.5% reduction in a milk yield of 100 litres would bring it down to 92.5 litres.b Trypanocide use: experience of local elimination of tsetse has shown that due to the movement of herds in and out of tsetse-infested areas, both pastoralists and agropastoralists continue to use some trypanocides, even if the problem has been removed from their core area. Since this paper is attempting to support prioritization, it does not assume that the disease constraint would disappear everywhere, but estimates what the potential benefits from dealing with it would be, area by area.
TABLE 9Key baseline input parameters for basic cattle systems without trypanosomosis
Basic system
Parameter Pastoral Agropastoral Mixedgeneral
Mixed Ethiopian
region
Gradedairy
Mortality (% per year) Female calves Male calves Adult females Work oxen
17 22 6.5 7.2
15 17 6.0
6.75
13 15 7.0 7.2
20 22 7.5
8
18 23 10 –
Fertility and milk Calving rate (% per year)Lactation offtake (litres)
58
296
56
306
55
322
54
301
57
2 042
Days oxen work per year 87.6 108 138.7 86.1 0
The parameters ‘with’ trypanosomosis are given in Table 3.
the region combined the two populations in the relevant mixed and agropastoral cattle production systems with high dairy populations.
Initially, therefore, the dairying system was modelled as a separate entity, and was only later integrated with the other systems. Based on the distribution of the dairy system, as mapped in Section 2.2.2, the proportion of grade dairy cattle in the ‘high’ dairy areas within the agropastoral and mixed farming systems in Kenya and Uganda was modelled as 30 percent of cattle.
In each case, the assumptions made do not necessarily reflect the very high impacts

35Identifying the benefits
TABLE 10Modelled percentages of work oxen in the herd with and without trypanosomosis
Cattle production system
Pastoral AgropastoralMixed farming:
generalMixed farming:
Ethiopia
T+ T- T+ T- T+ T- T+ T-
Low oxen 4.0 5.0 6.0 7.5 4.0 5.0 5.0 6.25
Medium oxen – – 13.0 15.0 13.0 15.0 15.0 17.25
High oxen – – 22.5 25.0 22.5 25.0 25.0 27.5
High dairy – – 4.2 5.3 2.8 3.5 – –
T+ with trypanosomosis present; T- if trypanosomosis were absent
found in some studies of areas with severe tsetse and trypanosomosis problems – the values selected here attempt to reflect what the situation might be across the range of cattle populations in the region affected by the disease. The effects of trypanosomosis were assumed to be slightly greater in the mixed farming areas of the Ethiopian region, reflecting the severe impacts shown in studies by Jemal and Hugh-Jones (1995), Rowlands et al. (1999) and Mulatu et al. (1999). Impacts were also assumed to be severe in the grade dairy system. In mixed-general farming systems, high levels of cow deaths due to ECF were also factored into the assumptions. These are particularly important in the grade dairy cattle system.
Table 9 shows the parameter values for the situation ‘without’ trypanosomosis, derived from the assumptions detailed in Table 8 and based on the ‘with’ trypanosomosis parameters given in Table 3.
Lastly, Table 10 shows the assumptions made about the proportion of oxen in each of the cattle production systems. Since the agropastoral and mixed farming systems were further subdivided according to the proportion of oxen in the cattle population (see Section 2.2.1), in this table the basic cattle systems are subdivided into their final groupings, according to the levels of oxen and dairy cattle in them.
Assumptions about the proportions of oxen were made after careful study of herd compositions from the productivity studies cited for each region and, in the case of Ethiopia, the census. Thus, within the Ethiopian region, as well as oxen being used differently (with a greater emphasis on ploughing, and for a shorter period), there tended to be a higher proportion of oxen within each band (0-10 %, 10-20 %, >20 %), and this was reflected in the parameters chosen. The proportion of oxen was assumed to increase slightly if trypanosomosis were absent, as more people adopted animal traction. Proportionally, this increase was assumed to be higher at lower levels of oxen use (e.g. 25 percent, from 4 to 5 percent of the herd in the pastoral system, and only 10 percent, from 25 to 27.5 percent in the high oxen band of the Ethiopian mixed farming system). These increases are achieved through lower death rates, a higher proportion of young males being allocated to traction work and, where the proportion of oxen in the herd is high (more than 20 percent), by buying in some young males for animal

Intervening against bovine trypanosomosis in eastern Africa: mapping the costs and benefits36
traction work. Alongside the expansion of cattle into hitherto underused grazing areas, this increase in the use of work oxen represents an indirect benefit of trypanosomosis control.
Unlike the increases in the other production parameter improvements, which were assumed to take place over a period of five years, the increases in the proportion of cattle being used for draught power were modelled to happen more gradually over a period of ten years. This was because the other parameters (deaths, births, milk yields) are directly and inevitably affected by a change in the disease situation, whereas an increased adoption of animal traction, like the cattle spread described in Chapter 5 below, is an indirect effect, which depends on people deciding to take advantage of the lifting of a disease constraint by changing their production methods.
4.4 HERD MODEL RESULTSBased on the assumptions explained in the previous sections, the herd models were run for each cattle production system. The resulting herd population growth rates are given in Table 11. Initially, the results were checked against information in the literature, and some adjustments were made until the results seemed to align with what was reported. In the presence of trypanosomosis, all the production systems except the mixed farming system in Ethiopia grew slightly. It should be remembered that these systems were modelled for tsetse-infested areas, so the parameters for growth, mortality and offtake would not necessarily apply throughout the range of these production systems.
Overall mortality rates in the presence of trypanosomosis were highest in the grade dairy system and mixed farming system in Ethiopia (12.0 and 11.4 percent respectively), again in line with overall rates reported in the literature. Offtake rates (net sales plus slaughter) were highest in the grade dairy system, simply because most male calves are disposed of. In this analysis, changes were not assumed to occur in offtake rates. Offtake is determined by livestock keepers, and the evidence from different studies indicates that it can be expected to increase or decrease or remain largely unchanged in response to improvements in livestock health. Thus, for example, in a groundbreaking study, Dahl and Hjort (1976) showed how fluctuations in rainfall and disease outbreaks result in livestock producers having a permanent incentive to maintain herds that are as large as possible, so that, following a disaster, enough females survive to enable them to rebuild their stocks. More recently, and within the study area, this was observed by Roderick et al. (1998), who also emphasize the complex ways in which cattle may
TABLE 11Calculated herd level summary parameters for the basic cattle systems
% per annum
Pastoral Agropastoral Mixed general Mixed Ethiopia Grade dairy
T+ T- T+ T- T+ T- T+ T- T+ T-
Growth rate 1.4 3.4 1.3 3.3 0.9 3.0 -0.6 2.3 0.5 3.0
Death rate 10.1 8.9 9.0 7.8 9.2 7.9 11.4 9.6 14.0 12.0
Offtake rate 9.6 9.6 9.6 9.7 9.4 9.5 8.3 8.3 12.0 12.7T+ with trypanosomosis present; T- if trypanosomosis were absent
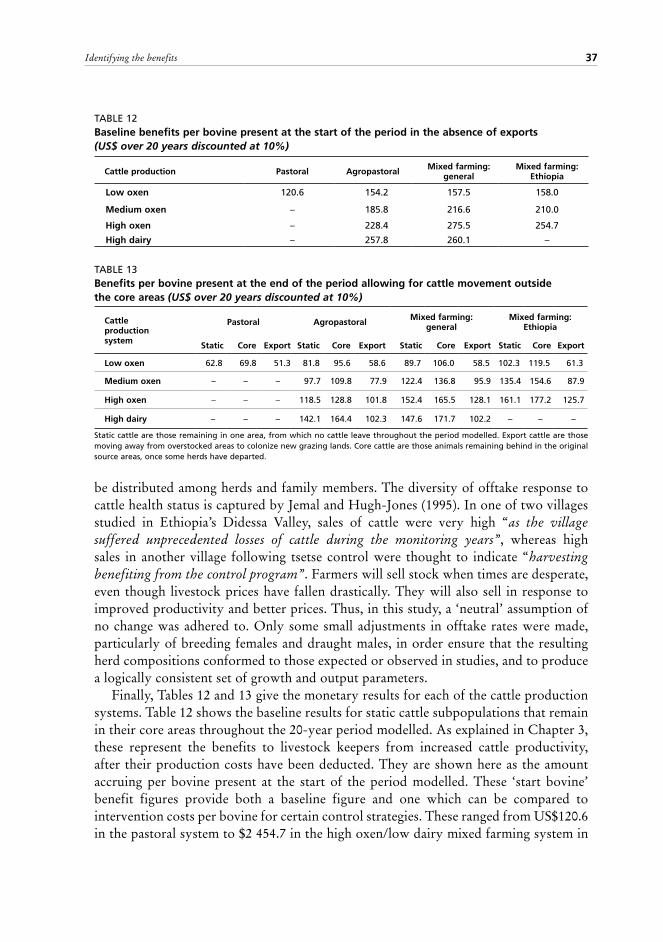
37Identifying the benefits
TABLE 12Baseline benefits per bovine present at the start of the period in the absence of exports (US$ over 20 years discounted at 10%)
Cattle production Pastoral Agropastoral Mixed farming: general
Mixed farming: Ethiopia
Low oxen 120.6 154.2 157.5 158.0
Medium oxen – 185.8 216.6 210.0
High oxen – 228.4 275.5 254.7
High dairy – 257.8 260.1 –
TABLE 13 Benefits per bovine present at the end of the period allowing for cattle movement outside the core areas (US$ over 20 years discounted at 10%)
Cattle production system
Pastoral Agropastoral Mixed farming: general
Mixed farming: Ethiopia
Static Core Export Static Core Export Static Core Export Static Core Export
Low oxen 62.8 69.8 51.3 81.8 95.6 58.6 89.7 106.0 58.5 102.3 119.5 61.3
Medium oxen – – – 97.7 109.8 77.9 122.4 136.8 95.9 135.4 154.6 87.9
High oxen – – – 118.5 128.8 101.8 152.4 165.5 128.1 161.1 177.2 125.7
High dairy – – – 142.1 164.4 102.3 147.6 171.7 102.2 – – –
Static cattle are those remaining in one area, from which no cattle leave throughout the period modelled. Export cattle are those moving away from overstocked areas to colonize new grazing lands. Core cattle are those animals remaining behind in the original source areas, once some herds have departed.
be distributed among herds and family members. The diversity of offtake response to cattle health status is captured by Jemal and Hugh-Jones (1995). In one of two villages studied in Ethiopia’s Didessa Valley, sales of cattle were very high “as the village suffered unprecedented losses of cattle during the monitoring years”, whereas high sales in another village following tsetse control were thought to indicate “harvesting benefiting from the control program”. Farmers will sell stock when times are desperate, even though livestock prices have fallen drastically. They will also sell in response to improved productivity and better prices. Thus, in this study, a ‘neutral’ assumption of no change was adhered to. Only some small adjustments in offtake rates were made, particularly of breeding females and draught males, in order ensure that the resulting herd compositions conformed to those expected or observed in studies, and to produce a logically consistent set of growth and output parameters.
Finally, Tables 12 and 13 give the monetary results for each of the cattle production systems. Table 12 shows the baseline results for static cattle subpopulations that remain in their core areas throughout the 20-year period modelled. As explained in Chapter 3, these represent the benefits to livestock keepers from increased cattle productivity, after their production costs have been deducted. They are shown here as the amount accruing per bovine present at the start of the period modelled. These ‘start bovine’ benefit figures provide both a baseline figure and one which can be compared to intervention costs per bovine for certain control strategies. These ranged from US$120.6 in the pastoral system to $2 454.7 in the high oxen/low dairy mixed farming system in

Intervening against bovine trypanosomosis in eastern Africa: mapping the costs and benefits38
Ethiopia. In general, benefits were highly influenced by the presence of draught oxen, as was the case in the West African study (Shaw et al., 2006). In this study, the presence of grade dairy cattle also played an important role. In the two low oxen/high dairy systems, the benefits were $257.8 and $260.1 per bovine in the agropastoral and mixed farming/general systems respectively. Adding the dairy component thus made more of a difference than adding a similar proportion of work oxen in the agropastoral system. In the general mixed farming system, their impact was greater due to the high number of days for which draught oxen are reported to work.
The importance of trypanosomosis for the dairy sector also emerges from the models. In the absence of trypanosomosis, the share of grade dairy cattle is 9 percent greater than it would otherwise have been in the mixed farming system, and 12 percent greater in the case of the agropastoral system.
Turning to the situation regarding exports, as given in Table 13, it is important to clarify that the key to calculating benefits per bovine, and then mapping them, is to assign these benefits to a geographic location. This table differs fundamentally from the previous one in that the benefits are shown per bovine present at the end of the period modelled. The number of cattle at the end of the period is higher than at the start, thus the same US dollar benefits are distributed over a larger number of animals, and the US dollar amount per bovine is accordingly smaller. These ‘end bovine’ benefits are thus ‘attached’ to each bovine in its final location at the end of the period. In some areas, cattle populations are expected to remain in their core locations throughout the period modelled; these are labelled ‘static’ cattle. In other locations, the migration of some cattle to new areas during the course of the modelled period means that the benefits accruing to them in that new location will have been doing so for a shorter period – so the benefits per head for export cattle are necessarily somewhat lower than those for core cattle. Furthermore, the income generated by those exported bovines before they left remains attached to their initial location, so for the cattle remaining in the core area, the benefits per head are somewhat larger. If there were no movements – the case of the static cattle – the benefit per head figure falls between these two limits. Overall, however, for each cattle population, the total level of benefit achievable remains the same; it is just apportioned between the two locations. Benefits per head of cattle remaining in the core area were thus around 13 percent (range 10-18 percent) higher per end bovine than those in the absence of any cattle movement, and those in the export area were around 25 percent (range 14-40 percent) lower.
These figures for benefits per bovine were then carried forward for the final mapping exercise in Chapter 6. However, before these figures can be applied, the future cattle distributions in the absence and presence of trypanosomosis needed to be mapped (Chapter 5).

39
Chapter 5 Mapping livestock population spread
5.1 APPROACHThe various elements of cattle population growth were mapped separately and then combined in several steps. First, estimates of livestock growth in the absence of interventions to control tsetse and trypanosomosis were produced by applying herd growth rates (assuming the presence of trypanosomosis) to maps of current densities. When the outputs are added to the existing population densities, these provide an estimate of the cattle population after 20 years, in the presence of the disease. This first output produces livestock population densities in some areas that significantly exceed likely maximum sustainable stocking rates. These must therefore be adjusted, either by increasing offtake of animals for sale or slaughter (resulting in lower final densities), or by exporting animals from the high concentration areas to surrounding, less heavily stocked regions. The second of these possibilities has been adopted here as the most realistic option, because traditional offtake rates in rural areas are consistently low. To these redistributed populations are added the additional increase in cattle numbers due to the control of AAT, as calculated by the herd models for each production system.
Finally, the excess animals are redistributed once again to surrounding areas if the nominal carrying capacity is exceeded due to herd growth over the 20-year period. These ‘exported’ animals then bring additional income from cattle rearing to those areas into which they are ‘imported’ (as explained in relation to Table 13).
These steps first require that maximum stocking rates are defined, and that techniques are developed to assign exported animals to neighbouring areas. Each of these is outlined in the following sections.
5.2 MAPPING MAXIMUM STOCKING RATESCarrying capacity (CC) is a notoriously difficult subject, and the concept has lost credibility among many ecologists. Nevertheless, it cannot be assumed that livestock populations increase without limit, and some effort must be made to set density levels beyond which animals are exported or slaughtered. Many attempts have been made to set these thresholds, among which those cited in Jahnke (1982) – covering a range of rainfall bands – are widely used within the study area. They can be summarized as shown in Figure 11.
This relationship does not, however, incorporate any influence of competing land use by cropping and/or human settlement, or the use of crop residues as fodder.

Intervening against bovine trypanosomosis in eastern Africa: mapping the costs and benefits40
400
15
20
25
30
35
45
40
900 1400 1900
Max
imu
m T
LU p
er k
m
Annual rainfall - mm
2
y= 0.0191x + 7.6639 R= 0.9976 2
FIGURE 11 Carrying capacity and annual rainfall
2000
20
40
60
80
120
140
100
400 600 800
People per km 2
2
Perc
enta
ge
of
max
imu
m
TLU
per
km
FIGURE 12Carrying capacity and human population

41Mapping livestock population spread
FIGURE 13Rainfed carrying capacity taken up by cattle populations
Indian Oce
an
Djibouti
Eritrea
Uganda
Somalia
Kenya
Ethiopia
Sudan
South Sudan
4 5° E3 0° E
15° N
0°
0 1000500
Kilometres
Cattle ens aspr p r n ra n earr n apa
4 - 53 - 42 - 31. 5 - 21 - 1. 50. 7 5 - 10. 5 - 0. 7 50. 2 5 - 0. 50 - 0. 2 5
> 5
N
Unsuitab le f or ruminants
Information on the year-round carrying capacity in relation to human population density has been compiled by Shaw (1986), based on work and studies originally reported on in Putt et al. (1980). Figure 12 expresses these values as a proportion of the carrying capacity at zero human population, which is assumed here to be equivalent to that defined by Jahnke.These carrying capacity estimates were compiled for predominantly pastoral livestock systems in West Africa, and have been assumed to be applicable to the pastoral systems in the Horn of Africa. For these systems, current livestock densities are generally within the estimated carrying capacity limits. However, for both the agropastoral and the mixed systems, the observed livestock densities are sometimes far in excess of the calculated limits, often being more than five times this defined maximum. The extent to which this occurs across the region is illustrated in Figure 13. As a result, it was necessary to develop an empirical limit to cattle densities based on reported values.

Intervening against bovine trypanosomosis in eastern Africa: mapping the costs and benefits42
200
0
0.5
1
1.5
2
3
3.5
4
4.5
2.5
400 600 800100 300 500 700
Pro
po
rtio
n R
ain
fed
Car
ryin
g C
apac
ity
People per km 2
Fitted y=1.063x 3 – 2.636x
2 + 0.123x+0.9972. R
2 =0.5103, N=32, p<0.0001
Upper 95% CI Limit AgropastoralMixed
FIGURE 14Proportion of the rainfed carrying capacity in relation to human population
density for the combined mixed and agropastoral systems
In order to derive such an empirical limit, the actual densities were calculated as a proportion of the maximum rainfed carrying capacity (Figure 13) and then summarized for each human population density class. A quadratic polynomial curve was subsequently fitted, thus representing the mean observed stocking rates in relation to human population density. The maximum stocking rate was taken to be the upper limit of the 95 percent confidence interval. This process was initially implemented separately for the mixed and for the agropastoral livestock production systems, but the latter was discarded as the 95 percent confidence interval for the lowest population values rose sharply, which was considered to be anomalous. A combined mixed and agropastoral system was therefore used instead, as shown in Figure 14.
Based on this analysis, it was possible to map the calculated maximum stocking rate derived from the maximum proportion of the rainfed carrying capacity, as shown in Figure 15. These values were used to set the thresholds above which animals resulting from growth in cattle populations derived from the herd models were assumed to be exported to less heavily stocked areas.
5.3 THE SPREAD MODEL Methods to assign emigrating populations to neighbouring areas from source populations are still in their infancy. Some rely on simple diffusion, usually density independent, and use some function of distance from the point of export to define areas of spread. Others
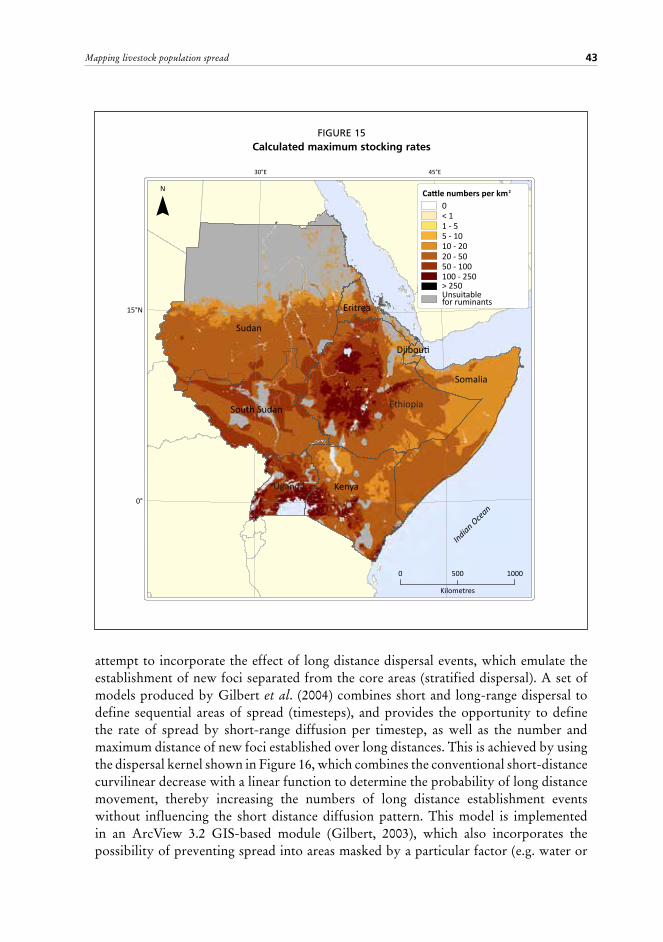
43Mapping livestock population spread
FIGURE 15Calculated maximum stocking rates
Indian Oce
an
Djibouti
Eritrea
Uganda
Somalia
Kenya
Ethiopia
Sudan
South Sudan
4 5° E3 0° E
15° N
0°
0 1000500
Kilometres
> 2 50100 - 2 5050 - 1002 0 - 5010 - 2 05 - 101 - 5< 10
Cattle numbers per km 2N
Unsuitab le f or ruminants
attempt to incorporate the effect of long distance dispersal events, which emulate the establishment of new foci separated from the core areas (stratified dispersal). A set of models produced by Gilbert et al. (2004) combines short and long-range dispersal to define sequential areas of spread (timesteps), and provides the opportunity to define the rate of spread by short-range diffusion per timestep, as well as the number and maximum distance of new foci established over long distances. This is achieved by using the dispersal kernel shown in Figure 16, which combines the conventional short-distance curvilinear decrease with a linear function to determine the probability of long distance movement, thereby increasing the numbers of long distance establishment events without influencing the short distance diffusion pattern. This model is implemented in an ArcView 3.2 GIS-based module (Gilbert, 2003), which also incorporates the possibility of preventing spread into areas masked by a particular factor (e.g. water or

Intervening against bovine trypanosomosis in eastern Africa: mapping the costs and benefits44
Pro
bab
ility
1
0
Distance
long-range events
stratified dispersal
simple diffusion
FIGURE 16Dispersal kernel for spread model
desert), as well as modifying the rate of spread according to a multiplier variable (e.g. suitability or amount of grazing).
This module thereby allows the identification of sequential bands of expansion from known foci – in the current case, areas of overstocking, in which modelled herd growth results in densities that exceed the calculated maximum stocking rate. Each timestep is separately coded, and can therefore be assigned fixed proportions of the population to be exported. In the present analysis, four timesteps were defined. Forty percent of the cattle population to be exported from areas defined as overstocked were assigned to the first timestep (which included the export source area and a narrow initial spread band), 30 percent to the second, 20 percent to the third and 10 percent to the fourth and final band. This means that nearly 40 percent (i.e. the remainder from exports at step one) of the stock remains in or close to the core overstocked areas. The implicit assumption is that some intensification is adopted within the 20 years over which these analyses run. In each case, spread was prevented into areas defined as unsuitable for livestock by FAO (Wint et al., 2003), or already overstocked, and was scaled according to accessibility to markets (Pozzi and Robinson, 2008), so that spread was greatest into areas most likely to support livestock marketing.
Two spread models have been defined and implemented: the first for cattle in the presence of the disease – the red areas in Figure 17 – the second for cattle in response to the absence of the disease, depicted as the green areas in Figure 17. In this second model, the additional cattle numbers resulting from improved productivity in the absence of disease
Source: Gilbert et al., 2004
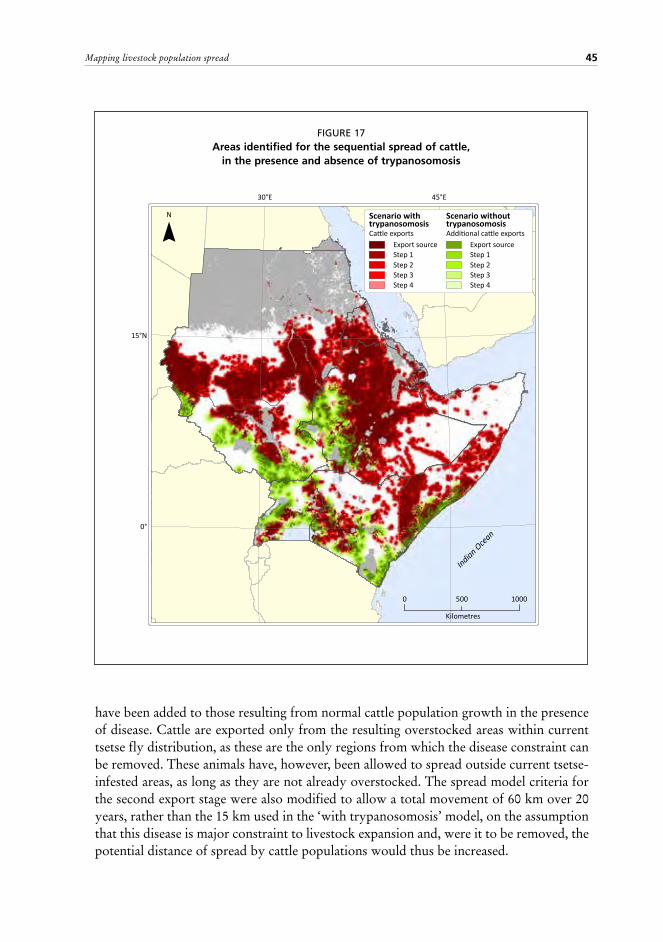
45Mapping livestock population spread
FIGURE 17Areas identified for the sequential spread of cattle,
in the presence and absence of trypanosomosis
Indian Oce
an
4 5° E3 0° E
15° N
0°
0 1000500
Kilometres
Scenario with trypanosomosis
Step 4Step 3Step 2Step 1Ex port sourc eo
Scenario withouttrypanosomosis
Step 4Step 3Step 2Step 1Ex port sourc e
itio o
N
have been added to those resulting from normal cattle population growth in the presence of disease. Cattle are exported only from the resulting overstocked areas within current tsetse fly distribution, as these are the only regions from which the disease constraint can be removed. These animals have, however, been allowed to spread outside current tsetse-infested areas, as long as they are not already overstocked. The spread model criteria for the second export stage were also modified to allow a total movement of 60 km over 20 years, rather than the 15 km used in the ‘with trypanosomosis’ model, on the assumption that this disease is major constraint to livestock expansion and, were it to be removed, the potential distance of spread by cattle populations would thus be increased.


47
Chapter 6 Mapping the benefits
6.1 THE BENEFIT MAPThe last stage of the work brought together the maps produced during each phase of the analysis, with the monetary figures calculated in Chapter 4.
The cattle production system-specific monetary values for the potential benefits per head of cattle present at the end of the 20-year period analysed were applied to the cattle density map (Figure 3), according to the distribution of the cattle production systems (Figure 8). These were then masked by the fly presence layer (Figure 2), so that benefits would be shown only where flies were present at the beginning of the 20-year period.
The final map of benefits per km2 is the outcome of a three part process, incorporating the results of simulation of the potential spread of cattle populations into areas with more abundant grazing, as outlined in Section 5.3 above. Thus the potential benefits were calculated for:
• the ‘export’ cattle populations moving out of overstocked areas during the course of the 20-year period and the ‘core’ cattle populations remaining in their areas of origin over the 20-year period;
• the benefits accruing to ‘export’ populations were added to those accruing to the ‘core’ cattle populations remaining in their area of origin, so as to produce a map of total potential benefits from interventions against tsetse and trypanosomosis (Figure 18).
The map shows total benefits over 20 years, in the form of a present value discounted over 20 years at 10 percent (as explained in Section 4.2).
Following on from the analysis in Chapter 5, mapping was first carried out to chart what happened to those cattle populations that eventually spread into adjoining, less densely grazed, areas. This process would involve some herders relocating, or family members leaving, with newly constituted herds or animals being sold to farmers living in these adjoining areas, who thus expanded their livestock holdings. The move was modelled as taking place over some years, in the timesteps explained in Section 5.3. Initially therefore, while remaining in their original locations, these cattle populations nevertheless incurred some benefits in their areas of origin. Later, when they moved outwards, the potential benefits from increased productivity due to the absence of trypanosomosis are shown as accruing in their new locations.
Next, the benefits were mapped for those cattle populations remaining in their areas of origin – the core herd – which would benefit from the absence of trypanosomosis and grow in numbers, but remain within the estimated carrying capacity limits. This produced a second layer.

Intervening against bovine trypanosomosis in eastern Africa: mapping the costs and benefits48
Lastly, these two layers were combined, after capping the level of benefits at $15 000 per km2 to remove anomalous values caused by outliers in predicted values. This produced the final map of potential benefits, as seen in Figure 18. This map shows the maximum possible benefit that could be realized in a particular area from interventions against tsetse and trypanosomosis in cattle over a 20-year time horizon. Depending on the nature of the intervention, and where it is applied, some or all these benefits could eventually be harvested.
This map is necessarily reminiscent both of the cattle and tsetse distributions (Figures 2 and 3), with greater benefits accruing to areas of high animal density, as in parts of Ethiopia. However, the weighting by production system adds a further dimension, by highlighting areas of high draught oxen and grade dairy cattle use, for example in western Kenya and eastern Uganda along the shores of Lake Victoria.
FIGURE 18The mapped total potential benefits from interventions against animal trypanosomosis
N
Indian Oce
an
Djibouti
Eritrea
Uganda
Somalia
Kenya
Ethiopia
Sudan
South Sudan
4 5° E3 0° E
15° N
0°
0 1000500
Kilometres
US$ per km2 over a 20 year perioddiscounted at 10%
< 1010 - 500500 - 1 0001 000 - 2 500
5 000 - 7 5007 500 - 10 00010 000 - 12 500> 12 500
2 500 - 5 000 Unsuitab le f or ruminants

49Mapping the benefits
The benefits ranged from under $500 to well over $10 000 per km2 – values that lie within the ranges found in other published studies and reviews (e.g. Kristjanson et al., 1999, Shaw, 2004, Shaw et al., 2006, Swallow, 2000). These figures include not only the direct benefits from increased outputs of milk, meat, draught and greater herd growth, but also indirect benefits comprising:
• a value for the extra cattle present in newly exploited areas due to the absence of trypanosomosis, based on the spatial expansion modelling presented in Chapter 5; and
• an increase in the proportion of male cattle being used for draught and a higher proportion of grade dairy animals within the growing cattle population than would be possible in the presence of trypanosomosis.
The greatest benefits are shown to accrue along the borders of the tsetse belts in southwest Ethiopia, parts of western, central and coastal Kenya, and southwestern and central Uganda, i.e. close to established cattle rearing regions. Comparatively little benefit is estimated to be generated for much of the South Sudanese and Sudanese tsetse belts, with the notable exception of areas bordering northwest Uganda and parts of western Ethiopia. This is at least partly due to the fact that the calculated spread of animals into the northwestern South Sudan tsetse belt is somewhat limited, since the neighbouring areas are lightly stocked, and that even with the substantial growth rates envisaged, these do not increase greatly in absolute terms over the 20-year period incorporated by the herd models. That is not to say that the potential benefits of dealing with tsetse and trypanosomosis are much lower in these areas, but merely suggests that the ultimate level of benefits, which could reach comparable totals per km2, will take substantially longer than 20 years to achieve.
Projected over twenty years and discounted at 10 percent per annum, the total losses from bovine trypanosomosis and hence the potential benefits from its control in the IGAD region, amounted to just over $2.6 billion. Nearly 40 percent of this amount could be realised in Ethiopia, although it only contains just over 20 percent of the region’s tsetse-
TABLE 14Breakdown of potential benefits over 20 years from interventions against tsetse and trypanosomosis in cattle
Tsetse-infested areas falling into the following categories (% of regional total)
Unsuitable for
ruminants
Benefit band ($ per km-2)aTotal
tsetse-infested areaCountry 0 – 1 000 1 000 – 5 000 > 5 000
Ethiopia 3.5 4.2 6.3 9.3 23.3
Kenya 3.3 4.7 5.0 4.0 17.1
Somalia 0.1 0.4 3.3 1.1 5.0
South Sudan 7.7 12.7 14.3 2.7 37.4
Sudan 0.0 0.3 2.5 0.9 3.7
Uganda 2.1 3.0 4.9 3.7 13.6
Total 16.8 25.3 36.2 21.7 100.0
a Based on potential benefits over 20 years, discounted at 10%,from interventions against tsetse and trypanosomosis in cattle as mapped in Figure 18. No benefits were quantified for the areas categorized as unsuitable for ruminants.
Intervening against bovine trypanosomosis in eastern Africa: mapping the costs and benefits50
infested land area. This is a reflection both of the very high livestock densities that the country supports and the relatively high level of benefits estimated per bovine, especially where a high proportion of cattle are used as draught oxen (Table 12). Conversely, less than 20 percent of the potential benefits from controlling trypanosomosis could be realised in South Sudan, although it contains nearly 40 percent of the tsetse-infested lands, since these include substantial areas classified as unsuitable for ruminants and overall cattle populations are low with little use of draught oxen or improved dairy cattle. However, the average potential benefits would rise significantly if tsetse and trypanosomosis control efforts were to be restricted to those higher return areas bordering Uganda, Ethiopia and Chad which already support higher cattle populations.
These contrasts are shown in Table 14, which sets out the extent of tsetse-infested areas in relation to the levels of estimated losses from trypanosomosis over time within each country. In Kenya, Somalia, South Sudan, Sudan and Uganda, the highest proportion of the tsetse-infested area falls into the band of between $1 000 and 5 000 per km2 whereas in Ethiopia, it is the band of over $5 000 per km2 of estimated potential benefits that is the most extensive. It is also noteworthy that for the region as a whole, 55 percent of the benefit band of over $5 000 per km2 accrues benefits of over $10 000 per km2, a third of which is in Ethiopia.
6.2 INTERPRETING THE BENEFIT MAPThere are a number of provisos that must be attached to these analyses. These fall into five main categories.
First, the modelling approaches used have been successfully combined, but nevertheless there are inherent limitations to the extent to which they can be integrated. The bio-economic herd models project cattle income and population growth under different assumptions about the cattle production system and its productivity, that is for the absence and presence of trypanosomosis and for situations where the cattle population did and did not outstrip the grazing available in their area of origin. The links in the timing of movements in the cattle population in the spread model to that in the herd models were approximate rather than exact. Similarly, within the scope of this study, which focused on cattle and tsetse, it was not possible to make a detailed estimate of how rural populations and their agricultural practices may evolve over time, although an increase in the use of work oxen and grade dairy cattle was incorporated.
Second, the above evolution would also incorporate changes in cattle production conditions in the absence of trypanosomosis, which together with changes in consumer incomes, would impact on prices of cattle, meat, milk and animal traction. The objective of this study was to produce a set of maps designed to assist prioritization. The maps should therefore be interpreted by comparing different locations, rather than by assuming the wholesale disappearance of the disease. In this respect, it contrasts with the analysis undertaken by Kristjanson et al. (1999), where the availability and application of a hypothetical trypanosomosis vaccine would have an Africa-wide effect and price change would need to be modelled, since keeping cattle would become universally more cost-effective. Through interactions in the market, producers would pass on some

51Mapping the benefits
of this improvement to consumers in the form of lower prices, while also benefiting from an overall increase in output, so that both groups would benefit. Kristjanson et al. (1999) quantified these producer and consumer surpluses for meat and milk outputs for a single cattle production system in their assessment. In the present study, it was deemed appropriate to use a single price for the scenarios with and without trypanosomosis in the herd models, given the complexity of modelling 12 different cattle production systems that evolve at different speeds. Thus, the quantification of benefits was limited to producer benefits, measured in terms of increased output adjusted for changes in production costs. Further analysis could investigate the extent to which, if the disease were controlled on a large scale, this might induce price changes, which would in turn translate into consumer and producer surpluses, and ultimately into slightly higher monetary benefits.
Third, the reduction of the cattle production systems to a manageable number means that much of their internal variability has not been accounted for. This is particularly true of the situation in the IGAD countries. As discussed in Chapter 2, the livestock production systems in the region are highly diverse, and it was with some difficulty that they were reduced to the 12 for modelling purposes. Within the adopted systems there are differences in breeds of cattle, local cattle-keeping practices, varying degrees of susceptibility to local trypanosomes and varying levels of contact between bovines and tsetse. These situations will change over time. Beyond these, different areas will be presented with different market opportunities, which will be reflected in the benefits reaped. As well as physical access to markets, there may be spatial variation in the institutional barriers to market access.
Fourth, while every effort was made to find studies illustrating a ‘typical’ situation within and outside the tsetse-infested areas of each cattle production system, applying a single set of parameters and disease impacts throughout each system necessarily involved simplification and a loss of internal variability. Variations in tsetse challenge and trypanosomosis risk were taken into account implicitly, by selecting typical parameters for cattle in tsetse-infested zones within each of the 12 cattle production systems, rather than explicitly, by introducing yet another layer of modelling that would reflect some estimate of tsetse challenge or disease risk. Recently, the numbers of cattle and poor cattle owners affected by AAT was estimated, by livestock production system, in Uganda (MAAIF et al., 2010) and further work (Cecchi et al., 2014, 2015) is bringing together more information which could eventually underpin such analyses.
Lastly, as with any study covering such a large area and including so many layers of information, the data used are inevitably of varying quality, and there are significant gaps. While stochastic modelling approaches, calibrated on the available data, can fill many of these gaps, they are bound to produce results that have local inaccuracies: as noted above, results of any modelling process aggregated for a small number of pixels is likely to be representative rather than precise.
In the bio-economic component, data on livestock productivity (fertility, mortality, milk yields and output of draught power) are usually obtained from a limited number of in-depth studies in small localities. Provided that there are enough of these, and that

Intervening against bovine trypanosomosis in eastern Africa: mapping the costs and benefits52
they cover the main production systems, it is possible to obtain a good general picture. As the large number of references testifies, the IGAD region countries’ cattle systems have been extensively studied, and there is enough information for cross-checking and validation. For South Sudan, Sudan and Somalia, less data were available, reflecting the extent to which longstanding political instability has and continues to limit research work of this nature. Furthermore, while adequate for the modelling and estimations in this study, there are only limited data in several key areas: in particular, on the economic value of using draught animals, their distribution and, despite many years of study, the impacts of trypanosomosis on livestock productivity.

53
Chapter 7 Factoring in the costs
The benefit maps derived in the previous chapter show the levels of losses attributable to trypanosomosis in cattle, and therefore allow planners to target and prioritize interventions against AAT. There remains, however, a question of how to interpret the actual monetary values in the maps. Should US$500 benefit per km2 be considered as low or acceptable? Is $5 000 per km2 high or just about justifiable? One way of answering such questions is to factor in the costs of intervening against tsetse and trypanosomosis.
In this chapter, the costs of a range of interventions are estimated, so as to enable these investments to be compared to the mapped benefits. Costs were derived from several existing studies (Shaw et al., 2013a, Shaw et al., 2007, Barrett, 1997). In addition, several papers have reported on the costs of recent field interventions using different techniques, including aerial spraying (Adam et al., 2013), the sterile insect technique (SIT) (Bouyer et al., 2014), tiny targets (Shaw et al., 2015a) and insecticide-treated cattle (ITC) (Muhanguzi et al., 2015).
As was the case for the benefit estimates, there are many uncertainties and assumptions to be made. The main reason for variability in estimated benefits was the differences in the way that trypanosomosis affected livestock in the different cattle production systems. For the costs, however, the uncertainties relate to:a) the ways in which interventions are organized in terms of scale and structure
– whether they are, for example, part of a large-scale project based in a national ministry or control unit with substantial administrative overheads and planning requirements, or if they are smaller-scale activities, perhaps set up at a local level by district authorities, farmers’ groups or an NGO;
b) the relative prices in each country – input costs tend to be more variable than the prices of cattle and milk, through which the benefits are estimated; someprices are also hugely variable within country – in particular, the salaries of people in government services, which are also often subject to substantial ‘project’ top ups, again depending on the way the intervention is organized;
c) the types and scale of entomological and epidemiological studies undertaken before interventions, for which no consistent template exits; and
d) the extent to which local factors, such as climate, vegetation and relationships between hosts and vectors create specific situations, influencing the effectiveness of measures against tsetse and trypanosomosis and how much they ultimately cost to implement. A detailed discussion of the relative effectiveness of the different techniques is outside
the scope of this study. However, there is enough knowledge, and a broad consensus about the orders of magnitude of the costs of the different types of intervention, to

Intervening against bovine trypanosomosis in eastern Africa: mapping the costs and benefits54
underpin an analysis of how these costs relate to the potential benefits of intervening against tsetse and trypanosomosis. For a discussion of the different approaches and their strengths and weaknesses, the reader is referred to the relevant chapters by Allsopp and Hursey, Feldmann, Holmes et al., Vale and Torr, Van den Bossche and De Deken in Maudlin et al. (2004).
Similarly, for chemotherapy and chemoprophylaxis, the assumptions made here are a simple baseline. Again, there are complex issues about the sustainability of long-term chemoprophylaxis, with its associated risk of drug resistance, which fall outside the scope of this economic analysis. For background on the use of trypanocides, the reader should consult Holmes et al. (2004).
7.1 OPTIONS FOR INTERVENTIONAs a vector-borne disease, AAT can be tackled in a number of ways. These are discussed below in the context of how their costs can be mapped. The objective was to produce maps showing how different techniques performed in one of two situations: ongoing disease or tsetse control activities, or the creation of permanent fly-free zones. It should be noted that in all cases, the costs and intensity of deployment relate to the entire tsetse-infested area, not just to areas of suitable habitat, such as fringing vegetation along rivers.
7.1.1 Chemotherapy and chemoprophylaxis: measures targeting the trypanosome
The parasite can be tackled by:• curing clinically sick animals using trypanocides (therapeutic treatment);• using trypanocides prophylactically; and• using trypanocides on healthy livestock in order to reduce the size of the animal
reservoir of the disease.There is currently no vaccine against trypanosomosis in people or animals.African livestock keepers make extensive use of trypanocides, both therapeutically
and prophylactically (Holmes et al., 2004). In many areas of Africa, these are the most frequently purchased veterinary drugs. Trypanocides are most often used curatively, though pastoralists and other livestock keepers who move their animals seasonally regularly use them prophylactically (e.g. Pokou et al., 1998, Van den Bossche et al., 2001).
There are only two main trypanocides in use today: diminazene aceturate, which is primarily curative but confers about three weeks of prophylactic effect, and isometamidium chloride, which is primarily prophylactic, with about three months’ effectiveness, depending on the cattle breed and level of tsetse challenge. As a result of their widespread use, drug resistance is a growing problem in many parts of Africa (Geerts et al., 2001, Holmes et al., 2004). In addition to challenges of resistance, difficulties are caused by the sale in many areas of low quality or counterfeit drugs in local markets.
While it remains the most widely used disease control option, it is therefore difficult to see how even very extensive use of trypanocides could ever lead to elimination of the disease. As a result, the only drug strategy targeting the pathogen which was costed and

55Factoring in the costs
mapped is the prophylactic use of trypanocides as a continuous control strategy, given to every bovine four times a year. This would emulate the use of isometamidium chloride.
This is neither a recommendation nor is it universally applicable, since in high challenge areas it has been found necessary to dose bovines more frequently for effective prophylaxis (Geerts et al., 2001, Holmes et al., 2004). It is important to bear in mind that mapping the returns of this strategy throughout the region in no way implies that its continued use for 20 years is desirable. On current evidence, this would lead to large-scale drug resistance – although it might also, within a much shorter period, greatly reduce the reservoir of trypanosomes in areas of high cattle population density where tsetse feed preferentially on bovines.
7.1.2 Measures relying on trypanotolerance in cattleMaking use of certain breeds of cattle, sheep and goats’ ability to ‘tolerate’ trypanosomosis offers one option for mitigating the effects of the disease, a trait well documented among some West African breeds (Agyemang, 2005, Murray et al., 2004). This ability was incorporated in assessments of the impact of trypanosomosis in the cattle production systems modelled in the West African benefit mapping study (Shaw et al., 2006). Eastern Africa contains cattle that possess some limited degree of trypanotolerance, notably the Boran (Njogu et al., 1985). Originating from northern Kenya, these cattle have spread outside their original areas and been selectively bred and exported, in particular for ranching. However, they have not been generally adopted by traditional livestock producers outside their area of origin, nor have West African trypanotolerant breeds been introduced in the region. The benefit mapping method used in this study modelled the increases in the use of work oxen and of exotic dairy cattle, but would not accommodate a more general breed change. For these reasons, the trypanotolerant breed option did not fall within the scope of this study.
7.1.3 Measures targeting the vectorIn the battle against trypanosomosis, human ingenuity has tackled the vector in many different ways. These ranged from early attempts to remove the tsetse flies’ hosts and habitat by killing wildlife and clearing vegetation, to the use of insecticides sprayed from the ground or from the air, or left on traps, targets, fences, nets or cattle. It also included the deployment of laboratory produced sterile male tsetse flies, so that they would mate with wild female tsetse, thereby rendering them infertile.
In addition, where the vector is targeted, there are two possible strategic approaches.• Measures against tsetse flies can be deployed for a number of years, or intermittently,
when the tsetse and trypanosomosis situation is perceived as serious. Here, this approach will be described as continuous control. Although any frequency is possible, in this costing exercise, they are assumed to be used every year. The only exception is the Sequential Aerosol Technique (SAT), which is assumed to be deployed at three-yearly intervals. Control measures can be undertaken on a small scale, and are assumed to take place in areas where constant tsetse reinvasion pressure exists.

Intervening against bovine trypanosomosis in eastern Africa: mapping the costs and benefits56
• In some situations, the ultimate aim can be the creation and maintenance of a permanent tsetse fly-free zone – localized elimination. This provides the possibility of benefits in perpetuity from savings on trypanocides and better livestock productivity. Where tsetse fly populations are isolated, and the potential benefits are likely to be high, this is a very attractive proposition. If flies are not isolated, a ‘barrier’ to reinvasion is required. These barriers consist of an area on the periphery of the fly-free zone where intense tsetse control measures are deployed, so as to prevent flies from reinvading the cleared area. Such barriers may be temporary, if the cleared area is to be expanded, or permanent, if not. Of the techniques costed here, only ITC and targets would be suitable for barriers. Continuous application of SAT would neither be economic nor environmentally acceptable. As regards SIT, it is not considered appropriate as a barrier, since it depends on the sterile males outnumbering wild males, and thus relies on prior suppression. The elimination strategies are costed here as though taking place on a large scale, in blocks of 10 000 km2 (Shaw et al., 2013a).
For this analysis, four technologies were selected for mapping, representing the range of technologies in current use.
Traps and targets The use of bait technologies is described in Vale and Torr (2004) and Van den Bossche and De Deken (2004). Both traps and targets require a reliable organizational infrastructure and manpower to deploy and service them (repairing damage, renewing odours and, if necessary, re-impregnating them with insecticide). Numbers of targets/traps required are similar, but due to their simpler structure, the targets are usually less costly than traps (Vale and Torr, 2004). Insecticide impregnated nets or fences offer another option not costed here, which has been applied to defined subpopulations within livestock keeping areas (such as zero-grazed cattle – Bauer et al. (2006, 2011), Maia et al. (2010) or pigs – Kagbadouno et al. (2011). As with traps or targets, provided a sufficient density of units exists, control or elimination of tsetse populations could be contemplated using insecticide impregnated nets or fences. The number required is likely to be in the range of 4 to 8 per km2.
The required number and design of traps and targets varies according to the behaviour of individual species or subspecies of Glossina, including their mobility and attraction to synthetic odours, all of which vary greatly. For savannah (morsitans) group tsetse flies (G. pallidipes, G. morsitans, G. swinnertoni, and G. austeni in the study area), 4 traps or targets per km2 with odour attractants are considered sufficient to reduce tsetse populations by ≈ 95 percent in non-isolated areas, or to eliminate them in an isolated area as demonstrated by field trials (Vale et al., 1986; Vale et al., 1988 and Dransfield et al., 1990). For riverine (palpalis) group tsetse species (G. fuscipes and G. tachinoides in the study region), a higher trap/target density may be needed, as these species are relatively unresponsive to odours (Green, 1994, Torr et al., 2011). The restriction of riverine vegetation to watercourses does, however, limit the actual area where baits need to be deployed. In West Africa, traps every 100 m in fringing riverine vegetation were shown to be sufficient to block reinvasion by

57Factoring in the costs
tsetse (Politzar and Cuisance, 1983). Traps at an average density of 10 per km2 were used in Uganda against G. fuscipes to control HAT (Lancien and Obayi, 1993). Where only riverine tsetse are present, odour baits are not required and much smaller 0.5 x 0.25 m ‘tiny targets’ can be highly effective (Esterhuizen et al., 2011). A recent small-scale trial covering 500 km2 in northwestern Uganda, with no barriers to reinvasion deployed ~ 20 such targets per linear km of riverine habitat, which resulted in an average density of 5.7 targets per km2, achieved a fall in tsetse populations of more than 90 percent in the centre of the area and 85 percent on the edges of the treated area within three months, with reductions of 98 percent and 90 percent expected over a longer period (Tirados et al., 2015).
Although the costs presented in Shaw et al. (2013a) were for traps, in this analysis targets were used. This allowed for both slightly reduced costs and the incorporation of the ‘tiny target’ technology described above in areas where only riverine flies are present. Thus, the following target densities were costed for the control scenarios:
• 4 standard size (1 m2) targets with odour attractant per km2 in areas where only savannah group tsetse flies are present;
• 10 tiny (0.5 x 0.25 m) targets without odour attractants per km2 in areas where only riverine group tsetse flies are present;
• 10 standard size (1 m2) targets with odour attractant per km2 in areas where both riverine and savannah group tsetse flies are present.
When deployed against riverine species, the average density per km2 actually results in much higher effective densities, as targets are deployed only in riparian vegetation where riverine tsetse species are found.
For the elimination strategy, targets were deployed at the same densities per km2 as for control, but a provision for barriers to prevent reinvasion of tsetse-free zones was added to the costs. Within the barrier zones, the target density was assumed to be double the figures given above.
Insecticide-treated cattle (ITC)The baits described above are stationary. However, if insecticide is applied to cattle either by pour-on or spraying, they act as mobile baits, to which flies are attracted and thus pick up a lethal dose of insecticide (Vale and Torr, 2004; Van den Bossche and De Deken, 2004; Torr and Vale, 2011). This can be highly effective in controlling tsetse and reducing the prevalence and impact of bovine trypanosomosis (e.g. Rowlands et al., 1999; Muhanguzi et al., 2014). The approach costed here assumes the restricted application protocol (RAP) (Torr et al., 2007a; Muhanguzi et al., 2014a), whereby insecticide is only applied to the preferred feeding sites of tsetse and ticks: the legs, belly and ears.
Due to their ability to attract flies, treating four large bovines per km2 on a monthly basis is considered sufficient to control all tsetse species. In order to add a safety margin, the number was increased to five. However, to be effective, it has been calculated that at least 10 percent of the tsetse flies’ blood meals must be taken from insecticide-treated hosts (Hargrove and Packer, 1993; Hargrove and Williams, 1995). In many areas of the study region, flies feed on other hosts, which may include wildlife. Thus the number of ITC needed per km2 varies with the cattle population.

Intervening against bovine trypanosomosis in eastern Africa: mapping the costs and benefits58
• Within cattle herds, tsetse prefer to feed on large animals, such as cows and oxen (Torr et al., 2001, 2007b). The typical composition of cattle herds in the study area ranges from 30 to 40 percent cows and, depending on the level of use of work oxen, 10 to 30 percent adult males. This means that between 50 and 60 percent of cattle are large adults. Thus, to be sure of having at least five large animals in one km2, the feasibility threshold was fixed at 10 bovines per km2. All areas with lower cattle densities were masked and flagged as ‘unsuitable for the technique’.
• Once the cattle density rises above 50 per km2, treating five large adults per km2 means that 10 percent or less of the cattle population is being treated. At this cattle population density, cattle are likely to be the main host for tsetse. Accordingly, the numbers of ITC will need to be increased, so that at least 10 percent of meals are taken from cattle that have actually been treated with insecticide. Thus, for cattle populations above 50 per km2, the costs are calculated on the basis of treating 10 percent of cattle.
Though unproven in field conditions, modelling indicates that ITC applied on a sufficiently large scale would be effective in eliminating tsetse populations (Hargrove, 2000, 2003), if isolated from tsetse reinvasion. In this analysis, for the elimination scenario, the costs were based on twice as many annual treatments per km2, thus either doubling the number or the frequency of cattle treated. As with targets, ITC could also be deployed on the periphery of a fly-free area and used as a barrier to reinvasion. To allow for such barriers, the number was doubled again, so that a minimum threshold of 20 cattle per km2 was set for this barrier technique to be applicable. Areas with fewer cattle per km2 were shown as unsuitable for ITC on the map. This is a severe criterion; in practice, ITC barriers would be specifically located in areas where the cattle population was high enough to sustain them. Within these areas, regions where only 10 cattle per km2 existed would probably be sufficient to support elimination using ITC. However, by fixing the level at 20 per km2, it can be argued that there is enough leeway to ensure that there are easily sufficient cattle present to sustain the technology.
Aerial spraying using the sequential aerosol technique (SAT)While helicopters have been used to apply insecticides from the air, currently the most widely used method involves fixed wing aircraft applying synthetic pyrethroids in the sequential aerosol technique, SAT (Allsopp and Hursey, 2004). This is based on repeated spraying timed in relation to temperature and humidity, so that each spray cycle kills all tsetse alive at the time, and the subsequent cycle kills any that have since emerged from their puparia in the ground. Each subsequent cycle has to take place before females reach maturity and deposit new larvae in the ground. SAT operations usually require five cycles, applied at intervals of 15-20 days (Allsopp and Hursey, 2004). SAT has been shown to be effective in eliminating tsetse in savannah environments (Kgori et al., 2006), whereas difficulties have been encountered with riverine tsetse species in areas of dense vegetation (Adam et al., 2013).
In order to be comparable with the other control options, five cycles of SAT were costed as being applied seven times during the study period. The three-yearly frequency

59Factoring in the costs
was selected as a compromise between the likely rapidity of reinvasion (Hargrove, 2000) and cost. However, unlike the other tsetse control strategies, SAT would need to be applied on a large scale: say 5 000 – 10 000 km2.
Since aircraft have to be flown at very low altitude for this work, the technique is unsuitable for very rugged terrain. Such areas were therefore masked as ‘unsuitable for the technique’ when mapping.
Sterile insect technique (SIT)The sterile insect technique involves the release of sterile male flies from low flying aircraft (Feldmann, 2004). Because female tsetse normally only mate once, mating with a sterile male renders them sterile. Sterile males must be released in sufficient numbers to outperform local wild males in finding and mating with females. As a result, this technique is ideally used where tsetse fly numbers have been substantially reduced by some other vector control method – a procedure usually described as suppression. For this reason, and because of its relatively high cost, SIT is normally only recommended for projects where tsetse elimination – the creation of permanent fly-free zones – is the objective, especially where other interventions against the vector have failed or are considered unsuitable (see discussion in Feldmann and Parker, 2010).
7.2 ESTIMATING THE COSTS OF INTERVENING
7.2.1 Cost calculation methodologyThe method for calculating the costs is set out in Shaw et al. (2013a), which was based on the approach used in Shaw et al. (2007). This analysis was based on Uganda and drew heavily on the study for planning the PATTEC project in Uganda (ADB et al., 2004), in particular for overheads, administration, initial feasibility studies and the SIT components. Since then it has been possible to update and improve on these costs with data from Ghana, Kenya and Senegal (Adam et al., 2013, McCord et al., 2012, Bouyer et al., 2014), as well as Uganda (Shaw et al., 2015a and Muhanguzi et al., 2015). These showed costs to be broadly similar across the IGAD regions and beyond. The price framework from Shaw et al. (2013a) was thus retained as a baseline alongside the comprehensive set of Ugandan costs and prices, which were updated in the recent publications cited above. It was then adjusted in line with inflation, based on the Uganda Consumer Price Index for non-food items (UBOS, 2014) and Ugandan shillings were converted to US dollars using the historical rates given by FX Oanda (http://www.oanda.com/currency/historical-rates-classic). On this basis, by 2013, prices had increased by 27.1 percent since 2006 and by 11.2 percent since 2009, the reference years used in Shaw et al. (2013a) and (2014) respectively.
In economic analyses covering more than one year, the problem of how to compare sums of money received or disbursed at different points of time is dealt with by the process of discounting, as explained in Section 1.2. A discount rate of 10 percent was used for the costs, exactly as for the benefits. The implications for the benefit-cost ratios are discussed below in Section 8.5.

Intervening against bovine trypanosomosis in eastern Africa: mapping the costs and benefits60
For timing, following the convention in multi-year benefit-cost analyses, year 0 was considered as ‘the present’ and was the year to which future values of benefits and costs were discounted as follows.
• For control costs, these were assumed to start at the beginning of year 0.• For strategies to create fly-free zones, the 2 to 4 years preliminary work were
costed as starting before year 0, so that year 0 represented the start of the elimination work (Shaw et al., 2013a).
• Benefits were calculated from year 1 onwards (see also Section 8.1).For all costs that increased in line with the cattle population (use of ITC for control,
elimination or barriers and the use of trypanocides), the amounts were modelled as increasing year by year at a rate of 2.9 percent. This represented the average annual population growth rate in the absence of trypanosomosis, weighted over the 12 cattle production systems modelled in the study.
7.2.2 Costs of individual interventions Trypanocide prophylaxisThe cost of trypanocides and their delivery was also collected for each country during the benefit study. The costs for the drug plus delivery used in the benefit models ranged from $1.45 for the pastoral system to $6.35 for the smallholder dairy system (Table 3). If prophylaxis were used on a larger scale, the costs would be lower. For the benefit-cost analysis, updated prices were used. In rural areas of Uganda, the current price of isometamidium chloride is equivalent to $1.93 for a 300 kg adult dose or $1.35 for the average bovine (210 kg) (personal communication, Dennis Muhanguzi, 2014). Delivery costs were estimated at $0.65 (updated from Shaw et al., 2015a and personal communication, Dennis Muhanguzi, 2014), bringing the cost per dose to $2 and thus to $8 per year per bovine, if administered three-monthly.
TargetsThe costs for standard size targets were adapted from Shaw et al. (2013a) by applying inflation and replacing trap with target costs, yielding $252 and 629 per km2 for densities of 4 and 10 per km2 respectively. For the tiny targets, which could be deployed at a density of 10 per km2 in areas where only riverine flies were present, the costs are lower. These can be transported by bicycle or motorcycle, leading to much lower logistics costs than those for installing and servicing conventional targets. The costs for these were based on detailed field data collected during the tiny target operation described above (Shaw et al., 2015a), which included an intensive community sensitization exercise (Kovacic et al., 2013). The costs were adapted by increasing logistics costs by 50 percent to allow for deployment in more isolated areas, and by allowing for 10 rather than 6 targets per km2. This yielded an annual cost for control of $142 per km2.
Insecticide-treated cattle (ITC)Although it is relatively easy to calculate the cost of the insecticide required for ITC, estimating the costs of delivery is more difficult. Earlier cost calculations and estimates

61Factoring in the costs
(Mulatu et al., 1999 and Bourn et al., 2005) recognize this. Recent evidence was provided from field work in Uganda, where the cost of insecticide and delivery using the restricted application protocol was calculated to be $0.57 per bovine per treatment (Muhanguzi et al., 2015), to which should be added an estimate of the cost of ropes used to restrain cattle, and the farmers’ time, bringing the total to $0.60 (personal communication, Walter Okello, 2014). The cost of insecticide came to only $0.13 per treatment, so that delivery accounted for just under 80 percent of the total cost.
Aerial spraying using the sequential aerosol technique (SAT)The costs of aerial spraying were based on Shaw et al. (2013a), amounting to $483 per km2, after adjustment for inflation. This compared well with recent field experience, which recorded a cost of $445 per km2 for spraying an area of 6 745 km2 (Adam et al., 2013). The latter cost excluded salaries and depreciation; adjusting for these would make the two estimates almost identical.
For aerial spraying, as for SIT, there are substantial economies of scale. Thus in Zimbabwe, Barrett (1997) recorded the cost of flying charges per km2 for treating 4 700 km2, which was only 76 percent of the cost of treating 1 984 km2. Barrett went on to estimate the costs per km2 of treating 3 000 km2 and 6 000 km2 as amounting to 73 and 56 percent respectively of the cost of treating 1 500 km2. However, this latter estimate included other factors – dealing with two tsetse species and more rugged terrain for the smaller-scale operation, so that the differentials are not purely due to scale effects. In line with the other elimination strategies, the SAT costing presented in Table 17 applies to a large-scale operation.
Sterile insect technique (SIT)The costs of this technique were estimated by Shaw et al. (2013a) at $758 per km2, for an area of 10 000 km2, based on information from the African Development Bank et al. (2004) and Feldmann (2004). Bouyer et al. (2014) indicate field costs of the SIT component to be $4 900 per km2 for a project covering 1 000 km2 in Senegal. This higher cost is similar to the inflation-adjusted figure of $5 100 per km2 reported by Msangi et al. (2000) for a similarly small (1 600 km2) operation on Unguja Island. Operations involving aircraft are very sensitive to scale. Aerial survey costs per unit area for 10 000 km2 surveys in West Africa are 38 and 59 percent of that estimated for 1 000 and 2 000 km2 operations respectively (Resource and Inventory Management, unpublished information). The elimination options costed here all follow Shaw et al. (2013a) in being based on an area of 10 000 km2. For SIT, the cost used here is therefore based on the figures reported in Bouyer et al. (2014) for a small-scale operation, to which a scale deflator of 60 percent is applied to flying time and the other SIT-related field costs, in order to adjust it to the hypothesized large-scale operation. The cost of sterile males was also deflated to allow for economies of scale. In this case, 20 percent was considered an appropriate figure (personal communication, U. Feldmann, 2011), which resulted in a figure very similar to that estimated in Shaw et al. (2013a). On these assumptions, a figure of $1 748 per km2 was obtained for adding an SIT component for one species.
Intervening against bovine trypanosomosis in eastern Africa: mapping the costs and benefits62
Where more than one species of tsetse fly is present, SIT would involve rearing each species and incurring increased deployment costs. The feasibility of releasing more than one species in a single flight is currently being tested. Flight lines might need to be extended, so that flying costs might increase by some 15 percent (personal communication, U. Feldmann, 2011). The cost of rearing flies is approximately proportional to the numbers produced. However, some economies of scale can be realized, and these could reduce production costs for additional species by 20 percent (personal communication, U. Feldmann, 2011). On this basis, and after assuming an increase of 20 percent in overheads, the field cost for each additional tsetse species present would be $664 per km2.
These analyses assume that one of the three other techniques (targets, ITC and SAT) was used for suppression before deploying SIT. In each case, the cheapest technique was selected, depending on the characteristics of the area: presence or absence of riverine flies (targets), cattle population density (ITC) and ruggedness (SAT). In each case, the suppression technique was deployed at full intensity. The combination of the above factors resulted in eight options, as shown in Table 16. For SIT itself, no ruggedness mask was used, since flying is at higher altitudes than for SAT.
7.2.3 Additional costs Barriers against tsetse reinvasionTo achieve and sustain elimination when the targeted tsetse populations are not isolated, a barrier around the cleared area is needed to prevent reinvasion. These barriers consist of an area on the periphery of the cleared area, where intense tsetse control measures are deployed. Barriers may be permanent or, if the cleared area is to be expanded, temporary. Barriers were costed as being deployed as soon as elimination work begins, and for a total of five years, although it is not possible to be categorical about the length of time a barrier would be needed. In this study, rather than attempting to locate barriers precisely, for simplicity of presentation, the related costs were spread over the whole region, by adding a barrier cost to 10 percent of every km2 cleared. This was based on a theoretical square intervention area of 10 000 km2, with 10 km wide barriers on one side (Shaw et al. 2013a).
Of the techniques considered in the present study, only ITC and targets would be suitable for barriers. As explained above, continuous application of SAT would be neither economic nor environmentally acceptable, and SIT is not considered appropriate as a barrier. For ITC and targets, barriers were costed under the assumption that they would be deployed at double the density used for elimination. Where either ITC or targets are the basic elimination strategy, the same method is deployed for barriers. This reduces costs, because in the first year only half as many additional targets or ITC need to be deployed in the barrier area, since half the number of targets or ITC required for barriers are already being deployed for elimination.
OverheadsOverheads are defined here as all non-field costs. In addition to non-field administrative and office costs for both control and elimination programmes, in the case of elimination they also include any added research costs involved in preliminary entomological and parasitological studies, as well as preparatory work and monitoring.

63Factoring in the costs
The figures detailed in Shaw et al. (2013a), adjusted for inflation and rounded up to avoid giving a spurious impression of accuracy, were used as a basis and resulted in overheads for elimination of $250 per km2 for ITC, targets and SAT and $350 for SIT. These reflect the type of expenditures foreseen in ADF (2004). Ultimately, it is difficult to be categorical about the level of these costs, since they are very closely linked to project and organizational structures and objectives. Projects often include significant research components, which involve investigations that may or may not be needed for every operation. Bouyer et al. (2014) report the cost of studies and preparation at over $2 000 per km2.
With the exception of SAT, the control scenarios would be smaller-scale, more local efforts, sometimes undertaken by livestock keepers, which would not be accompanied by a large project infrastructure. For targets a 10 percent overhead figure was selected, based on Shaw et al. (2013a) and on field data from Shaw et al. (2015a). Since trypanocide use is well established in the region and the ITC costs already include substantial administrative costs, a 5 percent overhead was applied.
7.2.4 Summary of cost estimatesBased on the discussion above, the costs of the continuous control strategies for tsetse and trypanosomosis are presented in Table 15, and those for the creation of tsetse-free zones are given in Table 16.
For continuous control, Table 15 shows both the annual field cost and the total cost over 21 years, discounted at 10 percent. The use of trypanocides is the cheapest option for cattle densities below those that would sustain ITC, regardless of the tsetse species. Otherwise, ITC is the cheapest. The tiny target technology allows for low-cost control in areas where only riverine tsetse are present. Used just once every three years, SAT
TABLE 15Estimated costs of selected continuous tsetse and trypanosomosis control strategies
Technique and applicabilityAnnual
field cost US$
Administrative overheads
%
Total discounted cost over 21 years
US$
Trypanocide prophylaxis 4 doses per bovine per year 8.0 per bovine 5% 98 per bovine
ITC (insecticide-treated cattle)
< 10 cattle km-2 Not feasible
10-50 cattle km-2 36 km-2 5% 441 km-2
> 50 cattle km-2 0.07 per bovine 5% 8.8 per bovine
TargetsSavannah (4 targets km-2) 252 km-2 10% 2 634 km-2
Riverine (10 tiny targets km-2) 142 km-2 10% 1 484 km-2
Riverine + savannah (10 km-2) 629 km-2 10% 6 585 km-2
SAT (aerial spraying) Applied every 3 years (non-rugged areas only); total of 7 applications
483 every 3 years 20% every
3 years
3 104 km-2
Source: Adapted from Shaw et al., 2015b. Notes: Costs per bovine increase in line with projected average annual cattle population growth (2.9%) over the period analysed and are discounted to their present value in the first year and expressed as a value per bovine present at the start of the analysis. Total cost refers to the present value over 21 years, including the initial preparatory year (also described as year 0), discounted at 10%. For these continuous control strategies, which could often be undertaken by the livestock keepers themselves, more modest administrative costs were estimated as a proportion of the field costs and added to the total.

Intervening against bovine trypanosomosis in eastern Africa: mapping the costs and benefits64
TABLE 16Estimated costs of large-scale tsetse elimination strategies
Technique and applicability Overheads
US$ km-2
Initial tsetse suppression
US$ km-2
Field cost of main
technique US$ km-2
Cost ofbarriers
US$ km-2
Totaldiscounted
cost US$ km-2
ITC (insecticide-treated cattle)< 20 cattle km-2 Not feasible
20-50 cattle km-2 250 0 105 76 430
> 50 cattle km-2
250 02.10 /
bovine1.52 /
bovine250 plus
3.62 / bovine
TargetsSavannah (4 targets km-2) 250 0 352 246 848
Riverine (10 tiny targets km-2) 250 0 288 138 676
Riverine + savannah (10 km-2) 250 0 881 614 1 745
SAT (aerial spraying)< 20 cattle km-2 savannah tsetse only 250 0 483 290 1 023< 20 cattle km-2 riverine tsetse only 250 0 483 163 896< 20 cattle km-2 sav. + riv. tsetse 250 0 483 724 1 45720-50 cattle km-2 250 0 483 88 821
> 50 cattle km-2 250 0 483 1.77 / bovine
733 plus 1.77 / bovine
SIT for one tsetse species< 20 cattle savannah, not rugged 350 483 1 748 339 2 920< 20 cattle riverine only, not rugged 350 483 1 748 191 2 772< 20 cattle sav. and riv., not rugged 350 483 1 748 848 3 429< 20 cattle savannah, rugged 350 352 1 748 339 2 789< 20 cattle riverine only, rugged 350 288 1 748 191 2 577< 20 cattle sav. and riv., rugged 350 881 1 748 847 3 82620-50 cattle km-2 350 105 1 748 93 2 296
> 50 cattle km-2 3502.10 /
bovine 1 7481.85 /
bovine2 098 plus
3.95 / bovine
SIT more than one tsetse species Add $664 km-2 per additional species.Source: Adapted from Shaw et al. (2015b).Notes: Costs are US$ km-2 unless otherwise indicated and total costs are discounted at 10% over the period covered by elimination and the deployment of barriers. Costs per bovine refer to bovines present at the start of the period and increase in line with projected average annual cattle population growth (2.9%) over the period analysed, and are discounted to their present value in the first year and expressed as a value per bovine present at the start of the analysis.
is relatively cheap, but the reduced cost should be balanced against the risk of tsetse reinvasion that could be expected between applications. If SAT were applied every second year, the discounted cost over the whole time period would increase to $4 142 and, if applied every year, to $5 515.
Building up the costs of elimination (Table 16) was far more complex, because of the need to factor in the applicability criteria for barriers and, in the case of SIT, for the initial suppression preceding its deployment. Elimination strategies fall roughly into three cost bands: under $700 for ITC, over $2 000 for SIT and between $700 and $2 000 for SAT and targets, depending on fly species and cattle population densities.

65
Chapter 8 Mapping benefit-cost ratios
8.1 ADJUSTING COSTS AND BENEFITS FOR MAPPINGTo obtain benefit-cost ratios, the mapped benefits (Shaw et al., 2014) had to be divided by the mapped costs. Before this could be done, some further adjustments were required.
Assumptions had to be made regarding both the timing and the proportion of potential benefits (as mapped in Shaw et al., 2014) that are estimated to be ‘harvested’ by each technique. Regarding timing, the full benefits from the absence of trypanosomosis are assumed to be harvested rapidly: from one year after the start of the intervention in the case of control activities, and from either one year or, in the case of SIT, halfway through the second year after the start of the elimination activities, to allow for extra time for deploying SIT following suppression by another method.
Regarding the proportion of benefits harvested subsequent to elimination, it was assumed that all losses due to the disease within the cleared area would be avoided, except in the 10 km wide barrier areas on one side of the cleared area, where only half would be avoided. This implies that overall, 95 percent of losses (90 percent plus half of 10 percent) would be avoided.
For two of the three continuous control strategies (trypanocides and targets), the percentage of benefits harvested was set at 75 percent. This is a relatively conservative figure: properly implemented control activities can remove almost all losses due to the disease (Rowlands et al., 1999; Muhanguzi et al., 2014a).
For the three-yearly applications of SAT and for ITC, a lower figure of 60 percent was applied. For ITC, this very conservative figure reflects a degree of uncertainty about what proportion of cattle need to be sprayed over a large area in order to achieve tsetse control. For SAT, since this involves sporadic rather than continuous control measures, it reflects evidence that a tsetse population reinvasion front can move at 6 km per year, where reinvasion occurs from one direction, but where reinvasion occurs from all directions, an area of 10 000 km2 could be reinvaded within two years (Hargrove, 2000).
The cost mapping involved using two possible denominators: as costs were either incurred per bovine (trypanocides, ITC) or per km2 (targets, SAT and SIT). The costs were converted to 2009 values to match the benefits, reflecting the cost inflation of 11.2 percent since then. Next, the relevant suitability criteria were applied to each technique, as explained in Section 7.2. For ITC, substantial areas where there might be too few cattle (threshold set at 10 per km2 for control and 20 per km2 for elimination) were masked out and are shown as ‘technically unsuitable’ on the map. Similarly, for

Intervening against bovine trypanosomosis in eastern Africa: mapping the costs and benefits66
SAT, rugged areas were masked out. These are not clearly visible as they represent a narrow band on the edges of the highland regions of the study area. For targets, the presence of riverine and/or savannah tsetse had to be taken into account, and for SIT, it was important to know the overall number of tsetse species present.
Next, to illustrate the returns to investing in measures against tsetse and trypanosomosis, the benefits from Figure 18 were divided by these costs, to produce benefit-cost ratios over 21 years, discounted at 10 percent. Two sets of four maps were produced: Figure 19 for the four continuous control scenarios and Figure 20 for the four elimination scenarios.
In investment economics, in order for a project to be acceptable, the benefit-cost ratio should be 1 or more, after discounting. All areas yielding less than a benefit-cost ratio of 1 are therefore coloured pink in the map. Above this, benefit-cost ratios are illustrated as progressively darker shades of green.
Paradoxically, there is an area where benefits are accrued outside the tsetse-infested zones. This is due to the emigration of cattle outside the tsetse area, which is itself a consequence of expansion of cattle populations due to absence of disease and better productivity (Chapter 5). In these areas, no geographically anchored benefit-cost ratio can be calculated, since the measures for controlling tsetse and trypanosomosis were applied inside the tsetse-infested zones. These areas occur on the fringes of the tsetse-infested area and are shown on the maps as pale yellow.
Areas unsuitable for cattle production (protected areas such as national parks and reserves) are coloured pale grey, and the areas unsuitable for specific techniques are shown in dark grey, as explained above. Lastly, areas with no tsetse flies or no trypanosomosis related cattle benefits are coloured white.
8.2 THE CONTINUOUS CONTROL SCENARIO MAPS The continuous control strategies contain two approaches whose costs are proportional to the number of cattle (use of trypanocides and ITC) – one that varies according to whether riverine, savannah or both groups of tsetse are present (targets), and one that is applicable everywhere at a similar cost, with the exception of very rugged areas (SAT). They thus realistically illustrate the full range of applicability and of factors influencing costs.
Trypanocide use increases with the size of the cattle population and has a lower cost than the likely benefit per bovine over the 20-year period. Thus a cost of US$98 is always lower than the benefit obtained per bovine. The benefit-cost ratios for using trypanocides therefore fall within a narrower range than those of the other strategies, and predominantly between 1 and 2.
Turning to ITC, firstly, the maps show in dark grey those areas where, at the start of the 20-year period, cattle populations are too low (fewer than 10 per km2) to support the technology. This is a relatively stringent exclusion zone, as the cattle in areas with 6 to 10 cattle per km2 at the start of the 20-year period would have more than 10 cattle per km2 by the end of the period. Here, as elsewhere, the assumptions used have tried to err on the side of caution. Nevertheless, where applicable, ITC yields high benefit-

67Mapping benefit-cost ratios
cost ratios. The areas of potentially high benefits are identified in Figure 18: the mixed farming, high oxen use areas of Ethiopia, the northern shore of Lake Victoria from Kenya extending beyond Lake Kyoga in Uganda, parts of the Kenyan coast and the high dairy use areas of central Kenya all stand out as areas where control using ITC offers high returns – often reaching benefit-cost ratios of more than 20. The absence of pink areas on the map reflects the fact that ITC is, by definition, linked to the basic unit of benefit, cattle. The stringent exclusion areas shaded in grey are mostly those where the other techniques yield low benefit-cost ratios.
As would be expected from looking at Table 15, with targets being substantially more expensive – especially in areas where both riverine and savannah flies are present – Figure 20 (c) shows these as being uneconomic in many parts of the study area. However, they can be used in some rugged areas with low cattle population densities, where neither SAT nor ITC are feasible. In the higher cattle density areas, they offer better returns than year-round trypanocide prophylaxis. While traps are considered to be more expensive than targets, insecticide-impregnated nets or fences may be cheaper, but have been tried on defined subpopulations within cattle keeping areas (e.g. dairy cattle, or selected compounds, see Bauer et al., 2006, 2011; Maia et al., 2010 and Kagbadouno et al., 2011), so would need some refinement of the benefit methodology before the full economic analysis could be undertaken. Costing out this approach is likely to demonstrate that it is profitable.
Lastly, periodic (three yearly) interventions with SAT were costed out, for a total of seven applications. SAT has the advantage of being undertaken in a matter of months and not relying on a large pool of organized manpower in the field. However, this also means that as measures are not permanently in place, fly populations can be rapidly re-established. For this reason, the assumptions used about its impact were conservative – only 60 percent of benefits harvested. On this basis, the returns shown in Figure 20 (d) were lower than for the other strategies. In practice, SAT would probably be deployed when there was a specific and urgent requirement to reduce disease transmission rapidly, and another control technique would be adopted thereafter.
8.3 THE ELIMINATION SCENARIO MAPSTurning to Figure 20, this shows the benefit-cost ratios for elimination, also based on four different approaches. Again, the reader should bear in mind that the modelling and mapping are designed to provide information on likely returns in specific areas – rather than suggesting that a particular strategy be applied over the whole region.
First, the results for ITC are shown. As explained above, ITC is as yet unproven as an elimination strategy. In this estimate, a high minimum cattle density was selected – twice that for control – in order to ensure that there were sufficient cattle present for barriers to be put in place and to allow for situations where cattle might not be sufficiently evenly distributed for ITC to be effective at lower cattle population densities (Torr and Vale, 2011). As noted above, this exclusion of low cattle population areas also excludes many of the pink mapped areas where the other techniques did not realize a benefit-cost ratio of at least 1. In addition, the treatment frequency was doubled. Within the narrow band of effectiveness thus defined,

Intervening against bovine trypanosomosis in eastern Africa: mapping the costs and benefits68
South Sudan
Sudan
Ethiopia
Kenya
Somalia
Uganda
Djibouti
SAT
South Sudan
Sudan
Ethiopia
Kenya
Somalia
Uganda
Djibouti
South Sudan
Sudan
Ethiopia
Kenya
Somalia
Uganda
Djibouti
South Sudan
Sudan
Ethiopia
Kenya
Somalia
Uganda
Djibouti
(a) Trypanocides (b) Insecticide-treated cattle
(c) Targets (d) Aerial spraying - Sequential aerosol technique
Benefit-cost ratios
0 1,000500
Kilometres
Unsuitable for cattle production
Unsuitable for the technique
Benefits absent (tsetse or cattle absent)
Benefits present (tsetse absent)
< 1 1 - 2 2 - 5 5 - 10 10 - 15 15 - 20 > 20
South Sudan
Sudan
Ethiopia
Kenya
Somalia
Uganda
Djibouti
SAT
South Sudan
Sudan
Ethiopia
Kenya
Somalia
Uganda
Djibouti
South Sudan
Sudan
Ethiopia
Kenya
Somalia
Uganda
Djibouti
South Sudan
Sudan
Ethiopia
Kenya
Somalia
Uganda
Djibouti
(a) Trypanocides (b) Insecticide-treated cattle
(c) Targets (d) Aerial spraying - Sequential aerosol technique
Benefit-cost ratios
0 1,000500
Kilometres
Unsuitable for cattle production
Unsuitable for the technique
Benefits absent (tsetse or cattle absent)
Benefits present (tsetse absent)
< 1 1 - 2 2 - 5 5 - 10 10 - 15 15 - 20 > 20
FIGURE 19Benefit-cost ratios for control options(Benefits over 20 years divided by costs for each control strategy, both discounted at 10%)
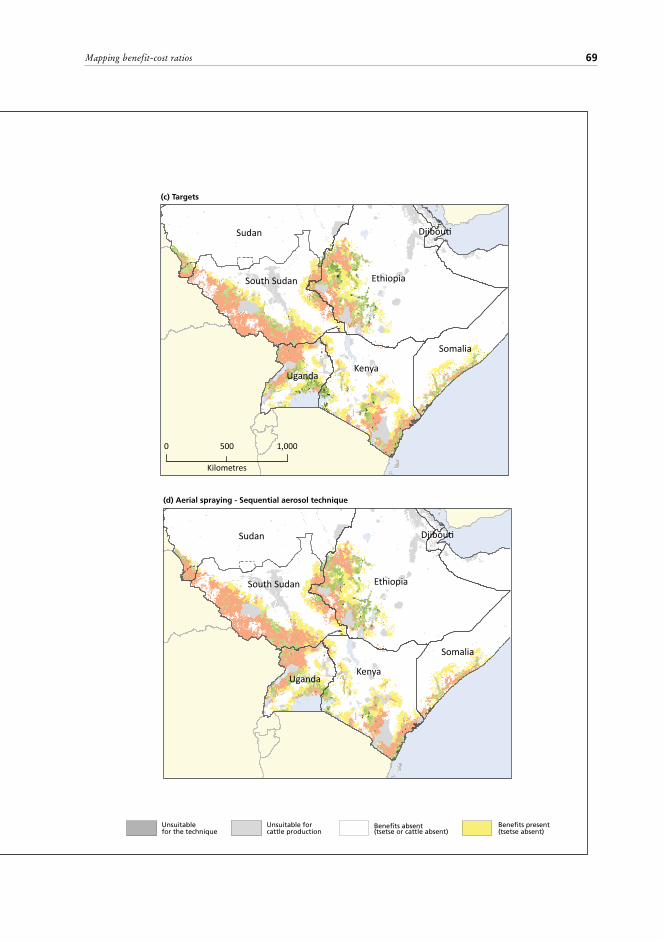
69Mapping benefit-cost ratios
South Sudan
Sudan
Ethiopia
Kenya
Somalia
Uganda
Djibouti
SAT
South Sudan
Sudan
Ethiopia
Kenya
Somalia
Uganda
Djibouti
South Sudan
Sudan
Ethiopia
Kenya
Somalia
Uganda
Djibouti
South Sudan
Sudan
Ethiopia
Kenya
Somalia
Uganda
Djibouti
(a) Trypanocides (b) Insecticide-treated cattle
(c) Targets (d) Aerial spraying - Sequential aerosol technique
Benefit-cost ratios
0 1,000500
Kilometres
Unsuitable for cattle production
Unsuitable for the technique
Benefits absent (tsetse or cattle absent)
Benefits present (tsetse absent)
< 1 1 - 2 2 - 5 5 - 10 10 - 15 15 - 20 > 20
South Sudan
Sudan
Ethiopia
Kenya
Somalia
Uganda
Djibouti
SAT
South Sudan
Sudan
Ethiopia
Kenya
Somalia
Uganda
Djibouti
South Sudan
Sudan
Ethiopia
Kenya
Somalia
Uganda
Djibouti
South Sudan
Sudan
Ethiopia
Kenya
Somalia
Uganda
Djibouti
(a) Trypanocides (b) Insecticide-treated cattle
(c) Targets (d) Aerial spraying - Sequential aerosol technique
Benefit-cost ratios
0 1,000500
Kilometres
Unsuitable for cattle production
Unsuitable for the technique
Benefits absent (tsetse or cattle absent)
Benefits present (tsetse absent)
< 1 1 - 2 2 - 5 5 - 10 10 - 15 15 - 20 > 20

Intervening against bovine trypanosomosis in eastern Africa: mapping the costs and benefits70
FIGURE 20Benefit-cost ratios for tsetse elimination options (Benefits over 20 years divided by costs for each elimination strategy, both discounted at 10%)
South Sudan
Sudan
Ethiopia
Kenya
Somalia
Uganda
Djibouti
South Sudan
Sudan
Ethiopia
Kenya
Somalia
Uganda
Djibouti
South Sudan
Sudan
Ethiopia
Kenya
Somalia
Uganda
Djibouti
South Sudan
Sudan
Ethiopia
Kenya
Somalia
Uganda
Djibouti
(a) Insecticide-treated cattle (b) Targets
(c) Aerial spraying - Sequential aerosol technique (d) Sterile insect technique
0 1,000500
Kilometres
Benefit-cost ratios - Control scenarios
Unsuitable for cattle production
Unsuitable for the technique
Benefits absent (tsetse or cattle absent)
Benefits present (tsetse absent)
< 1 1 - 2 2 - 5 5 - 10 10 - 15 15 - 20 > 20
South Sudan
Sudan
Ethiopia
Kenya
Somalia
Uganda
Djibouti
South Sudan
Sudan
Ethiopia
Kenya
Somalia
Uganda
Djibouti
South Sudan
Sudan
Ethiopia
Kenya
Somalia
Uganda
Djibouti
South Sudan
Sudan
Ethiopia
Kenya
Somalia
Uganda
Djibouti
(a) Insecticide-treated cattle (b) Targets
(c) Aerial spraying - Sequential aerosol technique (d) Sterile insect technique
0 1,000500
Kilometres
Benefit-cost ratios - Control scenarios
Unsuitable for cattle production
Unsuitable for the technique
Benefits absent (tsetse or cattle absent)
Benefits present (tsetse absent)
< 1 1 - 2 2 - 5 5 - 10 10 - 15 15 - 20 > 20
South Sudan
Sudan
Ethiopia
Kenya
Somalia
Uganda
Djibouti
SAT
South Sudan
Sudan
Ethiopia
Kenya
Somalia
Uganda
Djibouti
South Sudan
Sudan
Ethiopia
Kenya
Somalia
Uganda
Djibouti
South Sudan
Sudan
Ethiopia
Kenya
Somalia
Uganda
Djibouti
(a) Trypanocides (b) Insecticide-treated cattle
(c) Targets (d) Aerial spraying - Sequential aerosol technique
Benefit-cost ratios
0 1,000500
Kilometres
Unsuitable for cattle production
Unsuitable for the technique
Benefits absent (tsetse or cattle absent)
Benefits present (tsetse absent)
< 1 1 - 2 2 - 5 5 - 10 10 - 15 15 - 20 > 20

71Mapping benefit-cost ratios
South Sudan
Sudan
Ethiopia
Kenya
Somalia
Uganda
Djibouti
South Sudan
Sudan
Ethiopia
Kenya
Somalia
Uganda
Djibouti
South Sudan
Sudan
Ethiopia
Kenya
Somalia
Uganda
Djibouti
South Sudan
Sudan
Ethiopia
Kenya
Somalia
Uganda
Djibouti
(a) Insecticide-treated cattle (b) Targets
(c) Aerial spraying - Sequential aerosol technique (d) Sterile insect technique
0 1,000500
Kilometres
Benefit-cost ratios - Control scenarios
Unsuitable for cattle production
Unsuitable for the technique
Benefits absent (tsetse or cattle absent)
Benefits present (tsetse absent)
< 1 1 - 2 2 - 5 5 - 10 10 - 15 15 - 20 > 20
South Sudan
Sudan
Ethiopia
Kenya
Somalia
Uganda
Djibouti
South Sudan
Sudan
Ethiopia
Kenya
Somalia
Uganda
Djibouti
South Sudan
Sudan
Ethiopia
Kenya
Somalia
Uganda
Djibouti
South Sudan
Sudan
Ethiopia
Kenya
Somalia
Uganda
Djibouti
(a) Insecticide-treated cattle (b) Targets
(c) Aerial spraying - Sequential aerosol technique (d) Sterile insect technique
0 1,000500
Kilometres
Benefit-cost ratios - Control scenarios
Unsuitable for cattle production
Unsuitable for the technique
Benefits absent (tsetse or cattle absent)
Benefits present (tsetse absent)
< 1 1 - 2 2 - 5 5 - 10 10 - 15 15 - 20 > 20
South Sudan
Sudan
Ethiopia
Kenya
Somalia
Uganda
Djibouti
SAT
South Sudan
Sudan
Ethiopia
Kenya
Somalia
Uganda
Djibouti
South Sudan
Sudan
Ethiopia
Kenya
Somalia
Uganda
Djibouti
South Sudan
Sudan
Ethiopia
Kenya
Somalia
Uganda
Djibouti
(a) Trypanocides (b) Insecticide-treated cattle
(c) Targets (d) Aerial spraying - Sequential aerosol technique
Benefit-cost ratios
0 1,000500
Kilometres
Unsuitable for cattle production
Unsuitable for the technique
Benefits absent (tsetse or cattle absent)
Benefits present (tsetse absent)
< 1 1 - 2 2 - 5 5 - 10 10 - 15 15 - 20 > 20

Intervening against bovine trypanosomosis in eastern Africa: mapping the costs and benefits72
ITC always yields a very high return, again particularly in the areas of west-central Ethiopia, the northern shore of Lake Victoria, Uganda’s cattle corridor, central Kenya and along the Kenyan and Somalian coast, with returns uniformly high – yielding benefit-cost ratios of 15 or above.
Looking at targets, as would be expected, these can, in theory, be applied throughout the tsetse-infested area, although in remote regions or areas of very dense vegetation, costs would increase. The map shows that using targets could yield respectable benefit-cost ratios, of 5 or more in a number of areas where elimination using ITC might not be feasible – in particular in western Ethiopia and on the fringes of the coastal tsetse fly belts of Kenya and Somalia.
Although the basic field cost of SAT (estimated at just under $500 per km2) is lower than targets in areas of mixed (savannah plus riverine) fly infestation, the need for target barriers increases the cost of elimination using this method, so that its overall cost is similar to that of targets. Over the whole region, however, it comes out as slightly more profitable, reaching higher benefit-cost ratios than targets in some areas of high losses due to trypanosomosis, such as the north of Lake Victoria, Ethiopia and the South Sudan/Uganda border area.
Turning to SIT, this technique is used in conjunction with other techniques and is usually recommended where other approaches are not able to deal with tsetse effectively. The SIT component adds $1 748 to costs for dealing with one tsetse species, and a further 38 percent of that amount for each additional tsetse species needing to be dealt with. Here, the approach has been to assume, in line with current recommendations (Feldmann and Parker, 2010) that other technologies are deployed first. As a result, the costings show, for each situation, the initial use of the least expensive technique for the period normally required to achieve elimination (for example 5 cycles of SAT), followed by the deployment of SIT. Following elimination, as was the case for the other technologies, either an ITC or a target barrier is deployed for five years. The cost mapped here is based on interventions on a larger scale (over 10 000 km2) than has so far been attempted. Despite the fact that the mapped cost was estimated to be less than half that of recently recorded small-scale interventions (Msangi et al., 2000; Bouyer et al., 2014), SIT is still significantly more costly than other approaches, and this is reflected in the benefit-cost ratios illustrated in Figure 20 (d).
The areas of relatively low cattle population density, and therefore low losses (or potential benefits as shown in Figure 18), stand out in pink, as unsuitable for high-cost interventions within the current time frame – or when considering only losses in cattle. For example, if HAT were factored in, different priorities and benefit values would need to be considered. For cattle, the high loss areas that emerge from Figure 18 are highlighted again in Figures 19 and 20 as strongly meriting intervention.
8.4 EXPLORING CHANGES IN ASSUMPTIONS – SOME SENSITIVITY ANALYSESThe maps above were based on a set of consistent cost and impact assumptions, drawn from available field experience (Chapter 7 and Section 8.1). In this section, some of the assumptions are varied, with respect to the key parameters of scale and impact.
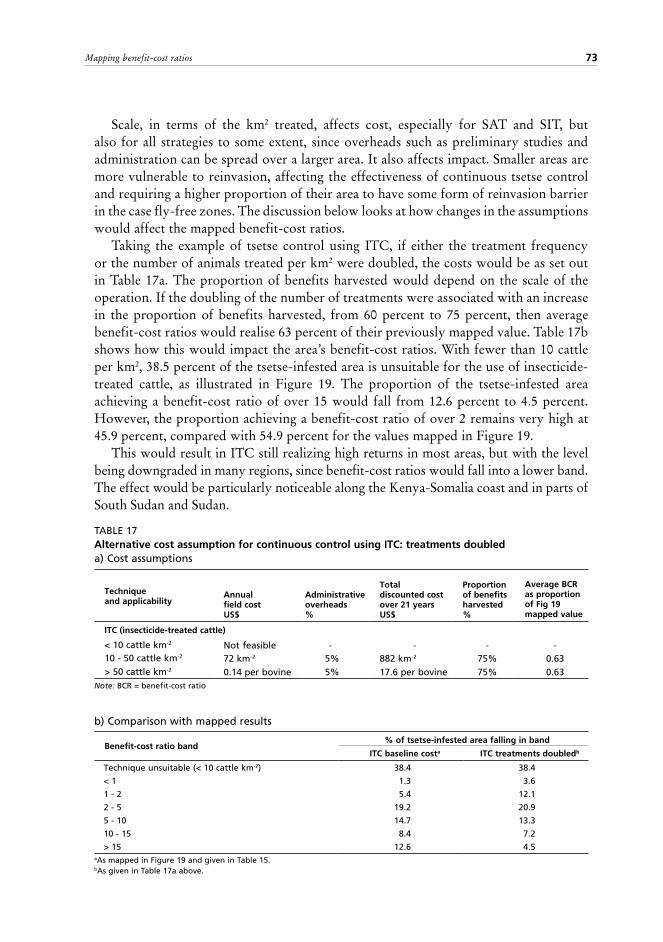
73Mapping benefit-cost ratios
Scale, in terms of the km2 treated, affects cost, especially for SAT and SIT, but also for all strategies to some extent, since overheads such as preliminary studies and administration can be spread over a larger area. It also affects impact. Smaller areas are more vulnerable to reinvasion, affecting the effectiveness of continuous tsetse control and requiring a higher proportion of their area to have some form of reinvasion barrier in the case fly-free zones. The discussion below looks at how changes in the assumptions would affect the mapped benefit-cost ratios.
Taking the example of tsetse control using ITC, if either the treatment frequency or the number of animals treated per km2 were doubled, the costs would be as set out in Table 17a. The proportion of benefits harvested would depend on the scale of the operation. If the doubling of the number of treatments were associated with an increase in the proportion of benefits harvested, from 60 percent to 75 percent, then average benefit-cost ratios would realise 63 percent of their previously mapped value. Table 17b shows how this would impact the area’s benefit-cost ratios. With fewer than 10 cattle per km2, 38.5 percent of the tsetse-infested area is unsuitable for the use of insecticide-treated cattle, as illustrated in Figure 19. The proportion of the tsetse-infested area achieving a benefit-cost ratio of over 15 would fall from 12.6 percent to 4.5 percent. However, the proportion achieving a benefit-cost ratio of over 2 remains very high at 45.9 percent, compared with 54.9 percent for the values mapped in Figure 19.
This would result in ITC still realizing high returns in most areas, but with the level being downgraded in many regions, since benefit-cost ratios would fall into a lower band. The effect would be particularly noticeable along the Kenya-Somalia coast and in parts of South Sudan and Sudan.
TABLE 17Alternative cost assumption for continuous control using ITC: treatments doubled a) Cost assumptions
Technique and applicability
Annual field cost US$
Administrativeoverheads %
Total discounted cost over 21 years US$
Proportion of benefits harvested %
Average BCR as proportion of Fig 19 mapped value
ITC (insecticide-treated cattle)
< 10 cattle km-2 Not feasible - - - -10 - 50 cattle km-2 72 km-2 5% 882 km-2 75% 0.63> 50 cattle km-2 0.14 per bovine 5% 17.6 per bovine 75% 0.63
Note: BCR = benefit-cost ratio
b) Comparison with mapped results
Benefit-cost ratio band% of tsetse-infested area falling in band
ITC baseline costa ITC treatments doubledb
Technique unsuitable (< 10 cattle km-2) 38.4 38.4
< 1 1.3 3.6
1 - 2 5.4 12.1
2 - 5 19.2 20.9
5 - 10 14.7 13.3
10 - 15 8.4 7.2
> 15 12.6 4.5aAs mapped in Figure 19 and given in Table 15.bAs given in Table 17a above.

Intervening against bovine trypanosomosis in eastern Africa: mapping the costs and benefits74
For elimination using SIT, the cost used for the benefit-cost ratios mapped in Figure 20 averaged just under $3 000 per km2 for an intervention area of 10 000 km2, compared with $8 200 for 1 000 km2 in Senegal, and $5 100 for 1 600 km2 in Tanzania (Bouyer et al., 2014 and Msangi et al., 2000). In Table 18, a series of changes in the assumptions is explored. Using the same cost assumptions and cost levels described in Section 7.2.2, Table 18a costs out an intervention over 2 000 km2, while 18b calculates costs over 1 000 km2. The figures were derived by:
• adjusting what proportion of the area would need to be barriers, as before these were costed on the basis of a width of 10 km along roughly one-quarter of the circumference of the treated area;
• incorporating scale adjustments in the SIT estimate, which thus rises from $1 758 to $2 404 and $3 645 (the latter figure as derived for Senegal by Bouyer et al., 2014) and making similar adjustments to the cost for additional tsetse species;
• increasing the cost of SAT for suppression by factors of 1.4 and 2 respectively, in line with the figures derived by Barrett (1997) and the figures for the cost of flying analysed for SIT in Section 7.2.2, while maintaining other suppression costs (targets and ITC) constant, as the costs used for mapping these are also applicable to smaller-scale operations;
• increasing the cost of overheads and preliminary studies from $350 to $700 and $900 respectively.
On these assumptions, at a scale of 2 000 km2, the cost per species averaged out over all eight scenarios would rise to $3 776 per km2 (Table 18a). For an area of 1 000 km2, the cost would average $5 528 per km2 (Table 18b).The benefit-cost ratios would then respectively decline to 0.63 and 0.44 of their mapped value in Figure 20. If, in addition, the administrative and overhead costs as recorded for Senegal (Bouyer et al., 2014) were applied, the cost per km2 would rise to $8 000, similar to the cost level recorded in that study.
To show how the benefit-cost ratios in each band of profitability would be affected, Table 18c gives figures for the benefit-cost ratios achieved using SIT for elimination, for the whole tsetse-infested area of just over 650 000 km2. For a project area of 10 000 km2, benefit-cost ratios of over 1 are achieved in 37.0 percent of the area. This falls to 29.5 percent for an area of 2 000 km2, and to just 20.4 percent for an area of 1 000 km2. For benefit-cost ratios over 2, the figures are 23.1 percent, 14.8 percent and 11.1 percent respectively. However, the ‘high return’ areas continue to be viable. The proportion of the area achieving benefit-cost ratios of 15 or over was 8.3 percent, 7.0 percent and 6.4 percent for project areas of 10 000, 2 000 and 1 000 km2, respectively.
Lastly, Table 18d was constructed in order to explore more fully the impact of varying several variables:
• the area treated;• the cost of administration and other overheads, including preliminary studies;• the proportion of the area under barriers (0 percent for an isolated population, then a
lower figure representing a reinvasion front along about 1/4 of the area’s borders and a higher figure representing a reinvasion front along about 1/2 of the area’s borders.
• the increase in the cost of suppression at smaller scales.The last column shows the value of the average benefit-cost ratio as a proportion
of that mapped in Figure 20. This table indicates that, whereas changing the cost of
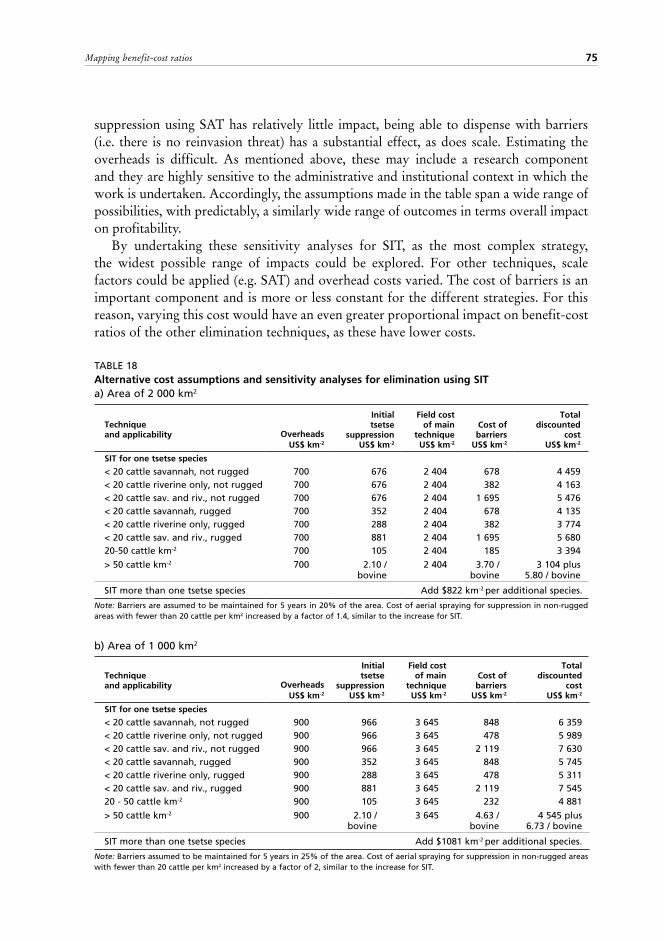
75Mapping benefit-cost ratios
suppression using SAT has relatively little impact, being able to dispense with barriers (i.e. there is no reinvasion threat) has a substantial effect, as does scale. Estimating the overheads is difficult. As mentioned above, these may include a research component and they are highly sensitive to the administrative and institutional context in which the work is undertaken. Accordingly, the assumptions made in the table span a wide range of possibilities, with predictably, a similarly wide range of outcomes in terms overall impact on profitability.
By undertaking these sensitivity analyses for SIT, as the most complex strategy, the widest possible range of impacts could be explored. For other techniques, scale factors could be applied (e.g. SAT) and overhead costs varied. The cost of barriers is an important component and is more or less constant for the different strategies. For this reason, varying this cost would have an even greater proportional impact on benefit-cost ratios of the other elimination techniques, as these have lower costs.
TABLE 18Alternative cost assumptions and sensitivity analyses for elimination using SIT a) Area of 2 000 km2
Technique and applicability Overheads
US$ km-2
Initial tsetse
suppressionUS$ km-2
Field cost of main
technique US$ km-2
Cost ofbarriers
US$ km-2
Totaldiscounted
cost US$ km-2
SIT for one tsetse species
< 20 cattle savannah, not rugged 700 676 2 404 678 4 459< 20 cattle riverine only, not rugged 700 676 2 404 382 4 163< 20 cattle sav. and riv., not rugged 700 676 2 404 1 695 5 476< 20 cattle savannah, rugged 700 352 2 404 678 4 135< 20 cattle riverine only, rugged 700 288 2 404 382 3 774< 20 cattle sav. and riv., rugged 700 881 2 404 1 695 5 68020-50 cattle km-2 700 105 2 404 185 3 394
> 50 cattle km-2 700 2.10 / bovine
2 404 3.70 / bovine
3 104 plus 5.80 / bovine
SIT more than one tsetse species Add $822 km-2 per additional species.
Note: Barriers are assumed to be maintained for 5 years in 20% of the area. Cost of aerial spraying for suppression in non-rugged areas with fewer than 20 cattle per km2 increased by a factor of 1.4, similar to the increase for SIT.
b) Area of 1 000 km2
Technique and applicability Overheads
US$ km-2
Initial tsetse
suppressionUS$ km-2
Field cost of main
technique US$ km-2
Cost ofbarriers
US$ km-2
Totaldiscounted
cost US$ km-2
SIT for one tsetse species
< 20 cattle savannah, not rugged 900 966 3 645 848 6 359 < 20 cattle riverine only, not rugged 900 966 3 645 478 5 989 < 20 cattle sav. and riv., not rugged 900 966 3 645 2 119 7 630 < 20 cattle savannah, rugged 900 352 3 645 848 5 745 < 20 cattle riverine only, rugged 900 288 3 645 478 5 311 < 20 cattle sav. and riv., rugged 900 881 3 645 2 119 7 545 20 - 50 cattle km-2 900 105 3 645 232 4 881
> 50 cattle km-2 900 2.10 / bovine
3 645 4.63 / bovine
4 545 plus 6.73 / bovine
SIT more than one tsetse species Add $1081 km-2 per additional species.
Note: Barriers assumed to be maintained for 5 years in 25% of the area. Cost of aerial spraying for suppression in non-rugged areas with fewer than 20 cattle per km2 increased by a factor of 2, similar to the increase for SIT.

Intervening against bovine trypanosomosis in eastern Africa: mapping the costs and benefits76
c) Impact of scale on distribution of benefit-cost ratios within the tsetse-infested area
Benefit-cost ratio band
% of tsetse-infested area falling in band
10 000 km2 scale 2 000 km2 scale 1 000 km2 scale
< 1 63.0 70.5 79.61 - 2 13.9 14.7 9.32 - 5 12.4 5.1 1.75 - 10 1.3 1.2 2.010 - 15 1.1 1.5 1.0> 15 8.3 7.0 6.4
d) Sensitivity analysis for variations in scale, area under barriers, cost of studies and suppression
Assumptions Impact on costs and benefits
Treatment area km2
Barriers as proportion of treated
area %Studies
km-2Suppression
cost
Average
costaa US$ km-2
Proportion of
benefits harvestedb
%
BCR as proportion
of Fig 20 mapped
valuec
10 000d 10 350 baseline 2 875 95 1.0010 000 10 1 000 baseline 3 525 95 0.8210 000 20 250 baseline 3 251 90 0.8410 000 0 350 baseline 2 500 100 1.212 000e 20 700 SAT x 1.4 4 327 90 0.632 000 20 700 baseline 4 255 90 0.642 000 20 1 500 SAT x 1.4 5 127 90 0.532 000 40 700 SAT x 1.4 5 074 80 0.482 000 0 700 SAT x 1.4 3 581 100 0.851 000f 25 900 SAT x 2 6 064 87.5 0.441 000 25 900 baseline 5 882 87.5 0.451 000 25 2 000 SAT x 2 7 164 87.5 0.371 000 50 900 SAT x 2 6 997 75 0.321 000 0 900 SAT x 2 5 130 100 0.59
Note: BCR = benefit-cost ratio a averaged over the 8 strategy options for dealing with a single species of tsetse; b the proportion of benefits harvested is varied only in relation to the proportion of the area with barriers;c ratio of BCR obtained for this strategy to Fig. 20 mapped BCR; d strategy mapped in Fig. 20; d,e,f baseline strategies to which figures in Table 18c refer.
8.5 INTERPRETING THE BENEFIT-COST MAPS
As stated for the benefits, it should be kept in mind that while the maps both cover the whole zone, and have been calculated and mapped pixel by pixel, they have been designed to offer insights as to how the economics of intervening compare area by area. The mapping of benefits or benefit-cost ratios does not imply that a particular intervention would be implemented throughout the entire mapped zone – or even necessarily on a large scale. More often, combinations of techniques might be used. However, mapping such combinations would involve selecting from a large number of combinations and losing the clarity of investigating each technique independently. Similarly, control was calculated as occurring at the same level year after year. In practice, control activities are often sustained for some years, then relaxed, then resumed.
In the context of the use of multiple techniques, recent costings (Adam et al., 2013 in Ghana and Bouyer et al., 2014 in Senegal) both include costs of deploying targets and ITC for suppression; in the case of the former, some ground spraying was also undertaken. It
77Mapping benefit-cost ratios
should be noted that the costings here only include suppression as preliminary to using SIT. During suppression, the techniques are costed as being deployed at the same intensity as for full elimination – in line with the proposed protocol (Feldmann and Parker, 2010) that SIT only be used for elimination where other techniques are not able to achieve this. In both the Senegal and Ghana examples, the suppression techniques were deployed at lower densities than in the costings undertaken in Chapter 7. Adding together all units (ITC and targets), the density per km2 of suitable habitat was 10 in Ghana and 17 in Senegal, averaging out at just under 4 per km2 of the total area. The costs calculated in Chapter 7 and mapped all refer to total area, rather than suitable habitat.
As explained in Chapter 7, the baseline cost calculations assume a larger area for the elimination strategies (~ 10 000 km2); for the control strategies, smaller-scale operations are envisaged. Pixel by pixel, the maps indicate what is possible – scale becomes important only where the overheads linked to certain interventions cannot easily be subdivided, or where the intervention needs to be applied on a larger scale in order to be effective, or for the calculated costs to be relevant. Thus, Table 18 shows how scale affects the costs of SIT – and SAT costs also rise if smaller areas are treated. Similarly, for ITC, where individual villages – or even more so – individuals within villages treat their own cattle, higher numbers will need to be treated to achieve the same level of tsetse control. More information on this is emerging from field work (Muhanguzi et al., 2014) and modelling (Hargrove et al., 2012, Kajunguri et al., 2014).
The costs as calculated and mapped imply that each technique is used efficiently, consistently and effectively. In order to create a baseline for comparisons, it was necessary to assume that each technique was deployed as smoothly as possible and without interruption between one stage and the next. The calculations would therefore not reflect the type of situation often encountered in the field, where funding interruptions, supply difficulties and technical hitches result in patchy implementation over a long period. That is not to say that continuous implementation does not happen – just that there is no obvious way of creating a uniform set of comparable costs for such diverse techniques, which would take such eventualities into account. A more complex calculation could perhaps explore the possible impact of some of the more predictable sources of interruption. For example, during the rainy seasons, targets are less effective, and in certain places it is not possible to control/suppress tsetse all year round due to climatic conditions.
The cost maps do not explicitly take into account some environmental variables, which might have a bearing on the feasibility of interventions. Particularly important is vegetation density – which directly affects choice of technique and cost. Remoteness, in relation to labour availability and the need to build roads, is another such factor. As was noted for the initial study in West Africa (Shaw et al., 2006), in this study, trypanosomosis risk or tsetse challenge has been indirectly rather than directly incorporated. For example, which trypanosome species are involved is not explicitly factored in. Instead, cattle productivity in the presence and absence of trypanosomosis was estimated using studies on the impact of trypanosomosis on cattle for various regions and production systems in eastern Africa.

Intervening against bovine trypanosomosis in eastern Africa: mapping the costs and benefits78
On the other hand, the level of costs as calculated here do allow for barriers, full overheads, preliminary studies and livestock keepers’ time, rather than just focusing on the marginal direct costs of each intervention (such as targets, insecticide, flying hours, etc.).
Who pays for interventions against tsetse and trypanosomosis is important when interpreting benefit-cost ratios. A benefit-cost ratio of three (following discounting at 10 percent) may be fairly attractive for a donor or a government department, while being quite low from most livestock keepers’ viewpoints. Urgent and competing demands for cash and labour, a lower risk profile and – especially in mixed farming communities – a limited commitment to investment in non-essential livestock, means that livestock keepers have to look for higher returns before investing their very scarce resources.
Time horizon, risk and discounting When interpreting the maps, it should be remembered that the mapped benefit-cost ratios already incorporate a 10 percent annual profit as a minimum cut-off rate, by virtue of the discounting process (see Section 1.2).
The use of a relatively high discount rate is less advantageous to elimination than a lower rate would be, because the costs occur early on in the modelled period, whereas the benefits continue throughout it. For the elimination scenarios, applying a lower rate of 7.5 percent would increase the benefits by 26 percent, while having little effect on costs, as these are normally incurred at the start of the time period. Thus, benefit-cost ratios would increase by around 26 percent. For control, averaged over the different strategies, benefits would increase by 28 percent, while costs would increase by 19 percent, so that benefit-cost ratios would only increase by 8 percent. Conversely, if the discount rate were increased to 12.5 percent, the benefit-cost ratios would typically be 82 percent and 92 percent of their mapped values for elimination and control respectively.
Similarly, the cut-off period of 20 years is regarded as an appropriate period for the modelling. Beyond this time horizon, so many other factors are likely to change that the projections would be increasingly less accurate. The impact of discounting is such that, using a 10 percent discount rate, extending the period over which benefits are quantified from 20 to 50 years would only add 16 percent to their value. Doing this would not materially change a benefit-cost ratio. Nor would it change the relative values of the mapped benefits – the same areas would still emerge as priority areas.
Risk and probability of success were not explicitly taken into account in this analysis. Instead, some specific sensitivity analyses were undertaken. As illustrated in Section 8.4, Table 18(c), it is possible to vary the assumptions about cost levels and the proportions of benefits harvested, and hence estimate the impact on benefit-cost ratios.
The choice of benefit-cost ratio to quantify economic returns also makes the results largely independent of a particular time period and set of prices, provided there are no major changes in relative prices. Thus the maps are designed to lend themselves easily to recalibration or reinterpretation by the user, according to expected shortfalls or increases in either benefits or costs.

79
Chapter 9 Conclusions
9.1 THE MAPS AS DECISION SUPPORTThe benefit-cost ratio maps presented in the previous chapter are an output that has grown out of some two decades of work on prioritization and guidelines in the field of tsetse and trypanosomosis, comprising both spatial analyses and work on the economic benefits and costs of a range of interventions. The monetary maps should thus be seen as something which both complements and has evolved from several strands of effort, under the aegis of PAAT and PPLPI, rather than as a standalone product (Figure 21). Taken together, all these outputs support decision-making in this field, with the monetary maps focusing on the economics.
The PAAT Technical and Scientific (T&S) series of papers has provided significant inputs, both on the spatial analyses and the economics of tsetse and trypanosomosis activities. Swallow (2000) brought together the existing information on the economic impact of trypanosomosis on livestock and agriculture, Shaw (2003) examined the key benefit and cost components and what influences them, and the mapping the benefits (MTB) methodology was developed and tested for West Africa in Shaw et al. (2006). Three other PAAT T&S series papers have looked at the potential of mapped variables for informing tsetse and trypanosomosis decision-making: Hendrickx et al. (2004), Cecchi et al. (2008) and Cecchi and Mattioli (2009). The basic maps that underpin both the benefit and benefit-cost ratio maps – including cattle distribution, tsetse distribution and accessibility – are taken from several FAO databases: the PAAT Information System (PAAT-IS), the Gridded Livestock of the World (GLW) and the IGAD-data produced as part of the joint PPLPI and IGAD LPI (Gilbert et al., 2001; Pender et al., 2001; Wint and Robinson, 2007; Pozzi and Robinson, 2008 and Pozzi et al., 2010). The cost analysis for the benefit-cost ratio maps evolved from
PAAT-IS, GLWPPLPI/IGAD-LPIData & maps:tsetse, cattle, accessibility
PPLPI/IGAD-LPI Costs of interventions
against tsetse & tryps
PAAT & WHO Disease distribution
maps; people & cattle
Multi-disciplinary GIS-based decision-
support tools on the economics of tsetse &
tryps interventions
PAAT T&SSeries
papers on economics, GIS & MTB
FIGURE 21A suite of materials underpinning economic decision-making
in the field of tsetse and trypanosomosis

Intervening against bovine trypanosomosis in eastern Africa: mapping the costs and benefits80
work undertaken as another PPLPI paper (Shaw et al., 2007). Lastly, although these have not been directly incorporated into the benefit-cost models that underpin the maps, advances have been made on mapping the distribution of the disease in humans (Simarro et al., 2010 and 2012b) and animals (Cecchi et al., 2014) and tsetse (Cecchi et al., 2015). Aspects of these could be incorporated in future monetary mapping. Of course, this study has also relied on much other work – as the long list of references demonstrates.
It is hoped that the monetary maps can aid planners by: • highlighting areas and production systems where trypanosomosis imposes high
losses on livestock keepers;• indicating where interventions other than the use of trypanocides are likely to
yield high benefits;• informing choice of technique and strategy; and• providing a basis for more detailed, smaller-scale studies which could also
involve monetary mapping.As demonstrated in Section 8.4, the benefit-cost mapping technique also allows for
the incorporation of a range of sensitivity analyses.
9.2 INFORMING THE WHAT, WHERE AND HOW OF INTERVENTIONS AGAINST TSETSE AND TRYPANOSOMOSIS The issues involved in interpreting the maps have been discussed in Sections 6.2 and 8.5, where their limitations were explored. With those provisos, this study points to some clear conclusions for its two target groups – first the IGAD member states and, secondly, policy-makers in the field of tsetse and trypanosomosis control in general.
9.2.1 Which livestock production systems are affected and how these might evolve over timeThe livestock production systems of the IGAD region have been mapped, incorporating livelihood data and cattle management systems’ characteristics, thereby taking into account people’s income sources and animal husbandry choices, in addition to the more traditionally mapped climatic variables. This information provides a general tool for planning and intervention in the field of livestock development for the IGAD member states.
The bio-economic herd models provide order of magnitude estimates for livestock related income and for cattle population growth rates in these production systems, with the proviso that the studies and information used to model these systems were selected because of their applicability to the tsetse-infested zones of the region.
The results of the study highlight the economic importance of draught oxen and grade dairy cattle in the livestock economies of the region, together with their relatively high mortality and variable productivity, showing that any interventions to improve their productivity would be beneficial. In this context, once again, it is important to be aware that the selected production parameters were typical of those

81Conclusions
production systems within the tsetse-infested zones, rather than in tsetse-free areas, where different constraints and advantages undoubtedly apply.
Although within the pastoral and agropastoral systems in the region, both monetary incomes per bovine and losses due to trypanosomosis per bovine are lower than for the mixed farming systems (Table 12), it is important to bear in mind that this does not necessarily mean that these are low priority systems for intervention. These are systems where livestock make a high contribution to livelihoods, so the impact of the disease in bovines on human welfare is very significant.
The presence of some livestock diseases constrains livestock producers’ choices, leading to ‘lost potential’ (Perry and Randolph, 1999). The extent to which freedom from the risk of trypanosomosis would enable local farmers to change their production systems is often discussed, and sometimes quantified. The potential for increased use of ox traction was estimated by Putt et al. (1980) and Bouyer et al. (2014) quantified the potential for improved dairying using more productive cattle breeds in a zone near Dakar, the Senegalese capital. The benefit maps in this study allow for both increases in the use of work oxen and grade dairy cattle (see Sections 3.2, 3.3 and 4.3), as well as for cattle population expansion and movement into new areas. However, it must be recognized that there are multiple constraints to production system change, ranging from the availability of markets to other livestock diseases, notably ECF. For example, in Ethiopia, although well over three-quarters of the cattle population are currently located outside the tsetse-infested areas, less than 1 percent of cattle are of exotic breeds or hybrids (Yilma et al., 2011).
Another issue that has often been often discussed in the context of improving livestock productivity is the risk of overgrazing, which might be associated with increased livestock populations (see, for example, Ormerod, 1976, writing principally in the context of large-scale tsetse elimination). In this study, as explained in Section 4.4, changes in offtake rates were not modelled, due above all to a lack of evidence to support whether producers with more productive herds would choose to sell more stock, or retain more stock. Within the context of this analysis, whose objective is to show what benefits could be harvested on various scales, at various times, a sudden and sustained increase in cattle populations throughout the zone is not envisaged. As can be seen from Figure 13 (current use of available carrying capacity), while some areas within the region already have very high stocking rates, most of these lie outside the tsetse-infested area (Figure 2), within which there is spare capacity, with the exception of some of the Kenya coast, southeastern Uganda and parts of western Ethiopia. The spread model allows for cattle expansion outside these areas and the modelled results do not indicate a significant increase in overstocking. Although outside the scope of this study, it is likely that cattle keepers will make adjustments to their herd sizes and offtake. Where cattle population spread is occurring, whether or not this is linked to the control of animal trypanosomosis, it is important that enabling policies and measures are put in place to support sustainable livestock production within carrying capacity limits and to avoid environmental damage.

Intervening against bovine trypanosomosis in eastern Africa: mapping the costs and benefits82
9.2.2 Where the losses from trypanosomosis are most severeThe potential benefits maps show that, in certain localities within the IGAD region, trypanosomosis is a very costly problem, causing high losses per km2 when viewed over the 20-year time period. Particularly striking are the cases of western Ethiopia, areas of Kenya with grade dairy cattle or high numbers of work oxen, the area around Lake Victoria, as well as parts of the Ugandan cattle corridor and the Kenyan and Somalian coastal belt. Although livestock output prices in US dollars were similar, the losses per km2 due to the disease tend to be higher than those estimated for West Africa, and are also geographically more concentrated, reflecting the patchier tsetse and cattle distributions.
The high absolute levels of losses in some areas reflect the fact that trypanosomosis often increases the burden on cattle populations already struggling with other constraints, such as overstocking, poor nutrition and other livestock diseases (e.g. tick-borne diseases, notably ECF). In addition, there are locally high concentrations of work oxen and grade dairy cattle that are economically more productive than traditionally managed zebu cattle, and these areas suffer correspondingly high losses from the disease.
Once again, the sizeable differences in the losses per km2 due to bovine trypanosomosis, with substantial areas both under US$500 and over $12 500 per km2, highlight the necessity of evidence-based prioritization in developing strategies to deal with this disease. Relating the benefits to the costs, by mapping benefit-cost ratios, tends to reinforce these differences.
9.2.3 How the possible interventions compare in economic terms Choice of techniqueComparing the different techniques from the economic viewpoint, the following considerations are relevant. Depending on circumstances, the absolute cost differences between the techniques can be fivefold or more (Tables 14 and 15). In an area with riverine tsetse flies and few cattle, the technique of choice might have to be targets, if the creation of a fly-free zone were the strategic objective. In most areas where there are fewer than 10 bovines per km2, the cheapest of the mapped options might be continuous use of chemoprophylaxis. The cost of a single technique may also vary according to fly species and livestock density: targets in areas with mixed riverine and savannah tsetse fly infestations cost about three times as much as where there are only riverine flies; using ITC where the cattle population density is 100 per km2 costs twice as much as the same method in areas where there are 10 to 50 bovines per km2.
As Figure 20(a) shows, disease control using trypanocide prophylaxis yields a modest but consistently positive return – and in areas of low cattle population density is often the only economically viable option. However, large-scale, long-term use runs the risk of developing drug resistance. Thus, a widespread current practice of livestock keepers – that of treating clinically sick high-value animals (cows and work oxen, as described in Shaw et al., 2014) and supplementing this with low-cost tsetse control options that can be managed by farmers – is possibly the most economical solution in these areas.
ITC is the one strategy that is necessarily and proportionally linked to the mapped benefit units, cattle. Those areas with low cattle densities that yield benefit-cost ratios < 1 for the other techniques are mostly the same as those shown as unsuitable for ITC because
83Conclusions
there are too few cattle for its effective application. Thus, the low return areas in the ITC maps in Figures 19(b) and 20(a) show up as unsuitable (coloured dark grey) rather than unprofitable (coloured pink), as for the other strategies. ITC also has spillover benefits on other livestock and human health problems. In certain areas, its use may reduce populations of Anopheles arabiensis mosquitoes and the incidence of malaria (Mahande et al., 2007). ITC reduces the tick burden on treated cattle and can combat tick-borne diseases such as ECF, a major cause of cattle mortality and economic loss, as well as other tick-borne diseases prevalent in the area, such as anaplasmosis, babesiosis and heartwater (Minjauw and McLeod, 2003) although this effect has been difficult to demonstrate and quantify (Muhanguzi et al., 2014b). Since ITC focuses on treating adult animals, and not all animals need to be treated, it can be used without undermining the endemic stability of tick-borne diseases present in the indigenous cattle population. ITC can also have an impact on nuisance flies and, conceivably, even on other related health problems, such as trachoma in humans and mastitis in cattle (personal communication, Sue Welburn, 2014). Thus the maps may underestimate ITC’s overall profitability, although it must be recalled that its effectiveness as an elimination strategy is as yet unproven in the field. Furthermore, the maps illustrate a situation where cattle are treated throughout a large area, with the clear objective of controlling tsetse. As noted in Section 8.5 above, when applied on a very small scale, it is likely that higher numbers of cattle will need to be treated to achieve effective control.
For fixed baits – targets or traps – effective deployment and servicing relies on good organization, manpower and logistical support. In some remote areas, this strategy may also require road building, adding considerably to costs, as would the presence of particularly dense vegetation. The ‘tiny targets’ without odours, which are effective where only riverine flies are present, yield high benefit-cost ratios, as do the standard size targets, deployed at 4 per km2 where only savannah flies are present. However, the presence of large areas of mixed infestation, which require standard size targets to be deployed at 10 per km2 at a relatively high cost, is mainly responsible for the low returns for control using targets shown in much of Figure 19(c). In many of these mixed infestation areas, riverine flies predominate, and it may be that effective control could be achieved using the cheaper, tiny targets.
SAT has the advantage of being undertaken over only a few months, and not having to rely on a large pool of organized manpower in the field. However, as Figure 19(d) shows, repeated applications of SAT, taken alone as a control strategy, do not offer high returns. On the other hand, in an elimination context, SAT performs very well.
Lastly, SIT is used in conjunction with other techniques and usually recommended where other approaches are not able to deal with tsetse effectively (Feldmann and Parker, 2010). The cost mapped here is based on interventions on a larger scale than has so far been attempted. Despite the fact that the mapped cost in Figure 20(d) was estimated to be less than half that of recently recorded small-scale interventions (Msangi et al., 2000; Bouyer et al., 2014), SIT is still significantly more costly than other approaches, and this is reflected in the benefit-cost ratios obtained and greatly reinforced if smaller-scale, and therefore higher cost operations are considered (see Table 18c).
Intervening against bovine trypanosomosis in eastern Africa: mapping the costs and benefits84
Choice of strategy While there are therefore key technical and economic variables to guide choice of technique, choice of strategy – elimination versus continuous control – is much more complex. Intuitively, getting rid of a problem once and for all has to be a more attractive option than spending money year in, year out, to control it. The issues regarding the feasibility and sustainability of elimination have been frequently debated (Hargrove, 2003), most recently in the context of costing interventions (Bouyer et al., 2013; Shaw et al., 2013b). The creation of fly-free zones is inherently a more risky strategy than control, as the many examples of reinvasion of cleared areas have demonstrated. There may be value in revisiting the objectives and outcomes of some of these past schemes (as discussed in the two latter references). The need for maintaining barriers, or for continuity in the programme where the gradual ‘rolling up’ by progressive extension of a tsetse free zone is being undertaken, involves important issues of sustainability of effort and funding. By discriminating against modelled events far ahead in an uncertain future, the discount rate to some extent mitigates this. However, as discussed in Section 8.5, the choice of a relatively high discount rate does slightly favour control over elimination in the mapped benefit-cost ratios.
The question of which techniques, or which combinations of techniques are effective, in which contexts and whether or not and on what scale sustained elimination can be achieved, are ultimately entomological ones, and beyond the scope of this paper. They are also dependent on the financial and other resources that can be deployed. This cannot be addressed by economic modelling, which can only point out that where the extra expenses associated with elimination are incurred and subsequently elimination fails or reinvasion occurs, the end result is usually less economically attractive than control would have been. In this analysis, quite generous assumptions have benefited elimination scenarios, as depicted in Figure 20. Techniques are assumed to be implemented in an ideal manner, to follow the predictions of available entomological models, and to be free from disruptions. Barriers are always costed, but in only 10 percent of the area and only for 5 years following elimination. For SIT, a low cost is used which would be applicable to very large-scale interventions. Table 18 shows how varying the assumptions has an impact on results. For the control strategies, conservative assumptions about impact (preventing 60 to 75 percent of disease losses) have been made.
Historically, interventions against tsetse and trypanosomosis mostly aimed from the outset either at control (often intermittent rather than continuous), or at elimination. The economic analyses conducted in this study seem to indicate that a more pragmatic approach might be to start out with a comprehensive control programme, deploying the technique(s) best suited to the specific disease problem, tsetse species combination, livestock production system and human and other resources available. Such control could, for example, rely on current low-cost options that can be applied by livestock keepers and/or appropriate local government departments, ideally reinforcing each other. In areas considered to be possible candidates for the creation of tsetse free zones, such deployment could subsequently be more intensive, rather than being limited by the objective of merely suppressing fly populations. Then, if tsetse fly populations

85Conclusions
were demonstrated to be sufficiently reduced and not recovering or reinvading, it would be appropriate to consider whether the area could be isolated, naturally or with barriers which people will really maintain. At this point, it should be possible to judge whether a longer-term or more permanent initiative (e.g. elimination) would be desirable and feasible.
Focusing on specific intervention areasLastly, it should be emphasized that the geographic scale of any such analyses needs to match the level of spatial detail used in them: selectively choosing small high return areas from a regional-scale study could be greatly misleading. Before making final decisions for a particular area, a conventional benefit-cost analysis is required. Verification of key variables – numbers of bovines, use of draught power and the extent to which trypanosomosis impacts on productivity – would need to be done at this stage. Tsetse distribution and species would have to be surveyed. Such a benefit-cost analysis would then examine the costs and likely efficacy of the feasible tsetse and trypanosomosis control strategies and compare them with the widest possible range of potential benefits that can be quantified. As a result, the timing of costs and benefits could be projected more exactly, and sensitivity analyses on key variables performed. Mapping of key variables, both monetary and non-monetary, can also support decision-making on such a smaller, project specific level.
ConclusionThe results of the study clearly illustrate the diversity of the areas affected by tsetse and animal trypanosomosis in eastern Africa. The benefit-cost ratios vary greatly between regions, with no single technique or strategy emerging as universally the most profitable. Thus there is no one-size-fits-all solution. However, a few areas consistently emerge as important. These are the mixed farming, high oxen use areas of Ethiopia, the highly productive crescent on the northern shores of Lake Victoria in Kenya and Uganda, the dairy production areas of west and central Kenya, parts of Uganda’s cattle corridor and the coastal areas of Kenya and Somalia, as well as some smaller areas of western South Sudan and southwestern Sudan. In these zones, all interventions against tsetse achieve high returns, with benefit-cost ratios of more than 10 in the core areas. Here, the high losses due to trypanosomosis undermine the livelihoods of cattle keepers, and it would appear that some form of intervention is essential. This should be factored into any rural development programmes implemented in such areas.
9.3 LOOKING TO THE FUTURE
9.3.1 Filling knowledge gapsDuring the course of this study, a number of gaps in the knowledge needed for understanding and estimating the potential benefits of dealing with AAT have become apparent.
The population of work oxen is only really known in one country: Ethiopia. Given the importance of work oxen to the rural economy, it is recommended that livestock

Intervening against bovine trypanosomosis in eastern Africa: mapping the costs and benefits86
censuses and surveys elsewhere also include a separate category for work oxen. The importance of bovine traction both to the economics of trypanosomosis and to cattle keeping in certain production systems was also highlighted in Shaw et al., 2006. Thus there is an urgent need for better information about the real value of their input. Work has been done in Zimbabwe (Shumba, 1984a; 1984b) on the value of oxen and the costs of delays to ploughing; Swallow (2000) introduced some estimates based on the potential increase in acreage if oxen availability is raised and Behnke and Metaferia (2011) estimated that work oxen’s contribution to increased crop production accounts for 31 percent of livestock output. There remains, however, a real need for fieldwork on the value of oxen to rural communities. The focus on commercial dairying and on commodities, which sees cattle as producing meat or milk, has meant that there has been little attempt to value ox power – which is so crucial to Africa’s rural economy. A recent study in Uganda (Okello et al., 2015) has provided compelling evidence of the importance of work oxen in the rural economy in Uganda’s Tororo district, a HAT and AAT endemic area in the southeast of the country.
There have been few recent investigations into the productivity of livestock in different production systems, such as those identified in this study. Here, censuses and surveys can have an important role to play, and need to be encouraged in their own right, so as to record the effects of varying rainfall, migration, political upheavals and other factors on the populations of all livestock. The value of livestock population data would be greatly enhanced if they included herd compositions – with some differentiation by age and sex (as was done in Uganda’s latest livestock census, MAAIF and UBOS, 2010), and more still if they were to include information on the nature of herd entries (births and purchase) and exits (deaths, sales and slaughter), as is periodically done by the Ethiopia Central Statistical Agency (e.g. ECSA, 2007).
Smaller-scale, in-depth studies of livestock production systems, and the factors constraining livestock development within them, should also be encouraged. In particular, herd compositions and recent entries and exits to and from herds should be incorporated into the recording of animal trypanosomosis surveys as a matter of course, perhaps using retrospective questionnaires (Doran, 2000, van den Bossche, 2001), as disease incidence alone may not be a good indicator of impact.
There are still very few field-based studies of the impact of trypanosomosis on animal productivity.
Turning to the costs side of the information, there are two broad categories of unknowns. First, despite the recently published studies (Adam et al., 2013; Bouyer et al., 2014; Muhanguzi et al., 2015 and Shaw et al., 2015a), evidence-based published calculations of the full costs of real field operations are still relatively sparse. It should be emphasized that in order to support planning in this field, such calculations need to go well beyond simply citing core costs such as targets/traps, insecticide flying costs, or even quantifying the extra costs incurred in the field. Full costing of all resources used by an intervention are required. Such full costs need to include overheads (administration and organizational costs incurred in-country and overseas; the costs of preliminary surveys and ongoing monitoring and the costs of supporting studies), and the full cost of field

87Conclusions
operations (shares of salaries, depreciation of vehicles, for example), as well as the cost of core items (insecticide, traps, targets, flying hours, sterile male tsetse flies). These cost categories vary from operation to operation, and according to the technique used, scale, timing and strategic objective may also be different, so it cannot simply be assumed that these will be the same for each approach. They need to be estimated explicitly. The cost estimates used in Chapter 7 (based on Shaw et al., 2007 and 2013a) are full costs and it is crucial that studies of the costs of intervening against tsetse and trypanosomosis follow this type of approach, and quantify both field costs and overheads, as has been done in recent papers (Bouyer et al., 2014; McCord et al., 2012, Muhanguzi et al., 2015; Shaw et al., 2015a). It is recommended that those involved in such interventions add the collection of cost data to their other monitoring activities. This financial data gathering involves relatively little additional effort when undertaken alongside the routine scientific monitoring work that tsetse control operations already require.
Second, despite all the research and all the projects that have taken place, there is still a great deal that is not known about the effectiveness and limitations of the different tsetse and trypanosomosis control techniques in different contexts. For measures against the vector, more evidence is needed about how each type of intervention performs under different climatic and (agro) ecological conditions, with associated vegetation characteristics, host availability and with different species and subspecies of flies. This has important implications for how long, over how large an area and how intensively each technique needs to be deployed to achieve its goal. For all techniques, there are important unknowns about scale effects, and even about optimal densities for targets or ITC. Arguments about intensity of deployment are often related to differences in the way in which the area treated is measured – whether this is a narrow measure of the area where deployment takes place or a broader measure of the whole area affected by the intervention (sometimes referred to in the literature as ‘area treated’ and ‘area protected’). Linked to this is uncertainty about reinvasion risks and the requirements for barriers to protect fly-free zones and their efficacy. While models help to understand what is needed (Hargrove, 2000; Hargrove et al., 2012; Kajunguri et al., 2014) these need to be backed up by empirical evidence, systematically gathered as projects are implemented.
9.3.2 Extending the approach This study, set alongside the West African study, shows that the ‘mapping the benefits’ approach is viable and can be used in different settings. The method has now been tested in widely differing locations and has yielded results whose information extends well beyond that offered by individually mapped variables. Due to similar price levels, the maps shown here can be viewed alongside those produced for West Africa (Shaw et al., 2006). The benefit-cost ratio maps have been effective in extending the approach to highlight which techniques offer the best economic returns in which areas. Within the field of tsetse and trypanosomosis, the monetary mapping approach could be extended geographically, to encompass other tsetse-infested regions of Africa. It could also be applied on a smaller scale, to look more precisely at the benefits and costs within more

Intervening against bovine trypanosomosis in eastern Africa: mapping the costs and benefits88
clearly defined production systems, and for specific measures being considered in potential intervention areas.
Although the maps illustrate the likely distribution of the potential benefits to livestock of controlling AAT, using cattle as a proxy, they do not cover the impact of trypanosomosis in humans. The presence of HAT means that some areas may in fact be very high priority locations for intervention, despite the bovine benefit maps showing relatively low levels of potential benefits. Finding a way to incorporate a relative weighting for the presence of HAT would be extremely useful. Estimates of its burden have been made (Fèvre et al., 2008) and information about the costs of screening and treating human populations for HAT exists (WHO, 1998 and Lutumba et al., 2007). The geographical distribution and risk of HAT are being mapped regularly (Cecchi et al., 2009b, Simarro et al., 2010, 2011, 2012b, 2015 and Lumbala et al., 2015), including the geographical distribution and coverage of diagnostic and treatment facilities (Simarro et al., 2014). In this study, while some of the key HAT areas – such as the T. b. rhodesiense focus in southeastern Uganda – do emerge as priority areas from the benefit and the benefit-cost maps, others, such as the T. b. gambiense foci of South Sudan and northwestern Uganda, are not so evident.
The concept of economic maps, and their potential application in a wide range of contexts, makes them a planning tool of great relevance. They can be used to explore the impact of diseases and other production constraints to overall assessments of the relative contributions made by different livestock species or even crops. Adding the costs of intervening to the maps, and thus providing a mapped indicator of the relative returns to be expected from different interventions, completes the economic information needed to underpin macro-level decision-making. It helps to inform the choices of both where to intervene, and how. While maps have been extensively used in epidemiology, and for some monetary human health indicators, only the fields of transport economics and environment seem to have adopted monetary maps (e.g. Naidoo and Rickets, 2006, Troy and Wilson, 2006). The approach developed here to map the benefit-cost ratios of interventions against bovine trypanosomosis could be applied far beyond vector-borne livestock diseases to include other types of livestock disease, other interventions to improve livestock productivity, and indeed other agricultural contexts, such as crop pests.

89References
References
Adam, Y., Cecchi, G., Kgori, P.M., Marcotty, T., Mahama, C.I., Abavana, M., Anderson, B., Paone, M., Mattioli, R. & Bouyer, J. 2013. The sequential aerosol technique: a major component in an integrated strategy of intervention against riverine tsetse in Ghana. PLoS. Neglected Tropical Diseases 7: e2135.
ADB, IAEA & PATTEC. 2004. Integrated area-wide programme for trypanosomiasis-free zones in Uganda. Uganda, ADB, IAEA & PATTEC.
ADF. 2004. Multinational project: creation of sustainable tsetse and trypanosomiasis free areas in East and West Africa. Appraisal Report. ADB Agriculture and Rural Development departments: Operations Central and West (OCAR) and Operations North East and South (ONAR).
Agyemang, K. 2005. Trypanotolerant livestock in the context of trypanosomiasis intervention strategies. PAAT Technical and Scientific Series No. 7. Rome, Italy, FAO (available at http://www.fao.org/docrep/007/y5832e/y5832e00.htm).
Alemu, G., Alemu Tadesse, W. & Dibabe, A. 1998. Research and development experiences of the Institute of Agricultural Research in natural resources management and crop livestock interactions in the highlands of Ethiopia. In M.A. Jabbar, D.G. Peden, M.A. Mohamed Saleem, and H. Li Pun, eds. Agro-ecosystems, natural resources management and human health related research in East Africa. Proceedings of an International Development Research Centre and ILRI international workshop held at ILRI, Addis Ababa, 11–15 May, 1998.
Allsopp, R. & Hursey, B. 2004. Insecticidal control of tsetse. In I. Maudlin, P.H. Holmes & M.A. Miles, eds. The trypanosomiases, pp. 491–507. Wallingford, UK, CABI Publishing.
Barrett, J. 1997. Economic issues in trypanosomiasis control. Chatham, UK, Natural Resources Institute.
Bauer, B., Gitau, D., Oloo, F.P. & Karanja, S.M. 2006. Evaluation of a preliminary trial to protect zero-grazed dairy cattle with insecticide treated mosquito netting in Western Kenya. Tropical Animal Health and Production, 38: 29–34.
Bauer, B., Holzgrefe, B., Mahama, C.I., Baumann, M.P.O., Mehlitz, D. & Clausen, P.H. 2011. Managing tsetse transmitted trypanosomosis by insecticide treated nets – an affordable and sustainable method for resource poor pig farmers in Ghana. PLoS. Neglected Tropical Diseases, 5: e1343.
Bebe, B.O., Udo, H.M.J. & Thorpe, W. 2000. Disposal and replacement practices in Kenya’s smallholder dairy herds. Paper presented at the 3rd All Africa Conference on Animal Agriculture and 11th Conference of the Egyptian Society of Animal Production, 6–9 November, 2000, Alexandria, Egypt (available at https://cgspace.cgiar.org/handle/10568/1589).
Behnke, R. & Metaferia, F. 2011. The contribution of livestock to the Ethiopian economy – Part II. IGAD LPI working paper no.2-11 (available at https://cgspace.cgiar.org/bitstream/handle/10568/24969/IGAD_LPI_WP_02-11.pdf).

Intervening against bovine trypanosomosis in eastern Africa: mapping the costs and benefits90
Bourn, D., Grant, I., Shaw, A. & Torr, S. 2005. Cheap and safe tsetse control for livestock production and mixed farming in Africa. Aspects of Applied Biology, 75: 81–92.
Bouyer, J., Guerrini, L., Desquesnes, M., de La Rocque, S. & Cuisance, D. 2006. Mapping African animal trypanosomosis risk from the sky. Veterinary Research, 37: 633–645
Bouyer, J., Seck, M.T. & Sall, B. 2013. Misleading guidance for decision making on tsetse eradication: Response to Shaw et al., 2013. Preventive Veterinary Medicine 112: 443–446.
Bouyer, F., Seck, M.T., Dicko, A.H., Sall, B., Lo, M., Vreysen, M.J.B., Chia, E., Bouyer, J. & Wane, A. 2014. Ex-ante benefit-cost analysis of the elimination of a Glossina palpalis gambiensis population in the Niayes of Senegal. PLoS. Neglected Tropical Diseases 5: e3112.
Brandl, F.E. 1985. The use of a herd simulation model for the estimation of direct economic benefits of tsetse control. Application to the pastoral zone of Sidéradougou, Burkina Faso. Revue d’Elevage et de Médecine vétérinaire des Pays tropicaux, 38: 364–370.
Camus, E. 1981. Evaluation economique des pertes provoquées par la trypanosomose sur quatre types génétiques bovins dans le nord de la Côte d’Ivoire. Revue d’Elevage et de Médecine vétérinaire des Pays tropicaux, 34: 297-300.
Carney, D. 2003. Sustainable livelihoods approaches: progress and possibilities for change. DFID, London, UK (available at http://www.eldis.org/vfile/upload/1/document/0812/SLA_Progress.pdf).
Cecchi, G. & Mattioli, R. eds. 2009. Geospatial datasets and analyses for an environmental approach to African trypanosomiasis. PAAT Technical and Scientific Series, No. 9, Rome, Italy. FAO (available at http://www.fao.org/docrep/012/i0809e/i0809e00.htm).
Cecchi, G., Mattioli, R.C., Slingenbergh, J., de la Rocque, S. & Feldmann, U. 2008. Standardizing land cover mapping for tsetse and trypanosomiasis decision making. PAAT Technical and Scientific Series No. 8. Rome, Italy, FAO (available at http://www.fao.org/docrep/010/i0215e/i0215e00.htm).
Cecchi, G., Paone, M., Franco, J.R., Fèvre, E.M., Diarra, A., Ruiz, J.A., Mattioli, R.C. & Simarro, P. P. 2009a. Towards the atlas of human African trypanosomiasis. International Journal of Health Geographics, 8: e15.
Cecchi, G., Courtin, F., Paone, M., Diarra, A., Franco, J.R., Mattioli, R.C. & Simarro, P.P. 2009b. Mapping sleeping sickness in Western Africa in a context of demographic transition and climate change, Parasite, 16: 99–106.
Cecchi, G., Wint, W., Shaw, A., Marletta, A., Mattioli, R.C. &Robinson, T. 2010.Geographic distribution and environmental characterization of livestock production systems in Eastern Africa. Agriculture, Ecosystems and Environment, 135: 98–110 (available at ftp://ftp.fao.org/docrep/fao/article/ak791e.pdf).
Cecchi, G., Paone, M., Feldmann, U., Vreysen, M.J., Diall, O. & Mattioli, R.C. 2014. Assembling a geospatial database of tsetse-transmitted animal trypanosomosis for Africa. Parasites & Vectors, 7: e39.
Cecchi, G., Paone, M., Argilés Herrero, R., Vreysen, M.J.B & Mattioli, R.C. 2015. Developing a continental atlas of the distribution and trypanosomal infection of tsetse flies (Glossina species). Parasites & Vectors, 8: e284.
Coppock, D.L. 1994. The Borana Plateau of Southern Ethiopia: Synthesis of pastoral research, development and change, 1980–91. Addis Ababa, Ethiopia, International Livestock Centre for Africa.

91References
Dahl, G. & Hjort, A. 1976. Having herds – pastoral herd growth and household economy. Stockholm, Sweden. Stockholm studies in social anthropology.
de La Rocque, S., Michel, M.F., Bouyer, J., De Wispelaere, G. & Cuisance, D. 2005. Geographical information systems in parasitology: a review of potential applications using the example of animal trypanosomosis in West Africa. Parassitologia, 47: 97–104.
Doran, M. 2000. Socio-economics of trypanosomosis. Implications for control strategies within the Common Fly-Belt of Malawi, Mozambique, Zambia and Zimbabwe. Bovine trypanosomosis in southern Africa, Vol. 3. Harare, Zimbabwe, Regional Tsetse and Trypanosomosis Control Programme for Southern Africa.
Dransfield, R.D., Brightwell, R., Kyorku, C. & Williams, B. 1990. Control of tsetse fly (Diptera: Glossinidae) populations using traps at Nguruman, south-west Kenya. Bulletin of Entomological Research, 80: 265–276.
ECSA. 2007. Agricultural sample survey 2006/7. Statistical Bulletin no. 388. Addis Ababa, Ethiopia, ECSA.
Esterhuizen, J., Rayaisse, J.B., Tirados, I., Mpiana, S., Solano, P., Vale, G.A., Lehane, M.J. & Torr, S.J. 2011. Improving the cost-effectiveness of visual devices for the control of riverine tsetse flies, the major vectors of human African trypanosomiasis. PLoS. Neglected Tropical Diseases, 5: e1257.
Feldmann, U. 2004. The sterile insect technique a component of area-wide integrated pest management of tsetse. In I. Maudlin, P.H. Holmes & M.A. Miles, eds. The trypanosomiases, pp.565–582. Wallingford, UK, CABI Publishing.
Feldmann, U. & Parker, A. 2010. Using a pest to attack itself – the role of the sterile insect technique (SIT) in tsetse control. Public Health Journal, 21: 38–42.
Fèvre, E.M., Coleman, P.G., Odiit, M., Magona, J.W., Welburn, S.C. & Woolhouse, M.E. 2001. The origins of a new Trypanosoma brucei rhodesiense sleeping sickness outbreak in eastern Uganda. Lancet, 358: 625–628.
Fèvre, E.M., Wissmann, B.V., Welburn, S.C. & Lutumba, P. 2008. The burden of human African trypanosomiasis. PLoS Neglected Tropical Diseases, 2: e333.
FEWS-NET. 2004. Djibouti Livelihood Profiles. FEWS-NET (available at http://pdf.usaid.gov/pdf_docs/Pnadc449.pdf).
FEWS-NET. 2006–2007. Tigray Region, Ethiopia: livelihood profiles. Disaster Prevention and Preparedness Agency Ethiopia (DPPA) (available at http://www.dppc.gov.et/Livelihoods/livelihoodhome.htm).
FEWS-NET. 2006a. Afar Region, Ethiopia: livelihood profiles. FEWS-NET. FEWS-NET. 2006b. Southern Nation, Nationalities and People’s Region, Ethiopia: livelihood
profiles. FEWS-NET (available at http://pdf.usaid.gov/pdf_docs/Pnadk512.pdf). FITCA Kenya Project. 2005. Farming in tsetse controlled areas – Kenya Project 1999–2004:
lessons learned. Nairobi, Kenya, FITCA. Fonteh, F.A., Mubiru, S., Tibayungwa, F. & Lammers, W. 2005. System analysis of peri-urban
smallholder dairy farming in the Lake Crescent Region of Uganda. Livestock Research for Rural Development, 17: e79 (available at http://www.lrrd.org/lrrd17/7/font17079.htm).
Fox, R.G.R., Mmbando, S.O., Fox, M.S. & Wilson, A. 1993. Effect on herd health and productivity of controlling tsetse and trypanosomosis by applying deltamethrin to cattle. Tropical Animal Health and Production, 25: 203–214.

Intervening against bovine trypanosomosis in eastern Africa: mapping the costs and benefits92
FSAU & SC-UK. 2000-2001-2002. Livelihood Baselines for Somalia. FSAU, SC-UK for Somalia.Geerts, S., Holmes, P.H., Diall, O. & Eisler, M.C. 2001. African bovine trypanosomiasis: the
problem of drug resistance. Trends in Parasitology, 17: 25–28.Gerber, P., Carsjens, G.J., Pak-uthai, T. & Robinson, T.P. 2008. Decision support for spatially
targeted livestock policies: diverse examples from Uganda and Thailand. Agricultural Systems, 96: 37–51.
Gilbert, M. 2003. Environmental health management: training module on spatial epidemiology. Consultancy report prepared for the Animal Health Service, FAO. Rome, Italy, FAO.
Gilbert, M., Jenner, C., Pender, J., Rogers, D., Slingenbergh, J. & Wint, W. 2001. The Programme Against African Trypanosomiasis Information System (PAAT–IS). In S.N. Black & J.R. Seed, eds. World Class Parasites: Volume 1 – the African trypanosomes, pp.11–24. Dordrecht, The Netherlands, Kluwer Academic Publishers.
Gilbert, M., Grégoire, J.-C., Freise, J. & Heitland, W. 2004. Long-distance dispersal and human population density allow the prediction of invasive patterns in the horse-chestnut leafminer Cameraria ohridella. Journal of Animal Ecology, 73: 459–468.
Gilbert, M., Mitchell, A., Bourn, D., Mawdsley, J., Clifton-Hadley, R. & Wint, G.R.W. 2005. Cattle movements and bovine tuberculosis in Great Britain. Nature, 435: 491–496.
Goe, M. 1987. Animal traction on smallholder farms in the Ethiopian highlands. PhD Thesis, Cornell University, USA.
Green, C.H. 1994. Bait methods for tsetse fly control. Advances in parasitology, 34: 229–291.Grimaud, P., Mpairwe, D., Chalimbaud, J., Messad, S. & Faye, B. 2007. The place of Sanga
cattle in dairy production in Uganda. Tropical Animal Health and Production, 39: 217–227.GRM, 1994. Herd health and productivity monitoring study: final report of findings of three
years of observations. Brisbane, Australia, GRM International Pty Ltd. Gryssels, G. 1988. Role of livestock on mixed smallholder farms in the Ethiopian highlands:
a case study from the Baso and Worena Wereda near Debre Berhan. PhD Thesis, Agricultural University, Wageningen, The Netherlands.
Hanks, J. & Hogg, R. 1992. Impact of tsetse eradication: a synthesis of the findings from livestock production and the socio-economic monitoring in Somalia following the eradication of tsetse from the Middle Shabeelle Region. Reading, UK, PAN Livestock Services.
Hargrove, J.W. 2000. A theoretical study of the invasion of cleared areas by tsetse flies. Bulletin of Entomological Research, 90: 201–209.
Hargrove, J.W. 2003. Tsetse eradication: sufficiency, necessity and desirability. Edinburgh, UK, DFID Animal Health Programme (available at http://r4d.dfid.gov.uk/PDF/Outputs/RLAHtsetse_Erad.pdf).
Hargrove, J.W. & Packer, M.J. 1993. Nutritional states of male tsetse-flies (Glossina Spp) (Diptera, Glossinidae) caught in odour-baited traps and artificial refuges – models for feeding and digestion. Bulletin of Entomological Research, 83: 29–46.
Hargrove, J.W. & Williams, B.G. 1995.A cost-benefit analysis of feeding in female tsetse. Medical and Veterinary Entomology, 9: 109–119.
Hargrove, J.W., Ouifki, R., Kajunguri, D., Vale, G.A. & Torr, S.J. 2012. Modeling the control of trypanosomiasis using trypanocides or insecticide-treated livestock. PLoS. Neglected Tropical Diseases, 6: e1615.

93References
Hendrickx, G., Napala, A., Slingenbergh, J.H.W., De Deken, R., Vercruysse, J. & Rogers, D.J. 2000. The spatial pattern of trypanosomiasis prevalence predicted with the aid of satellite imagery. Parasitology, 120: 121–134.
Hendrickx, G., de La Rocque, S. & Mattioli, R. 2004. Long term tsetse and trypanosomiasis management options in West Africa. PAAT Technical and Scientific Series No. 6. Rome, Italy, FAO (available at ftp://ftp.fao.org/docrep/fao/007/y5342e/y5342e00.pdf).
Holmes, P.H., Eisler, M.C. & Geerts, S. 2004. Current chemotherapy of animal trypanosomiasis. In I. Maudlin, P.H. Holmes & M.A. Miles, eds. The trypanosomiases, pp. 431–444. Wallingford, UK, CABI Publishing.
IFAD. 2006. Country Programme in Somalia: Knowledge in Action 2005–06. IFAD Report (available at http://www.ifad.org/english/operations/pn/som/knowledge/index.htm).
Itty, P. 1992. Economics of village cattle production in tsetse affected areas of Africa. A study of trypanosomiasis control using trypanotolerant cattle and chemotherapy in Ethiopia, Kenya, Côte d’Ivoire, The Gambia, Zaire and Togo. Konstanz, Germany, Hartung-Gorre Verlag,
Itty, P., Swallow, B.M., Rowlands, G.J., Mulatu, W. & d’Ieteren G.D.M. 1995. The economics of village cattle production in a tsetse-infested area of southwest Ethiopia. Preventive Veterinary Medicine, 22: 183–196.
Jahnke, H. E. 1982. Livestock production systems and livestock development in tropical Africa. Kiel, Germany, Kieler Wissenschaftsverlag Vauk.
Jemal, A. & Hugh-Jones, M.E. 1995. Association of tsetse control with health and productivity of cattle in the Didessa Valley, western Ethiopia. Preventive Veterinary Medicine, 22: 29–40.
Kagbadouno, M.S., Camara, M., Bouyer, J., Courtin, F., Onikoyamou, M.F., Schofield, C.J. & Solano, P. 2011. Progress towards the eradication of tsetse from the Loos islands, Guinea. Parasites & Vectors, 4: e18.
Kajunguri, D., Hargrove J.W., Ouifki, R., Mugisha, J.Y., Coleman, P.G. & Welburn, S.C. 2014. Modelling the use of insecticide-treated cattle to control tsetse and Trypanosoma brucei rhodesiense in a multi-host population. Bulletin of Mathematical Biology, 76: 673–96.
KFSM. 2006. Livelihood zone data viewer (CD-ROM). KFSM, Nairobi, Kenya.Kgori, P.M., Modo, S. & Torr, S. 2006. The use of aerial spraying to eliminate tsetse from
the Okavango Delta of Botswana. Acta Tropica, 99: 184–199.Kovacic, V., Tirados, I., Esterhuizen, J., Mangwiro, C.T.N., Torr, S.J., Lehane, M.J. &
Smith, H. 2013. Community acceptance of tsetse control baits: a qualitative study in Arua District, North West Uganda. PLoS. Neglected Tropical Diseases, 7: e2579.
Kristjanson, P.M., Swallow, B.M., Rowlands, G.J., Kruska, R.L. & De Leeuw, P.N. 1999. Measuring the costs of African animal trypanosomosis, the potential benefits of control and returns to research. Agricultural Systems, 59: 79–98.
Kruska, R.L., Reid, R.S., Thornton, P.K., Henninger, N. & Kristjanson, P.M. 2003. Mapping livestock-oriented agricultural production systems for the developing world. Agricultural Systems, 77: 39–63.
Intervening against bovine trypanosomosis in eastern Africa: mapping the costs and benefits94
Laker, C.D. 1998. Assessment of the economic impact of bovine trypanosomosis and its control in dairy cattle in Mukono County, Uganda. Ph.D Thesis, Makerere University, Uganda.
Lalonde, L.G. & Sukigara, T., 1997. Livestock Development Planning System Version 2 User’s Guide. Rome, Italy, FAO (available at http://www.fao.org/fileadmin/templates/lead/pdf/user97.pdf).
Lancien, J. & Obayi, H. 1993. La lutte contre les vecteurs de la Maladie du Sommeil. Bulletin de la Société française de Parasitologie, 11:107–117.
Lumbala, C., Simarro, P.P., Cecchi, G., Paone, M., Franco, J.R., Kande Betu Ku Mesu, V., Makabuza, J., Diarra, A., Chansy, S., Mattioli, R.C. & Jannin, J.G. 2015. Human African trypanosomiasis in the Democratic Republic of the Congo: disease distribution and risk. International Journal of Health Geographics, 14(1): 20.
Lutumba, P., Meheus, F., Robays, J., Miaka, C., Kande, V., Büscher, P., Dujardin B. & Boelaert, M. 2007. Cost-effectiveness of algorithms for confirmation test of human African trypanosomiasis. Emerging Infectious Diseases, 10: 1484–1490.
MAAIF & UBOS. 2010. The national Livestock Census Report 2008. MAAIF, Entebbe and UBOS Kampala, Uganda.
MAAIF, UBOS, FAO, ILRI & WRI. 2010. Mapping a better future: spatial analysis and pro-poor livestock strategies in Uganda. MAAIF (Ministry of Agriculture, Animal Industry and Fisheries, Uganda); UBOS (Uganda Bureau of Statistics); FAO (Food and Agriculture Organization of the United Nations); ILRI (International Livestock Research Institute); WRI (World Resources Institute) Washington D.C. and Kampala.
Machila, N. 2005 Improved targeting and appropriate use of trypanocidal drugs for the control of African bovine trypanosomiasis in tsetse endemic areas of western and coastal Kenya within the context of primary veterinary care. PhD Thesis, University of Edinburgh, UK.
Maia, M., Clausen, P.H., Mehlitz, D., Garms, R. & Bauer, B. 2010. Protection of confined cattle against biting and nuisance flies (Muscidae: Diptera) with insecticide-treated nets in the Ghanaian forest zone at Kumasi. Parasitology Research 106:1307–13.
Maichomo, M.W., Ndung’u, J.M., Ngare, P.M. & Ole-Mapenay, I.M. 2005. The performance of Orma Boran and Maasai Zebu crossbreeds in a trypanosomosis endemic area of Nguruman, south western Kenya. Onderstepoort Journal of Veterinary Research, 72: 87–93.
Mahande, A.M., Mosha, F.W., Mahande, J.M. & Kweka, E.J. 2007. Role of cattle treated with deltamethrine in areas with a high population of Anopheles arabiensis in Moshi, Northern Tanzania. Malaria Journal, 6: e109.
Maudlin, I., Holmes, P.H. & Miles, M.A., eds. 2004. The trypanosomiases. Wallingford, UK, CABI Publishing.
Mburu, L.M., Gitu, K.W. & Wakhungu, J.W. 2007a. A cost-benefit analysis of smallholder dairy cattle enterprises in different agro-ecological zones in Kenya highlands. Livestock Research for Rural Development, 19: e95 (available at http://www.lrrd.org/lrrd19/7/mbur19095.htm).
Mburu, L.M., Wakhungu, J.W. & Kang’ethe, W.G. 2007b. Characterization of smallholder dairy production systems for livestock improvement in Kenya highlands. Livestock Research for Rural Development, 19: e110 (available at http://www.lrrd.org/lrrd19/8/mbur19110.htm).
95References
McCord, P.F., Messina, J.P., Campbell, D.J. & Grady, S.C. 2012. Tsetse fly control in Kenya’s spatially and temporally dynamic control reservoirs: a cost analysis. Applied Geography, 34: 189–204.
Minjauw, B. & McLeod, A. 2003. Tick-borne diseases and poverty. Edinburgh, UK, DFID Animal Health Programme, (available at http://r4d.dfid.gov.uk/PDF/Outputs/RLAHTickBorn_Book.pdf).
Morton, J. 2001. Livestock management and socio-economic factors affecting the feasibility of trypanosomiasis and malaria control in Konso special woreda, Ethiopia: report of a preliminary survey. Chatham, UK, DFID and Natural Resources Institute.
Msangi, A.R. Saleh, K.M., Kiwia, N., Malele, I.I., Mussa, W.A., Mramba, F., Juma, K.G., Dyck, V.A., Vreysen, M.J.B., Parker, A.G., Feldmann, U., Zhu, Z.R. & Pan, H. 2000. Success in Zanzibar: eradication of tsetse. In T. Keng-Hong, ed. Area-wide control of fruit flies and other insect pests, pp. 57–66. Penang, Malaysia, Penerbit Universiti Sains.
Mudavadi, P.O., Otieno, K.J., Wanambacha, W., Odenya, J.O., Odendo, M. & Njaro, O.K. 2001. Smallholder dairy production and marketing in western Kenya: a review of literature. Ministry of Agriculture and Rural Development (MOARD)/Kenya Agricultural Research Institute (KARI) /ILRI Smallholder Dairy (Research & Development) Project, Nairobi, Kenya.
Mugunieri, G.L. & Matete, G.O. 2005. Association of trypanosomosis risk with dairy cattle production in western Kenya. Onderstepoort Journal of Veterinary Research, 72: 279–284.
Muhanguzi, D., Picozzi, K., Hattendorf, J., Thrusfield, M., Welburn, S.C., Kabasa, J.D. & Waiswa, C. 2014a. Improvements on restricted insecticide applicaton protocol for control of human and animal African trypanosomiasis in Eastern Uganda. PLoS. Neglected Tropical Diseases, 8: e3284.
Muhanguzi, D., Picozzi, K., Hattendorf, J., Thrusfield, M., Welburn, S.C., Kabasa, J.D., & Waiswa, C. 2014b. Collateral benefits of restricted insecticide application for control of African trypanosomiasis on Theileria parva in cattle: a randomized controlled trial. Parasites & Vectors, 7: e432.
Muhanguzi, D., Okello, W.O., Kabasa, J.D., Waiswa, C., Welburn, S.C. & Shaw, A.P.M. 2015. Cost analysis of options for management of African animal trypanosomiasis using interventions targeted at cattle in Tororo District; south-eastern Uganda. Parasites & Vectors, 8: e387.
Mulatu, W., Swallow, B., Rowlands, G.J., Leak, S.G.A., d’Ieteren, G.D.M. & Nagda, S.M. 1999. Economic benefits to farmers of six years of application of an insecticidal ‘pour-on’ to control tsetse in Ghibe, Southwest Ethiopia. Proceedings of the 24th Meeting, of the ISCTRC, Maputo, Mozambique, 1997, OAU/STRC, Publication no. 119, pp. 578–586.
Muraguri, G. R. 2000. Epidemiological and financial impact of vector-borne diseases on productivity of smallholder cattle in the coastal lowlands of Kenya. PhD Thesis, University of Reading, UK.
Muraguri, G, R., McLeod, A. & Taylor, N. 2004. Estimation of milk production from smallholder dairy cattle in the coastal lowlands of Kenya. Tropical Animal Health and Production, 36: 673–684.
Muraguri, G, R., McLeod, A., McDermott, J.J. & Taylor, N. 2005. The incidence of calf morbidity and mortality due to vector-borne infections in smallholder dairy farms in Kwale District, Kenya. Veterinary Parasitology, 130: 305–315.

Intervening against bovine trypanosomosis in eastern Africa: mapping the costs and benefits96
Murray, M., D’Ieteren, G.D.M. & Teale A.J. 2004. Trypanotolerance. In I. Maudlin, P.H. Holmes & M.A. Miles, eds. The trypanosomiases, pp. 461–477. Wallingford, UK, CABI Publishing.
Musa, L.M.-A., Peters, K.J. & Ahmed, M.-K.A. 2006. On farm characterization of Butana and Kenana cattle breed production systems in Sudan. Livestock Research for Rural Development, 18: e12 (available at http://www.lrrd.org/lrrd18/12/musa18177.htm).
Naidoo, R. & Rickets, T.H., 2006. Mapping the economic costs and benefits of conservation. PLoS Biology, 4: e360.
Nakiganda, A., McLeod, A., Bua, A., Phipps, R., Upton, M. & Taylor, N. 2006. Farmers’ constraints, objectives and achievements in smallholder dairy systems in Uganda. Livestock Research for Rural Development, 18: e69 (available at http://www.lrrd.org/lrrd18/5/naki18069.htm).
NFIS. 2006. Livelihood Systems Baseline Studies: Eritrea. Asmara, Eritrea, NFIS. Njogu A.R., Dolan, R.B., Wilson, A.J. & Sayers, P.D. 1985. Trypanotolerance in East
African Orma Boran cattle. Veterinary Record, 117: 632–6.Ocaido, M., Otim, C.P., Okuna, N.M., Erume, J., Ssekitto, C., Wafula, R.Z.O., Kakaire,
D., Walubengo, J. & Monrad, J. 2005. Socio-economic and livestock disease survey of agropastoral communities in Serere County, Soroti District, Uganda. Livestock Research for Rural Development, 17: e8 (available at http://www.lrrd.org/lrrd17/8/ocai17093.htm).
Ojowi, M.O., Ogidi, R.O., Obanyi, J.N., Owango, M.O. & Nyamira, Kisii Central and Rachuonyo District Livestock Production Officers. 2001. Smallholder dairy production and Marketing in Kisii, Nyamira and Rachuonyo Districts: a review of literature. Nairobi, Kenya, MOARD /KARI/ILRI Smallholder Dairy (Research and Development Project).
Okello, W.O., Muhanguzi, D., MacLeod, E.T., Welburn, S.C., Waiswa, C. & Shaw, A.P. 2015. Contribution of draft cattle to rural livelihoods in a district of southeastern Uganda endemic for bovine parasitic diseases: an economic evaluation. Parasites & Vectors. 8: e571.
Omore, A., Muriuki, H., Kenyanjui, M., Owango, M. & Staal, S. 1999. The Kenyan dairy sub-sector: a rapid appraisal. Nairobi, Kenya, MOARD/KARI/ILRI Smallholder Dairy Research and Development) Project.
Ongadi, P.M., Wahome, R.G., Wakhungu, J.W., Okitoi, L.O. & Otieno, K. 2006. Bio-economic analysis of expenditure on inputs and output value from crops and grade dairy cattle sub systems in Vihiga, Kenya. Livestock Research for Rural Development, 18: e172 (available at http://www.lrrd.org/lrrd18/12/onga18172.htm).
Ongadi, P.M., Wakhungu, J.W., Wahome, R.G. & Okitoi, L.O. 2007. Characterization of grade dairy cattle owning households in mixed small scale farming systems of Vihiga, Kenya. Livestock Research for Rural Development 19: e43 (available at http://www.lrrd.org/lrrd19/3/onga19043.htm).
Ormerod, W.E. 1976. Ecological effects of control of African trypanosomiasis. Science 191, 815-821.
Otte, J. & Chilonda, P. 2002. Cattle and small ruminant production systems in sub-Saharan Africa. A systematic review. Rome, Italy, FAO (available at http://www.fao.org/docrep/005/y4176e/y4176e00.htm.
Peeler E. & Omore, A. 1997. Manual of livestock production Systems in Kenya, 2nd Edition. KARI, Nairobi. Kenya.

97References
Pender, J., Jenner, C., Wint, W. & Gilbert, M. 2001. Programme Against Animal Trypanosomiasis Information System (PAAT–IS). Software, website and data CD produced by Environmental Research Group Oxford Ltd (ERGO) on behalf of the Natural Resources Institute, Chatham, for FAO and DFID. Oxford, UK, ERGO (available at http://www.fao.org/paat/html/home.htm).
Perry, B. D. & Randolph T. F. 1999. Improving the assessment of the economic impact of parasitic diseases and of their control in production animals. Veterinary Parasitology, 84: 145–168.
Pokou, K., Swallow, B.M. & Kamuanga, M. 1998.Impacts of tsetse and trypanosomosis on livestock production and crop cultivation in northern Côte d’Ivoire. Chapter 5.7 in R. Reid & B. Swallow, eds. An integrated approach to the assessment of trypanosomiasis control technologies and their impacts on agricultural production, human welfare and natural resources in tsetse affected areas of Africa. Phase I. pp. 269–274. Final Technical Report of IFAD Grant TAG No 284. Nairobi, Kenya, ILRI.
Politzar, H. & Cuisance, D. 1983. A trap-barrier to block re-invasion of a river system by riverine tsetse species. Revue d’Elevage et de Médecine vétérinaire des Pays tropicaux, 36: 364–370.
Pozzi, F. & Robinson, T. 2008. Accessibility Mapping in the Horn of Africa: applications for livestock policy. IGAD LPI Working Paper No. 11. Addis Ababa, Ethiopia, IGAD (available at http://www.igad-lpi.org/publication/docs/IGADLPI_WP11_08.pdf).
Pozzi, F., Robinson, T. & Nelson, A. 2010. Accessibility mapping and rural poverty in the Horn of Africa. Rome and Addis Ababa: PPLPI Working Paper No. 47 and IGAD LPI Working Paper No. 02–10. Rome, Italy, FAO and Addis Ababa, Ethiopia IGAD (available at http://www.fao.org/ag/againfo/programmes/en/pplpi/docarc/wp47.pdf).
Putt, S.N.H., Shaw, A.P.M., Matthewman, R.W., Bourn, D.M., Underwood, M., James, A.D., Hallam, M.J. & Ellis, P.R. 1980. The social and economic implications of trypanosomiasis control - a study of its impact on livestock production and rural development in northern Nigeria. Study no. 25, Veterinary Epidemiology and Economics Research Unit (VEERU). Reading, UK, Reading University.
Rege, J.E.O., Kahi, A., Okomo-Adhiamho, M., Mwacharo, J. & Hanotte, O. 2001. Zebu cattle of Kenya: uses, performance, farmer preferences, measures of genetic diversity. Nairobi, Kenya, ILRI/KARI (available at http://agtr.ilri.cgiar.org/documents/Library/docs/zebucattle/Toc.html).
Robinson, T.P. 1998. Geographic information systems and the selection of priority areas for control of tsetse-transmitted trypanosomiasis in Africa. Parasitology Today, 14: 457–461.
Robinson, T.P., Rogers, D.J. & Williams, B. 1997. Mapping tsetse habitat suitability in the common fly belt of Southern Africa using multivariate analysis of climate and remotely sensed vegetation data. Medical and Veterinary Entomology, 11: 235–245.
Robinson, T.P., Harris, R.S. Hopkins, J.S. & Williams, B.G. 2002. An example of decision support for trypanosomiasis control using a geographic information system in eastern Zambia. International Journal of Geographical Information Science, 16: 345–360.
Roderick, S., Stevenson, P. & Ndungu, J. 1998. The production parameters influencing the composition and structure of pastoral cattle herds in a semi-arid area of Kenya. Animal Science, 66:585–594.

Intervening against bovine trypanosomosis in eastern Africa: mapping the costs and benefits98
Roderick, S., Stevenson, P. & Ndungu, J. 1999. Factors influencing the production of milk from pastoral cattle herds in Kenya. Animal Science, 68: 201–209.
Roderick, S., Stevenson, P., Mwendia, C. & Okech, G. 2000. The use of trypanocides and antibiotics by Maasai pastoralists. Tropical Animal Health and Production, 32, 361–374.
Rogers, D.J. & Randolph, S.E. 1993. Distribution of tsetse and ticks in Africa: past present and future. Parasitology Today, 9: 266–271.
Rogers, D.J. & Robinson, T.P. 2004. Tsetse distribution. In: I. Maudlin, P.H. Holmes & M.A. Miles, eds. The trypanosomiases, pp. 139–179. Wallingford, UK, CABI Publishing.
Rowlands, G.J., Mulatu, W., Leak, S.G.A., Nagda, S.M. & d’Ieteren, G.D.M. 1999. Estimating the effects of tsetse control on livestock productivity – A case study in southwest Ethiopia. Tropical Animal Health and Production, 31: 279–294.
Rushton, J. 2009. The economics of animal health and production. Wallingford, UK, CABI Publishing.
Rutebuka, A.M. 2006. Socio-economic baseline survey to guide tsetse control and eradication in the southern rift valley, Ethiopia. Southern Rift Valley Tsetse Eradication Project (STEP), Addis Ababa, Ethiopia.
SC-UK & DPPA. 2001, 2002, 2004, 2005. Somali Regional State, Ethiopia: livelihood zones. SC-UK, DPPA (available at http://www.dppc.gov.et/Livelihoods/livelihoodhome.htm).
Scharlemann, J.P.W., Benz, D., Hay, S.I., Purse, B.V., Tatem, A.T.J., Wint, G.R.W. & Rogers, D.J. 2008. Global data for ecology and epidemiology: a novel algorithm for temporal fourier processing MODIS data. PLoS One, 3: e1408.
Scoones, I. 1998. Sustainable rural livelihoods: a framework for analysis. Sustainable Livelihoods Programme Working Paper 7/Institute of Development Studies Working Paper 72. Brighton, UK, University of Sussex, Institute of Development Studies (available at http://mobile.opendocs.ids.ac.uk/opendocs/bitstream/handle/123456789/3390/Wp72.pdf?sequence=1).
Seaman, J., Clarke, P., Boudreau, T.E. & Holt, J. 2000. The household food economy approach: a resource manual for practitioners. Westport, USA, Save the Children (available at http://www.alnap.org/resource/10029).
Shaw, A.P.M. 1986. The control of trypanosomiasis in the Sudan and northern Guinea zones of West Africa, with special reference to Nigeria and Mali. PhD thesis, University of Reading, UK.
Shaw, A.P.M. 1990. A spreadsheet model for the economic analysis of tsetse control activities benefiting cattle production. Insect Science and its Application, 11: 449–453.
Shaw, A.P.M. 2003. Economic guidelines for strategic planning of tsetse and trypanosomiasis control in West Africa. PAAT Technical and Scientific Series No. 5. Rome, Italy, FAO, (available at http://www.fao.org/docrep/006/Y4972E/Y4972E00.HTM).
Shaw, A.P.M. 2004. The economics of African trypanosomiasis. In I. Maudlin, P.H. Holmes & M.A. Miles, eds. The trypanosomiases, pp. 369–402. Wallingford, UK, CABI Publishing.
Shaw, A.P.M., Zessin, K.H. & Münstermann, S. 1994. Modelling the economics of tsetse control using mono-pyramidal traps in Côte d’Ivoire. In G.J. Rowlands, M. Kyule & B.D. Perry, eds. Proceedings of the 7th International Symposium on Veterinary Epidemiology and Economics, Nairobi, Kenya. The Kenya Veterinarian, 18: 244–246.

99References
Shaw, A.P.M., Hendrickx, G. & Wint, W. 2005. Mapping the benefits: first steps in developing a new decision tool for tsetse and trypanosomiasis interventions. Proceedings of the 27th Meeting of the International Scientific Council for Trypanosomiasis Research and Control (ISCTRC), Pretoria, South Africa, 2003, AU/STRC Publication No. 121. pp. 584-593.
Shaw, A., Hendrickx, G., Gilbert, M., Mattioli, R., Codjia, V., Dao, B., Diall, O., Mahama, C., Sidibé, I. & Wint, W. 2006. Mapping the benefits: a new decision tool for tsetse and trypanosomiasis interventions. Research report DFID Animal Health Programme, Centre for Tropical Veterinary Medicine, University of Edinburgh, UK and Rome, Italy, FAO- PAAT (available at http://www.fao.org/ag/againfo/programmes/en/paat/documents/papers/Paper_2006.pdf).
Shaw, A., Torr, S., Waiswa, C. & Robinson, T. 2007. Comparative costings of alternatives for dealing with tsetse: estimates for Uganda. FAO PPLPI Working Paper, no. 40. Rome, Italy, FAO (available at http://www.fao.org/3/a-bp194e.pdf ).
Shaw, A.P.M., Torr, S.J., Waiswa, C., Cecchi, G., Wint, W., Mattioli, R.C. & Robinson, T. P. 2013a. Estimating the costs of tsetse control options: an example for Uganda. Preventive Veterinary Medicine, 110: 290–303 (available at http://www.fao.org/docrep/018/al758e/al758e.pdf).
Shaw, A.P.M., Torr S.J., Waiswa, C., Cecchi, G., Wint, G.R.W., Mattioli, R.C. & Robinson, T.P. 2013b. Reply to the letter to the editor by Bouyer et al., 2013. Preventive Veterinary Medicine, 112: 447–449 (available at http://www.fao.org/docrep/019/as288e/as288e.pdf).
Shaw, A.P.M., Cecchi, G., Wint, G.R.W., Mattioli, R.C. & Robinson, T.P. 2014. Mapping the economic benefits to livestock keepers from intervening against bovine trypanosomosis in Eastern Africa. Preventive Veterinary Medicine, 113: 197–210 (available at http://www.fao.org/3/a-as289e.pdf).
Shaw, A.P.M., Tirados, I., Mangwiro, C.T.N., Esterhuizen, J., Lehane, M.J., Torr, S.J. & Kovacic, V. 2015a. Costs of using “tiny targets” to control Glossina fuscipes fuscipes, a vector of Gambiense sleeping sickness in Arua District of Uganda. PLoS. Neglected Tropical Diseases, 9: e3624.
Shaw, A.P.M., Wint, G.R.W., Cecchi, G., Torr, S.J., Mattioli, R.C. & Robinson, T.P. 2015b. Mapping the benefit-cost ratios of interventions against bovine trypanosomosis in eastern Africa. Preventive Veterinary Medicine, 122: 406–416 (available at http://www.fao.org/3/a-bl796e.pdf).
Shumba, E.M. 1984a. Reduced tillage in the communal areas. Zimbabwe Agricultural Journal, 81, 235–240.
Shumba, E.M. 1984b. Animals and the cropping system in the communal areas of Zimbabwe. Zimbabwe Science News, 1899: 02.
Simarro, P.P., Cecchi, G., Paone, M., Franco, J.R., Diarra, A., Ruiz, J.A., Fèvre, E.M., Courtin, F., Mattioli, R.C. & Jannin, J.G. 2010. The atlas of human African trypanosomiasis: a contribution to global mapping of neglected tropical diseases. International Journal of Health Geographics, 9: e57.
Simarro, P.P., Cecchi, G., Franco, J.R., Paone, M., Fèvre, E.M., Diarra, A., Ruiz, J.A. Mattioli, R.C. & Jannin, J.G. 2011. Risk for human African trypanosomiasis, Central Africa, 2000–2009. Emerging Infectious Diseases, 17: 2322–2324.

Intervening against bovine trypanosomosis in eastern Africa: mapping the costs and benefits100
Simarro, P.P., Franco, J.R., Cecchi, G., Paone, M., Diarra, A., Ruiz, J.A. & Jannin, J.G. 2012a. Human African trypanosomiasis in non-endemic countries (2000–2010). Journal of Travel Medicine, 19: 44–53.
Simarro, P.P., Cecchi, G., Franco, J.R., Paone, M., Fèvre, E.M., Diarra, A., Ruiz, J.A. Mattioli, R.C. & Jannin, J.G., 2012b. Estimating and mapping the population at risk of sleeping sickness. PLoS Neglected Tropical Diseases, 6: e1859.
Simarro, P.P., Cecchi, G., Franco, J.R., Paone, M., Diarra, A., Ruiz, J.A., Mattioli, R.C. & Jannin, J.G., 2014. Mapping the capacities of fixed health facilities to cover people at risk of gambiense human African trypanosomiasis. International Journal of Health Geographics, 13: 4.
Simarro, P.P., Cecchi, G., Franco, J.R., Paone, M., Diarra, A., Priotto, G., Mattioli, R.C. & Jannin, J.G., 2015. Monitoring the progress towards the elimination of gambiense human African trypanosomiasis. PLoS Neglected Tropical Diseases, 9(6): e0003785.
Smith, D.H., Pepin, J. & Stich, A.H.R. 1998. Human African trypanosomiasis: an emerging public health crisis. British Medical Bulletin: 54: 341–355.
SSCCSE & SC-UK. 2005. Southern Sudan Livelihood Profiles. Nairobi, Kenya, SSCCSE and SC-UK (available at http://pdf.usaid.gov/pdf_docs/Pnadh322.pdf).
Staal, S.J., Waithaka, M., Njoroge, L., Mwangi, D.M., Njubi, D. & Wokabi, A. 2003. Costs of milk production in Kenya: estimates from Kiambu, Nakuru and Nyandarua districts. SDP Research and Development Report No.1 Smallholder Dairy (R&D) Project. Nairobi, Kenya, Ministry of Livestock and Fisheries Development (MOLFD), KARI, ILRI and DFID.
Starkey, P. & Kaumbutho, P. eds. 1999. Meeting the challenges of animal traction. A resource book of the Animal Traction Network for Eastern and Southern Africa (ATNESA), Harare, Zimbabwe, Intermediate Technology Publications London, UK (available at http://www.atnesa.org/challengesbookcontents.htm).
Swai, E.S., Karimuribo, E.D., Schoonman, L., French, N.P., Fitzpatrick, J., Kambarage, D. & Bryant, M.J. 2005. Description, socio-economic characteristics, disease managements and mortality dynamics in smallholder’s dairy production system in coastal humid region of Tanga, Tanzania. Livestock Research for Rural Development, 17: e41 (available at http://www.lrrd.org/lrrd17/4/swa17041.htm).
Swallow, B.M. 2000. Impacts of trypanosomiasis on African agriculture. PAAT Technical and Scientific Series 2. Rome, Italy, FAO (available at http://www.fao.org/ag/againfo/programmes/en/paat/documents/papers/Paper_1999.pdf).
Tesfaye, D., Speybroeck, N., De Deken, R. & Thys, E. 2012. Economic burden of bovine trypanosomosis in three villages of Metekel zone, northwest Ethiopia. Tropical Animal Health and Production, 44: 873–879.
Thuranira, C. 2005. Socio-economic factors influencing livestock keeping dynamics in a smallholder crop-livestock system in western Kenya. PhD Thesis, University of Edinburgh, UK.
Thuranira-McKeever, C., Shaw, A., Machila, N., Eisler, M., Welburn, S. & Maudlin, I. 2010. Seasonal influences on livestock keeping in a sedentary crop-livestock system. Tropical Animal Health and Production, 42: 705–717.

101References
Tirados, I., Esterhuizen, J., Kovacic, V., Mangwiro, T.N.C., Vale, G.A., Hastings, I., Solano, P., Lehane, M.J. & Torr, S.J. 2015. Tsetse control and Gambian sleeping sickness; implications for control strategy. PLoS Neglected Tropical Diseases, 9, e0003822.
Torr, S.J. & Vale, G.A. 2011. Is the even distribution of insecticide-treated cattle essential for tsetse control? Modelling the impact of baits in heterogeneous environments. PLoS. Neglected Tropical Diseases, 5: e1360.
Torr, S.J., Wilson, P.J., Schofield, S., Mangwiro, T.C., Akber, S. & White, B.N. 2001. Application of DNA markers to identify the individual-specific hosts of tsetse feeding on cattle, Medical and Veterinary Entomology, 15:78–86.
Torr, S.J., Maudlin, I. &Vale, G.A. 2007a. Less is more: restricted application of insecticide to cattle to improve the cost and efficacy of tsetse control. Medical and Veterinary Entomology, 21: 53–64.
Torr, S.J., Prior, A., Wilson, P.J. & Schofield, S. 2007b. Is there safety in numbers? The effect of cattle herding on biting risk from tsetse flies. Medical and Veterinary Entomology, 21: 301–311.
Torr, S. J., Chamisa, A., Vale, G.A., Lehane, M.J. & Lindh, J.M. 2011. Responses of tsetse flies, Glossina morsitans morsitans and Glossina pallidipes, to baits of various size. Medical and Veterinary Entomology, 25: 365–369.
Troy, A. & Wilson, M.A. 2006. Mapping ecosystem services: practical challenges and opportunities in linking GIS and value transfer. Ecological Economics, 60: 435–449.
UBOS. 2014. Consumer Price Index. Kampala, Uganda, UBOS.UDDM, EWU-MAAIF, WFP, SC-UK & FEWS-NET. 2005. Livelihood zones of Uganda.
Kampala, Uganda, FEWS-NET. Upton, M. 1989. Livestock productivity assessment and herd growth models. Agricultural
Systems, 29: 149–164.Urga, B. & Abayneh, T. 2007. Study on management practices and work-associated health
problems of draught oxen around Debreberhan, Central Ethiopia. Livestock Research for Rural Development, 19: e7 (available at http://www.lrrd.org/lrrd19/1/urga19007.htm).
Vale, G. & Torr, S. 2004. Development of bait technology to control tsetse. In I. Maudlin, P.H. Holmes & M.A. Miles, eds. The trypanosomiases, pp. 509–523. Wallingford, UK, CABI Publishing.
Vale, G.A., Hargrove, J.W., Cockbill, G.F. & Phelps, R.J. 1986. Field trials of baits to control populations of Glossina morsitans Westwood and Glossina pallidipes Austen (Diptera: Glossinidae). Bulletin of Entomological Research, 76: 179–193.
Vale, G.A., Lovemore, D.F., Flint, S. & Cockbill, G.F. 1988. Odour-baited targets to control tsetse flies, Glossina spp. (Diptera: Glossinidae), in Zimbabwe. Bulletin of Entomological Research, 78: 31–49.
Van den Bossche, P. 2001 Some general aspects of the distribution and epidemiology of bovine trypanosomosis in southern Africa. International Journal of Parasitology, 31: 592–598.
Van den Bossche, P. & De Deken, R. 2004. The application of bait technology to control tsetse. In I. Maudlin, P.H. Holmes & M.A. Miles, eds. The trypanosomiases, pp. 525–532. Wallingford, UK, CABI Publishing.

Intervening against bovine trypanosomosis in eastern Africa: mapping the costs and benefits102
Van den Bossche, P., Doran, M. & Connor, R.J. 2000. An analysis of trypanocidal drug use in the Eastern Province of Zambia. Acta Tropica, 75:247–258.
von Kaufmann, R., MacIntyre, J. & Itty, P. 1990. ILCA bio-economic herd model for micro-computer. User’s Manual. Addis Ababa, Ethiopia, International Livestock Centre for Africa.
Welburn, S.C., Coleman, P.G., Maudlin, I., Fèvre, E.M., Odiit, M. & Eisler, M.C. 2006. Crisis, what crisis? Control of Rhodesian sleeping sickness. Trends in Parasitology, 22:123–128.
WHO. 1998. Control and surveillance of African trypanosomiasis – Report of a WHO Expert Committee. WHO Technical Report Series No. 881. Geneva, Switzerland, WHO (available at http://apps.who.int/iris/bitstream/10665/42087/1/WHO_TRS_881.pdf).
Wilson, R.T., Bech, J.N. & Waveren, E. 2002. Draught animals in the livelihoods of mixed smallholder farmers in North Wollo, Ethiopia. Draught Animal News, 37: 2–8. Edinburgh, UK, Centre for Tropical Veterinary Medicine (available at http://www.link.vet.ed.ac.uk/ctvm/research/dapr/draught%20animal%20news/Issue%2037/Issue%2037.htm).
Wint, G.R.W. 2001. Kilometre resolution tsetse fly distribution maps for the Lake Victoria Basin and West Africa. Report to the Joint FAO/IAEA Programme.
Wint, W. 2002a. Kilometre resolution tsetse fly distributions for Ethiopia. Maps and data CD prepared by Environmental Research Group Oxford Ltd for the Animal Production and Health Section of the FAO/IAEA Joint Division. Vienna, Austria, IAEA.
Wint, W. 2002b. Kilometre resolution tsetse fly distributions for Kenya and Somalia. Maps and data CD prepared by Environmental Research Group Oxford Ltd for the Animal Production and Health Section of the FAO/IAEA Joint Division. Vienna, Austria, IAEA.
Wint, W. & Robinson, T. 2007. Gridded livestock of the world. Rome, Italy, FAO (available at http://www.fao.org/docrep/010/a1259e/a1259e00.htm).
Wint, G.R.W. & Rogers, D. 2000. Predicted distributions of tsetse in Africa. Consultancy report and database prepared by Environmental Research Group Oxford Ltd and TALA Research Group, Department of Zoology, University of Oxford, for the Animal Health Service of the Animal Production and Health Division of the FAO. Rome, Italy, FAO (available at http://www.fao.org/ag/againfo/programmes/en/paat/maps.html).
Wint, W., Bourn, D., Hendrickx, G., Kruska, R. & Slingenbergh, J. 2002a. Livestock mapping: present and future. In R. Tateishi, & D. Hastings, eds. Global Environmental Databases (Volume 2), pp. 39–54. Chiba, Japan, International Society for Photogrammetry and Remote Sensing (ISPRS).
Wint, G.R.W., Robinson, T.P., Bourn, D.M., Durr, P.A., Hay, S.I., Randolph, S.E. & Rogers, D.J. 2002b. Mapping bovine tuberculosis in Great Britain using environmental data. Trends in Microbiology, 10: 441–444.
Wint, W., Chilonda, P., Gerber, P., Robinson, T. & Wassenaar, T. 2003. Defining land unsuitable for livestock. Consultancy report prepared by Environmental Research Group Oxford Ltd for the Animal Health Service of the FAO. Rome, Italy, FAO.
Wint, W., Shaw, A.P.M., Cecchi, G., Mattioli, R., Alemu, T., Eregae, E.M., Abdi, A.M., Muchina Munyua, S.J., Mugasi, S. & Robinson, T. 2011. Mapping the benefits II: extending the concept of monetary maps of trypanosomiasis losses from western to

103References
eastern Africa. Proceedings of the 30th meeting of the ISCTRC, Kampala, Uganda, 2009, AU/STRC Publication no. 125, pp. 564–588.
Yilma, Z., Guernebleich, E. & Sebsibe, A. 2011. A review of the Ethiopian dairy sector. R. Fombad, ed. FAO Sub Regional Office for Eastern Africa (FAO/SFE) (available at http://www.fao.org/3/a-aq291e.pdf).

PAAT Technical and Scientific Series
1. Drug management and parasite resistance in bovine trypanosomiasis in Africa, 19982. Impacts of trypanosomiasis on African Agriculture, 20003. Integrating the sterile insect technique as a key component of area-wide tsetse and
trypanosomiasis intervention, 20014. Socio-economic and cultural factors in the research and control trypanosomiasis, 20035. Economic guidelines for strategic planning of tsetse and trypanosomiasis control
in West Africa, 20036. Long-term tse-tse and trypanosomiasis management options in West Africa, 2004 7. Trypanotolerant livestock in the context of trypanosomiasis intervention strategies, 2005 8. Standardizing land cover mapping for tsetse and trypanosomiasis decision making, 20089. Tsetse distribution in the Mouhoun river basin (Burkina Faso), 200910. Linking sustainable human and animal African trypanosomosis control with rural
development strategies, 2011
Availability: November 2017
The PAAT Technical and Scientific Series are available through the authorized FAO Sales Agents or directly from Sales and Marketing Group, FAO, Viale delle Terme di Caracalla, 00153 Rome, Italy.

1
ISSN 1020-7163
PAATTECHNICAL
ANDSCIENTIFIC
SERIES
11
Intervening againstbovine trypanosomosisin eastern Africa:mapping the costs and benefits
PAAT INFORMATION SERVICE PUBLICATIONS
Eastern Africa’s livestock keepers face many challenges, not least the widespread prevalence of endemic diseases which both undermine animals’ productivity and increase livestock mortality. Tsetse-transmitted trypanosomosis causes significant economic losses, in particular in cattle. This study analyses these losses in a spatially explicit framework for the six tsetse-infested countries of the Intergovernmental Authority on Development (IGAD) region: Ethiopia, Kenya, Somalia, South Sudan, Sudan and Uganda. The cattle production systems of the region are diverse, ranging from pastoralism to agropastoralist and mixed crop-livestock farming. Some areas make extensive use of draught cattle or of high yielding crossbred dairy cows. Based on these features, twelve cattle production systems in the region were characterized and mapped. In these systems, the potential incomes from cattle production were modeled for a situation with and without trypanosomosis; the models looked at mortality, fertility, other productivity parameters and cattle population growth and expansion. The results of the analysis were used to generate a map of the potential benefits of controlling the disease. Estimates were then made of the costs of tsetse and trypanosomosis control using a range of techniques, namely: trypanocidal drugs; control or localized elimination of tsetse flies using insecticide-treated cattle or targets, aerial spraying and the sterile insect technique. The mapped potential benefits and mapped estimated costs were combined in order to produce a series of benefit-cost maps which illustrate what techniques are likely to be the most economically attractive in different areas of the study region. The suite of tools and economic analyses documented in this paper provide essential information to decision makers for comparing and prioritizing interventions in the region.
Interven
ing
again
st bo
vine tryp
ano
som
osis in
eastern A
frica: map
pin
g th
e costs an
d b
enefi
tsFA
O