pacific earthquake engineering research...
TRANSCRIPT

Pacific Earthquake EngineeringResearch Center
Documentation of Strengths and Weaknesses ofCurrent Computer Analysis Methods for
Seismic Performance of Reinforced Concrete Members
William F. Cofer
PEER 1999/07NOVEMBER 1999

Documentation of Strengths and Weaknesses ofCurrent Computer Analysis Methods for
Seismic Performance of Reinforced Concrete Members
William F. CoferDepartment of Civil and Environmental Engineering
Washington State UniversityPullman, Washington
PEER Report 1999/07Pacific Earthquake Engineering Research Center
College of EngineeringUniversity of California, Berkeley
November 1999

iii
ABSTRACT
One of the future needs of the engineering community is a general computationalplatform for the seismic analysis of structures, structural components, and the interactionbetween structures and surrounding soil. However, before a large effort is expended, athorough evaluation of current capabilities is required to establish the state of the art andto determine the direction that should be taken with regard to design needs and analyticalapproaches. A specific area of interest is the analysis of reinforced concrete components,including cracking and crushing of concrete and yield of steel. The focus of the work ofthis report was to perform an evaluation of current capabilities in this area by applyingseveral existing software packages to a benchmark problem. Data from a set of recentexperimental tests involving the flexural and shear performance of a reinforced concretecolumn were obtained. Cyclic and monotonic load cases were performed for severaltypes of analysis using a degrading plastic hinge model, a fiber beam model, and adetailed three-dimensional finite element model. Details of the data preparation andanalysis results are presented. Reasonable results were obtained from all models tovarying degrees, but the three-dimensional finite element model was unable to providemeaningful solutions in the inelastic range due to numerical difficulties. Therefore, eitherthe use of the degrading hinge model or the fiber beam model is recommended forpractical structural analysis.

iv
ACKNOWLEDGMENTS
This work was supported in part by the Pacific Earthquake Engineering Research Centerthrough the Earthquake Engineering Research Centers Program of the National ScienceFoundation under Award number EEC-9701568.

v
CONTENTS
ABSTRACT................................................................................................................................ iii
ACKNOWLEDGMENTS............................................................................................................iv
TABLE OF CONTENTS..............................................................................................................v
LIST OF FIGURES.....................................................................................................................vii
LIST OF TABLES .......................................................................................................................ix
1 INTRODUCTION................................................................................................................1
2 BENCHMARK TEST SPECIMEN ...................................................................................3
2.1 Experimentally Observed Behavior ...............................................................................4
3 SOFTWARE FOR PLASTIC HINGE MODEL...............................................................7
3.1 Beam-Column Element with Damage ...........................................................................8
3.1.1 Damage Coefficient...........................................................................................10
3.1.2 Yield Function...................................................................................................11
3.1.3 Hysteresis Model...............................................................................................12
3.2 Input Data for Plastic Hinge Model .............................................................................13
3.2.1 Yield Function...................................................................................................13
3.2.2 Hinge Properties ................................................................................................16
3.2.3 Elastic Properties...............................................................................................17
3.3 Analysis and Results ....................................................................................................17
4 SOFTWARE FOR THE FIBER BEAM MODEL..........................................................25
4.1 Analysis and Results ....................................................................................................27
5 SOFTWARE FOR NONLINEAR THREE-DIMENSIONALFINITE ELEMENT ANALYSIS......................................................................................33
5.1 Analysis and Results ....................................................................................................33
6 DISCUSSION AND CONCLUSIONS .............................................................................37
6.1 Degrading Hinge Model...............................................................................................37
6.2 Fiber Beam Model........................................................................................................37
6.3 Three-Dimensional Finite Element Model...................................................................37
6.4 Conclusions..................................................................................................................38
REFERENCES..........................................................................................................................39

vii
LIST OF FIGURES
Figure 1 Test setup....................................................................................................................4
Figure 2 Hysteresis curves for the specimen (1 in. = 25.4 mm, 1 kip = 4.448 kN)..................5
Figure 3 Moment curvature relation and conventional hysteresis rule models
used in original NEABS; (a) moment curvature relation;
(b) hysteresis rule.......................................................................................................8
Figure 4 Flexural strength and ductility of sections (Priestley and Seible 1994).....................9
Figure 5 Moment vs. curvature relation of the element .........................................................10
Figure 6 Generalized yield surface .........................................................................................11
Figure 7 Yield curve of isotropic strain softening material for a fixed axial force ................12
Figure 8 Hysteresis model for the beam-column element ......................................................13
Figure 9 Calculated and assumed strength characteristics of the column ..............................15
Figure 10 Model layout; horizontal load applied to show location and direction ....................17
Figure 11 Example elastic deflected shapes for push and pull loading....................................18
Figure 12 Lateral force vs. deflection for the test frame ..........................................................18
Figure 13 Bending moment at the base of the column .............................................................19
Figure 14 Bending moment at the top of the column...............................................................19
Figure 15 Time history of lateral deflection.............................................................................21
Figure 16 Time history of column shear ..................................................................................21
Figure 17 Time history of top column moment .......................................................................22
Figure 18 Time history of bottom column moment .................................................................22
Figure 19 Hysteresis curve for the system ...............................................................................23
Figure 20 Hysteresis curve for bottom column moment..........................................................23
Figure 21 Hysteresis curve for top column moment ................................................................24
Figure 22 Mesh layout of the coarse model .............................................................................27
Figure 23 Mesh layout of the fine model .................................................................................28
Figure 24 Curvature diagram and exaggerated deformed shape for the column;
coarse mesh..............................................................................................................29
Figure 25 Curvature diagram and exaggerated deformed shape for the column; fine
mesh .........................................................................................................................29

viii
Figure 26 Hysteresis curve for the system; coarse model........................................................30
Figure 27 Hysteresis curve for the system; fine model............................................................30
Figure 28 Hysteresis curve for bottom column moment; coarse model ..................................30
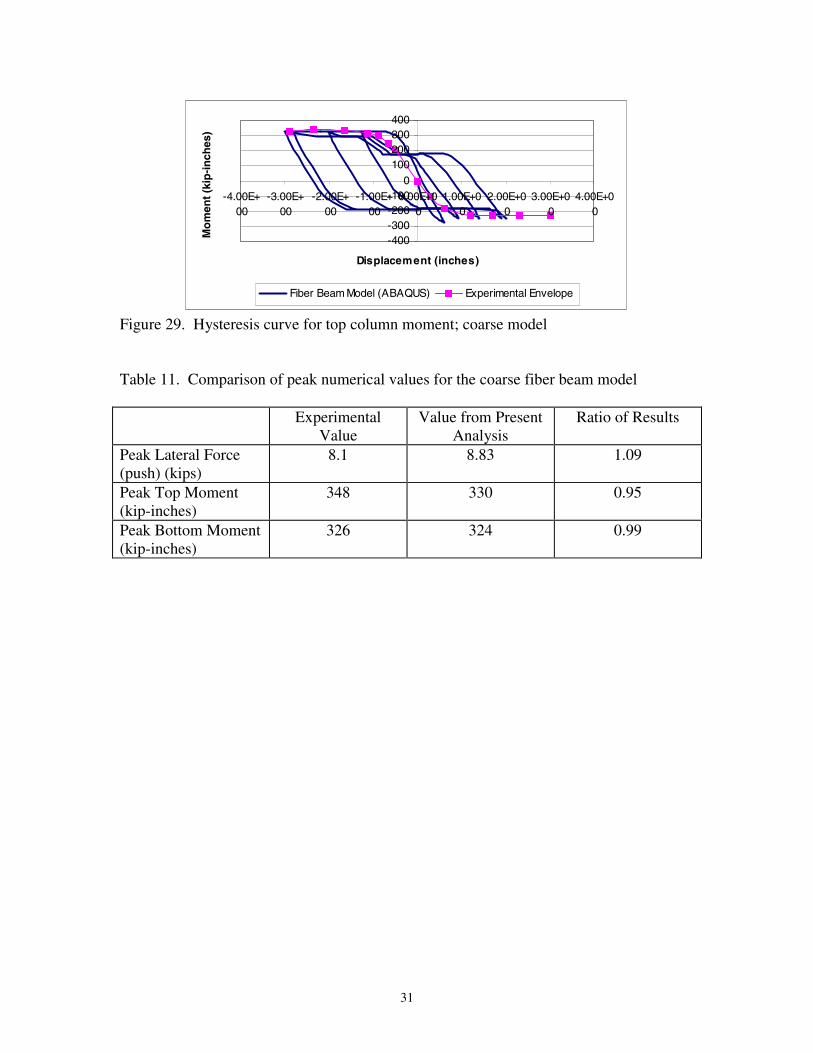
Figure 29 Hysteresis curve for top column moment; coarse model.........................................31
Figure 30 Finite element mesh for the three-dimensional finite element model .....................33
Figure 31 Deformed shape, three-dimensional finite element model.......................................34
Figure 32 Contours of vertical stress........................................................................................34
Figure 33 Contours of vertical strain........................................................................................35
Figure 34 Contours of crack-opening strain.............................................................................35
Figure 35 System behavior, three-dimensional finite element model......................................36
Figure 36 A comparison of system stiffness for all models.....................................................36

ix
LIST OF TABLES
Table 1 Moment and axial force parameters for the column and the splice..........................15
Table 2 Coefficients for axial force-bending moment interaction ........................................16
Table 3 Plastic hinge parameters...........................................................................................17
Table 4 Comparison of results from analysis and experiment ..............................................20
Table 5 Numerical value of load cycles ................................................................................20
Table 6 Comparison of experimental and numerical results; plastic hinge model ...............24
Table 7 Elastic-plastic material properties for concrete ........................................................25
Table 8 Data to define the failure surface for concrete .........................................................26
Table 9 Data to define retained tensile stress normal to a crack ...........................................26
Table 10 Reinforcing steel properties .....................................................................................26
Table 11 Comparison of peak numerical values for the coarse fiber beam model .................31

1 Introduction
Many seismic analyses involve the need to model concrete structural components.Nonlinear effects in reinforced concrete during seismic activity result from a number ofmechanisms, including concrete crushing and cracking; yield and strain hardening ofreinforcement; buckling of reinforcement; bond slip; interaction between axial force,biaxial bending, biaxial shear force, and torsional moment; and degradation of stiffnessand strength under cyclic loads. Analyses of concrete structures may be performed at anumber of levels. For the simplest approach, reinforced concrete beams and columns aremodeled as traditional beam elements, with material nonlinearity lumped at discreteplastic hinges. Refinements would include a relationship between column axial force andinelastic bending moment, an algorithm for proper hysteretic behavior, and a damagecoefficient to consider strength and stiffness degradation. At the next level, a fiber modelmay be used for structural members, in which the material behavior is integrated over thecross section and along the length of the element. At the highest level, the concrete ismodeled in detail with two or three dimensional solid elements, while the reinforcementis included with bar elements.
In order to evaluate the ability of existing software and analysis techniques to accuratelymodel the behavior of actual reinforced concrete members, a benchmark test specimenwas chosen. The test sequence was then modeled using the software WSU-NEABS,which employs lumped hysteretic plastic hinges, ABAQUS, with a fiber beam model, andABAQUS, using nonlinear three-dimensional finite element analysis.

2 Benchmark Test Specimen
A series of tests were recently performed (Jaradat et al. 1998) to investigate the flexuraland shear performance of typical existing bridge columns. The test arrangement wasdesigned to represent the entire column from foundation to cap beam. The column wasfixed at the base by a strong oversized footing, bolted to the test floor, and fixed at the topby an oversized cap which was attached to a W 14 x 61 steel beam and a tubular steelstrut (5-inch o.d. x 0.25-inch w. t.), as shown in Figure 1. The column was circular witha diameter of 10 inches, and had a length of 70 inches. It was longitudinally reinforcedwith eight No. 4 ASTM Grade 40 steel bars (52 ksi measured yield strength) evenlyspaced around the perimeter. Transverse steel reinforcement consisted of 9-gage wire inthe form of circular hoops spaced at 3.85 inches on center. The column baseincorporated a lap splice with a length of 20 longitudinal bar diameters. The concrete hada measured compressive strength of 4200=′cf psi.
Cyclic lateral load was applied by a computer-controlled actuator operating withdisplacement control, based on a pattern of progressively increasing displacements. Inaddition, an axial load of 19.0 kips was applied to the column, corresponding to
gc Af ′05.0 . The actual axial load resisted by the column varied according to the applied
lateral load direction, due to framing action. This variation in column axial load wouldalso occur in actual multi-column bridge bents under lateral loading.

4
Figure 1. Test setup
2.1 Experimentally Observed Behavior
Specimen performance was evaluated on the basis of moment capacity, shear strength,displacement ductility, strength degradation, and hysteretic behavior. For this specimen,the measured yield displacement, y∆ , was 0.56 inches. Vertical cracks in the bottom
splice region and circumferential cracks in the top hinging section were observed whileloading to a displacement level of y∆2 . The concrete cover started to spall off at y∆4 in
both the top and bottom hinge regions. Longitudinal bar buckling was observed in thetop hinging region during cycling to y∆5 and testing was stopped.
The hysteresis curves for the specimen are shown in Figure 2. The peak applied lateralload of 8.0 kips occurred at a displacement of 1.1 inches and was followed by a gradualdegradation in load capacity. From the hysteresis curves for the top-section and bottom-section moments, it can be seen that the loss in capacity was primarily a result ofdegradation of the splice region at the base of the column. The top-section momentcapacity showed a stable behavior until degradation started at a lateral displacement of2.4 inches as a result of bar buckling.

5
-20.0
-15.0
-10.0
-5.0
0.0
5.0
10.0
15.0
20.0
-5.0 -3.0 -1.0 1.0 3.0 5.0
Lateral Displacement, in.
Lat
eral
Loa
d, k
ips
Specimen T2M / VD = 3.5ρ = 0.011ls = 20 db
PushPull
(a): Hysteresis curves of the lateral load vs. lateral displacement
-600.0
-400.0
-200.0
0.0
200.0
400.0
600.0
-5.0 -3.0 -1.0 1.0 3.0 5.0
Lateral Displacement, in.
Top
-Sec
tion
Mom
ent,
kip-
in.
PullPush
Specimen T2M / VD = 3.5ρ = 0.011ls = 20 db
(b): Hysteresis curves of the top-section moment vs. lateral displacement
-600.0
-400.0
-200.0
0.0
200.0
400.0
600.0
-5.0 -3.0 -1.0 1.0 3.0 5.0
Lateral Displacement, in.
Bot
tom
-Sec
tion
Mom
ent,
kip-
in.
PushPull
Specimen T2M / VD = 3.5ρ = 0.011ls = 20 db
(c): Hysteresis curves of the bottom-section moment vs. lateral displacement
Figure 2. Hysteresis curves for the specimen (1 in. = 25.4 mm, 1 kip = 4.448 kN)

3 Software for Plastic Hinge Model
Tseng and Penzien developed a nonlinear mathematical model for bridge structuralsystems in 1973 in which an elasto-perfectly-plastic beam-column element and a bridgeexpansion joint element were presented (Tseng and Penzien 1973), called NEABS(Nonlinear Earthquake Analysis of Bridge Systems). The program was later modified byKawashima and Penzien (1976), and again by Imbsen, et al. (1978). To study energyabsorption characteristics of highway bridges under seismic conditions, Imbsen andPenzien later presented a new nonlinear beam-column element that added kinematichardening effects to NEABS (Imbsen and Penzien 1986). At the same time, a gappedtension-compression, tie-bar element was also developed for inclusion in the NEABSnonlinear expansion joint element. McGuire et al. (1994) modified the 1978 version ofthe program to include the effects of soil-structure interaction.
NEABS can evaluate a discrete bridge system subjected to applied dynamic loadings orprescribed support motions. The equations of motion in NEABS are solved by a step-by-step direct integration procedure. Either the constant acceleration or the linearacceleration method may be chosen for integration, and to increase the speed ofconvergence at each time step, an option is provided to subdivide the time step.However, this program has a major limitation in that the softening behavior of beam-columns due to damage is not considered. The structural elasto-plastic stiffness matrix forbeam-column elements was derived for the original program by using plastic flow theory.It was assumed that the material behavior of the beam-column element was elastic-perfectly plastic (Fig. 3a), in which plastic hinges were point hinges (zero-length hinges).However, reinforced concrete members exhibit damage and softening behavior, i.e.,decreasing bending moment at advanced flexural deformations before failure.Damage/softening is important for the dynamic analysis of pre-1971 designed highwaybridges. Because most columns designed before 1971 had inadequate confinement andwere lap-spliced at the connection zone between columns and footings (plastic hingeregion), the flexural strength of columns in the potential plastic hinge region degradesrapidly with increased demand. The decrease of flexural strength of columns causes aredistribution of structural element forces, so that the seismic response of the entirehighway bridge is significantly influenced. Moreover, an important aspect to dynamiccolumn behavior is the degradation of stiffness when members are subjected to cyclicloadings, for which structural stiffness will decrease with reloading. The hysteresis ruleused in the original version of NEABS is a conventional elastic-plastic model (Fig. 3b)that does not accurately represent the degradation of stiffness with increasingdeformations for reinforced concrete. Therefore, the original NEABS program is notappropriate for evaluating the earthquake response for the highway bridges that wereconstructed before 1971.

8
(a) (b)
Figure 3. Moment-curvature relation and conventional hysteresis rule models used inoriginal NEABS; (a) Moment-curvature relation; (b) Hysteresis rule
To overcome this limitation of NEABS and provide a realistic and practical method forthe assessment of the effectiveness of different retrofit measures, a model fordamage/softening behavior of beam-column elements based on an isotropic softeningmodel with degradation of stiffness was proposed and then implemented into NEABS, asdescribed in detail elsewhere (Cofer et al. 1997; Zhang et al. 1999). A basic descriptionof the model is repeated below for completeness.
3.1 Beam-Column Element with Damage
For the elastic-perfectly plastic R/C beam-column element originally used in NEABS, themoment-curvature relation and hysteretic model in a one-dimensional force space areshown in Figure 3. However, most experimental results for R/C beams or columnssubject to cyclic loading exhibit rather complicated behavior that includes such effects asrounding, pinching, and stiffness degradation (Imbsen and Penzien 1986). The mostsignificant influence on structural analysis is stiffness degradation. According toexperiments conducted by Priestley and Seible (1994), the elastic-perfectly-plastic modelcannot represent the actual behavior if the plastic deformation is allowed to increasewithout limit. When plastic deformation at an end grows beyond a certain value (calledcritical curvature, φc), the material may undergo damage, which is represented bysoftening. In this stage, the moment decreases with an increase in plastic rotation.
Based on the experimental work done by Priestley, Seible, and Chai (1992), four models,as shown in Figure 4, were proposed to represent the strength and ductility of differentplastic hinge conditions for column members. The parameter, µ∆, is the displacementductility, defined as the ratio of maximum displacement at the top of a column divided bythe yield displacement. The line (1) represents columns that have a comparatively well-confined section, in which the nominal moment capacity, Mn, will be reached at 1=∆µ ,and then strain-hardening of flexural reinforcement and confinement effects will occur sothat the moment reaches an overstrength moment capacity, M0, that can be attained bymoment-curvature analysis. This model is a typical representation of the relation between

9
strength and ductility for columns with sufficient confinement or retrofitting, i.e., steeljacketing, etc.
Figure 4. Flexural strength and ductility of sections (Priestley and Seible 1994)
Line (2) represents a poorly confined column without lap splices in the plastic hingeregion, for which the maximum strength is typically equal to the nominal strength. Thismodel is suitable for the columns designed by pre-1971 design codes. Strengthdegradation will occur if the limit for line (1) or line (2) is reached due to crushing ofcore concrete and buckling of longitudinal reinforcement.
Line (3) represents degradation of a column with lap splices and poor confinement in theplastic hinge region, in which the nominal moment capacity will not be achieved. Thestrength starts degrading before 1=∆µ to a residual flexural strength, Mr , which is afunction of the magnitude of the axial load. The cause of the degradation is that thelongitudinal bar in the lap splice region can not develop its yield force before slip and/orbuckling occurs.
Line (4) represents degradation of a column with partially confined lap splices, in whichthe nominal moment capacity Mn can be reached and then a relatively small plasticplateau can be achieved before degradation begins. The degradation occurs when theextreme fiber compression strain ε c is 0.002. This model indicates that the longitudinalbar in the lap splice region can develop its yield force before slip and/or buckling. Theline degrades to Mr , parallel to line (3).
Both lines (3) and (4) show the typical flexural strength and ductility of column sectionsdesigned prior to 1971, in which the lap splices were in the range of 20 to 35 longitudinalbar diameters, and confinement reinforcement was inadequate, typically No. 4 (13 mm)reinforcement on 305 mm centers. In this report, a column behavior model, shown inFigure 5, is described. It should be noted that strain hardening in this model is neglected.The hysteretic rule is discussed subsequently.

10
Figure 5. Moment vs. curvature relation of the element
3.1.1 Damage Coefficient
To derive the stiffness matrix for the softening stage, a damage coefficient, D, isintroduced. The damage coefficient is defined such that a value of 0 indicates no damagewhile a value of 1 means total damage. Failure of actual components is observed to occurat an intermediate value of damage, Dmax. Therefore, during the evolution of softening,the damage coefficient is equal to
Dp cp
cp=
−
−
θ θ
θ θmax
, 0 ≤ ≤D Dmax ≤ 1 (1)
where θ p is total plastic rotation angle, θcp is the critical plastic rotation angle that
indicates the point at which softening begins, and θmax is the maximum theoretical plasticrotation angle. θcp and θmax may be calculated through the following formula:
θ φ φcp
lp c y
= ⋅ −( ) (2)
θ φ φmax ( max )= ⋅ −l
p y (3)
where pl is plastic hinge length and φmax is the curvature for which the maximum
moment capability is equal to zero, theoretically. Thus, according to the definition of thedamage coefficient, at any point during the softening stage, the maximum momentcapacity is
M D My
= −( )1 (4)
where M y is the yielding moment.

11
3.1.2 Yield Function
The form of the generalized yield surface used in NEABS is shown in Figure 6. Theformula is given as
Myu
Myp
Mzu
Mzp
+
=
2 2
1 (5)
where M yu and Mzu are the bending moment values about the y and z-axes, respectively,
on the interaction surface for a fixed value of axial force, Pu. M yp and Mzp are the
ultimate bending moment values about the y and z-axes, respectively, for the same fixedvalue of Pu when M y and Mz are applied separately. To consider the influence of axial
force Pu, the following cubic equations are used to compute M yp and Mzp:
Myp
My
aP
uP
aP
uP
aP
uP
P Pu
Pt
= ⋅ +
+
+
− ⟨ ⟨0
11
02
0
2
30
3
0, (6)
Mzp
Mz
bP
uP
bP
uP
bP
uP
P Pu
Pt
= ⋅ +
+
+
− ⟨ ⟨0
11
02
0
2
30
3
0, (7)
where Pt is the ultimate axial tensile force, 0P is the ultimate axial compressive force,
M y0 and Mz0 are yielding moments about the y and z-axes, respectively, in pure bending,
and a a a b b1 2 3 1 2, , , , , and b3 are constants.
Figure 6. Generalized yield surface

12
One should note that the yield function mentioned above is only suitable for a perfectlyplastic material, in that the yield stress level does not depend in any way on the degree ofplastification. This means that the yield surface is fixed. For softening behavior,however, the yield surface is no longer unchanged in size, shape, or position withincreasing plastification. The selected model for the evolution of softening in this paper isisotropic, in which the subsequent yield surface is a uniform contraction of the originalone, as shown in Figure 7. The cause of the yield surface contraction is that the yieldstress level at a point decreases with increasing plastic deformation.
Figure 7. Yield curve of isotropic strain softening material for a fixed axial force
The yield function that also includes softening is defined as
( )M
yuM
yp
Mzu
Mzp
D
+
= −
2 2
1 2(8)
where D is the aforementioned damage coefficient and it is a function of plastic
deformation. Because ( )1 2− D is less than or equal to one, the yield surface shrinks,providing a generalization of the curves of Priestley, Seible, and Chai (1992) for multipledimensions.
3.1.3 Hysteresis Model
In this report, to imitate the actual behavior of reinforced concrete members subjected tocyclic deformation, a degradation of stiffness is considered. The application of stiffnessdegradation is illustrated by the moment vs. curvature curve in Figure 8. The loading,unloading, and reloading behavior are defined by the curve. The stiffness duringunloading is assumed to be the same as the initial elastic stiffness, but the stiffness duringreloading is allowed to degrade.

13
Figure 8. Hysteresis Model for the Beam-Column Element
The beam-column element is a three-dimensional element. During the elastic loading orunloading stage, as shown in Figure 8, the flexural capacities about the y and z-axes aremodeled as being fully continuous with no stiffness degradation. However, during theelastic reloading stage, the end conditions about the y and z-axes are considered to bebetween fully continuous and fully hinged conditions, in which the degradation ofstiffness is produced due to the damage. It should be noted that the approach is also basedon the assumption that the shear and axial capacities remain intact. To obtain thedegradation stiffness during the elastic reloading stage, the damage coefficient is usedagain to define the loss of elastic stiffness of the member due to damage. Detailedelement derivations may be found elsewhere (Zhang 1996; Cofer et al. 1997).
3.2 Input Data for Plastic Hinge Model
To apply the Plastic Hinge Model, the yield function and the initiation and evolution ofthe damage parameter must be specified.
3.2.1 Yield Function
The expression for the yield function, which includes the interaction between bendingmoment and axial force, is given as Equations 6 and 7 for the two principal axes of themember. The required coefficients were determined by fitting a cubic curve to the axialforce-bending moment strength interaction data computed for the specific column crosssection upon attainment of a maximum concrete strain of 002.0=cuε . The computed
interaction data was generated by a computer program which discretizes the column crosssection and utilizes material constitutive laws developed by Burns and Seiss for steel andby Park and Kent for concrete, as reported by Park and Paulay (1975), in its force

14
equilibrium calculations. To facilitate this curve fitting, the following equations weredeveloped, which force the curve to pass through the yield moment in pure bending(My0 or Mz0) and the ultimate axial compressive capacity, P0, and cause it to “peak” atMm, as defined below.
10 =a
( )[ ]rqrra 321 4
1 −−=α
( )[ ]232 312
1rqra −−=
α(9)
( )[ ]rqra 211 2
3 −−=α
[ ]14212
131
211
3
+−−−−= aaaaa
s
where:
≡mM maximum yield moment,
≡mP compressive axial force at maximum yield moment (positive); Mm and Pm
would typically occur at the balance point of an axial force-bendingmoment curve for a square cross section,
0
0
y
ym
M
MMq
−≡ ,
0P
Pr m≡ , 5.0≠r ,
( )22 1 rr −≡α ,
≡s ratio 0P
Pt , required as input, where Pt is the ultimate axial tensile capacity.
Properties for bending about the z-axis are computed similarly. For the circular columnconsidered here, the properties about the y-axis and the z-axis are identical. Figure 9shows a comparison of the axial force-bending moment strength interaction datacalculated for the column and the cubic curve obtained by the above procedure; the fit isquite close.
The region in the lap splice must be treated differently from the rest of the columnbecause the longitudinal reinforcing steel may be unable to develop its full yield strength.The strength of a bar in a lap splice may be determined by postulating the full pattern ofcracking that must develop to enable it to slide relative to the adjacent bar with which it islapped. The tensile strength necessary to fracture this surface may be assumed to beequal to the direct concrete tension strength, i.e.,
ct ff ′= 4 psi (10)

15
For a circular column, the total tensile force developed in a bar is:
( ) sbtb lcdn
DfT
++
′= 2
2
π(11)
where=n number of longitudinal bars,=c bar cover,
=bd bar diameter,
=′D bar pitch circle diameter, and=sl splice length.
Then, a reduced effective yield stress of b
bs A
Tf = may be used in the moment-curvature
analysis.
Using equations 10 and 11, tf was computed to be 259.2 psi, bT was computed to be
10.1 kips, resulting in an effective yield stress of 50.4 ksi. This value was used in themoment-curvature computer program to determine the section strength at the splice. Inaddition, a reduced amount of strain hardening was assumed. Pertinent data for thecolumn and the splice are given in Table 1.
-100
0
100
200
300
400
0 100 200 300 400 500 600
Moment (k-in)
Axi
al F
orc
e (k
ips)
AssumedCurve
CalculatedPoints
Figure 9. Calculated and assumed strength characteristics of the column
Table 1. Moment and axial force parameters for the column and the splice
M0
(K-in.)P0
(Kips)Mm
(K-in.)Pm
(Kips)q r α
Column 306 330 494 119 0.614 0.360 0.0531Splice 294 330 490 115 0.667 0.350 0.0518

16
Table 2. Coefficients for axial force-bending moment interaction
a0 a1 a2 a3 sColumn 1 -3.51694 -5.31628 -0.79934 0.213335Splice 1 -3.99298 -6.49039 -1.49741 0.189511
3.2.2 Hinge Properties
The curvature from nonlinear behavior in reinforced concrete members that isrepresented as a plastic hinge is typically assumed to occur within the equivalent plastichinge length, lp. Often, lp is taken as half the depth of the member. However, in recentresearch by Chai et al. (1991), the following equation was suggested:
bp dll χ+= 08.0 (12)
where
=l length from the critical section to the point of contraflexure,=bd nominal diameter of the longitudinal reinforcement used in the member,
=χ 6 for grade 40 longitudinal reinforcement,= 9 for grade 60 longitudinal reinforcement.
For the column under investigation, the point of contraflexure was assumed to occur atthe center of the member, resulting in l = 35 inches, db was 0.5 inches, and χ was set to avalue of 6, resulting in a plastic hinge length, lp = 5.8 inches.
Damage was only assumed to occur at the bottom of the column, which contained the lapsplice. From the moment-curvature analysis, the yield moment, My, was 266 kip-incheswhile the residual moment, Mr, was determined to be 94 kip-inches. Their ratio is:
353.00 ==y
r
M
Mr (13)
Then,
647.01 0max =−= rD (14)
Also, from the moment-curvature analysis, the curvature at yield, φy, the critical curvatureat which damage initiates, φc, and the curvature for which moment is theoretically zero,φmax, were specified. On the basis of equations 2 and 3, θcp and θmax were computed asgiven in Table 3.

17
Table 3. Plastic hinge parameters
φy φc φmax θcp θmax410119.3 −× 410502.8 −× 310458.3 −× 310122.3 −× 210825.1 −×
.
3.2.3 Elastic Properties
For column behavior in the elastic range, the geometric moment of inertia for a circularsection was used with an equivalent modulus of elasticity that was chosen on the basis ofthe moment-curvature analysis. For a required bending stiffness, EI, of 610136.1 × , theequivalent modulus of elasticity was defined as 2314 ksi.
3.3 Analysis and Results
A model of the test specimen was developed, as shown in Figure 10. The support at thefooting (node N1) was assumed to be fully fixed while the support at the base of thevertical strut (node N10) was assumed to be pinned. A hinge was assumed to exist at theconnection between the vertical strut and the horizontal restraint beam (node N9).Relatively stiff elements were included to model the effect of the cap at the top of thecolumn (elements M5 and M6) and the finite width of the horizontal restraint beam(element M8). Because of possible numerical difficulties arising from the fact that adegrading hinge at the base of the column results in a near mechanism, a weak horizontalspring element was added at the top right corner, node N8. Loading was applied asconcentrated forces at node N6. The horizontal load was assumed to vary with timewhile the vertical load remained constant. Both monotonic and cyclic loading wasapplied. To remove inertial effects, mass was not included. However, a nominal amountof system damping was applied to improve numerical performance.
Figure 10. Model layout; horizontal load applied to show location and direction

18
For the monotonic loading case, the model was loaded horizontally in both the positivedirection (push) and the negative direction (pull). The loading was ramped linearly froma zero value to a final value of 18 kips, which was chosen to be greater than the collapseload, as shown by experimental results. In the analyses, collapse is indicated byunbounded displacement or by divergence. Sample elastic deflected shapes are shown inFigure 11. The load-deflection curve is shown in Figure 12, while bending moment atthe top and bottom of the column is shown in Figures 13 and 14, respectively.
Figure 11. Example elastic deflected shapes for push and pull loading
-15
-10
-5
0
5
10
-4 -2 0 2 4
Displacement (inches)
Lat
eral
Fo
rce
(kip
s)
Degraded Hinge Model (NEABS) Experimental Envelope
Figure 12. Lateral force vs. deflection for the test frame

19
-400
-200
0
200
400
600
-6 -4 -2 0 2 4
Displacement (inches)
Mo
men
t (k
ip-i
nch
es)
Degrading Hinge Model (NEABS) Experimental Envelope
Figure 13. Bending moment at the base of the column
-400
-200
0
200
400
600
-4 -2 0 2 4
Displacement (inches)
Mo
men
t (k
ip-i
nch
es)
Degraded Hinge Model (NEABS) Experimental Envelope
Figure 14. Bending moment at the top of the column
The effect of the splice at the base of the column is apparent when comparing themoment responses in Figures 13 and 14, in which the moment at the base degrades withdamage. The difference between loading in the push and pull directions is shown to havea minor influence on strength due to an increase in column axial compression whenpulled and a decrease in column axial compression when pushed. Numerical data for

20
peak loading is given in Table 4. Agreement for strength data is fairly close although thedeflection data indicates that the model behavior is somewhat stiff. However, monotonicand cyclic results are not strictly comparable due to cyclic degradation, which is notconsidered in the analysis.
Table 4. Comparison of results from analysis and experiment
Peak Applied Lateral Load(kips)
Lateral Deflection(inches)
Experimental (push) 8.0 0.8Present Analysis (push) 8.9 0.39Experimental (pull) -7.7 -1.0Present Analysis (pull) -10.3 -0.53
For the cyclic loading case, an increasing series of ramped loads in alternating push andpull directions were applied, as given in Table 5. The load values were chosen to roughlycorrespond to the experimental procedure. The first cycle is slightly below the load forfirst yield while the second is somewhat higher than first yield and the third and fourthcycles are well above the strength of the system. Because there is no provision for cyclicdegradation at plastic hinges in the model, only a single cycle of load was applied at eachload level, as opposed to two cycles in the experimental tests. The time history data forlateral displacement, column shear, and top and bottom column moment are given inFigures 15 through 18, respectively. Hysteretic behavior is given in Figures 19, 20, and21. Failure of the system was indicated by nonconvergence of the solution.
Table 5. Numerical value of load cycles
Cycle Applied Lateral Load(kips)
1 42.7±2 58.10±3 88.15±4 00.18±
.

21
-5.00E-01
0.00E+00
5.00E-01
1.00E+00
1.50E+00
2.00E+00
2.50E+00
3.00E+00
0 200 400 600 800
"Time"
Dis
pla
cem
ent
(in
ches
)
Figure 15. Time history of lateral deflection
-1.00E+01
-5.00E+00
0.00E+00
5.00E+00
1.00E+01
0 200 400 600 800
"Time"
Co
lum
n S
hea
r (k
ips)
Figure 16. Time history of column shear

22
-500
-400
-300
-200
-100
0
100
200
300
400
0 200 400 600 800
"Time"
Mo
men
t (k
ip-i
nch
es)
Figure 17. Time history of top column moment
-400
-300
-200
-100
0
100
200
300
400
500
0 200 400 600 800
"Time"
Mo
men
t (k
ip-i
nch
es)
Figure 18. Time history of bottom column moment

23
-10
-5
0
5
10
-4 -3 -2 -1 0 1 2 3 4
Displacement (inches)
Lat
eral
Fo
rce
(kip
s)
Degraded Hinge Model (NEABS) Experimental Envelope
Figure 19. Hysteresis curve for the system
-400
-200
0
200
400
600
-4 -3 -2 -1 0 1 2 3 4
Displacement (inches)
Mo
men
t (k
ip-i
nch
es)
Degrading Hinge Model (NEABS) Experimental Envelope
Figure 20. Hysteresis curve for bottom column moment

24
-600
-400
-200
0
200
400
-4 -3 -2 -1 0 1 2 3 4
Displacement (inches)
Mo
men
t (k
ip-i
nch
es)
Degrading Hinge Model (Neabs) Experimental Envelope
Figure 21. Hysteresis curve for top column moment
As expected, loading above the maximum capacity in the push direction resulted in asharp drop in moment resistance at the base of the column which in turn resulted in nearmechanism behavior. The results are quite similar to those obtained experimentally withrecognition of the fact that displacement control was used for the tests while load controlwas used for the analyses. Lateral load capacity and column moment values are given inTable 6.
Table 6. Comparison of experimental and numerical results; plastic hinge model
ExperimentalValue
Value from PresentAnalysis
Ratio of Results
Peak Lateral Force(push) (kips)
8.1 8.45 1.04
Peak Top Moment(kip-inches)
348 377 1.08
Peak Bottom Moment(kip-inches)
326 379 1.16

25
4 Software for the Fiber Beam Model
ABAQUS/standard is a commercially available, general-purpose finite element systemwith a wide variety of elements, materials, and procedures (ABAQUS 1998). For theanalyses reported here, a nonlinear static procedure was employed using the Newtonmethod for solution. Nonlinearities result from inelastic material behavior and fromfinite deformations. For the reinforced concrete column, a Timoshenko (i.e., shear-flexible) beam element was chosen with an assumed circular cross section and numericalintegration through the beam depth.
Material properties were defined separately for the concrete and the steel reinforcing.The concrete material model is quite general, and it is intended for situations with lowconfining pressure and loadings that are relatively monotonic. The “smeared crack”assumption is employed, with the onset of cracking defined by the attainment of a “crackdetection surface,” which is a function of equivalent pressure stress and equivalentdeviatoric stress. Gradual material softening is assumed, with the rate of softeningdetermined by tension stiffening, allowing for the effects of interaction withreinforcement, or by crack opening displacement to consider consistent fracture energyrelease. The reduction in shear stiffness as a crack opens may also be specified.
For concrete loaded principally in compression, plasticity theory is used with acompression yield surface, similar to the crack detection surface, and assumed associatedflow and isotropic hardening. These assumptions are considered to be inaccurate whenconcrete is subjected to significant pressure stress, but reasonable and computationallyefficient otherwise. In addition, no attempt is made to include hysteretic behavior or areduction in stiffness with cyclic loading. Concrete material properties are given inTables 7, 8, and 9. Where specific values were not determined experimentally, acceptedvalues from practice were used.
Table 7. Elastic-plastic material properties for concrete
Modulus ofElasticity
(psi)
Poisson’s Ratio UniaxialCompressiveYield Stress
(psi)
UniaxialUltimate
CompressiveStress(psi)
Plastic Strain atUltimate
CompressiveStress
61072.3 × 0.18 1750 4200 0.0015

26
Table 8. Data to define the failure surface for concrete
Ratio of UltimateBiaxial
Compressive Stressto Ultimate
CompressiveUniaxial Stress
Ratio of UniaxialTensile Failure
Stress to UniaxialCompressive Failure
Stress
Ratio of PrincipalPlastic Strain at
Ultimate Stress inBiaxial
Compression toPlastic Strain at
Ultimate Stress inUniaxial
Compression
Ratio of TensilePrincipal Stress at
Cracking to TensileCracking Stressunder Uniaxial
Tension
1.18 0.05 1.25 0.2
Table 9. Data to define retained tensile stress normal to a crack
Tensile Stress at Crack Initiation(psi)
Direct Cracking Strain at Complete StressRelease
210 0.0016
Reinforcing steel is included in the form of discrete bars at specific locations within thebeam cross section. Only longitudinal reinforcing is considered. Elastic-plasticassumptions are employed with specific data used to specify hardening and/or softeningin regions past initial yield. Continuous bars were assumed to be elastic-perfectly-plastic.To include the effect of the lap splice, the yield stress and post-yield behavior of bars inthe splice region were adjusted, as previously described. Numerical values are given inTable 10. Note that softening is assumed to begin immediately upon yielding in the lapsplice region.
Table 10. Reinforcing steel properties
Continuous Reinforcing Lap SpliceE (ksi) 29,000 29,000σy (ksi) 52.0 50.4
50.4/0.48.0/0.007
Stress (ksi)/plastic strain Assumed perfectly plastic
10.0/0.015

27
4.1 Analysis and Results
Two models were developed and analyzed to determine the effect of mesh size. For thefirst model, denoted as coarse, eleven elements were used to represent the column. Thelength of the elements at the top and bottom were specified to match that of the plastichinge, computed earlier to be 5.8 inches. The other model, denoted as fine, wascomposed of twenty-two elements, evenly spaced along the column. All other aspects ofthe model were equivalent to the degrading hinge model. Figures 22 and 23 show thelayout of the models. Note that the Timoshenko beam elements have three nodes,resulting in a linear distribution of curvature.
Figure 22. Mesh layout of the coarse model

28
Figure 23. Mesh layout of the fine model
The axial compressive load was applied through a concentrated mass at the column topwhile lateral loading was applied via prescribed displacement. Because of the structureof the ABAQUS software, the mass was applied as an initial step and cyclic loading wasapplied with a number of independent steps in the push and then pull directions. For eachstep, the structure was loaded until a displacement of three inches was attained or a lackof convergence ended the solution. Curvature diagrams with exaggerated views of thedeformed shape at the latter stages of deformation for the coarse and fine models aregiven in Figures 24 and 25. The figures show that, as damage progresses, curvaturebecomes concentrated at the hinge locations at the top and bottom of the column. Thelength of the hinge is always that of a single element.

29
Figure 24. Curvature diagram and exaggerated deformed shape for the column; coarsemesh
Figure 25. Curvature diagram and exaggerated deformed shape for the column; finemesh
Comparisons of cyclic results for lateral load with those of the experiment are shown forboth models in Figures 26 and 27. The response of the fine model is similar to that of thecoarse model during the early stages of loading. However, with the formation of a plastichinge at the bottom, the solution quickly diverged due to the reduced hinge length. For

30
the coarse model, values for the moment at the bottom and top of the column are shownin Figures 28 and 29. A comparison of peak numerical values is given in Table 11.
-15
-10
-5
0
5
10
-4 -3 -2 -1 0 1 2 3 4
Displacement (inches)
Lat
eral
Fo
rce
(kip
s)
Fiber Beam Model (ABAQUS) Experimental Envelope
Figure 26. Hysteresis curve for the system; coarse model
-15
-10
-5
0
5
10
-4 -3 -2 -1 0 1 2 3 4
Displacement (inches)
Lat
eral
Fo
rce
(kip
s)
Fiber Beam Model (ABAQUS) Experimental Envelope
Figure 27. Hysteresis curve for the system; fine model
-400
-200
0
200
400
-4 -3 -2 -1 0 1 2 3 4
Displacement (inches)
Mo
men
t (k
ip-i
nch
es)
Fiber Beam Model (ABAQUS) Experimental Envelope
Figure 28. Hysteresis curve for bottom column moment; coarse model
31
-400-300-200-100
0
100200300400
-4.00E+00
-3.00E+00
-2.00E+00
-1.00E+00
0.00E+00
1.00E+00
2.00E+00
3.00E+00
4.00E+00
Displacement (inches)
Mo
men
t (k
ip-i
nch
es)
Fiber Beam Model (ABAQUS) Experimental Envelope
Figure 29. Hysteresis curve for top column moment; coarse model
Table 11. Comparison of peak numerical values for the coarse fiber beam model
ExperimentalValue
Value from PresentAnalysis
Ratio of Results
Peak Lateral Force(push) (kips)
8.1 8.83 1.09
Peak Top Moment(kip-inches)
348 330 0.95
Peak Bottom Moment(kip-inches)
326 324 0.99
33
5 Software for Nonlinear Three-DimensionalFinite Element Analysis
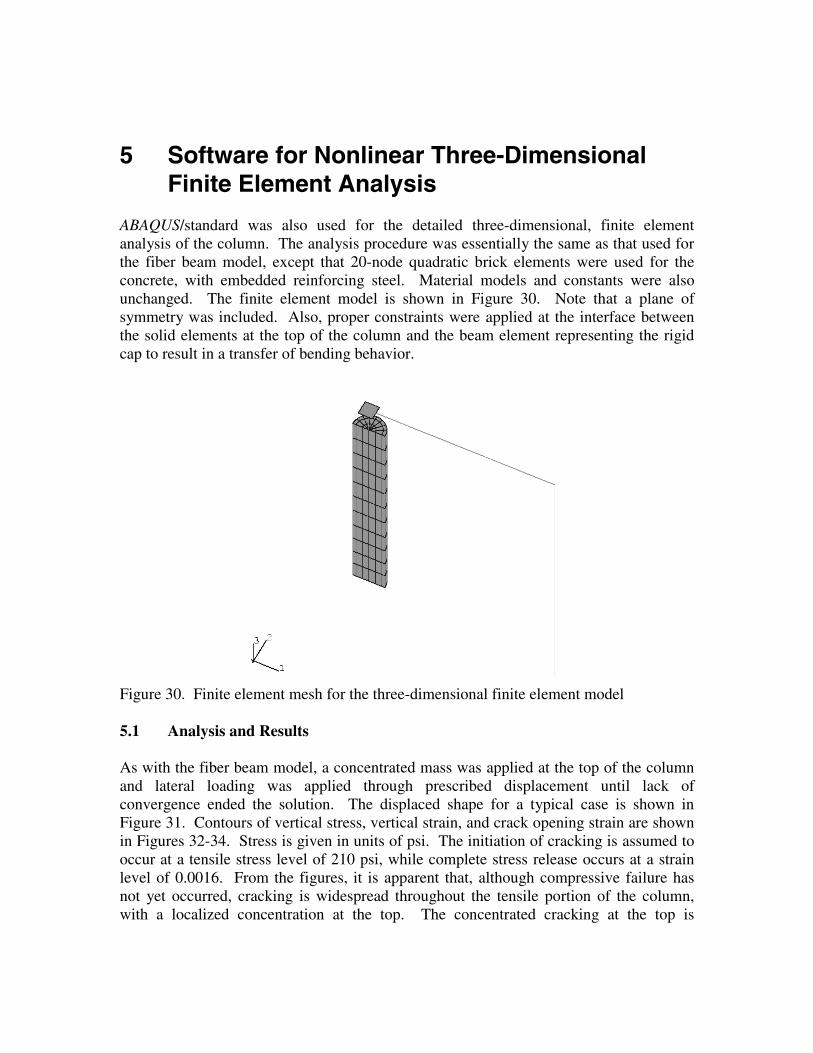
ABAQUS/standard was also used for the detailed three-dimensional, finite elementanalysis of the column. The analysis procedure was essentially the same as that used forthe fiber beam model, except that 20-node quadratic brick elements were used for theconcrete, with embedded reinforcing steel. Material models and constants were alsounchanged. The finite element model is shown in Figure 30. Note that a plane ofsymmetry was included. Also, proper constraints were applied at the interface betweenthe solid elements at the top of the column and the beam element representing the rigidcap to result in a transfer of bending behavior.
Figure 30. Finite element mesh for the three-dimensional finite element model
5.1 Analysis and Results
As with the fiber beam model, a concentrated mass was applied at the top of the columnand lateral loading was applied through prescribed displacement until lack ofconvergence ended the solution. The displaced shape for a typical case is shown inFigure 31. Contours of vertical stress, vertical strain, and crack opening strain are shownin Figures 32-34. Stress is given in units of psi. The initiation of cracking is assumed tooccur at a tensile stress level of 210 psi, while complete stress release occurs at a strainlevel of 0.0016. From the figures, it is apparent that, although compressive failure hasnot yet occurred, cracking is widespread throughout the tensile portion of the column,with a localized concentration at the top. The concentrated cracking at the top is

34
responsible for the nonconvergence that inhibited the ability of the model to continuesignificantly into the plastic range, as shown in Figure 35.
Figure 31. Deformed shape, three-dimensional finite element model
Figure 32. Contours of vertical stress

35
Figure 33. Contours of vertical strain
Figure 34. Contours of crack-opening strain

36
-10
-5
0
5
10
15
-4 -3 -2 -1 0 1 2 3 4
Displacement (inches)
Lat
eral
Fo
rce
(kip
s)
FE Model (ABAQUS) Experimental Envelope
Figure 35. System behavior, three-dimensional finite element model
As with previous models, Figure 35 shows that the column has an initial stiffness that issomewhat higher than that observed experimentally. With the fiber beam model,however, the stiffness for subsequent cycles compared quite well, suggesting that thestiffness of the actual column is significantly affected by initial cracking. For monotonicloading, the stiffness of all three models compared closely, as shown in Figure 36.
-15
-10
-5
0
5
10
15
-3 -2 -1 0 1
Displacement (inches)
Lat
eral
Fo
rce
(kip
s)
Degrading Hinge Model (NEABS)
Fiber Beam Model (ABAQUS)
FE Model (ABAQUS)
Figure 36. A comparison of system stiffness for all models

37
6 Discussion and Conclusions
For the work of this report, a benchmark reinforced concrete column test for cyclicbehavior was analyzed using existing software and techniques to determine their abilityto obtain reasonable numerical simulations. A model based on classical frame elementswith degrading hinges, one based on Timoshenko beam elements and fiber concepts forapplying material behavior, and a detailed three-dimensional finite element model wereconsidered. For each analysis, common engineering practice was used to obtain therequired input data, based solely on cylinder strength information for concrete andcoupon tests for steel. In general, the results were quite accurate for all methods, withvarying degrees of robustness, as described below.
6.1 Degrading Hinge Model
This was the simplest model, but it required the most effort to obtain input data, usingseparate software and engineering assumptions to define moment-curvature andhysteretic behavior for the plastic hinges. However, the solution was accurate and quiterobust as long as the hinge has the ability to degrade.
6.2 Fiber Beam Model
The input for this model was more basic than that of the degrading hinge model in that itconsisted mainly of material information. Although the material model is rathercomplex, the use of default values for most input items led to reasonable results. Aquadratic Timoshenko beam element was chosen, which resulted in a linear variation ofcurvature along the length of the element and included shear deformation, both of whichseemed significant. As with many applications in finite element analysis dealing withfailure, the results were mesh dependent. However, with an appropriate estimate of theplastic hinge length in the column, results were obtained that were quite accurate.
The initial stiffness of the column model was significantly higher than that observedexperimentally, but after the occurrence of cracking during the first cycle, they were quiteclose. Thus, a reduction of initial section properties to consider residual cracking isprobably in order, particularly for elastic analysis. Often, analysts choose to use half ofthe gross moment of inertia for the section.
The force, displacement, and moment results from this model were quite close to thoseobtained experimentally. In addition, the solution was efficient and relatively robust.
6.3 Three-Dimensional Finite Element Model
Although the effort for model development and the computer requirements for this modelwere much greater than for the others, detailed output information regarding stress and

38
strain distribution, along with cracking, is available. However, the solution did notconverge beyond initial cracking, rendering it useless for evaluating hysteretic behaviorthat involves gross yielding of reinforcement or crushing of concrete.
6.4 Conclusions
Only a single structure was analyzed for the work of this report using three specificprograms, and any conclusions that are drawn are not necessarily universal. However,the following may be surmised:
1. The degrading hinge model is the simplest and most robust of the threeconsidered, making it the most practical for the analysis of large structures.Although it was not the best performer, the results from the model werereasonably accurate as long as the hinge model includes the effect of axialforce in the column and degradation, and as long as care is taken in definingyield properties, hysteretic behavior, and hinge length.
2. The fiber beam model was the best overall performer with regard to accuracy,but it was not as robust as the degrading hinge model. In addition, thesolution was sensitive to the degree of mesh refinement.
3. The three-dimensional finite element model was unable to provide usableresults due to numerical difficulties. Other material models and crackalgorithms may offer improved performance, but the computational power andmodeling effort required make this approach impractical for anything beyonddetailed component analysis.
In conclusion, reasonable engineering solutions for the cyclic behavior of reinforcedconcrete structures appear attainable with existing techniques as long as the analystunderstands the assumptions and limitations inherent in them and takes proper care indeveloping the input data and interpreting the results.

39
References
ABAQUS/standard user’s manual. Version 5.8. 1998. Pawtucket, RI: Hibbitt, Karlsson,and Sorensen, Inc.
Chai, Y. H., M. J. N. Priestley, and F. Seible 1991. Flexural retrofit of circular reinforcedconcrete bridge columns by steel jacketing. Report no. SSRP 91/06. October. SanDiego, Calif.: Structural Systems Research Project, University of California.
Cofer, W. F., Y. Zhang, and D. I. McLean. 1997. Analytical evaluation of retrofitstrategies for multi-column bridges. Final technical report no. WA-RD 427.1,June. [Olympia]:Washington State Department of Transportation.
Imbsen, R., R. V. Nutt, and J. Penzien. 1978. Seismic response of bridges — CaseStudies. Report no. FHWA-RD-78-157. Berkeley, Calif.: EarthquakeEngineering Research Center, University of California.
Imbsen, R., and J. Penzien. 1986. Evaluation of energy absorption characteristics ofhighway bridges under seismic conditions. Volume I, UCB/EERC-84/17,September. Berkeley, Calif.: Earthquake Engineering Research Center, Universityof California..
Jaradat, O. A., D. I. McLean, and M. L. Marsh. 1998. Performance of existing bridgecolumns under cyclic loading — Part I: Experimental results and observedbehavior. ACI Structural Journal. 95(6): 695–704.
Kawashima, K. and J. Penzien 1976. Correlative investigations on theoretical andexperimental dynamic behavior of a model bridge structure. Report no. FHWA-RD-77-57. Berkeley, Calif.: Earthquake Engineering Research Center, Universityof California.
McGuire, J. W., W. F. Cofer, D. I. McLean, and M L. Marsh 1994. Analytical modelingof spread footing foundations for seismic analysis of bridges. TransportationResearch Record 1447: 80–92. TRB.
Park, R. and T. Paulay (1975). Reinforced Concrete Structures, John Wiley and Sons,New York.
Priestley, M.J.N., F. Seible, and Y. H. Chai (1992). “Design Guidelines for AssessmentRetrofit and Repair of Bridges for Seismic Performance,” Report No. SSRP-92/01, Department of Applied Mechanics and Engineering Sciences, Universityof California, San Diego, California 266.
Priestley, M. J. N., and F. Seible (1994). “Seismic Assessment of Existing Bridges,”Seismic Design and Retrofitting of Reinforced Concrete Bridges, Proceedings ofthe Second International Workshop, Queenstown, New Zealand, August, 1994,pp. 447-471.
Tseng, W. and J. Penzien (1973). “Analytical Investigations of the Seismic Response ofLong Multiple-Span Highway Bridges,” Earthquake Engineering ResearchCenter, University of California, Berkeley, CA.
Zhang, Y. (1996). “Analytical Evaluation of Retrofit Strategies for Multi-ColumnBridges,” Ph.D. Dissertation, Department of Civil and EnvironmentalEngineering, Washington State University, Pullman, WA, USA.
Zhang, Y., Cofer, W. F., and McLean, D. I. (1999). “Analytical Evaluation of RetrofitStrategies for Multi-Column Bridges,” Journal of Bridge Engineering, Vol. 4, No.2, pp. 143-150.

40
PEER REPORTS
PEER reports are available from the National Information Service for EarthquakeEngineering (NISEE) and from the National Technical Information Service (NTIS). Toorder PEER reports, please contact the Pacific Earthquake Engineering ResearchCenter, 1301 South 46th Street, Richmond, California 94804-4698. Tel.: (510) 231-9468;Fax: (510) 231-9461.
PEER 1999/07 Documentation of Strengths and Weaknesses of Current ComputerAnalysis Methods for Seismic Performance of Reinforced ConcreteMembers. William F. Cofer. November 1999. $15.00
PEER 1999/06 Rocking Response and Overturning of Anchored Equipment underSeismic Excitations. Nicos Makris and Jian Zhang. November 1999.$15.00
PEER 1999/05 Seismic Evaluation of 550 kV Porcelain Transformer Bushings. AmirS. Gilani, Andrew S. Whittaker, Gregory L. Fenves, Eric Fujisaki.October 1999. $15.00
PEER 1999/04 Adoption and Enforcement of Earthquake Risk-Reduction Measures.Peter J. May, Raymond J. Burby, T. Jens Feeley, and Robert Wood.$15.00
PEER 1999/03 Task 3 Characterization of Site Response General Site Categories.Adrian Rodriguez-Marek, Jonathan D. Bray, and NormanAbrahamson. February 1999. $20.00
PEER 1999/02 Capacity-Demand-Diagram Methods for Estimating SeismicDeformation of Inelastic Structures: SDF Systems. Anil K. Chopra andRakesh Goel. April 1999. $15.00
PEER 1999/01 Interaction in Interconnected Electrical Substation EquipmentSubjected to Earthquake Ground Motions. Armen Der Kiureghian,Jerome L. Sackman, and Kee-Jeung Hong. February 1999. $20.00
PEER 1998/08 Behavior and Failure Analysis of a Multiple-Frame Highway Bridge inthe 1994 Northridge Earthquake. Gregory L. Fenves and MichaelEllery. December 1998. $20.00
PEER 1998/07 Empirical Evaluation of Inertial Soil-Structure Interaction Effects.Jonathan P. Stewart, Raymond B. Seed, and Gregory L. Fenves.November 1998. $26.00
PEER 1998/06 Effect of Damping Mechanisms on the Response of Seismic IsolatedStructures. Nicos Makris and Shih-Po Chang. November 1998.$15.00

41
PEER 1998/05 Rocking Response and Overturning of Equipment under HorizontalPulse-Type Motions. Nicos Makris and Yiannis Roussos, October1998. $15.00
PEER 1998/04 Pacific Earthquake Engineering Research Invitational WorkshopProceedings, May 14–15, 1998: Defining the Links Between Planning,Policy Analysis, Economics and Earthquake Engineering. MaryComerio and Peter Gordon. September 1998. $15.00
PEER 1998/03 Repair/Upgrade Procedures for Welded Beam to ColumnConnections. James C. Anderson and Xiaojing Duan, May 1998.$33.00
PEER 1998/02 Seismic Evaluation of 196 kV Porcelain Transformer Bushings. AmirS. Gilani, Juan W. Chavez, Gregory L. Fenves, and Andrew S.Whittaker, May 1998. $20.00
PEER 1998/01 Unassigned.