pacific northwest climate model scenarios 2008 climate impacts group & department of atmospheric...
Post on 21-Dec-2015
214 views
TRANSCRIPT
Pacific NorthwestClimate Model Scenarios 2008
Pacific NorthwestClimate Model Scenarios 2008
Climate Impacts Group&
Department of Atmospheric SciencesUniversity of Washington
Eric Salathé Philip Mote
Valérie DulièreEmily Jump
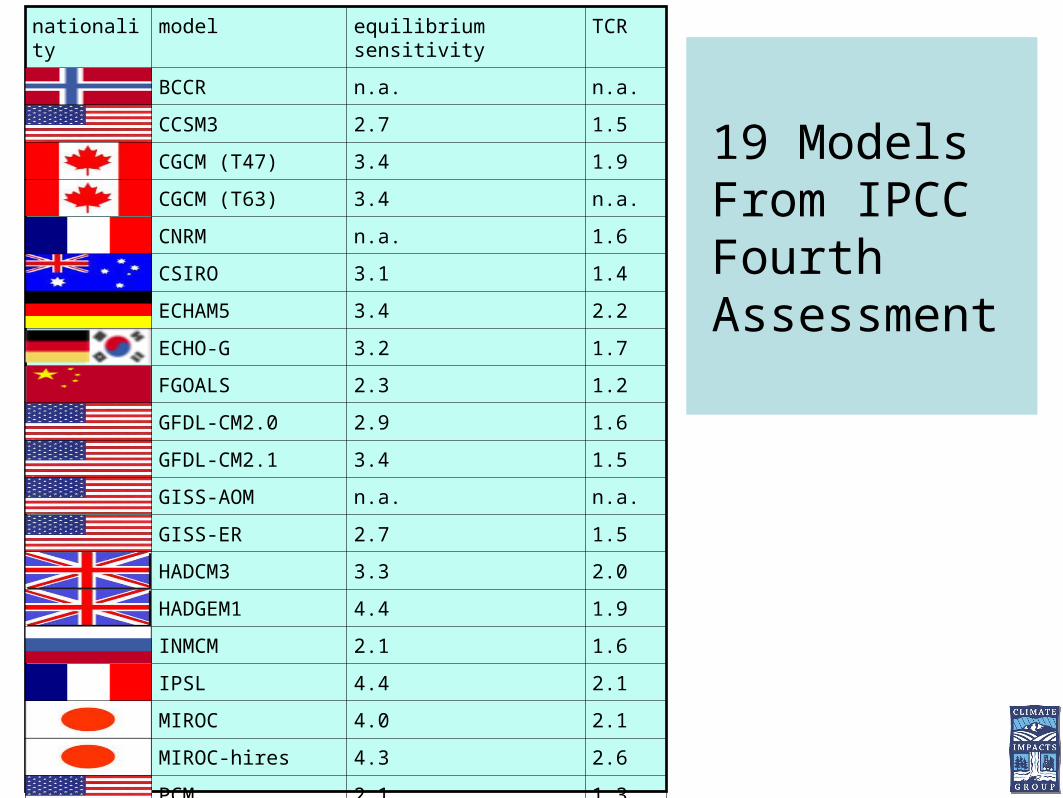
19 ModelsFrom IPCCFourth Assessment
nationality model equilibrium sensitivity
TCR
BCCR n.a. n.a.
CCSM3 2.7 1.5
CGCM (T47) 3.4 1.9
CGCM (T63) 3.4 n.a.
CNRM n.a. 1.6
CSIRO 3.1 1.4
ECHAM5 3.4 2.2
ECHO-G 3.2 1.7
FGOALS 2.3 1.2
GFDL-CM2.0 2.9 1.6
GFDL-CM2.1 3.4 1.5
GISS-AOM n.a. n.a.
GISS-ER 2.7 1.5
HADCM3 3.3 2.0
HADGEM1 4.4 1.9
INMCM 2.1 1.6
IPSL 4.4 2.1
MIROC 4.0 2.1
MIROC-hires 4.3 2.6
PCM 2.1 1.3
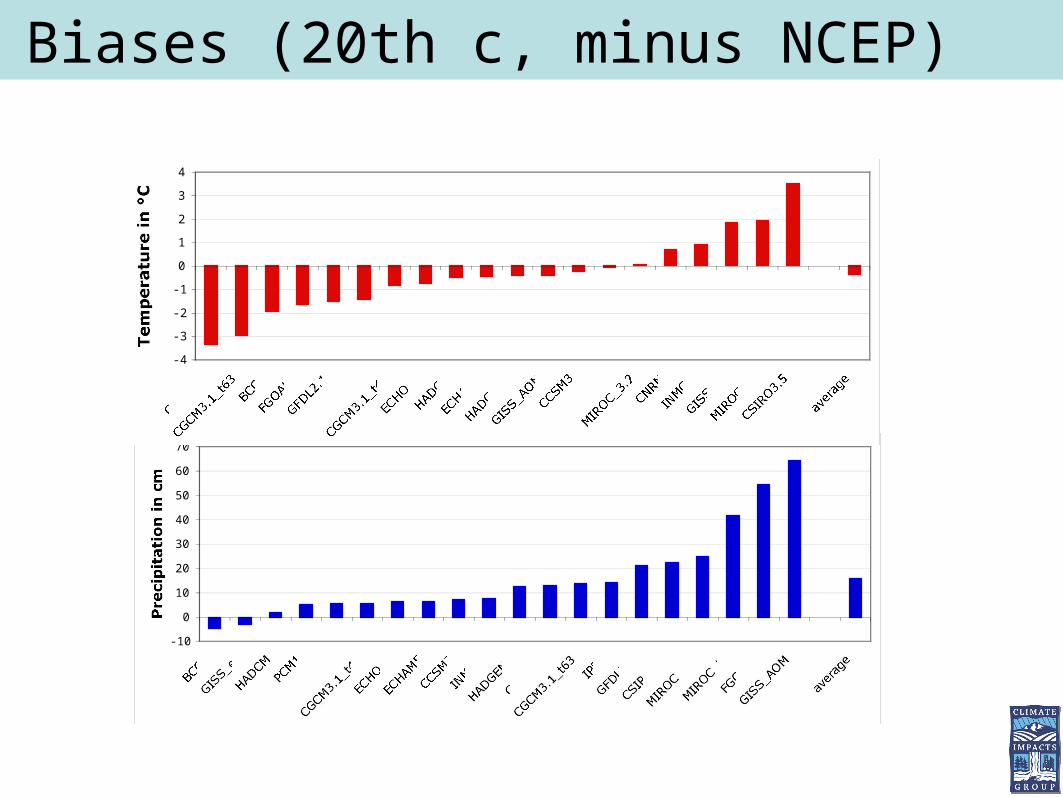
Biases (20th c, minus NCEP)
-10
0
10
20
30
40
50
60
70
GCMs
-4
-3
-2
-1
0
1
2
3
4
GCMs
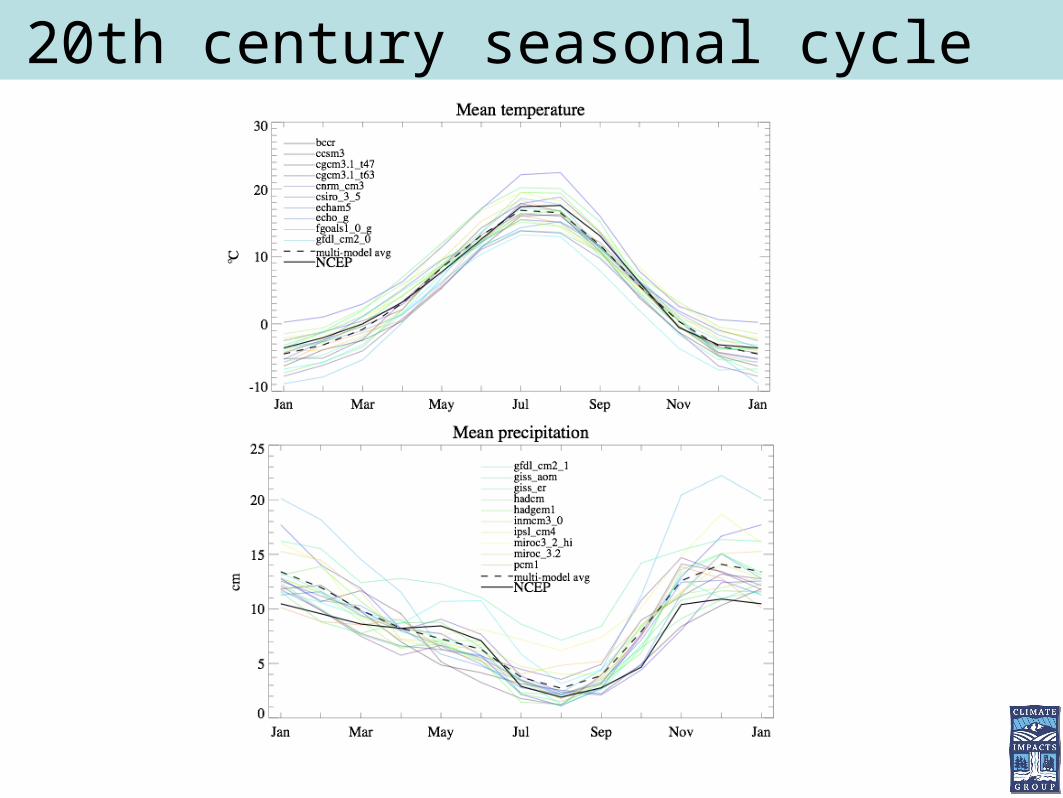
20th century seasonal cycle
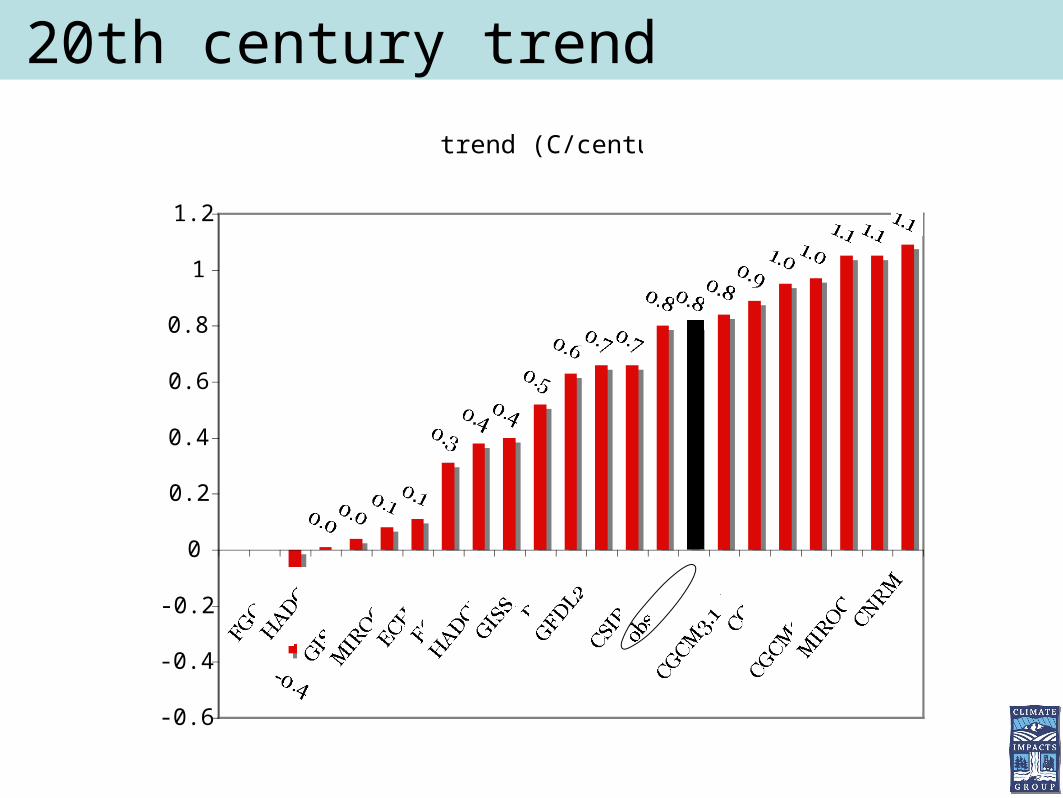
20th century trend
trend (C/century)
-0.4
0.00.00.10.1
0.30.40.4
0.5
0.60.70.7
0.80.80.80.9
1.01.01.11.11.1
-0.6
-0.4
-0.2
0
0.2
0.4
0.6
0.8
1
1.2
FGOALSHADCMBCCR
GISS_AOMMIROC_3.2ECHAM5ECHO_g
HADGEM1GISS_er
PCM1GFDL2.1
IPSL
CSIRO3.5observedGFDL2.0
CGCM3.1_t63
CCSM3INMCM
CGCM3.1_t47MIROC_hi
CNRM
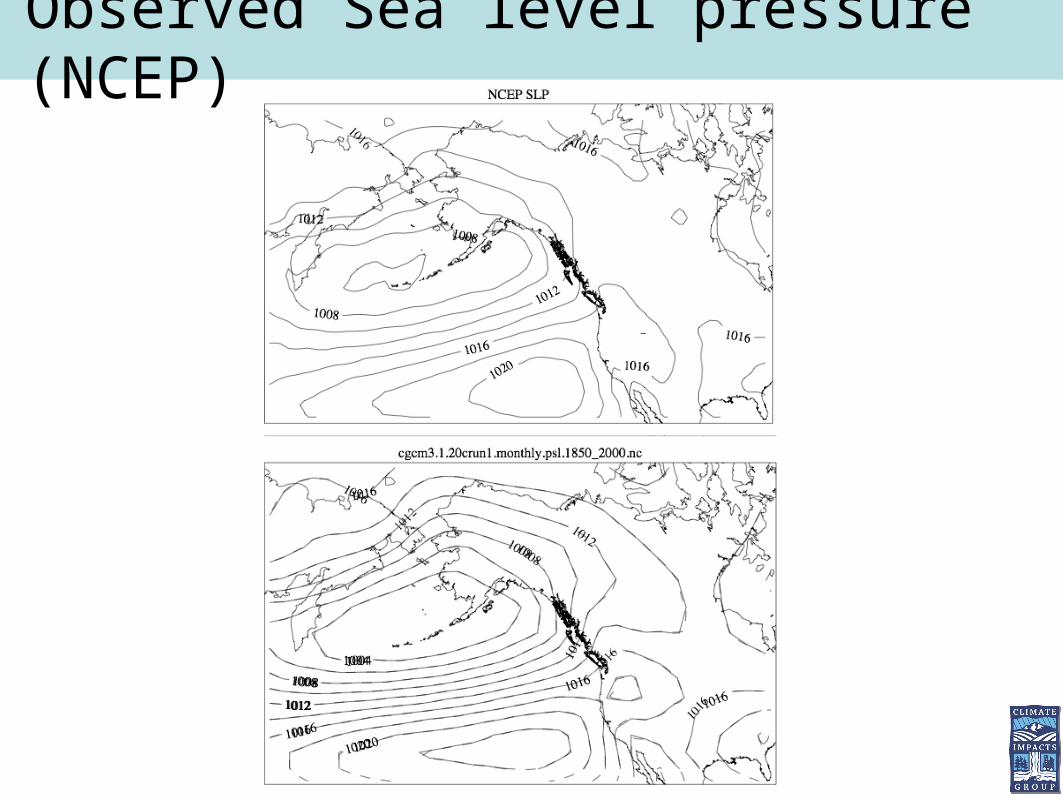
Observed Sea level pressure (NCEP)
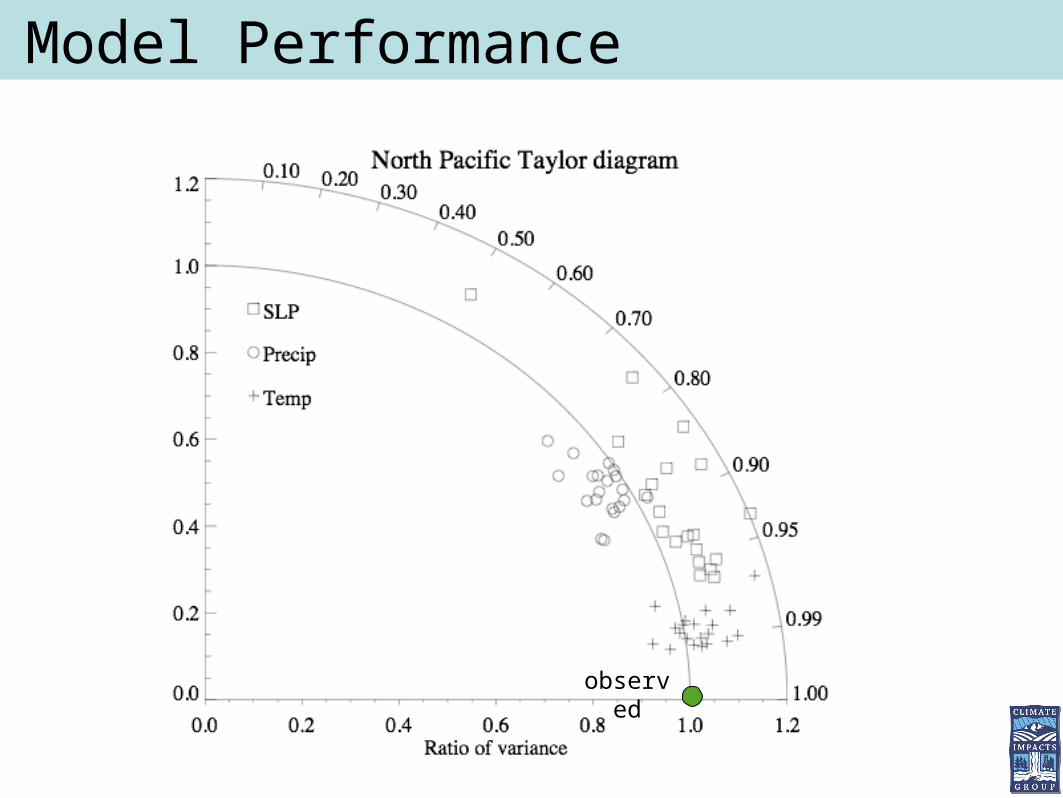
Model Performance
observed
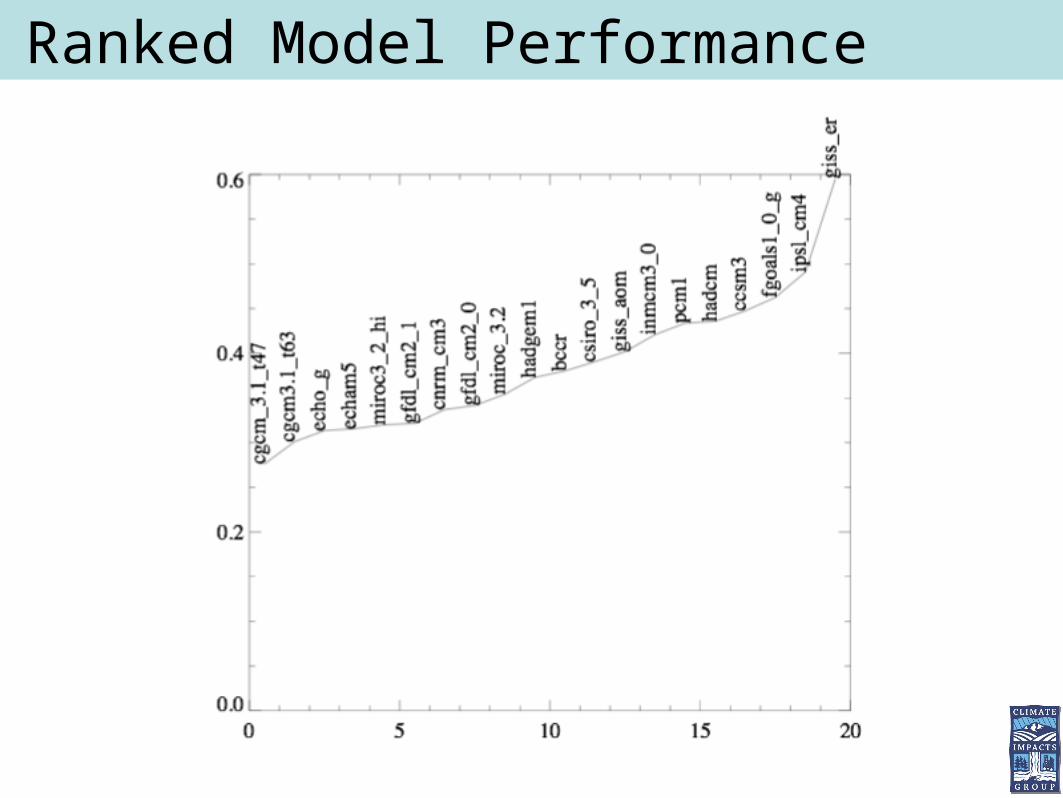
Ranked Model Performance
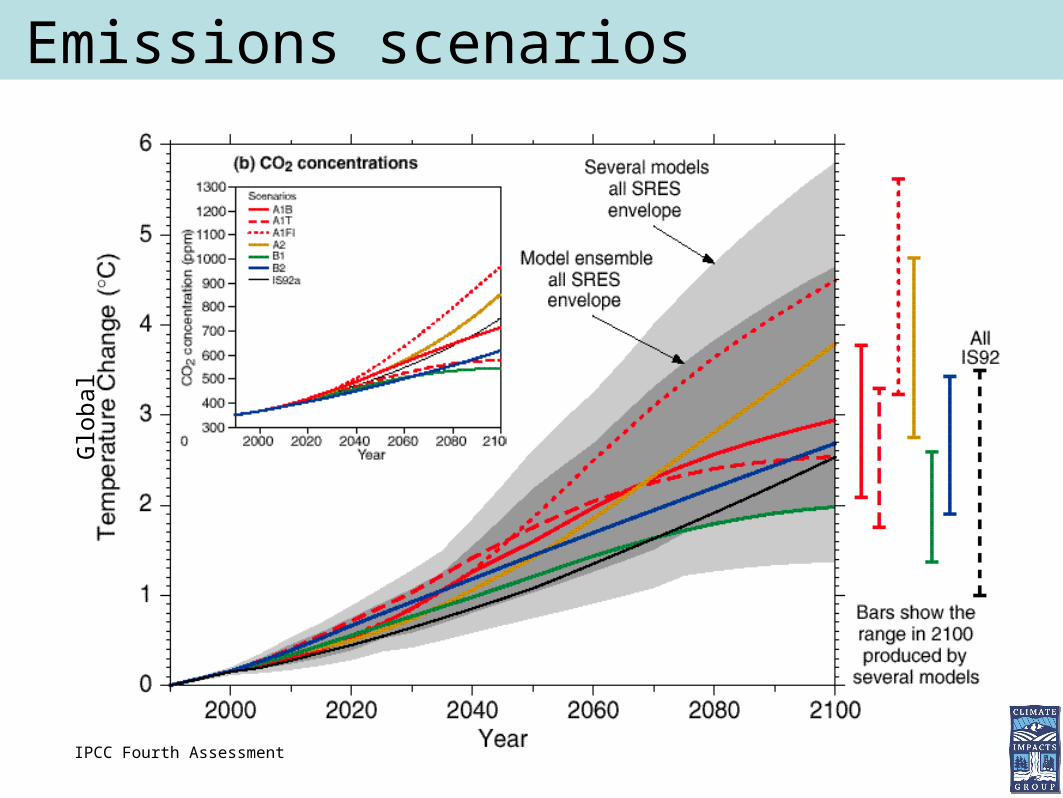
Emissions scenarios
IPCC Fourth Assessment
Glo
bal
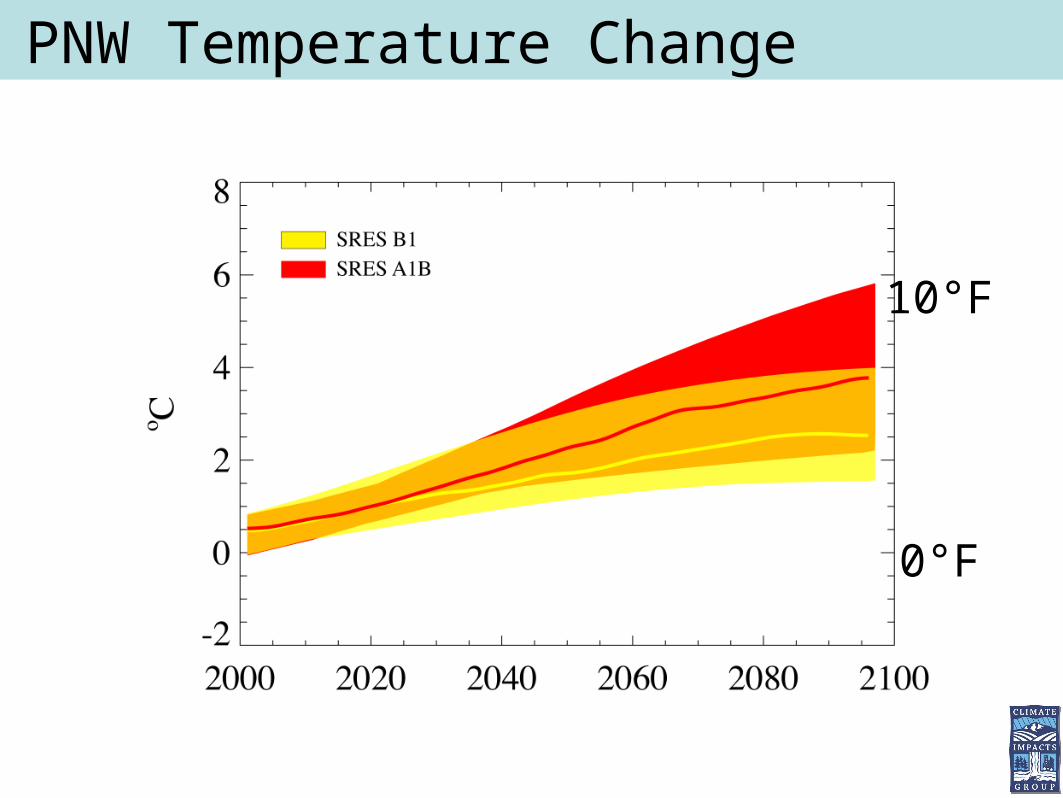
PNW Temperature Change
10°F
0°F
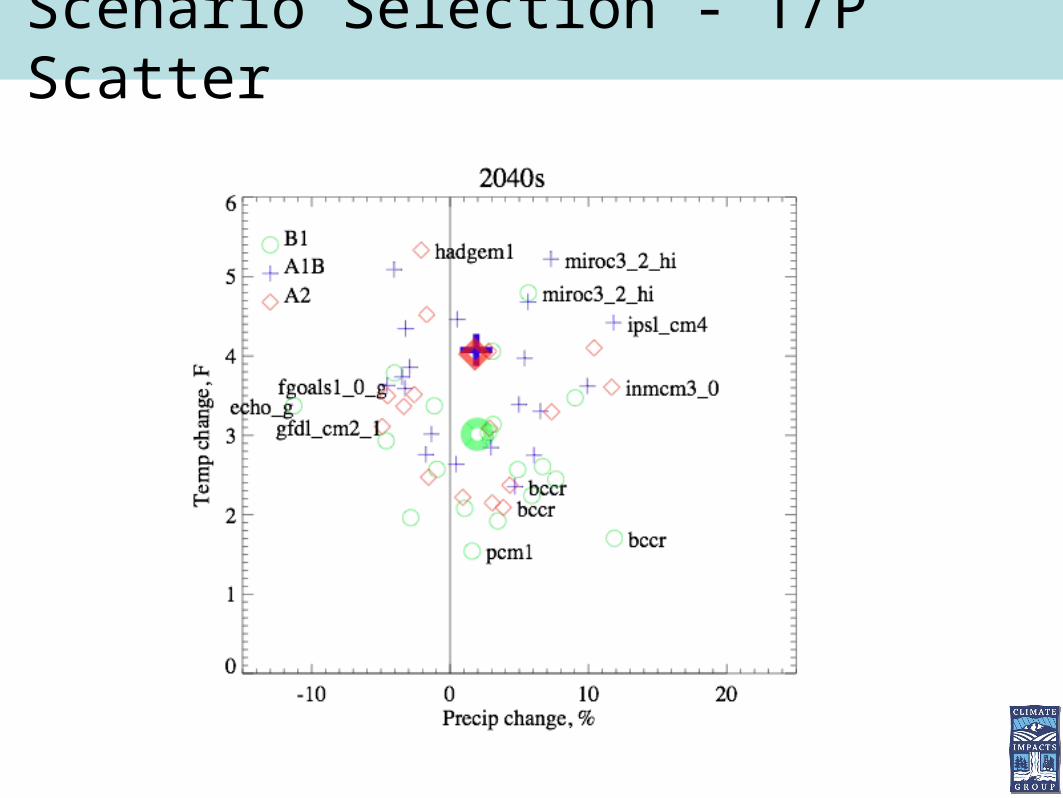
Scenario Selection - T/P Scatter
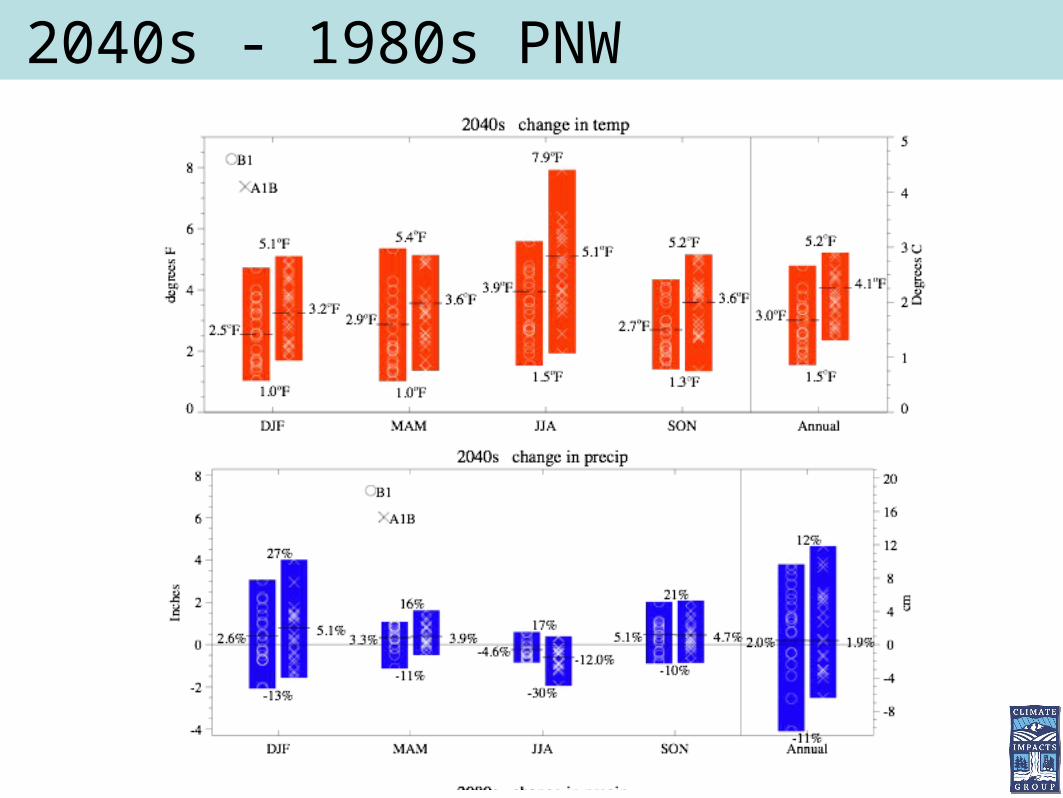
2040s - 1980s PNW
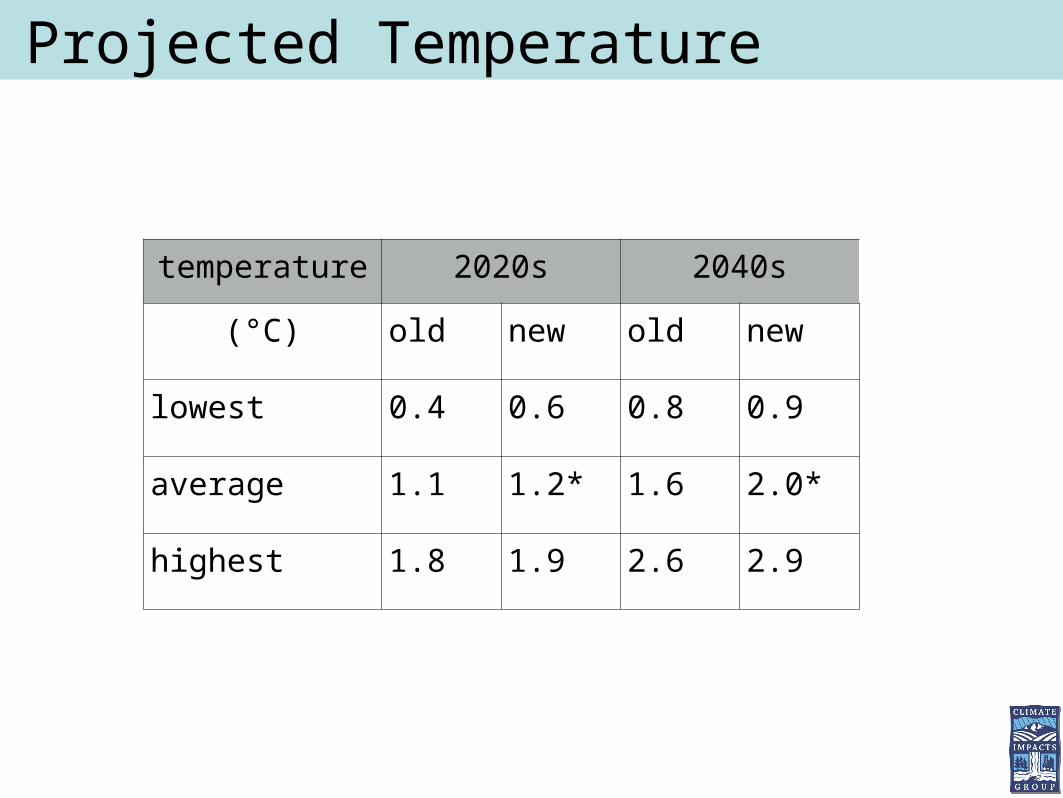
Projected Temperature
temperature 2020s 2040s
(°C) old new old new
lowest 0.4 0.6 0.8 0.9
average 1.1 1.2* 1.6 2.0*
highest 1.8 1.9 2.6 2.9
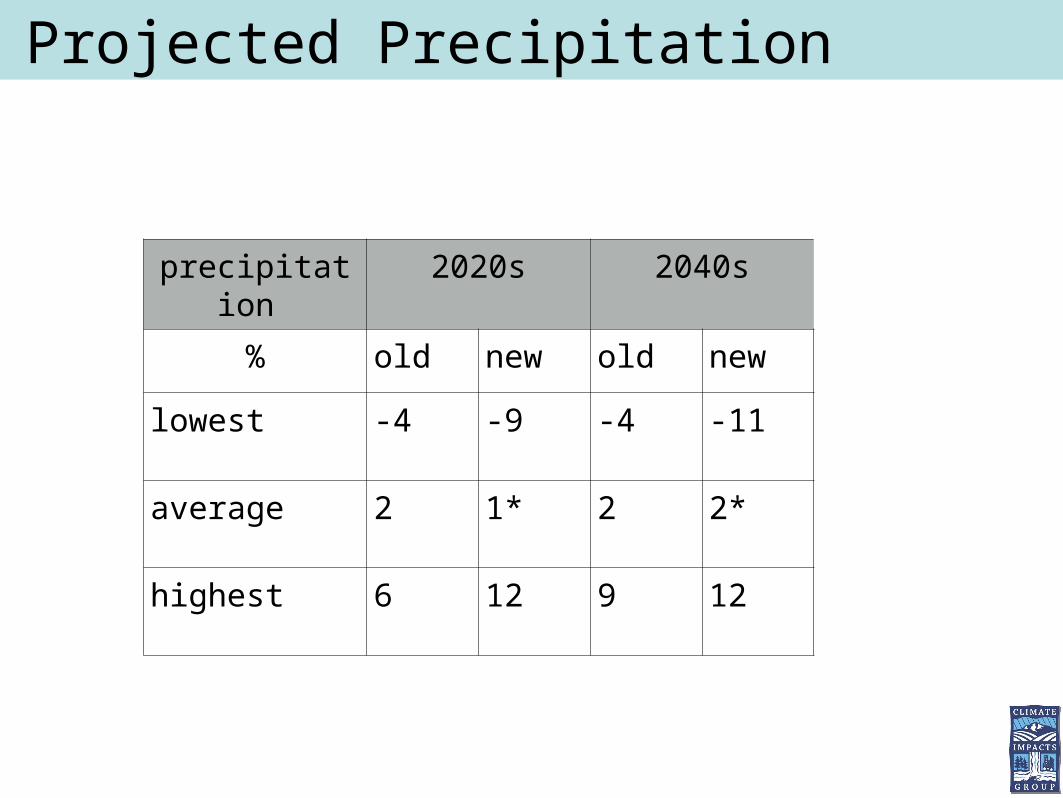
Projected Precipitation
precipitation 2020s 2040s
% old new old new
lowest -4 -9 -4 -11
average 2 1* 2 2*
highest 6 12 9 12
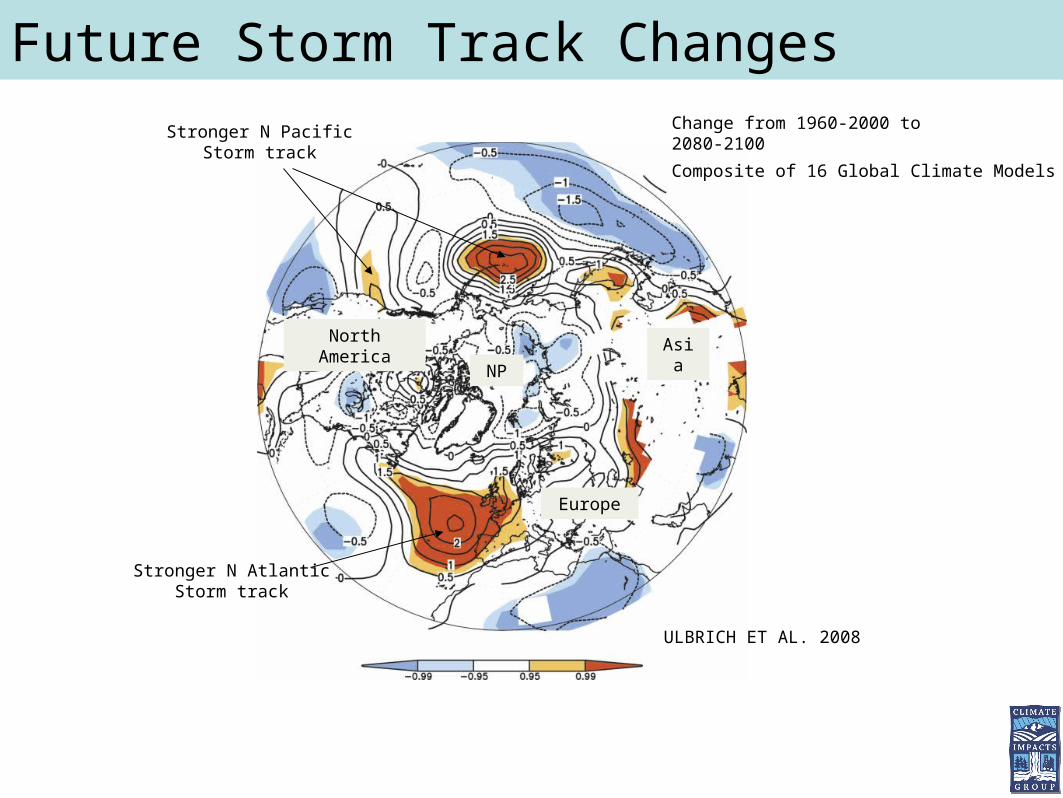
Future Storm Track Changes
North America Asia
Europe
NP
Stronger N AtlanticStorm track
Stronger N PacificStorm track
ULBRICH ET AL. 2008
Change from 1960-2000 to2080-2100
Composite of 16 Global Climate Models
-20
-10
0
10
20
30
40
50
60
70
1 2 3 4 5 6 7 8 9 10 11 12 13 14 15 16 17 18 19 20
Grid cell
Percentage of change
-30
-20
-10
0
10
20
30
40
1 2 3 4 5 6 7 8 9 10 11 12 13 14 15 16 17 18 19 20
Grid cell
Percentage of change
IPSL
-20
-10
0
10
20
30
40
50
1 3 5 7 9 11 13 15 17 19 21 23 25 27 29 31 33 35 37 39 41 43 45 47
Grid cell
Percentage of change
-5
0
5
10
15
20
25
30
35
1 3 5 7 9 11 13 15 17 19 21 23 25 27 29 31 33 35 37 39 41 43 45 47
Grid cell
Percentage of change
ECHAM5
SRES A1B SRES B1
-20
-10
0
10
20
30
40
50
60
1 4 7 10 13 16 19 22 25 28 31 34 37 40 43 46 49 52 55 58 61 64 67 70 73 76 79 82 85 88
Grid cell
Percentage of change
CCSM3
-20
-10
0
10
20
30
40
1 4 7 10 13 16 19 22 25 28 31 34 37 40 43 46 49 52 55 58 61 64 67 70 73 76 79 82 85 88
Grid cell
Percentage of change
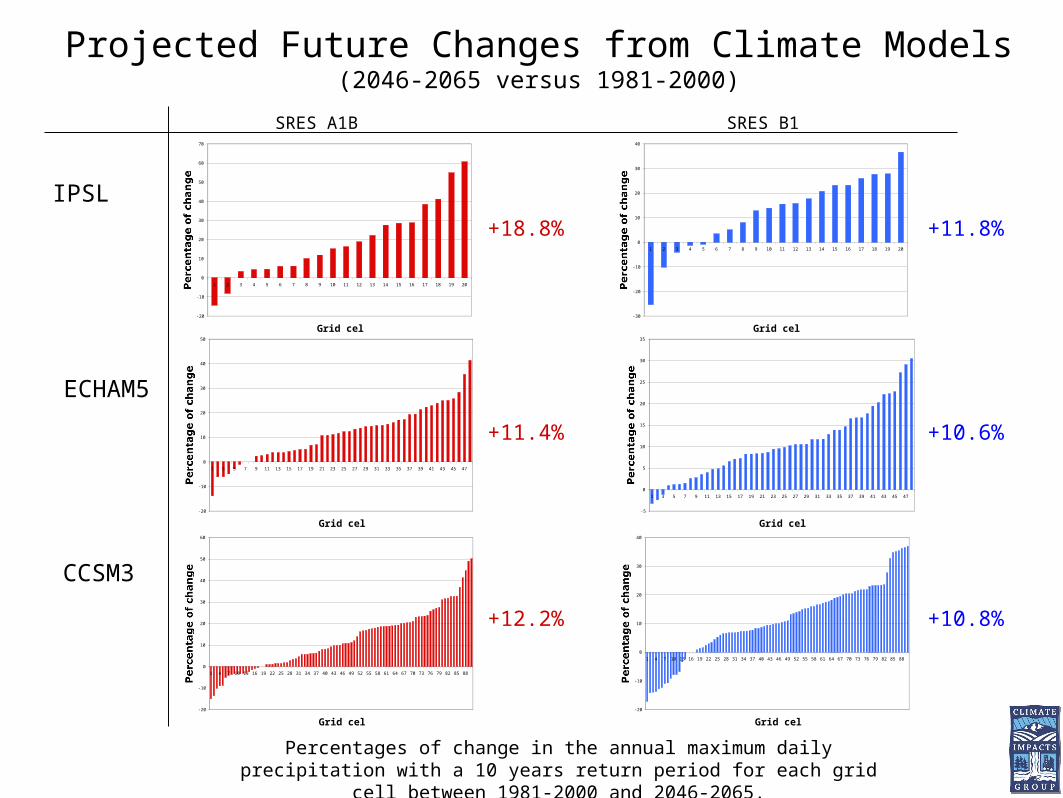
Percentages of change in the annual maximum daily precipitation with a 10 years return period for each grid cell between 1981-2000 and 2046-2065.
+12.2%
+18.8%
+11.4%
+10.8%
+11.8%
+10.6%
Projected Future Changes from Climate Models(2046-2065 versus 1981-2000)
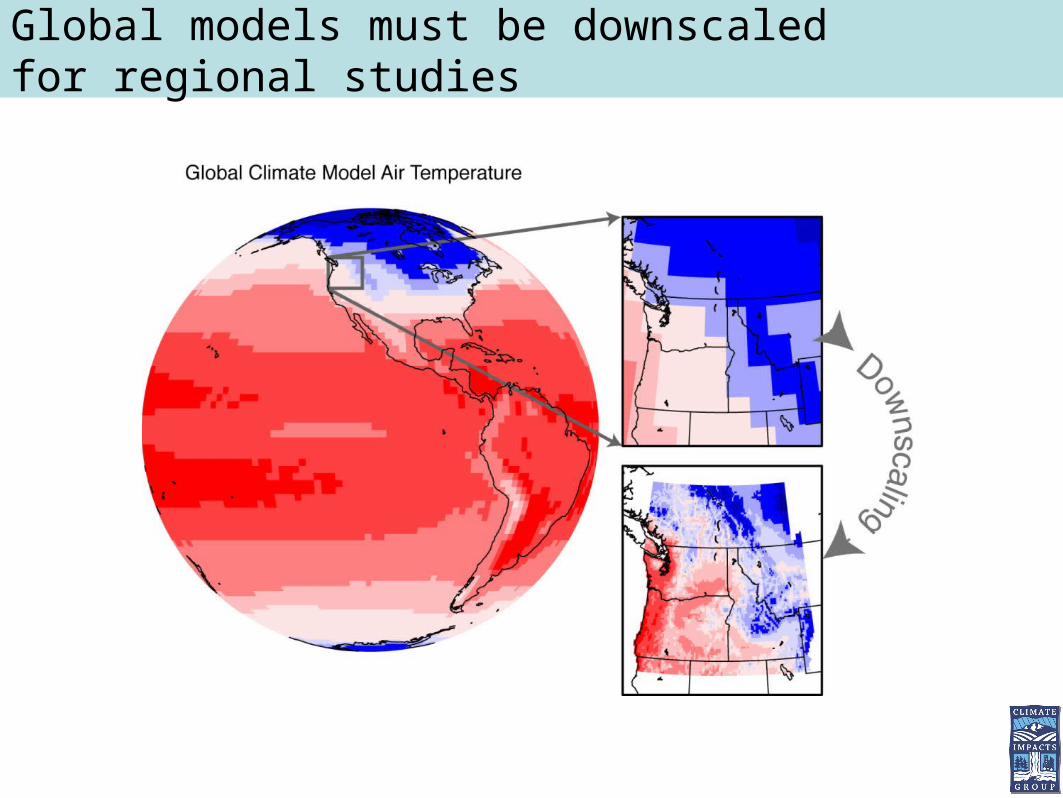
Global models must be downscaled for regional studies
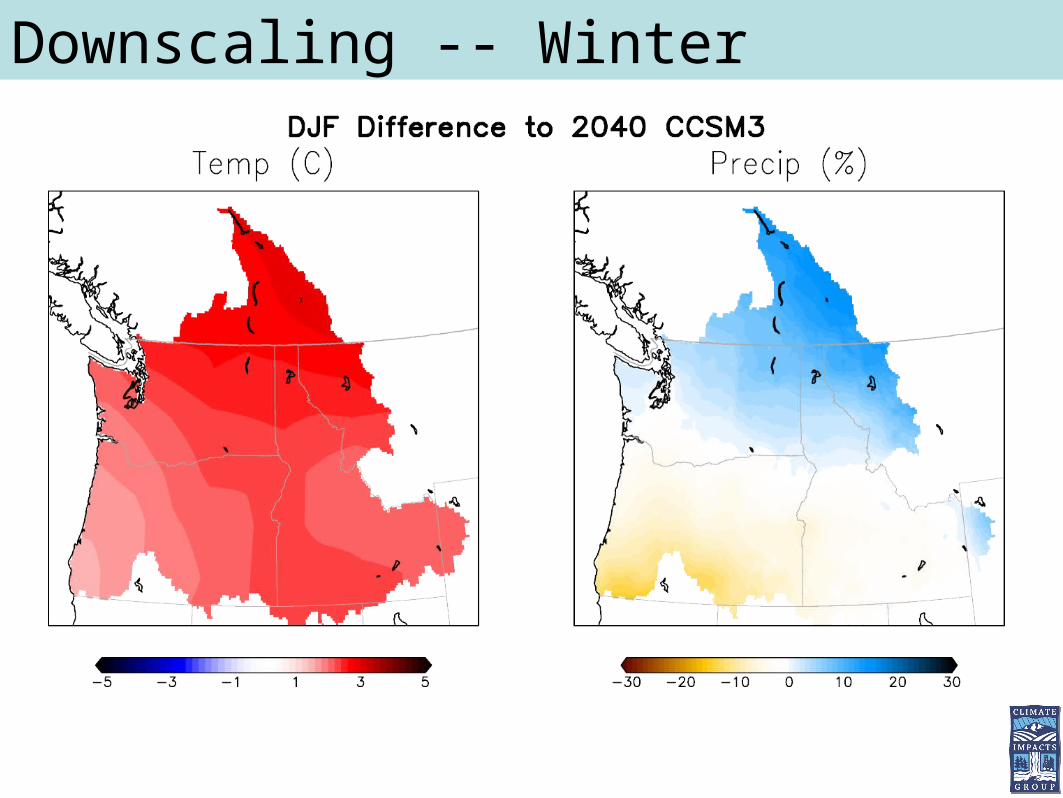
Downscaling -- Winter
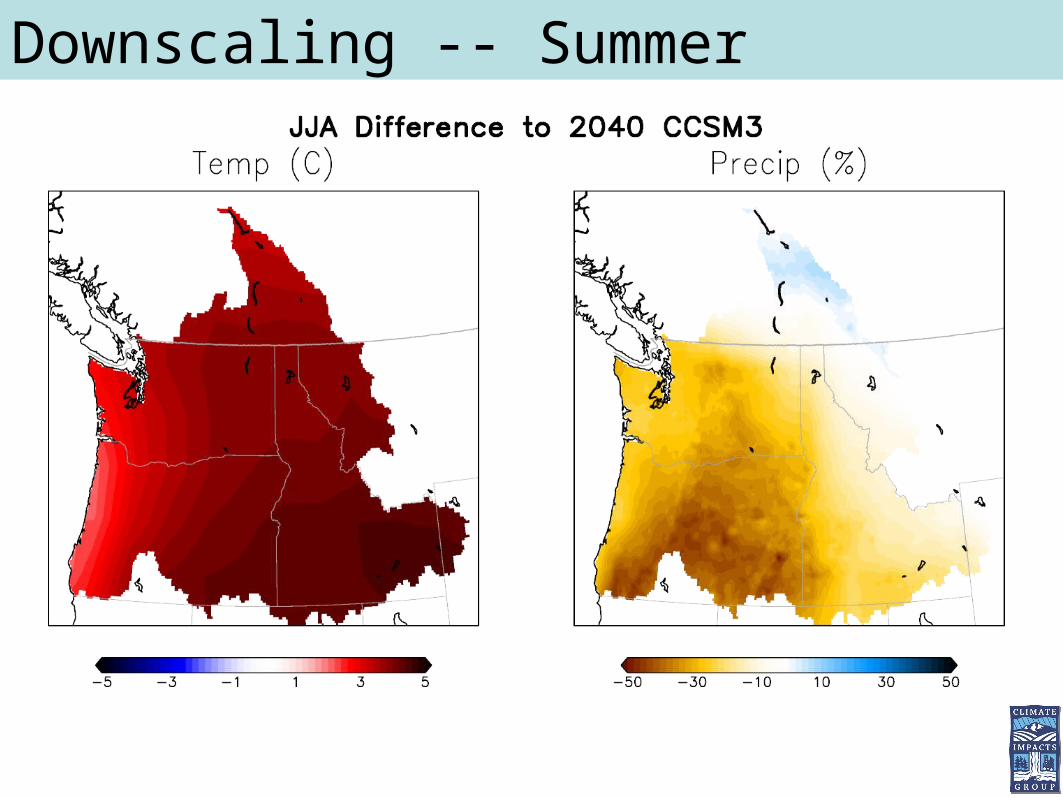
Downscaling -- Summer
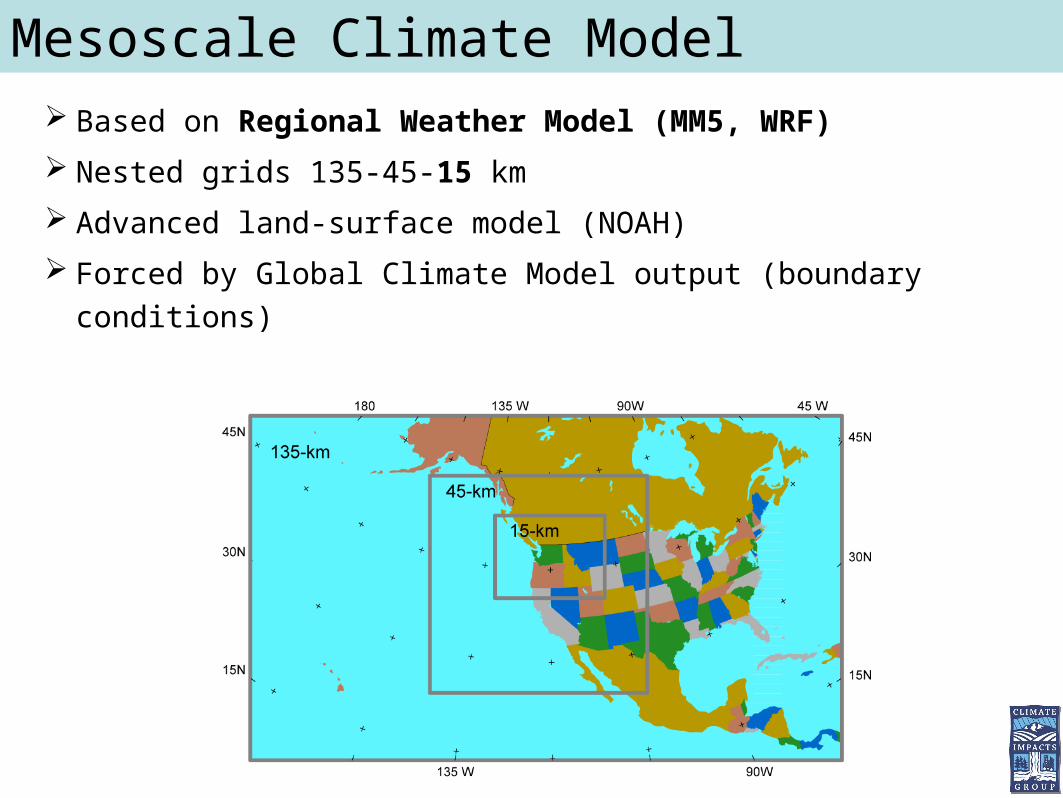
Mesoscale Climate Model Based on Regional Weather Model (MM5, WRF)
Nested grids 135-45-15 km
Advanced land-surface model (NOAH)
Forced by Global Climate Model output (boundary conditions)
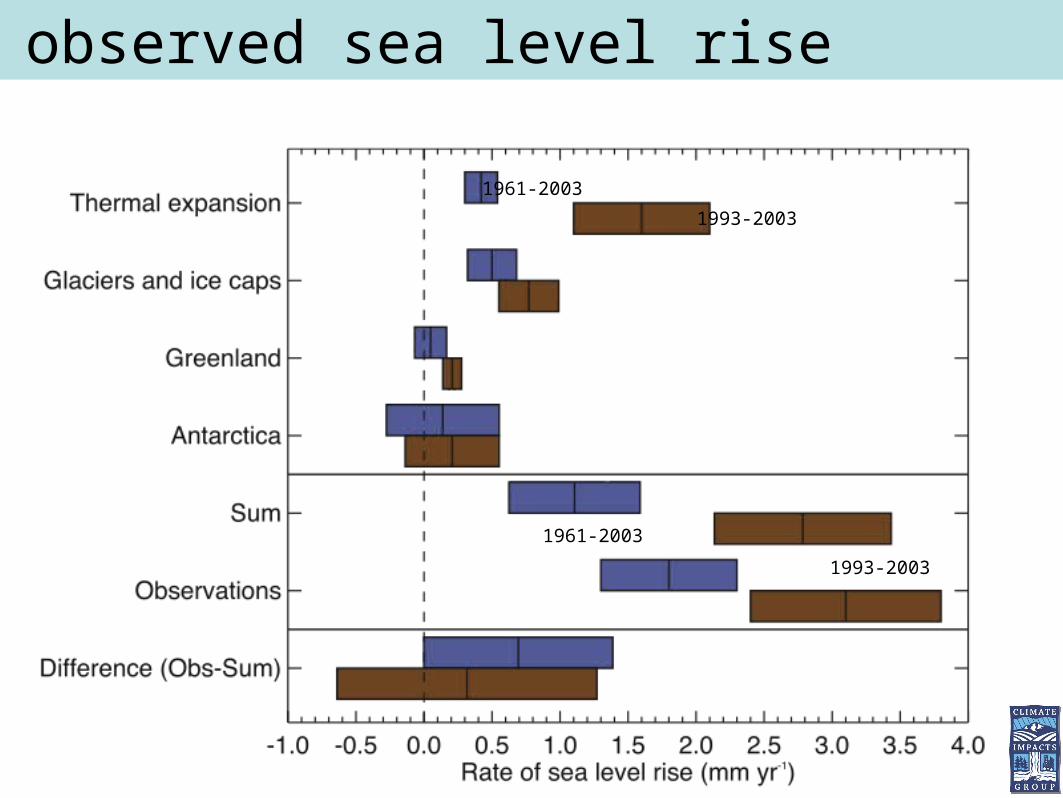
observed sea level rise
1961-2003
1993-2003
1961-2003
1993-2003
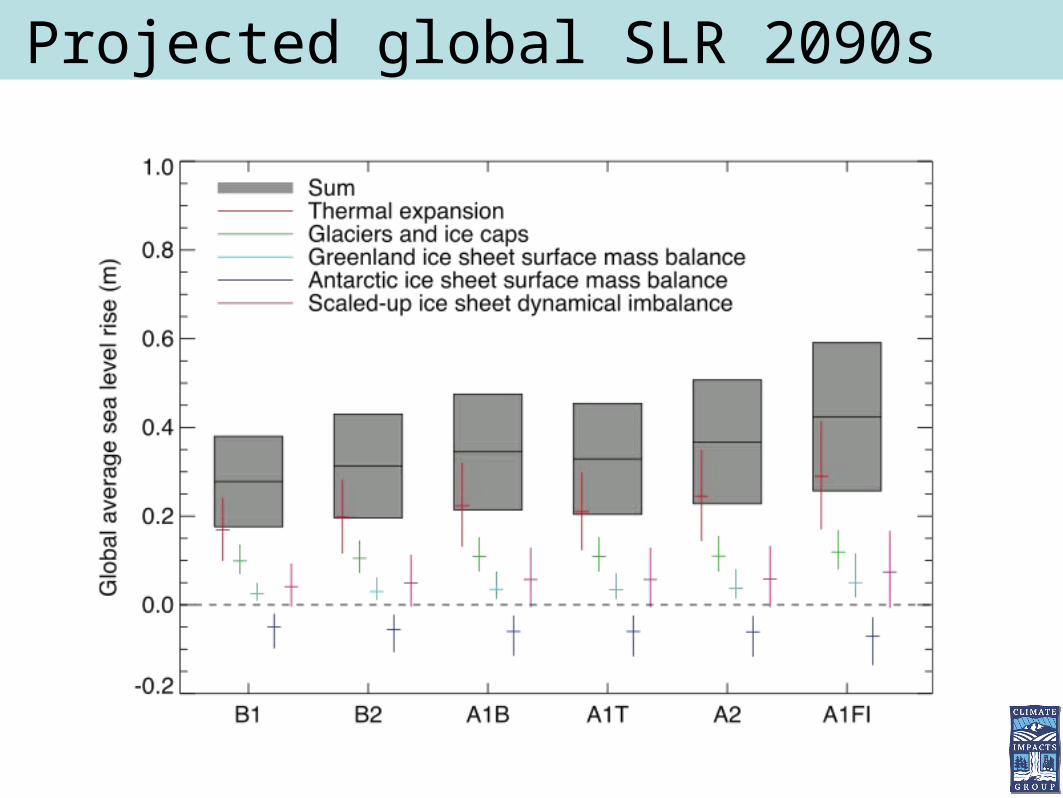
Projected global SLR 2090s
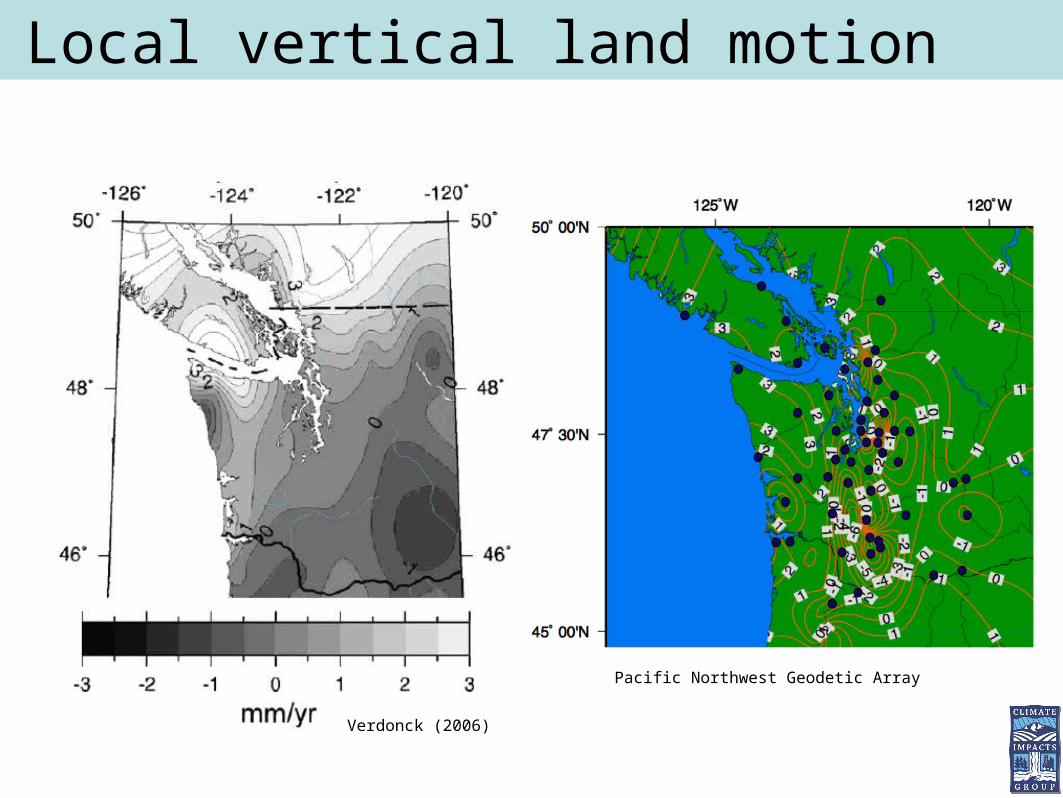
Local vertical land motion
Verdonck (2006)
Pacific Northwest Geodetic Array
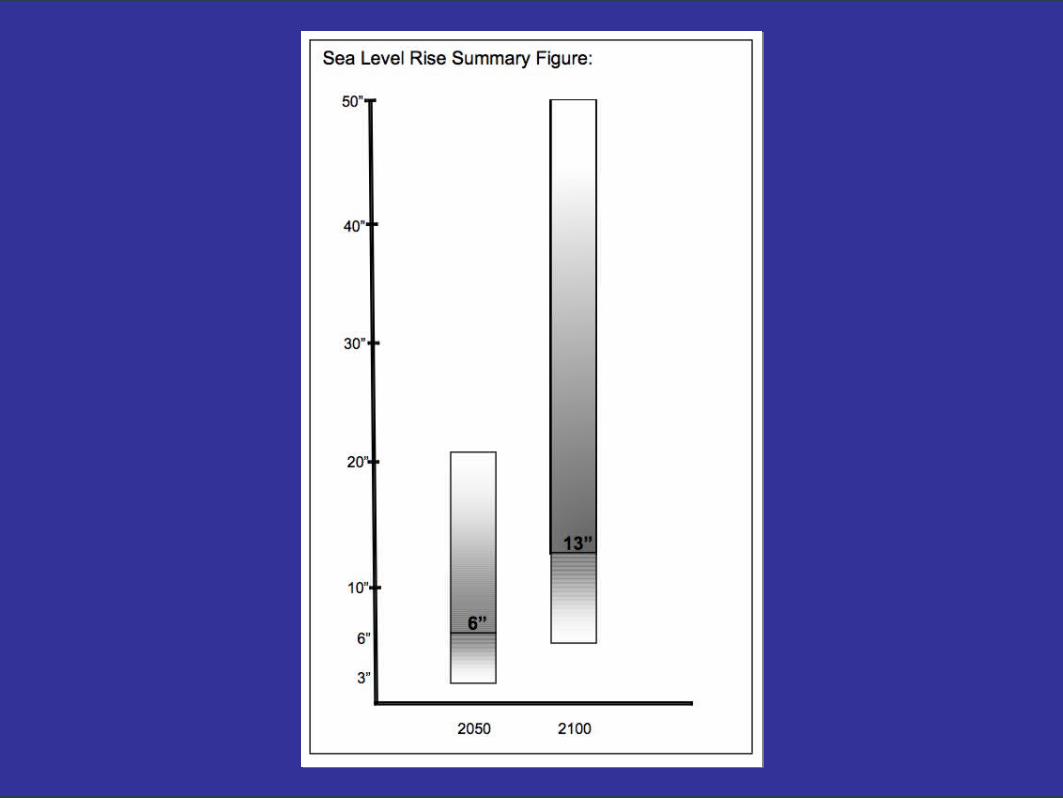
SLR Estimate
Components 2050 2100
NW Olympic Peninsula
Central & Southern
CoastPuget Sound
NW Olympic Peninsula
Central & Southern
CoastPuget Sound
Very Low
Global SLR 9 cm 18 cm
Atm. Dynamics -1 cm - 2 cm
VLM -20 cm - 5cm 0 cm - 40 cm -10 cm 0 cm
Total -12 cm (-5”) 3 cm (1”) 8 cm (3”) -24 cm (-9”) 6 cm (2”) 16 cm (6”)
Medium
Global SLR 15 cm 34 cm
Atm. Dynamics 0 cm 0 cm
VLM - 15 cm - 2.5 cm 0 cm -30 cm - 5 cm 0 cm
Total 0 cm (0”) 12.5 cm (5”) 15 cm (6”) 4 cm (2”) 29 cm (11”) 34 cm (13”)
Very High
Global SLR 38 cm 93 cm
Atm. Dynamics 7 cm 15 cm
VLM -10 cm 0 cm 10 cm - 20 cm 0 cm 20 cm
Total 35 cm (14”) 45 cm (18”) 55 cm (22”) 88 cm (35”) 108 cm (43”) 128 cm (50”)
SummarySummary
• Temp and precip: central values roughly the same as 2005 estimates
• 0.5F/decade warming and little change in annual total precip
• Increased likelihood of drier summers, wetter winters, heavy rains
• Range of projected temp, precip, sea level:no problem to serious consequences