pacificorp 2007 irp - appendices (may 30, 2007)
TRANSCRIPT


This 2007 Integrated Resource Plan (IRP) Report is based upon the best available information at the time of preparation. The IRP action plan will be implemented as described herein, but is subject to change as new information becomes available or as circumstances change. It is PacifiCorp’s intention to revisit and refresh the IRP action plan no less frequently than annually. Any refreshed IRP action plan will be submitted to the State Commissions for their information.
For more information, contact:
PacifiCorpIRP Resource Planning825 N.E. Multnomah, Suite 600Portland, Oregon 97232(503) [email protected]://www.PacifiCorp.com
This report is printed on recycled paper
Cover Photos (Left to Right): Wind: Foot Creek 1 Hydroelectric Generation: Yale Reservoir (Washington) Demand side management: Agricultural Irrigation Thermal-Gas: Currant Creek Power Plant Transmission: South Central Wyoming line
PacifiCorp – 2007 IRP Table of Contents
i
TABLE OF CONTENTS
Table of Contents .................................................................................................................................... i Index of Tables...................................................................................................................................... iv Index of Figures...................................................................................................................................... v
Appendix A – Base Assumptions ............................................................................................................... 1 General Assumptions ............................................................................................................................. 1
Study Period ...................................................................................................................................... 1 Inflation Curve................................................................................................................................... 1 Planning Reserve Margin .................................................................................................................. 1
Load Forecast ......................................................................................................................................... 1 State Summaries ................................................................................................................................ 1
Oregon .......................................................................................................................................... 1 Washington................................................................................................................................... 2 California ...................................................................................................................................... 3 Utah .............................................................................................................................................. 3 Idaho ............................................................................................................................................. 4 Wyoming ...................................................................................................................................... 5
Class 2 DSM...................................................................................................................................... 5 Near Term Customer Class Sales Forecast Methods......................................................................... 6
Residential, Commercial, Public Street and Highway Lighting, and Irrigation Customers ......... 6 Industrial Sales and Other Sales to Public Authorities ................................................................. 7
Long Term Customer Class Sales Forecast Methods ........................................................................ 7 Economic and Demographic Sector ............................................................................................. 7 Residential Sector ......................................................................................................................... 8 Commercial Sector ....................................................................................................................... 9 Industrial Sector.......................................................................................................................... 10 Other Sales.................................................................................................................................. 10
Merging of the Near-Term and Long-Term Sales Forecasts........................................................... 10 Total Load Forecasting Methods..................................................................................................... 10
System Load Forecasts ............................................................................................................... 10 Hourly Load Forecasts................................................................................................................ 11 System Peak Forecasts................................................................................................................ 11 Treatment of State Economic Development Policies ................................................................. 11
Elasticity Studies ............................................................................................................................. 12 Total Class Analysis ................................................................................................................... 12 Analysis of Customers Who Called About Their Bills............................................................... 12 Sub-group Analysis .................................................................................................................... 13
Commodity Prices ................................................................................................................................ 13 Market Fundamental Forecasts........................................................................................................ 13 Gas Price Forecasts.......................................................................................................................... 16 Wholesale Electricity Price Forecasts ............................................................................................. 17
Post-2020 real growth rate sensitivity analysis .......................................................................... 18 Regional transmission project impact analysis........................................................................... 18
Coal Prices....................................................................................................................................... 18 Coal Prices – West Side IGCC ................................................................................................... 19
Emission Costs ..................................................................................................................................... 20 Carbon Dioxide ............................................................................................................................... 20 Sulfur Dioxide ................................................................................................................................. 20 Nitrogen Oxides............................................................................................................................... 21

PacifiCorp – 2007 IRP Table of Contents
ii
Mercury ........................................................................................................................................... 21 Renewable Assumptions ...................................................................................................................... 22
Production Tax Credit ..................................................................................................................... 22 Renewable Energy Credits .............................................................................................................. 22
Existing Resources ............................................................................................................................... 22 Hydroelectric Generation ................................................................................................................ 22
Hydroelectric Relicensing Impacts on Generation ..................................................................... 23 Generation Resources ...................................................................................................................... 24 Demand-Side Management ............................................................................................................. 26
Class 1 Demand-Side Management............................................................................................ 26 Class 2 Demand-Side Management............................................................................................ 26 Class 3 Demand-Side Management............................................................................................ 29 Class 4 Demand-Side Management............................................................................................ 30
Transmission System....................................................................................................................... 31 Topology..................................................................................................................................... 31 Losses ......................................................................................................................................... 31 Congestion Charges .................................................................................................................... 31
Appendix B – Demand Side Management Proxy Supply Curve Report ............................................. 33 Appendix C – Detailed CEM Modeling Results ..................................................................................... 99
Alternative Future and Sensitivity analysis Scenario Results .............................................................. 99 Additional CEM Sensitivity Analysis Scenario Results..................................................................... 107
Appendix D – Supplementary Portfolio Information .......................................................................... 117 Carbon Dioxide Emissions ................................................................................................................. 117 Portfolio PVRR Cost Component Comparison .................................................................................. 121
Appendix E – Stochastic Risk Analysis Methodology ......................................................................... 125 Overview ............................................................................................................................................ 125 Stochastic Variables ........................................................................................................................... 125
The PaR Stochastic Model ............................................................................................................ 125 Stochastic Output ............................................................................................................................... 126
Appendix F – Public Input Process ....................................................................................................... 133 Participant List ................................................................................................................................... 133
Commissions ................................................................................................................................. 133 Intervenors..................................................................................................................................... 133 Others ............................................................................................................................................ 134
Public Input Meetings ........................................................................................................................ 134 2005 Public Process....................................................................................................................... 135
May 18, 2005 – General Meeting ............................................................................................. 135 August 3, 2005 – General Meeting........................................................................................... 135 October 5, 2005 – General Meeting ......................................................................................... 135
2006 Public Process....................................................................................................................... 136 December 7, 2005 – General Meeting ...................................................................................... 136 January 13, 2006 – Renewables Workshop.............................................................................. 136 January 24, 2006 – Load Forecasting Workshop ..................................................................... 136 February 10, 2006 – Demand-Side Management Workshop ................................................... 137 April 20, 2006 – General Meeting............................................................................................ 137 May 10, 2006 – General Meeting ............................................................................................. 137 June 7, 2006 – General Meeting ............................................................................................... 137 August 23, 2006 – General Meeting......................................................................................... 137 October 31, 2006 – General Meeting ....................................................................................... 138

PacifiCorp – 2007 IRP Table of Contents
iii
2007 Public Process....................................................................................................................... 138 February 1, 2007 – General Meeting........................................................................................ 138 April 18, 2007 – General Meeting............................................................................................ 138
Parking Lot Issues .............................................................................................................................. 138 Public Review of IRP Draft Document .............................................................................................. 139
Portfolio Optimality....................................................................................................................... 139 Planning Reserve Margin Selection and Resource Needs Assessment ......................................... 141 Relationship of PacifiCorp’s IRP with its Business Plan .............................................................. 141 The 2007 IRP Action Plan............................................................................................................. 142 Demand-Side Management ........................................................................................................... 142 Market Reliance, Availability, and Price Risk .............................................................................. 143 Scope of Resource Analysis .......................................................................................................... 143 Load Forecast ................................................................................................................................ 145 Carbon Dioxide Regulatory Risk Analysis ................................................................................... 146 Transmission.................................................................................................................................. 146 Miscellaneous ................................................................................................................................ 147
Contact Information ........................................................................................................................... 148 Appendix G – Performance on 2004 IRP Action Plan......................................................................... 149
Introduction ........................................................................................................................................ 149 Appendix H – Deferral of Distribution Infrastructure with Customer-Based Combined Heat and
Power Generation ......................................................................................................... 155 Introduction ........................................................................................................................................ 155 Traditional Connection....................................................................................................................... 155 Generation Connection....................................................................................................................... 155 Conclusion.......................................................................................................................................... 156
Appendix I – IRP Regulatory Compliance ........................................................................................... 157 Background ........................................................................................................................................ 157 General Compliance ........................................................................................................................... 157
California....................................................................................................................................... 159 Idaho.............................................................................................................................................. 159 Oregon ........................................................................................................................................... 159 Utah ............................................................................................................................................... 159 Washington.................................................................................................................................... 160 Wyoming ....................................................................................................................................... 160
Appendix J – Wind Resource Methodology ......................................................................................... 189 Wind Integration Costs....................................................................................................................... 189
Incremental Reserve Requirements ...............................................................................................189 System Balancing Costs ................................................................................................................ 193
Determination of Cost-Effective Wind Resources ............................................................................. 195 Wind Capacity Planning Contribution ............................................................................................... 197 Regional Studies................................................................................................................................. 199 Effect oF Resource Addition Fuel Type on the Company's Cost to Integrate Wind Resources ........ 200

PacifiCorp – 2007 IRP Index of Tables and Figures
iv
INDEX OF TABLES
Table A.1 – Inflation..................................................................................................................................... 1 Table A.2 – Historical and Forecasted Sales Growth in Oregon .................................................................. 2 Table A.3 – Historical and Forecasted Sales Growth in Washington........................................................... 2 Table A.4 – Historical and Forecasted Sales Growth in California .............................................................. 3 Table A.5 – Historical and Forecasted Sales Growth in Utah ...................................................................... 3 Table A.6 – Historical and Forecasted Sales Growth in Idaho ..................................................................... 4 Table A.7 – Historical and Forecasted Sales Growth in Wyoming .............................................................. 5 Table A.8 – Class 2 DSM Included in the System Load Forecast ................................................................ 6 Table A.9 – CO2 cost adders used for Scenario Analysis ........................................................................... 20 Table A.10 – Hydroelectric Generation Facilities ...................................................................................... 23 Table A.11 – Estimated Impact of FERC License Renewals on Hydroelectric Generation....................... 23 Table A.12 – Thermal and Renewable Generation Facilities ..................................................................... 24 Table A.13 – Class 1 Demand-Side Management Programs...................................................................... 26 Table A.14 – Class 2 Demand-Side Management programs ...................................................................... 27 Table A.15 – Class 2 Demand-Side Management Service Area Totals – All States, All Programs........... 28 Table A.16 – Class 3 Demand-Side Management Programs...................................................................... 29 Table A.17 – Class 4 Demand-Side Management Programs...................................................................... 30 Table C.1 – Alternative Future Scenarios ................................................................................................... 99 Table C.2 – Sensitivity Analysis Scenarios ................................................................................................ 99 Table C.3 – Aggregate Resource Additions.............................................................................................. 100 Table C.4 – Wind Resource Additions ..................................................................................................... 101 Table C.5 – Front Office Transactions...................................................................................................... 102 Table C.6 – Gas Additions, Including Combined Heat & Power ............................................................. 103 Table C.7 – IGCC Additions .................................................................................................................... 104 Table C.8 – Pulverized Coal Additions .................................................................................................... 105 Table C.9 – Demand Side Management Additions................................................................................... 106 Table C.10 – Additional Sensitivity Scenarios for CEM Optimization.................................................... 107 Table C.11 – Present Value of Revenue Requirements Comparison ($ Billion)...................................... 108 Table C.12 – Total Resources Accrued by 2016 (Megawatts) ................................................................. 108 Table C.13 – Wind Resources Accrued by 2016 (Nameplate Megawatts)............................................... 108 Table C.14 – Gas Resources Accrued by 2016 (Megawatts).................................................................... 109 Table C.15 – Pulverized Coal Resources Accrued by 2016 (Megawatts) ................................................ 109 Table C.16 – IGCC Resources Accrued by 2016 (Megawatts) ................................................................ 109 Table C.17 – CEM Results: Aggregate Resource Additions ................................................................... 110 Table C.18 – CEM Results: Wind Resource Additions........................................................................... 111 Table C.19 – CEM Results: Front Office Transactions ........................................................................... 112 Table C.20 – CEM Results: Gas Additions, Including Combined Heat and Power ................................ 113 Table C.21 – CEM Results: IGCC Additions .......................................................................................... 114 Table C.22 – CEM Results: Pulverized Coal Additions .......................................................................... 115 Table C.23 – CEM Results: Demand-side Management Additions ........................................................ 116 Table D.1 – CO2 Emissions Attributable to Retail Sales by State ............................................................ 117 Table D.2 – Unit Emission Costs for Group 2 Risk Analysis Portfolio Resources, 2016 ........................ 118 Table D.3 – Group 1: Portfolio PVRR Cost Components (Cap-and-Trade Strategy) .............................. 121 Table D.4 – Group 2: Portfolio PVRR Cost Components (CO2 Cap-and-Trade Compliance Strategy) .. 123 Table D.5 – Group 2: Portfolio PVRR Cost Components (CO2 Tax Compliance Strategy) .................... 124 Table G.1 – Status Update on 2004 IRP Action Plan ............................................................................... 150 Table I.1 – Integrated Resource Planning Standards and Guidelines Summary by State......................... 161 Table I.2 – Handling of 2004 IRP Acknowledgement and Other IRP Requirements .............................. 164

PacifiCorp – 2007 IRP Index of Tables and Figures
v
Table I.3 – Oregon Public Utility Commission IRP Standard and Guidelines ......................................... 172 Table I.4 – Utah Public Service Commission IRP Standard and Guidelines............................................ 181 Table J.1 – Incremental Capacity Contributions from Proxy Wind Resources ........................................ 198 Table J.2 – Wind Integration Costs from Northwest Utility Studies ....................................................... 199
INDEX OF FIGURES
Figure A.1 – Natural Gas and Wholesale Electric Price Curve Components ............................................. 16 Figure A.2 – Natural Gas Price Curve ........................................................................................................ 17 Figure A.3 – Wholesale Electricity Price Forecast – Heavy Load Hours / Light Load Hours ................... 17 Figure A.4 – Average Annual Coal Prices for Resource Additions ........................................................... 19 Figure A.5 – Sulfur-Dioxide (SO2) Spot Price Forecast ............................................................................. 21 Figure A.6 – IRP Transmission System Topology ..................................................................................... 31 Figure D.1 – Annual CO2 Intensity, 2007-2016 ($8 CO2 Adder Case) .................................................... 119 Figure D.2 – Annual CO2 Intensity, 2007-2016 ($61 CO2 Adder Case) .................................................. 120 Figure E.1 – 2007 Frequency of Eastern (Palo Verde) Electricity Market Prices – 100 Iterations .......... 126 Figure E.2 – 2016 Frequency of Eastern (Palo Verde) Electricity Market Prices – 100 Iterations .......... 127 Figure E.3 – 2007 Frequency of Western (Mid C) Electricity Market Prices – 100 Iterations ................ 127 Figure E.4 – 2016 Frequency of Western (Mid C) Electricity Market Prices – 100 Iterations ................ 127 Figure E.5 – 2007 Frequency of Eastern Natural Gas Market Prices – 100 Iterations ............................. 128 Figure E.6 – 2016 Frequency of Eastern Natural Gas Market Prices – 100 Iterations ............................. 128 Figure E.7 – 2007 Frequency of Western Natural Gas Market Prices – 100 Iterations............................ 128 Figure E.8 – 2016 Frequency of Western Natural Gas Market Prices – 100 Iterations............................ 129 Figure E.9 – Goshen Loads....................................................................................................................... 129 Figure E.10 – Utah Loads ......................................................................................................................... 130 Figure E.11 – Washington Loads.............................................................................................................. 130 Figure E.12 – West Main (California and Oregon) Loads........................................................................ 131 Figure E.13 – Wyoming Loads ................................................................................................................. 131 Figure E.14 – 2007 Hydroelectric Generation Percentile ......................................................................... 132 Figure E.15 – 2016 Hydroelectric Generation Percentile ......................................................................... 132 Figure J.1 – Load Following Reserve Requirement Illustration ............................................................... 191 Figure J.2 – Load Following Reserve Requirement for Load Net of Wind.............................................. 191 Figure J.3 – Incremental Reserve Cost Associated with Various Wind Capacity Amounts..................... 192 Figure J.4 – Operating Cost of Incremental Load Following Reserves .................................................... 193 Figure J.5 – PacifiCorp System Balancing Cost ....................................................................................... 194 Figure J.6 – Renewables Capacity Additions for Alternative Future Scenarios ....................................... 196 Figure J.7 – Cumulative Capacity Contribution of Renewable Additions for the PTC Sensitivity Study197

PacifiCorp – 2007 IRP Index of Tables and Figures
vi

PacifiCorp – 2007 IRP Appendix A – Base Assumptions
1
APPENDIX A – BASE ASSUMPTIONS
This appendix will cover the base assumptions used for both the Capacity Expansion Module and the Planning and Risk model used for portfolio analysis in the 2007 Integrated Resource Plan.
GENERAL ASSUMPTIONS
Study Period PacifiCorp currently uses a calendar year that begins on January 1 and ends December 31. The study period covers a 20-year period beginning January 1, 2007 through December 31, 2026.
Inflation Curve Where price forecasts and associated escalation rates were not established by external sources, IRP simulations and price forecasts were performed with PacifiCorp’s inflation rate schedule (See Table A.1 below). Unless otherwise stated, prices or values in this appendix are expressed in nominal dollars. Table A.1 – Inflation
Calendar Years
Average Annual Rate (%)
2007-2013 1.86 2014-2020 1.80 2021-2026 1.88
Planning Reserve Margin PacifiCorp assumed both 12 and 15 percent planning margin for developing the load and re-source balance. Capacity Expansion Module scenario analysis used 12 percent as the low case, 15 percent as the medium case and 18 percent as a high case during the initial phase of analyses. To preserve planning flexibility, the company adopted a reserve margin range of 12 to 15 percent in recognition of uncertainties concerning the cost and reliability impact of evolving state re-source policies to foster renewable energy development and reduce utilities’ carbon footprints.
LOAD FORECAST
This load forecast section provides state-level forecasted retail sales summaries, load forecasting methodologies, and the elasticity studies. Chapter 4 provides the forecast information for each state and the system as a whole by year for 2007 through 2016.
State Summaries
Oregon Table A.2 summarizes Oregon state forecasted sales growth compared with historical growth by customer class.

PacifiCorp – 2007 IRP Appendix A – Base Assumptions
2
Table A.2 – Historical and Forecasted Sales Growth in Oregon
Residential Commercial Industrial Irrigation Other Total 2005 GWh 5,374 4,614 2,957 211 50 13,207 2006 GWh 5,554 4,843 3,238 237 41 13,912
Average Annual Growth Rate 1995-05 1.2% 2.0% -3.5% -3.1% 5.0% 0.1% 2007-16 0.7% 1.5% -0.9% 0.0% 0.9% 0.6%
The forecast of residential sales is expected to have a slightly slower growth than has been ex-perienced historically. Population growth is expected to continue in the service area, which is driving some of the growth, while usage per customer in the residential class is expected to de-cline slightly due to conservation. Forecasted commercial class sales are projected to grow slightly more slowly over the forecast horizon compared to historical periods. Usage per customer is projected to remain flat due to increased equipment efficiency which offsets increased saturation of air conditioning. Forecasted industrial class sales are projected to decline more slowly over the forecast horizon compared to historical periods. In the later years of this historical period, two large industrial customers chose to leave PacifiCorp’s system. This, coupled with declines over the decade in the lumber and wood products industries, resulted in an overall decline in sales to this class. Over the forecast horizon, continuing growth is expected in food processing industries, specialty metals manufacturing industries, and niche lumber and wood businesses, along with continued diversi-fication in the manufacturing base in the state. The factors influencing the forecasted sales growth rates are also influencing the forecasted peak demand growth rates.
Washington Table A.3 summarizes Washington state forecasted sales growth compared with historical growth by customer class. Table A.3 – Historical and Forecasted Sales Growth in Washington
Residential Commercial Industrial Irrigation Other Total 2005 GWh 1,587 1,417 1,054 175 11 4,244 2006 GWh 1,596 1,415 990 155 10 4,166
Average Annual Growth Rate 1995-05 1.1% 2.1% 0.8% 3.1% 2.9% 1.4% 2007-16 1.1% 1.2% 2.0% 0.0% 0.1% 1.3%
The growth in residential class sales is due to continuing population growth and household for-mation in this part of PacifiCorp’s service area. Usage per customer is expected to increase slightly due to increases in both real income and the residential square footage.

PacifiCorp – 2007 IRP Appendix A – Base Assumptions
3
The continuing residential customer growth also affects the commercial sector through increas-ing numbers of commercial customers. Usage per commercial customer is decreasing during the forecast horizon due to increasing saturations in air-conditioning and office equipment that are being offset by efficiency gains in other end-uses, such as lighting. The industrial class is projected to grow at rates above the historical rate. Industrial production is projected to continue to grow in the food, lumber, and paper industries in the state. There are indications that bio-diesel facilities will locate in the state during the forecast period.
California Table A.4 summarizes California state forecasted sales growth compared with historical growth by customer class. Table A.4 – Historical and Forecasted Sales Growth in California
Residential Commercial Industrial Irrigation Other Total 2005 GWh 391 290 64 89 2 837 2006 GWh 398 293 62 96 2 851
Average Annual Growth Rate 1995-05 1.0% 2.4% -2.0% 2.0% 0.4% 1.3% 2007-16 0.9% 1.8% -0.4% 0.0% 0.1% 1.1%
The rate of growth in residential class sales is driven, in part, by the continuing growth in popu-lation in this part of PacifiCorp’s service area. Usage per customer in the residential class is de-clining slightly. Home sizes continue to increase, resulting in more growth in use per customer but this is more than offset by the increasing adoption of efficient appliances. In addition, sum-mer electrical usage increases from air conditioning additions are being somewhat offset by de-clining electric spacing heating saturations and appliance efficiency gains. The continuing population growth also affects sales in the commercial sector through continued commercial customer growth. Additionally, commercial usage per customer is increasing due to greater square footage per building in new construction, increases in the number of offices, and the increasing use of office equipment in all commercial structures. However, some of this growth is being offset from increased equipment efficiency over the forecast horizon. Declines over the decade in the lumber and wood product industries production resulted in an overall decline in the industrial sales; however, there are indications that this trend has ended and growth in other businesses are expected to continue.
Utah Table A.5 summarizes Utah state forecasted sales growth compared with historical growth by customer class. Table A.5 – Historical and Forecasted Sales Growth in Utah
Residential Commercial Industrial Irrigation Other Total 2005 GWh 5,707 6,776 6,944 151 547 20,124 2006 GWh 6,139 7,079 7,312 171 525 21,227

PacifiCorp – 2007 IRP Appendix A – Base Assumptions
4
Residential Commercial Industrial Irrigation Other Total Average Annual Growth Rate
1995-05 4.2% 5.0% 0.9% 2.9% 0.3% 3.0% 2007-16 3.4% 3.3% 1.7% 0.7% 0.3% 2.7%
Utah continues to see natural population growth that is faster than many of the surrounding states. During the historical period, Utah experienced rapid population growth with a high rate of in-migration. However, the rate of population growth is expected to be lower in the coming dec-ade as in-migration into the state slows. Use per customer in the residential class should continue at current levels for the forecast horizon. One of the reasons for the high usage per customer is that newer homes are assumed to be larger. In addition, it is assumed that air conditioning satura-tion rates for single family and manufactured houses will continue to grow. The relatively high population growth also affects sales in the commercial sector by continued commercial customer growth. Usage per customer is projected to increase with new construction having greater square footage per building and increasing usage of office equipment. However, some of this growth is being offset from equipment efficiency gains over the forecast horizon. The industrial class has been experiencing significant industrial diversification in the state and will continue to cause sales growth in the sector. Utah has a strategic location in the western half of the United States, which provides easy access into many regional markets. The industrial base has become more linked to the region and is less dependent on the natural resource base within the state. This provides a strong foundation for continued growth into the future. The peak demand for the state of Utah is expected to have a high growth rate during the forecast period. This is due to several factors: first, newer residential structures are assumed to be larger; second, the air conditioning saturation rates in the state continue to increase in the residential and commercial sectors; and third, newly constructed commercial structures are assumed to be larger than during historical periods.
Idaho Table A.6 summarizes Idaho state forecasted sales growth compared with historical growth by customer class. Table A.6 – Historical and Forecasted Sales Growth in Idaho
Residential Commercial Industrial Irrigation Other Total 2005 GWh 652 382 1,650 534 2 3,221 2006 GWh 678 401 1,659 592 2 3,332
Average Annual Growth Rate 1995-05 1.7% 5.6% -0.0% 2.5% 3.2% 1.3% 2007-16 2.2% 3.1% 0.0% 0.6% 1.2% 1.0%
The growth of sales in the residential sales class continues to be strong in the forecast horizon due to customer growth and increased usage per customer. The customer growth is driven by strong net in-migration and household formation. The increased usage per customer is driven by

PacifiCorp – 2007 IRP Appendix A – Base Assumptions
5
larger home size and a relatively large number of people per household. It is also assumed that air conditioning saturation rates will continue to be increasing during the forecast horizon. The growth rate for commercial class sales is expected to be less than historic levels but will continue to be strong due to customer growth in response to the increasing residential customer growth and due to an increase in the number of offices. Usage per customer is projected to in-crease, which has been influenced in part by new construction at the Brigham Young University Idaho campus, increased air conditioning saturation, office equipment, and exterior lighting. However, this growth is somewhat offset by equipment efficiency gains over the forecast hori-zon. Industrial sales are assumed to be near maximum levels of production and remain there during the forecast horizon.
Wyoming Table A.7 summarizes Wyoming state forecasted sales growth compared with historical growth by customer class. Table A.7 – Historical and Forecasted Sales Growth in Wyoming
Residential Commercial Industrial Irrigation Other Total 2005 GWh 939 1,290 5,756 16 13 8,013 2006 GWh 970 1,367 5,939 21 13 8,309
Average Annual Growth Rate 1995-05 1.4% 2.5% 1.2% 4.1% 0.1% 1.4% 2007-16 1.6% 2.6% 6.7% -0.5% 0.2% 5.6%
The residential sales forecast is expected to continue to grow at nearly historical rates. Popula-tion growth is expected to continue in the service area, which causes some of the growth. Home sizes continue to increase, resulting in increased general use per customer. Increasing air condi-tioning saturations are resulting in more use per customer during the summer months. Commercial sales are projected to grow at a similar rate over the forecast horizon compared to historical periods due to customer growth and increasing usage per customer. Customer growth occurs in response to residential customer growth and the growth of the office sector. Usage per customer is projected to increase for the forecast period due to increases of office and miscella-neous equipment. A major change in the Wyoming sales forecast occurs in the industrial sales sector. Large gas extraction customers are expected to locate in the PacifiCorp service area. The location of these industrial customers in the service area also contributes to the growth in the residential and commercial customer sectors.
Class 2 DSM
Identified and budgeted Class 2 DSM programs have been included in the load forecast as a dec-rement to the load. By 2016, there are 143 MWa of Class 2 programs in the forecast. This sav-ings includes 10 MWa to be implemented by the Energy Trust of Oregon within PacifiCorp’s service territory. Table A.8 shows average program savings and peak obligation hour savings by

PacifiCorp – 2007 IRP Appendix A – Base Assumptions
6
year. In 2016, these Class 2 programs reduce peak system load from what it otherwise would have been by 2.2%.
Table A.8 – Class 2 DSM Included in the System Load Forecast MWa 2007 2008 2009 2010 2011 2012 2013 2014 2015 2016
PacifiCorp 19 38 54 62 75 87 100 112 124 135
Energy Trust of Oregon (ETO) 11 20 27 36 45 54 63 73 82 92
TOTAL 30 58 81 98 120 141 163 185 206 227
Peak Reduction (MW) 40 77 108 131 160 188 217 247 275 303
Near Term Customer Class Sales Forecast Methods
Residential, Commercial, Public Street and Highway Lighting, and Irrigation Customers Sales to residential, commercial, public street and highway lighting, and irrigation customers are developed by forecasting both the number of customers and the use per customer in each class. The forecast of kWh sales for each customer class is the product of two separate forecasts: num-ber of customers and use per customer. The forecast of the number of customers relies on weighted exponential smoothing statistical techniques formulated on a twelve-month moving average of the historical number of customers. For each customer class the dependent variable is the twelve-month moving average of custom-ers. The exponential smoothing equation for each case is in the following form: St = w*xt + (1-w) * St-1 St
(2) = St *xt + (1-w) * St-1(2)
St
(3) = St(2) *xt + (1-w) * St-1
(3) where xt is the twelve-month moving average of customers. The form of this forecasting equa-tion is known as a triple-exponential smoothing forecast model and, as derived from these equa-tions, most of the weight is applied to the more recent historical observations. By applying addi-tional weight to more current data and utilizing exponential smoothing, the transition from actual data to forecast periods is as smooth as possible. This technique also ensures that the December to January change from year to year is reflective of the same linear pattern. These forecasts are produced at the class level for each of the states in which PacifiCorp has retail service territory. PacifiCorp believes that the recent past is most reflective of the near future. Using weights ap-plies greater importance to the recent historical periods than the more distant historical periods and improves the reliability of the final forecast.

PacifiCorp – 2007 IRP Appendix A – Base Assumptions
7
The average use per customer for these classes is calculated using regression analysis on the his-torical average use per customer, which determines if there is any material change in the trend over time. The regression equation is of the form, KPCt = a + b*t where KPC is the annual kilowatt-hours per customer and “t” is a time trend variable having a value of zero in 1992 with increasing increments of one thereafter. “a” and “b” are the estimated intercept and slope coefficients, respectively, for the particular customer class. As in the forecast of number of customers, the forecasts of kilowatt-hours per customer are reviewed for reason-ableness and adjusted if needed. The forecast of the number of customers is multiplied by the forecast of the average use per customer to produce annual forecasts of energy sales for each of the four classes of service.
Industrial Sales and Other Sales to Public Authorities These classes are diverse. In the industrial class, there is no typical customer. Large customers have differing usage patterns and sizes. It is not unusual for the entire class to be strongly influ-enced by the behavior of one customer or a small group of customers. In order to forecast cus-tomer loads for industrial and other sales to public authorities, these customers are first classified based on their Standard Industrial Classification (SIC) codes, which are numerical codes that represent different types of businesses. Customers are further separated into large electricity users and smaller electricity users. PacifiCorp’s forecasting staff, which consults with each PacifiCorp customer account manager assigned to each of the large electricity users, makes esti-mates of that customer’s projected energy consumption. The account managers maintain direct contact with the large customers and are therefore in the best position to know whether any plans or changes in their business processes may impact their energy consumption. In addition, the forecasting staff reviews industry trends and monitors the activities of the customers in SIC code groupings that account for the bulk of the industry sales. The forecasting staff then develops sales forecasts for each SIC code group and aggregates them to produce a forecast for each class.
Long Term Customer Class Sales Forecast Methods
Economic and demographic assumptions are key factors influencing the forecasts of electricity sales. Absent other changes, demand for electricity will parallel other regional and national eco-nomic activities. However, several influences can change that parallel relationship; for example, changes in the price of electricity, the price and availability of competing fuels, changes in the composition of economic activity, the level of conservation, and the replacement rates for build-ings and energy-using appliances. The long-term forecast considers all of these as variables. The following is a generalized discussion of the methodology implemented for the long-term forecast. The forecast is derived from a consistent set of economic, demographic and price pro-jections specific to each of the six states served by PacifiCorp. Forecasts of employment, popula-tion and income with a consistent view of the western half of the United States are used as inputs to the forecasting models.
Economic and Demographic Sector Employment serves as the major determinant of future trends among the economic and demo-graphic variables used to “drive” the long-term sales forecasting equations. PacifiCorp’s meth-

PacifiCorp – 2007 IRP Appendix A – Base Assumptions
8
odology assumes that the local economy is comprised of two distinct sectors: basic and non-basic, as presented in “regional export base theory.1 The basic sector is comprised of those industries that are involved in the production of goods destined for sales outside the local area and whose market demand is primarily determined at the national level. PacifiCorp calculates a region’s share of the employment for these specific indus-tries based on national forecasts of employment for the industries. The non-basic sector theoretically represents those businesses whose output serves the local market and whose market demand is determined by the basic employment and output in the local economy. This simplistic definition of industries as basic or non-basic does not directly confront the prob-lem that much commercial employment (traditionally treated as non-basic) has assumed a more basic nature. This problem is overcome by including other appropriate additional national vari-ables, such as real gross national product in the modeling. In addition, forecasts for county and state populations are also employed as forecast drivers. From these, service territory level popu-lation forecasts are developed and used. Two primary measures of income are used in producing the forecast of total electricity sales. Total personal income is used as a measure of economic vitality which impacts energy utilization in the commercial sector. Real per capita income is used as a measure of purchasing power which impacts energy choice in the residential sector. PacifiCorp’s forecasting system projects total personal income on a service territory basis.
Residential Sector For the first time PacifiCorp implemented the end-use software package Residential End-Use Energy Planning System (REEPS) to produce the long-term residential sales forecast. This resi-dential end-use forecasting model has been developed to forecast specific uses of electricity in the customer’s home. The model explicitly considers factors such as persons per household, fuel prices, per capita income, housing structure types, and other variables that influence residential customer demand for electricity. Residential energy usage is projected on the basis of 14 end-uses. These uses are space heating, water heating, electric ranges, dishwashers, electric dryers, first refrigerators, second refrigerators, lighting, air conditioning, freezers, microwave ovens, electric clothes washers, color televisions and residual uses. Air conditioning can be either cen-tral, window or evaporative (swamp coolers). For each end-use and structure type, PacifiCorp looks first at saturation levels (the number of customers equipped for that end-use) and how they may change in response to demographic and economic changes. PacifiCorp then looks at penetration levels (how many households are ex-pected to adopt that end-use in the future), given the economic and demographic assumptions. In addition, the number of houses that currently have the end-use will be removed upon demolition of the structure. Some appliances may be replaced several times before a home is removed. The
1 The regional export base theory contends that regional economies are dependent on industries that export outside
of the region. These industries, and the ones that support them, are the industries that are the major job creators of the region.

PacifiCorp – 2007 IRP Appendix A – Base Assumptions
9
life expectancy of various appliances compared to the life expectancy of a home is considered in the forecasting process. It is also possible that for a particular appliance more than one exists within a household. For certain appliances, such as air conditioning, the saturation rate has been adjusted to account for this occurrence. For other appliances, such as lighting, the saturation rate is assumed to be one, and the usage per appliance for the average household is adjusted to ac-count for more than one light fixture in the house. In this case the average usage per appliance represents the lighting electrical usage in the average household. The basic structure of the end-use model is to multiply the forecast appliance saturation by the appropriate housing stock, which is then multiplied by the annual average electricity use per ap-pliance. Consumption= Housing Stock k, X Saturation of Appliance ik X Electricity Usage of Appliance ik
where: i= appliance type k=housing type Annual average electricity use per appliance for each structure type is either estimated by using a conditional demand analysis or it is based upon generally accepted institutional, industry and engineering standards. Within REEPS, PacifiCorp models three structure types within two age categories, new and ex-isting, because consumption patterns vary with dwelling type as well as with age. Therefore new and existing homes are separated further into single family, multi-family and manufactured home dwelling types. REEPS allows PacifiCorp to calculate the number of residential customers within each of the new and existing customer categories. These customers are then distributed between the various structure types and sizes. End uses are forecasted for each structure and customer category and these are multiplied by the annual consumption level for each end use. Summing the results gives the total residential sales.
Commercial Sector For the first time PacifiCorp implemented the end-use software package Commercial End-Use Energy Planning System (COMMEND) to produce the long-term commercial sales forecast. It forecasts electricity in the same fashion as the REEPS model but uses energy use per square foot for ten end-uses among ten commercial building types. Consumption= Square foot k, X Saturation of Appliance ik X Electricity Usage of Appliance ik
where: i = Appliance Type k = Commercial Activity Type The nine end-uses are space heating, water heating, space cooling, ventilation, refrigeration, inte-rior lighting, exterior lighting, cooking, office equipment and miscellaneous uses.

PacifiCorp – 2007 IRP Appendix A – Base Assumptions
10
Ten building types are modeled: offices, restaurants, retail, grocery stores, warehouses, colleges, schools, health, lodging, and miscellaneous buildings. Individual forecasts for each building type are totaled for an overall commercial sector forecast.
Industrial Sector PacifiCorp’s industrial sector is somewhat dominated by a small number of firms or industries. The heterogeneous mix of customers and industries, combined with their widely divergent char-acteristics of electricity consumption indicates that a substantial amount of disaggregation is re-quired when developing a proper forecasting model for this sector. Accordingly, the industrial sector has been heavily disaggregated within the manufacturing and mining customer segments. The manufacturing sector is broken down into ten categories based on the Standard Industrial Classification code system. These are: food processing (SIC 20), lumber and wood products (SIC 24), paper and allied products (SIC 26), chemicals and allied products (SIC 28), petroleum refining (SIC 29), stone, clay and glass (SIC 32), primary metals (SIC 33), electrical machinery (SIC 36) and transportation equipment (SIC 37). A residual manufacturing category, composed of all remaining manufacturing SIC codes, is also forecasted. The mining industry, located primarily in Wyoming and Utah, has been disaggregated into at least four categories. Separate forecast are performed for the following industries: metal mining (SIC 10), coal mining (SIC 12), oil and natural gas exploration, pumping and transportation (SIC 13), non-metallic mineral mining (SIC 14); there also exists an “other” mining category in some states. The industrial sector is modeled using an econometric forecasting system.
Other Sales The other sectors to which electricity sales are made are irrigation, street and highway lighting, interdepartmental and other sales to public authorities. Electricity sales to these smaller customer categories are either forecasted using econometric equations or are held constant at their historic sales levels.
Merging of the Near-Term and Long-Term Sales Forecasts The near-term forecast has a horizon of at most three years while the long-term forecast has a horizon of approximately twenty years. Each forecast uses different methodologies, which model the influential conditions for that time horizon. When the forecast of usage for a customer class differs between the near-term and the long-term, judgments and mathematical techniques are implemented in the last year of the near-term forecast which converges these values to the long-term forecast.
Total Load Forecasting Methods
System Load Forecasts The sales forecasts by customer class previously discussed measure sales at the customer meter. In order to measure the total projected load that PacifiCorp is obligated to serve, line losses must be added to the sales forecast. The state sales forecasts are increased by estimates for system line

PacifiCorp – 2007 IRP Appendix A – Base Assumptions
11
losses. Line loss percentages vary by type of service and represent the additional electricity re-quirements to move the electricity from the generating plant to each end-use customer. This increase creates the total system load forecast on an annual basis. This annual forecast is further distributed to an hourly load forecast so that the peak hour demand forecast is determined.
Hourly Load Forecasts To distribute the loads across time, PacifiCorp has developed a regression based tool that models historical hourly load against several independent variables at the state level. These models have a large number of independent variables. Many of these represent spatial conditions over the year, such as the time of day, the week of the year or day of the week. Additionally, the model uses hourly temperatures for weather stations where the bulk of the load in the state resides. A variable representing the humidity levels in the state is also used.
Forecasts of the many independent variables are used with these models to create forecasts of hourly loads relative to the many different factors. For the spatial variables, the date and time in the future is used. Typically, the load on a weekend is lower than on a weekday because indus-trial and some commercial customers use less electricity. Therefore, a variable used to identify a weekend would have a lower contribution to the forecasted load than a weekday variable; using the calendar date for a future period identifies these spatial conditions. For the weather values, the models use the equivalent of the 30-year average temperature for the weather stations at the appropriate day and time in the future. This is also what is used for the humidity measure.
A review of the forecasted growth of the hourly load over time against historical growth rates is made to ensure that the loads are growing at the appropriate times. State loads are aggregated by month and by time of day, and future growth rates are compared with historical growth rates. This allows PacifiCorp to review the nighttime growth rates verses daytime growth rates. Growth in the winter months may differ from the growth in the spring and fall. All of this is re-viewed and trends are incorporated to reflect the historical patterns observed. Hourly loads are then totaled across the months of the forecast period to develop monthly loads. This process in-corporates expected weather conditions into the appropriate month based on normal weather patterns.
System Peak Forecasts The system peaks are the maximum load required on the system in any hourly period. Forecasts of the system peak for each month are prepared based on the load forecast produced using the methodologies described above. From these hourly forecasted values, forecast peaks for the maximum usage on the entire system during each month (the coincidental system peak) and the maximum usage within each state during each month are extracted.
Treatment of State Economic Development Policies The load forecast for each state depends to some degree on the state economic forecast provided by Global Insights. The state economic forecast from Global Insights is dependent on a series of econometric equations based on historical values of state and national economic variables. To the extent that a state has had economic development policies in the past, it is reflected to a similar degree in the state economic forecast and, thus, impacts the load forecast. Periodically, Global Insights will include in the state economic forecast newly developed state economic policies judgmentally external to the econometric forecasting equations when it is deemed appropriate to

PacifiCorp – 2007 IRP Appendix A – Base Assumptions
12
include such programs in the forecast. Since it is assumed that the economic forecast includes all existing and relevant new economic development programs, the load forecast includes the im-pacts of these programs.
Elasticity Studies Since the 2004 IRP, PacifiCorp has performed three separate studies on the effects of the price of electricity on electricity usage in Utah. Each study evaluates the increasing block rates of the residential customer class. That is, the increasing price of electricity during the summer should cause a decline in the usage of electricity, especially during times of peak demand in Utah. These three studies can be classified as
1) Total residential class analysis through econometric methods 2) Analysis, using econometric methods, of customers who called about their electric bills,
and 3) Sub-group analysis of the residential class using cluster analysis and econometric analy-
sis
Total Class Analysis An econometric equation with usage per customer as the dependent variable and the real price of electricity, real household income, cooling degree days2, heating degree days, real natural gas prices, and lagged use per customer as independent variables was developed. The time period of estimation was from 1982 through 2005. The results of this estimation indicate that the short-term price elasticity was -0.05 and that the long-term price elasticity was -0.09. Using either measure, it was determined that electricity is price inelastic, i.e., having an elasticity measure less than 1 in absolute value, or relatively unresponsive to changes in the price of electricity. In particular, the short-term elasticity measure indicates that for a 10 percent increase in price there is a 0.5 percent decline in the usage of electricity one year in the future. The long-term measure indicates that a 10 percent increase in the price of electricity ultimately leads to a 0.9 percent decline in electricity usage.
Analysis of Customers Who Called About Their Bills During 2004 PacifiCorp received calls from 77 customers in Utah who indicated that they were calling about price issues. Of these 77 customers 13 had sufficient data to analyze their usage in response to price changes. An econometric equation was specified having the log of average monthly kilowatt-hours (kWh) as the dependent variable and the log of average real price current and lagged one month, the log of average usage per month lagged on month, heating degree days, and cooling degree days as independent variables. The results of this econometric analysis indicated that the price variables were not statistically significant, which implies that the price coefficient and elasticity is statistically equal to zero. This result means that among those who notified PacifiCorp about changes in their price of elec-tricity, there was no measurable change in their usage.
2 All heating and cooling degree day variables in these analyses were based on temperature data from the Salt Lake
City Airport.

PacifiCorp – 2007 IRP Appendix A – Base Assumptions
13
Sub-group Analysis The sub-group analysis used cluster analysis to group customer in accordance with their usage patterns over the last six years. To be included in the analysis, a customer had to be receiving service since July 1999 and the minimum amount of monthly usage was restricted to 55 kilowatt-hours. The number of residential customers satisfying both conditions was 136,042. From this group of customers, the customers were clustered in accordance to their usage monthly usage patterns and amounts since July 1999. Using traditional cluster analysis techniques based on changes in monthly usage patterns and amounts, it was found that there were 23 clusters of 500 or more customers, with the final cluster being all other remaining customers. For these 24 groups of cus-tomers, regression analysis was performed with the dependent variable being the log of average monthly kilowatt-hours for the group and the independent variables being the log of the group average price per kilowatt-hours, the log of the group average price per kilowatt-hours and the log of the lagged average monthly kilowatt-hours, monthly heating degree days and monthly cooling degree days. Of these 24 groups, two groups indicated a change in electricity usage in response to changes in the price of electricity. One group consisted of 1,490 customers with a summer average usage of 1,096 kilowatt-hours per month. This group had an elasticity measure of -2.51 which implies that a 10 percent increase in price would lead to a 25.1 percent decline in electricity usage for this group. The second group consisted of 505 customers with a summer average usage of 2,340 kilowatt-hours per month. This group had an elasticity measure of -0.95 which implies that a 10 percent increase in price would lead to a 9.5 percent decline in electricity usage for this group. These two groups represent roughly 2 percent of the 136,042 original customers. The remaining groups, which represented 98 percent of the customers, had no usage response to price changes. When weighing the groups according to their percent representation, the analysis implies that the total price elasticity is -0.036; i.e., electricity is price inelastic in total, which indicates that for the total residential class a 10 percent increase in price leads to a 0.36 percent decline in total residential usage.
COMMODITY PRICES
Market Fundamental Forecasts PacifiCorp has historically relied on PIRA Energy’s long range Reference Case forecast of natu-ral gas prices as a primary input to its fundamental forward price curve. The PIRA forecast, translated to western delivery points, is used both to forecast electricity market prices in its fun-damentals-based price forecasting model, Multi-objective Integrated Decision Analysis (MIDAS), and directly as fundamental forward price curves for natural gas. PIRA Energy, through its Scenario Planning Service, also forecasts low and high scenarios for natural gas prices and estimates probabilities associated with these cases and the reference case. Prior to the August 2006 forward price curve, PacifiCorp did not use the low and high natural gas price scenarios in the development of its fundamental forward price curve, relying exclu-sively on the reference case.

PacifiCorp – 2007 IRP Appendix A – Base Assumptions
14
Since 2003, when PIRA began its scenario planning service, natural gas prices and price fore-casts have increased dramatically. A number of well documented supply and demand factors have contributed to this shift. In addition to a higher reference case, market changes have also led PIRA to forecast a wider range of low and high scenarios and higher probabilities associated with the high price scenarios. In its August 2006 update to scenario forecasts, PIRA raised the probability associated with the high scenario from 25 to 30 percent and lowered the low scenario probability from 30 to 25 per-cent. PIRA documented these changes and the explanation for their forecast revisions in their quarterly update. The factors contributing to the shift include the following:
• Increasing probability of global liquefied natural gas (LNG) supply constraints and higher costs arising from slower expansion of liquefaction, escalation of project costs, ris-ing global demand competition from emerging economies, higher political and supply disruption risks, and state gas companies’ extraction of higher economic rents through royalties that have roughly doubled.
• Increasing risks to the timing and success of arctic frontier pipelines (Mackenzie Delta and Alaska North Slope).
• Mounting evidence of a more sensitive price elasticity of supply on the part of US pro-ducers who can rapidly step down exploration and production efforts in response to lower prices, especially in light of continuing high crude oil prices.
PIRA’s ability to ascribe probabilities to their base, high and low cases will allow changes in any of the scenarios or probabilities associated with them to be reflected. PacifiCorp includes this improvement by probability-weighting PIRA’s cases using PIRA’s quarterly and annual updates to scenario forecasts. This method is an improvement over the company’s historic use of the PIRA reference case forecast because it is responsive to increasing uncertainty surrounding fu-ture natural gas prices and also because it better reflects the current view of higher risk of higher natural gas prices in the future. Should the market outlook change and revert to one with more certainty and less high price risk, the probability weighted forecast will also capture that change. PacifiCorp’s official electricity price forecasts are a blend of market prices and output results from MIDAS.

PacifiCorp – 2007 IRP Appendix A – Base Assumptions
15
As Figure A.1 shows, market prices are used exclusively for the first 72 months. The official August 2006 prices reflected market prices on August 31, 2006. Market prices are derived from actual market transactions and broker quotes from polling the industry. Months 73-84 are the average of corresponding adjacent market and MIDAS prices (e.g. month 73 = (market month 61 + MIDAS month 85)/2). Starting in the 85th month and through 2025, prices from MIDAS are used exclusively. After 2025, prices are escalated using PacifiCorp’s June 2006 inflation curve. The plot in Figure A.1 illustrates the blending period.
Modeling Resource Additions in MIDAS
There are three general categories of resource additions added to the MIDAS price forecasting model: (1) renewable generation additions under renewable portfolio standard requirementsor based on published integrated resource plans, (2) specifically identified new resource addi-tions and (3) other capacity needed to meet load growth and planning reserve. Multiple states in the Western Interconnection have adopted renewable portfolio standards. While renewable portfolio standards vary considerably by state, they all require affected enti-ties to hit pre-specified renewable targets measured as a percentage of retail sales. If the mandated RPS targets in each state are to be met, various types of renewable resources must be added to the Western Interconnection resource supply over time. Not all states and provinces within the Western Interconnection are subject to renewable port-folio standards. However, utilities within these regions have been including renewable gen-eration in their integrated resource plans. The recent history of renewable additions confirms the likelihood of additions specified in integrated resource plans coming to fruition. MIDAS modeling includes this IRP-reflected trend of adding renewable resources in areas unaffected by renewable portfolio standard legislation in the Western Interconnection. Total RPS-required and IRP-reflected renewable resource capacity additions added to MIDAS through 2025 is almost 20,000 GWh, which represents a mix of wind, geothermal, solar, bio-mass, landfill gas and small hydro projects. New resource additions include specifically identified resource additions within the Western Interconnection and are only added to MIDAS after independent sources have verified that the units are under construction, operational or far enough into advanced development such that completion on-line date can be forecasted with confidence. The MIDAS market resource expansion module adds new capacity in response to market prices or to meet load growth and planning reserves through its automated resource addition logic. Resources evaluated by MIDAS include natural gas simple cycle combustion turbines, intercooled aeroderivative simple cycles, and combined cycles (with and without duct firing);coal-fired units; and IGCC units. As regions express preferences for, or restrict the usage of, certain resource types (such as coal), the mix of resources that can be added by the model to meet load growth or planning reserves will change.

PacifiCorp – 2007 IRP Appendix A – Base Assumptions
16
Figure A.1 – Natural Gas and Wholesale Electric Price Curve Components
0
20
40
60
80
100
12020
05
2007
2009
2011
2013
2015
2017
2019
2021
2023
2026
2028
2030
2032
2034
$/M
Wh Market
Blend
MIDAS Inflation
For Illustration Purposes Only
Gas Price Forecasts As described in the Market Fundamental Forecast section, natural gas prices for the first six years are from the market on August 31, 2006 and for the next year are a blend of market prices and the gas prices used in MIDAS or PIRA. Starting in year seven, PIRA’s natural gas price forecast is used exclusively. Natural gas price assumptions in MIDAS are based on PIRA Energy’s July 25, 2006 short-term forecast, the August 3, 2006 probabilistic weighted long-term gas forecast, and the August 22, 2006 long-term gas basis differentials. PIRA gas price projections are used in MIDAS through 2020. All prices are adjusted to be consistent with PacifiCorp's official inflation curve issued in June 2006. Gas prices beyond 2020 are escalated using PacifiCorp’s inflation curve, which was updated on June 6, 2006. IRP west side natural gas prices are an average of prices at the Sumas, Stanfield and Opal deliv-ery points. Natural gas prices on the east side are based on the Opal delivery point prices. Fig-ure A.2 shows the natural gas price forecasts used in the 2007 IRP.

PacifiCorp – 2007 IRP Appendix A – Base Assumptions
17
Figure A.2 – Natural Gas Price Curve
$4.00
$5.00
$6.00
$7.00
$8.00
$9.00
$10.00
$11.00
$12.0020
07
2008
2009
2010
2011
2012
2013
2014
2015
2016
2017
2018
2019
2020
2021
2022
2023
2024
2025
2026
Year
$/M
MB
tu
2006 IRP West
2006 IRP East
Wholesale Electricity Price Forecasts Figure A.3 shows the annual average of heavy load hours (HLH) and light load hours (LLH) for wholesale electricity price forecasts dated August 31, 2006 that are used in the 2007 IRP. Figure A.3 – Wholesale Electricity Price Forecast – Heavy Load Hours / Light Load Hours
$0
$20
$40
$60
$80
$100
$120
2007 2008 2009 2010 2011 2012 2013 2014 2015 2016 2017 2018 2019 2020 2021 2022 2023 2024 2025 2026
Year
$/M
Wh
HLH LLH

PacifiCorp – 2007 IRP Appendix A – Base Assumptions
18
Post-2020 real growth rate sensitivity analysis At the May 10, 2005 public meeting, there was discussion about using real escalation for natural gas prices past 2020. PIRA provides natural gas prices through 2020 and PacifiCorp’s official natural gas forecast beyond 2020 is escalated using PacifiCorp’s inflation curve. Another credible source, EIA Annual Energy Outlook February 2006, assumes gas escalation beyond 2020 to be approximately 1.5 percent in real terms. This level of natural gas real escalation was run through the MIDAS model and market prices increased on average by 1.8 percent for the period 2012 through 2025. This was felt to be such a small impact that it was not required to run these market prices through the CEM and PaR mod-els.
Regional transmission project impact analysis For the regional transmission sensitivity, new transmission lines were added to the MIDAS model topology to determine market price sensitivity. A new 1,500 megawatts line was added from Wyoming to SP15 and a new 1,150 megawatts line was added from Utah to NP15. These lines were sized to be consistent with the size of new coal plants that were added in Wyoming and Utah by the MIDAS automatic resource addition logic. The average market prices for the period 2012 through 2025 decreased on average by approximately -0.2 percent. Gas generation is on the margin and determines market prices, which are relatively unaffected by increased transmission.
Coal Prices Figure A.4 reflects PacifiCorp’s estimate of delivered coal costs for its western control area (West), Wyoming and Utah. These costs figures are projections and remain sensitive to changes in overall supply and demand as well as changes in transportation costs.

PacifiCorp – 2007 IRP Appendix A – Base Assumptions
19
Figure A.4 – Average Annual Coal Prices for Resource Additions
$-
$0.50
$1.00
$1.50
$2.00
$2.50
$3.00
$3.50
2012
2013
2014
2015
2016
2017
2018
2019
2020
2021
2022
2023
2024
2025
2026
Years
$/M
MB
tu
WyomingUtahWest
The current IRP plan only contemplates siting coal fired plants at PacifiCorp sites in the West, Wyoming, or Utah. PacifiCorp has not enclosed the costs of its generation fleet. Rather these costs are reflective of PacifiCorp's actual and projected contract costs rather than as a market indicator for future generating potential.
Coal Prices – West Side IGCC The estimated delivered price of fuel delivered to west-side IGCC resources is $1.50/MMBtu in calendar-year 2006 dollars. Published values for a 50/50 blend of petroleum coke and Powder River Basin (PRB) coal from a publicly available document on one of the proposed IGCC pro-jects is estimated at $1.35/MMBtu. The $1.50/MMBtu value reflects uncertainty in the eventual delivered fuel cost, and is considered conservative based on discussions with one party currently proposing an IGCC facility. It is expected that west-side IGCC resources will be able to be fueled with a wide range of fuels with the predominant fuel being low-cost petroleum coke or a blend of petroleum coke and low-cost western fuels, such as PRB coal. Recently proposed IGCC projects in the Pacific Northwest (Energy Northwest’s Pacific Mountain Energy Center and Summit Power Group’s Lower Co-lumbia Clean Energy Center) are located adjacent to deep water ports with rail access allowing for multiple kinds of fuel to be delivered, including petroleum coke, as well as western and inter-national coals. The range of coals that could be used will depend primarily on the design charac-teristics of the gasifier, the fuel processing equipment, and the capabilities of the syn-gas clean up systems.

PacifiCorp – 2007 IRP Appendix A – Base Assumptions
20
EMISSION COSTS
Carbon Dioxide The CO2 adder is based upon the possibility of mandated green house gas reductions across the U.S. electric generating sector. The CO2 adder reflects the company's estimate of compliance costs set at $8/ton in 2008 dollars adjusted for inflation using PacifiCorp's official June 2006 inflation curve. To account for the uncertainty surrounding when such a cost will be imputed upon generating units, prices in 2010 and 2011 are probability weighted. The probability weight-ing applied to 2010 and 2011 prices are 0.5 and 0.75 respectively. By 2012, it is assumed that the CO2 policy will be fully implemented. CO2 prices are $4.15/ton in 2010, $6.34/ton in 2011 and $8.62/ton in 2012 and escalate at PacifiCorp’s June 2006 inflation curve. The portfolio modeling utilized alternative CO2 cost adders for scenario analysis. These alterna-tive cost adders, along with the $8/ton case, are shown in Table A.9. Table A.9 – CO2 cost adders used for Scenario Analysis
CO2 Cost Adder Levels ($/Ton, 2008 Dollars) Year $0 $8 $15 $38 $61 2010 0.00 4.15 4.15 4.15 4.15 2011 0.00 6.34 6.34 6.34 6.34 2012 0.00 8.62 8.62 8.62 8.62 2013 0.00 8.78 8.78 8.78 8.78 2014 0.00 8.94 11.05 17.69 24.34 2015 0.00 9.10 13.89 35.63 67.43 2016 0.00 9.26 17.64 44.09 70.55 2017 0.00 9.43 17.97 44.90 71.85 2018 0.00 9.60 18.29 45.71 73.15 2019 0.00 9.77 18.62 46.53 74.45 2020 0.00 9.95 18.96 47.38 75.82 2021 0.00 10.13 19.30 48.24 77.19 2022 0.00 10.32 19.67 49.14 78.64 2023 0.00 10.52 20.05 50.10 80.16 2024 0.00 10.72 20.43 51.05 81.68 2025 0.00 10.92 20.81 52.00 83.20 2026 0.00 11.13 21.20 52.99 84.78
Sulfur Dioxide The short-term SO2 allowance price forecast reflects PIRA’s May 30, 2006 forecast. The SO2 price trajectory is based upon the May 2006 Emissions Market Intelligence Service report issued by PIRA with the following adjustments. The PIRA price forecast is provided in real dollars and is adjusted for inflation using PacifiCorp's official inflation forecast issued in June 2006 to pro-duce a nominal spot price forecast. Prices beyond 2020 are grown using the same official infla-tion curve. New SO2 allowance prices were adopted to align with a PIRA update and EPA’s

PacifiCorp – 2007 IRP Appendix A – Base Assumptions
21
Clean Air Interstate Rule (CAIR). CAIR requires 2 existing Acid Rain Program allowances for each ton of emissions beginning in 2010 and 2.86:1 in 2015. This surrender ratio applies to East-ern states, but does not apply in the West. Effectively, this lowers allowance prices by a factor of 2 in 2010 and 2.83 in 2015. Figure A.5 shows the SO2 spot emission costs used in the 2007 IRP. Figure A.5 – Sulfur-Dioxide (SO2) Spot Price Forecast
-
200
400
600
800
1,000
1,200
2007 2008 2009 2010 2011 2012 2013 2014 2015 2016 2017 2018 2019 2020 2021 2022 2023 2024 2025 2026
SO2 (
$/to
n)
Nitrogen Oxides The NOX price forecast reflects PacifiCorp’s expectation that by 2012 some form of annual NOX cap-and-trade program will be imposed in the West. Considering the West does not have the same ground-level ozone problems experienced in the East, the forecast assumes that the NOX trading program imposed in 2012 will be less stringent than what is currently targeted under EPA’s Clean Air Interstate Rule (CAIR) for Eastern states. As a result, the marginal control technology is assumed to be selective non-catalytic reduction (SNCR) as opposed to selective catalytic reduction (SCR). While it is by no means certain that a market-based allowance trading mechanism will be imposed eventually on western states NOX emissions, this assumption serves as a reasonable proxy for additional control costs that are likely to arise from NOX regulations driven by existing regulations. In 2012 NOX allowance costs are expected to be $1,145/ton and escalate at PacifiCorp’s June 2006 inflation curve.
Mercury Mercury (Hg) prices reflect co-benefits from the installation of SO2 and NOX controls with a cap-and-trade program beginning in 2010. The mercury spot price forecast is based upon PIRA's Emissions Market Intelligence Service as of February 23, 2006. PIRA's forecast includes a range (high and low) for 2010, 2015, and 2020. Values between the years reported by PIRA are interpolated. All prices are adjusted to be consistent with PacifiCorp's official inflation curve issued in June 2006. Mercury prices are expected to be $7,197/Lb in 2010.

PacifiCorp – 2007 IRP Appendix A – Base Assumptions
22
RENEWABLE ASSUMPTIONS
Production Tax Credit The production tax credit (PTC) incentive applies to new wind and geothermal plants with the intent of bringing their costs in line with other resource technologies such as resources fueled by coal and natural gas. In the 2007 IRP, the tax credit is incorporated into the wind supply curves. Although the current law applies only to wind projects brought on-line through 2007, the effect on supply curves was extended throughout the study horizon for the purposes of the IRP analy-sis. It is widely expected that the PTC deadline will be extended, and will only end at such a time as the cost of the technology declines to the point where tax credits are no longer needed to keep wind competitive with other resource types. The 2007 IRP does not contain any specific expectation regarding declining wind resource costs due to technology improvements, using the assumption of an extended PTC to cover the combination of PTC and technology improvement effects.
Renewable Energy Credits Renewable energy credits (RECs), also known as green tags, are certificates that represent the reporting rights for a quantity of energy generated from a specific resource. Markets have devel-oped around buying and selling RECs. Consumers desiring to encourage renewable resources may purchase RECs, sometimes matching all or a portion of their electric power usage. Utilities may also purchase RECs to satisfy minimum renewable energy requirements established in some states. Since PacifiCorp’s 2003 IRP, a value has been ascribed to the green tags generated by owned renewable energy projects. That value was estimated to be $5 per megawatt-hour of generation for the first five years of production (constant nominal dollars). PacifiCorp called a number of green tag suppliers to ascertain whether the market value of RECs had substantially changed from where it has been over the past few years. Despite the expectation that increasing state minimum requirements for renewable generation would push market prices up, there was no clear indication that market prices had gone up. The potential market impacts of state standards was discussed, but the consensus was that the effect on market prices would be highly dependent on the specifics of state requirements, and did not clearly indicate a specific direction for green tag prices. In light of this, PacifiCorp has chosen to retain its REC value assumption of $5 per megawatt-hour for five years in constant nominal dollars.
EXISTING RESOURCES
Hydroelectric Generation Table A.10 provides an operational profile for each of PacifiCorp’s hydroelectric generation fa-cilities. The dates listed refer to a calendar year.

PacifiCorp – 2007 IRP Appendix A – Base Assumptions
23
Table A.10 – Hydroelectric Generation Facilities
Plant
PacifiCorp Share (MW) Location
License Expiration
Date Retirement
Date
West Big Fork 4.15 Montana 2001 2051 Clearwater 1 15.00 Oregon 1997 2040 Clearwater 2 26.00 Oregon 1997 2040 Copco 1 20.00 California 2006 2046 Copco 2 27.00 California 2006 2046 East Side 3.20 Oregon 2006 2016 Fish Creek 11.00 Oregon 1997 2040 Iron Gate 18.00 California 2006 2046 JC Boyle 80.00 Oregon 2006 2046 Lemolo 1 29.00 Oregon 1997 2040 Lemolo 2 33.00 Oregon 1997 2040 Merwin 136.00 Washington 2009 2046 Rogue 46.76 Oregon Various Various Slide Creek 18.00 Oregon 1997 2040 Soda Springs 11.00 Oregon 1997 2040 Swift 1 240.00 Washington 2006 2046 Toketee 42.50 Oregon 1997 2040 West Side 0.60 Oregon 2006 2016 Yale 134.00 Washington 2001 2046
Small West Hydro 21.01 CA/OR/WA Various Various
East Bear River 114.50 ID/UT Various Various
Small East Hydro 26.50 ID/UT/WY Various Various
Hydroelectric Relicensing Impacts on Generation Table A.11 lists the estimated impacts to average annual hydro generation from FERC license renewals. PacifiCorp assumed that all hydroelectric facilities currently involved in the relicens-ing process will receive new operating licenses, but that additional operating restrictions imposed in new licenses will reduce generation available from these facilities. Table A.11 – Estimated Impact of FERC License Renewals on Hydroelectric Generation
Year Lost Generation (MWh) 2007 (154,370) 2008 (158,191)

PacifiCorp – 2007 IRP Appendix A – Base Assumptions
24
Year Lost Generation (MWh) 2009 (158,191) 2010 (158,191) 2011 (158,191) 2012 (168,035) 2013 (196,590) 2014 (196,590) 2015 (196,590) 2016 (212,383) 2017 (212,383) 2018 (212,383) 2019 (212,383) 2020 (212,383) 2021 (212,383) 2022 (212,383) 2023 (212,383) 2024 (212,383) 2025 (212,383) 2026 (212,383)
Note: Excludes the decommissioning of Condit, Cove, Powerdale, and American Fork.
Generation Resources Table A.12 lists operational profile information for the PacifiCorp generation resources, includ-ing plant type, maximum megawatt capacity, ownership share, location, retirement date, and FERC Form 1 heat rates. Lake Side’s heat rate has been approximated based on design expecta-tions. Table A.12 – Thermal and Renewable Generation Facilities
Plant
Maximum MW (PacifiCorp
Share) State
PacifiCorp Percentage
Share Retirement
Date 1/ Heat Rate (Btu/kWh)
Coal-fired
Carbon 1 67 Utah 100% 2020 11,497 Carbon 2 105 Utah 100% 2020 11,497 Cholla 4 380 Arizona 100% 2025 10,815 Colstrip 3 74 Montana 10% 2029 10,870 Colstrip 4 74 Montana 10% 2029 10,870 Craig 1 83 Colorado 19% 2024 10,208 Craig 2 83 Colorado 19% 2024 10,208 Dave Johnston 1 106 Wyoming 100% 2020 11,047 Dave Johnston 2 106 Wyoming 100% 2020 11,047 Dave Johnston 3 220 Wyoming 100% 2020 11,047 Dave Johnston 4 330 Wyoming 100% 2020 11,047 Hayden 1 45 Colorado 24% 2024 10,571

PacifiCorp – 2007 IRP Appendix A – Base Assumptions
25
Plant
Maximum MW (PacifiCorp
Share) State
PacifiCorp Percentage
Share Retirement
Date 1/ Heat Rate (Btu/kWh)
Hayden 2 33 Colorado 13% 2024 10,571 Hunter 1 403 Utah 94% 2031 10,508 Hunter 2 259 Utah 60% 2031 10,508 Hunter 3 460 Utah 100% 2031 10,508 Huntington 1 445 Utah 100% 2025 10,099 Huntington 2 450 Utah 100% 2025 10,099 Jim Bridger 1 353 Wyoming 67% 2026 10,569 Jim Bridger 2 353 Wyoming 67% 2026 10,569 Jim Bridger 3 353 Wyoming 67% 2026 10,569 Jim Bridger 4 353 Wyoming 67% 2026 10,569 Naughton 1 160 Wyoming 100% 2022 10,426 Naughton 2 210 Wyoming 100% 2022 10,426 Naughton 3 330 Wyoming 100% 2022 10,426 Wyodak 1 280 Wyoming 80% 2028 11,597 Gas-fired
Currant Creek 541 Utah 100% 2040 7,327 Gadsby 1 60 Utah 100% 2017 11,590 Gadsby 2 75 Utah 100% 2017 11,590 Gadsby 3 100 Utah 100% 2017 11,590 Gadsby 4 40 Utah 100% 2027 11,556 Gadsby 5 40 Utah 100% 2027 11,556 Gadsby 6 40 Utah 100% 2027 11,556 Hermiston 1 2/ 124 Oregon 50% 2031 7,222 Hermiston 2 2/ 124 Oregon 50% 2031 7,222 Lake Side 3/ 544 Utah 100% -- 6,939 West Valley 1 40 Utah 100% 2008 10,694 West Valley 2 40 Utah 100% 2008 10,694 West Valley 3 40 Utah 100% 2008 10,694 West Valley 4 40 Utah 100% 2008 10,694 West Valley 5 40 Utah 100% 2008 10,694 Renewables and Other
Blundell (Geothermal) 4/ 23 Utah 100% 2033 -- Foote Creek (Wind) 33 Wyoming 79% 2019 -- Leaning Juniper (Wind) 101 Oregon 100% 2031 -- James River (CHP) 30 Washington 100% 2016 7,200 Little Mountain (CHP) 14 Utah 100% 2009 16,980
1/ Plant lives are currently being reviewed for compliance with future environmental regulations. 2/ Remainder of Hermiston plant under purchase contract by the company for a total of 248 MW. 3/ Currently under construction; expected June 2007 start date. 4/ Planned Blundell bottoming-cycle upgrade of 11 MW in 2008.

PacifiCorp – 2007 IRP Appendix A – Base Assumptions
26
Demand-Side Management This section provides tabular statistics for PacifiCorp’s Class 1, 2, 3 and 4 demand-side man-agement programs. For more information on demand-side management programs, see the fol-lowing:
• Chapter 4 describes each of the demand-side management program classes.
• Chapter 4 summarizes how each of the Classes of demand-side management resources was incorporated in the portfolio simulation and analysis process.
Class 1 Demand-Side Management Table A.13 details the base case Class 1 demand-side management programs. Peak load reduc-tions for 2007-2016 are shown by program within each state. Table A.13 – Class 1 Demand-Side Management Programs
Demand-side management program Description
Program Contribution (Megawatts) Availability
Irrigation Load Control Incentive program for Idaho irrigation cus-tomers to participate in pumping load control program during the irrigation season.
50 megawatts in 2007 continuing for 10 years.
ID
Residential and Small Commercial Air Condi-tioner Load Control Program –“Cool Keeper”
Turn-key load control network financed, built, operated and owned by a third party vendor through a pay-for-performance contract. This program may be expanded in size or expanded into other jurisdictions within this planning period.
90 megawatts by 2007 contracted for through 2013.
UT
Irrigation Load Control Incentive program for Utah irrigation custom-ers to participate in pumping load control program during the irrigation season
12 megawatts in 2007 continuing for 10 years.
UT
Note: The company discontinued Utah’s commercial lighting load control program in August of 2006 following the program’s inability to reach its targeted curtailment milestones.
Class 2 Demand-Side Management Since the 2004 IRP, more current Class 2 data has been incorporated into the 2007 IRP Class 2 DSM in the system load forecast. Adjustments, which increased savings, include the proposed implementation of Wyoming programs and the introduction of the Home Energy savers program for residential customers in Idaho, Washington and Utah in 2006 and proposed for California and Wyoming in 2007. The Energy Trust of Oregon has completed another resource assessment which reduces their expected contributions from their programs over the planning period. Chang-ing federal standards have reduced air conditioning savings available from the Utah Cool Cash program as well as have impacted other program forecasts. The Utah Load Lightener program, which was expected to contribute energy efficiency results in addition to load management op-portunities, was removed to reflect cancellation of the program in early 2006. Business customer programs have been adjusted to reflect the decrease in savings associated with short payback work drying up and the increased time to acquire the higher complexity savings.

PacifiCorp – 2007 IRP Appendix A – Base Assumptions
27
Table A.14 defines the Class 2 programs. Table A.15 provides base case Class 2 demand-side management program savings for calendar years 2007-2016. Table A.14 – Class 2 Demand-Side Management programs Demand-side Management Program Description
Energy FinAnswer (incentive program)
Engineering and incentive package for improved energy efficiency in new construc-tion and comprehensive retrofit projects in commercial, industrial and irrigation sec-tors. Incentives are based on $/kilowatt hour and $/kilowatt reductions.
Energy FinAnswer (loan program)
Engineering and financing package for improved energy efficiency in new construc-tion and retrofit projects in the commercial, industrial and irrigation sectors.
FinAnswer Express Incentives for single measure new construction and retrofit energy-efficient projects in commercial, industrial and irrigation sectors. Incentives are based on a prescriptive (pre-determined) amount dependent on measures installed.
Recommissioning Building tune-up services designed to provide customers with low to no cost actions they can take to improve the efficiency of their existing equipment or facilities.
Self-Direction Credit Provides large business customers the opportunity to receive credits to offset the Cus-tomer Efficiency Services charge for qualified "self-investments" in efficiency and related demand side management projects.
Irrigation Efficiency
Three part program. Nozzle exchange, pump check and water management consulta-tion, and pump testing that includes a system audit function. Depending on the state, incentives for system re-design and replacements are offered or the project is referred to the Energy FinAnswer program.
Efficient Air Conditioning Program – “Cool Cash”
Provide customer incentives for improving the efficiency of air conditioning equip-ment and/or maintaining or converting air conditioning equipment to evaporative cooling technologies.
Residential New Construction – “Energy Star Homes”
Third party delivered program providing incentives for home builders to construct single and multi-family homes that exceed energy code requirements. Homes are required to have more efficient cooling equipment and a mix of improved shell meas-ures (windows and insulation) to be eligible for incentives. Additional incentives will be available for improved lighting and evaporative cooling.
Appliance Recycling Program
An incentive program designed to environmentally and cost-effectively remove ineffi-cient refrigerators and freezers from the market.
Low-Income Weatherization Program
The company partners with community action agencies to provide no cost residential weatherization services to income qualifying households. Program may incorporate energy education depending on the state.
Home Energy Savers Program
A broad based residential program offering customer incentives for the purchase of energy efficient lighting, equipment, appliances, insulation and energy efficient prac-tices e.g. air conditioner tune-ups or duct sealing. The program measures may vary between states due to measure specific programs available in some states e.g. Utah’s air conditioning efficiency program, “Cool Cash”.
Energy Education
Program provides 6th graders with energy efficiency curriculum and home energy audit kits that include instant savings measures i.e. compact florescent lights, shower-heads, temperature check cards, etc. This program is currently only available in Washington.

PacifiCorp – 2007 IRP Appendix A – Base Assumptions
28
Demand-side Management Program Description
Northwest Energy Efficiency Alliance (NEEA)
A series of conservation programs sponsored by utilities in the region and delivered through NEEA designed to support market transformation of energy efficient products and services in Oregon, Washington, Idaho and Montana. Programs include manufac-turer rebates on compact fluorescent bulbs to building operator certification courses.
Energy Trust of Oregon (ETO)
Energy education and conservation measures implemented by the Energy Trust of Oregon with funding from the three percent public purpose charge paid by Oregon customers. The non-governmental delivery agent under contract with the Oregon Pub-lic Utility Commission was created in March of 2002 as part of the state’s electric industry restructuring legislation, Senate Bill 1149.
Table A.15 – Class 2 Demand-Side Management Service Area Totals – All States, All Pro-grams (Calculated at the generator) PacifiCorp – Class 2 Service Area Total
Calendar Year
MWa First Year
MWh First Year
MWa Cumulative
MWh Cumulative
2007 29.17 256,517 29.17 255,5172008 28.22 247,197 57.12 500,3992009 24.49 214,558 80.80 707,7752010 23.66 207,254 97.85 857,1692011 22.88 200,416 119.33 1,045,3292012 22.63 198,214 140.87 1,234,0392013 22.58 197,844 163.12 1,428,9482014 21.68 189,932 184.80 1,618,8352015 21.15 185,259 205.94 1,804,0512016 20.81 182,305 226.75 1,986,311
PacifiCorp – Class 2 Program Totals
Calendar Year
MWa First Year
MWh First Year
MWa Cumulative
MWh Cumulative
2007 18.67 164,537 18.67 163,5372008 19.22 168,357 37.62 329,5792009 16.89 147,982 53.70 470,3792010 14.86 130,166 61.95 542,6852011 14.08 123,328 74.63 653,7572012 13.63 119,374 87.17 763,6272013 13.08 114,624 99.92 875,3162014 12.18 106,712 112.10 981,9832015 11.65 102,039 123.74 1,083,9792016 11.31 99,085 135.05 1,183,019

PacifiCorp – 2007 IRP Appendix A – Base Assumptions
29
Energy Trust of Oregon Total Calendar
Year MWa
First Year MWh
First Year MWa
Cumulative MWh
Cumulative 2007 10.50 91,980 10.50 91,9802008 9.00 78,840 19.50 170,8202009 7.60 66,576 27.10 237,3962010 8.80 77,088 35.90 314,4842011 8.80 77,088 44.70 391,5722012 9.00 78,840 53.70 470,4122013 9.50 83,220 63.20 553,6322014 9.50 83,220 72.70 636,8522015 9.50 83,220 82.20 720,0722016 9.50 83,220 91.70 803,292
Class 3 Demand-Side Management Table A.16 defines the company’s Class 3 programs. Class 3 programs are treated as reliability resources and are not included within the company’s base resources. Table A.16 – Class 3 Demand-Side Management Programs Demand-Side Management Class 3 Program Description
Energy Exchange program
Web based notification program that allows participating customers to vol-untarily reduce their electric usage in exchange for a payment at times and at prices determined by the company. The program is available to customers with loads equal to or greater than 1 megawatt as measured anytime within the last 12 months. The company is considering program revisions that among other program design changes may expand the program to customers with loads of less than 1 megawatt.
Oregon Time of Use program
Senate Bill 1149 portfolio offering for residential plus greater than 30 kilo-watt commercial and irrigation customers. Program enables customers to potentially reduce their energy costs by shifting the bulk of their energy usage to off-peak periods year-round.
Oregon Critical Peak Pricing pilot
Still under development as of the writing of this report, the company has agreed to a critical peak pricing pilot in Oregon fashioned after California’s investor owned utilities state-wide pricing pilot program. The program will likely be offered to residential and small commercial customers and be run for a two year period as the company collects information on the customer acceptance, behavioral performance, and cost-effectiveness of a larger offer-ing.
Idaho Time of Day program – business and farm load customers
A program available to general service customers (non-residential, non-irrigation, non-street lighting and non-area lighting) with a maximum power requirement of 15,000 kilowatts or less. It encourages off-peak usage though tariff pricing.
Idaho Time of Day program – residential customers
A program available to residential customers (120 or 240 volt service with a single kilowatt hour meter). It encourages off-peak usage though tariff pric-ing.

PacifiCorp – 2007 IRP Appendix A – Base Assumptions
30
Demand-Side Management Class 3 Program Description
Utah Time of Day program – residential customers
A pilot program (1,000 customers) available to residential customers (120 or 240 volt service with a single kilowatt hour meter). It encourages off-peak usage though tariff pricing.
Interruptible contracts
The company has interruptible service agreements with a few major special contract customers that allow for service interruption during periods of sys-tem resource inadequacies and in some cases during periods of high market prices (economic dispatch).
Class 4 Demand-Side Management Table A.17 defines the company’s Class 4 programs. Class 4 program resources are naturally taken into consideration through the development of the company’s integrated resource planning load forecasts. Table A.17 – Class 4 Demand-Side Management Programs Demand-Side Management Class 4 program Description
“Do the bright thing” energy efficiency awareness and education advertising
General advertising messages that focus on low to no cost efficiency and load management tips and information encouraging customers to “Do the bright thing”. Campaign activity increases during seasonal peak periods utilizing radio, newspaper, buses, customer newsletters, and other media channels. The umbrella tag line is utilized by some of our Class 2 program vendors in their advertising efforts and the general advertising often directs customers to available incentive programs to assist them in their energy efficient pursuits.
PowerForward program
A state of Utah program supported by company and other state utilities that is-sues public service announcements in a stop light manner to alert customers of critical peak usage situations and requests customers to curtail non-essential loads during yellow and red alerts.
Residential do-it-yourself audit
Web accessible do-it-yourself paper audit designed to assist customers in identi-fying how they use energy today and providing them economically based rec-ommendations on how to improve the energy efficiency of their homes. Custom-ers can fill-out the audit online or mail in a copy of the completed audit. The company will complete the audit analysis and mail customers their results.
Oregon residential web audit
Web based do-it-yourself audit designed to assist customers in identifying how they use energy today and providing them economically based recommendations on how to improve the energy efficiency of their homes. The program is funded by the Oregon’s public purpose fund monies and operated by the Energy Trust of Oregon. A link to the program is found on the Pacific Power website.
Wyoming residential and small commercial energy advisor website.
Web based conservation advisor and energy advisor programs designed to assist customers in identifying how they use energy today and providing them eco-nomically based recommendations on how to improve the energy efficiency of their homes. The program is offered by the Wyoming Energy Conservation Network through a grant that was supported by PacifiCorp. A link to the pro-gram is found on the Rocky Mountain Power website.
Energy Education
Although this program is classified as a Class 2 resource due to its energy saving kit and associated savings, the program revolves around energy education, which is a Class 4 attribute. The program provides 6th graders with energy efficiency curriculum and home energy audit kits that include instant savings measures i.e. compact florescent lights, showerheads, temperature check cards, etc. This pro-gram is currently only available in Washington.

PacifiCorp – 2007 IRP Appendix A – Base Assumptions
31
Transmission System
Topology PacifiCorp uses a transmission topology consisting of 15 bubbles (geographical areas) in the East and nine bubbles in the West designed to best describe major load and generation centers, re-gional transmission congestion impacts, import/export availability, and external market dynam-ics. Bubbles are linked by firm transmission paths. The transfer capabilities between the bubbles represent PacifiCorp Merchant function’s firm rights on the transmission lines. Figure A.6 shows the IRP transmission topology.
Losses Transmission losses are netted in the loads as stipulated in FERC form 714 (4.48% real loss rate, schedule 9).
Congestion Charges Transmission charges associated with a congestion pricing regime are not modeled. A detailed analysis of the impacts of congestion pricing will be undertaken in a future IRP when details concerning such pricing become available. Figure A.6 – IRP Transmission System Topology
Utah NorthUtah North
4 Corners$
4 Corners$
ChollaCholla
Utah SouthUtah South
Path C (N)Path C (S)
APS trans
Brady GoshenGoshen
WyomingWyoming
MontanaMontana
Bridger WestBridger West
ColoradoColorado
BPABPA
Palo Verde$
YakimaYakima
West MainWest Main
Arizona Arizona
Borah
Walla WallaWalla Walla
MonaMona
Mid-C$Mid-C$
$
Load
Generation
Purchase/Sale Markets
Contracts/Exchanges
PacifiCorp Merchant Transmission Rights
West East
Bridger EastBridger East
COB$COB
$

PacifiCorp – 2007 IRP Appendix A – Base Assumptions
32

PacifiCorp – 2007 IRP Appendix C – Detailed CEM Modeling Results
106
Table C.9 – Demand Side Management Additions (MW Capacity) Scenario 2007 2008 2009 2010 2011 2012 2013 2014 2015 2016 CAF00 - - - - - 150 150 150 150 150 CAF01 - - - - - 151 151 151 151 151 CAF02 - - - - - - - - - -CAF03 - - - 19 101 163 163 163 163 163 CAF04 - - - - - 78 78 78 78 78 CAF05 - - - - - 99 99 99 99 99 CAF06 - - - 19 34 97 97 169 169 169 CAF07 - - - - - 58 58 58 58 58 CAF08 - - - - - 129 129 129 129 129 CAF09 - - - - - 64 64 64 64 64 CAF10 - - - - - 68 68 68 68 68 CAF11 - - - - - 73 211 211 211 211 CAF12 - - - - - 145 150 150 150 150 CAF13 - - - 19 19 26 41 41 41 41 CAF14 - - - - - 150 150 150 150 150 CAF15 - - - 19 19 198 198 198 198 198 SAS01 - - - - - 161 161 161 161 161 SAS02 - - - - - 73 140 140 161 161 SAS03 - - - - - 153 153 153 153 153 SAS04 - - - - - 153 153 153 153 153 SAS05-10 - - - - - 150 209 209 209 209 SAS05-15 - - - - - - 41 41 41 41 SAS05-20 - - - - - 154 154 154 154 244 SAS06 - - - - - 94 150 150 150 150 SAS07 - - - - - 26 124 124 124 124 SAS08 - - - - - 198 198 198 198 198 SAS09 - - - - - 150 150 150 150 150 SAS10 - - - - - 150 150 150 150 150 SAS11 - - - - - 26 145 145 145 145 SAS12 - - - - - 137 137 137 137 137 SAS13 - - - - - 153 153 153 153 153 SAS14 - - - - - 153 153 153 153 201 SAS15 - - - - - 131 211 211 211 211 SAS16 - - - - - 73 73 73 73 73

PacifiCorp – 2007 IRP Appendix C – Detailed CEM Modeling Results
107
ADDITIONAL CEM SENSITIVITY ANALYSIS SCENARIO RESULTS
This section reports the detailed CEM results for an additional set of sensitivity scenarios re-quested by participants at the August 2006 public input meeting. Specifically, participants re-quested that sensitivities to scenario variables be tested against different sets of “base” scenario assumptions. All but one of the scenarios in Table 7.1 were intended to examine the CEM’s re-sponse to varying assumptions around the “medium” (CAF11) case. Participants requested stud-ies that varied the assumptions around the business-as-usual (CAF00), the low cost bookend (CAF14), and the high cost bookend (CAF16) scenarios. Table C.10 summarizes the additional sensitivity scenarios. Note that sensitivities were only se-lected if they involve a key scenario variable or planning assumption (such as the planning re-serve margin level), or are compatible with respect to how the alternative future scenario was defined. For example, the sensitivities for testing alternative CO2 adder values are not compatible with the business-as-usual case, since that case assumes no adder to begin with. Regarding the regional transmission project scenario, additional forward price forecasts would be required to support alternative market conditions, which PacifiCorp deemed as too burdensome given the other research priorities. A few other sensitivities were excluded because they are intended to fulfill specific analytical requirements from the Oregon Public Utility Commission, such as SAS15 (“plan to average of super-peak load”). Table C.10 – Additional Sensitivity Scenarios for CEM Optimization Alternative Future Scenario Used
SAS# Name
Business As Usual
(CAF00)
Low Cost Bookend (CAF14)
High Cost Bookend (CAF15)
1 Plan to 12% capacity reserve margin X X X 2 Plan to 18% capacity reserve margin X X X 3 CO2 adder implementation in 2016 4 Regional transmission project 5a CO2 adder impact on resource selection: $10/ton (1990$) X X 5b CO2 adder impact on resource selection: $15/ton (1990$) X X 5c CO2 adder impact on resource selection: $20/ton (1990$) X 6 Low wind capital cost X X X 7 High wind capital cost X X X
Tables C.11 through C.15 compare PVRR and resource addition results for each of the additional sensitivity scenarios. The first table reports PVRR. The remaining five tables report nameplate ca-pacity accrued by 2016 for total resources, wind, gas, pulverized coal, and IGCC, respectively.

PacifiCorp – 2007 IRP Appendix C – Detailed CEM Modeling Results
108
Table C.11 – Present Value of Revenue Requirements Comparison ($ Billion)
Alternative Future Scenario Used
Name
Business As Usual
(CAF00)
Low Cost Bookend (CAF14)
High Cost Bookend (CAF15)
Medium Load
Growth (CAF11)
Plan to 12% capacity reserve margin $19,488 $13,382 $48,825 $24,400 Plan to 18% capacity reserve margin $19,933 $13,672 $49,936 $24,983 CO2 adder implementation in 2016 -- -- -- $22,673 Regional transmission project -- -- -- $24,182 CO2 adder impact on resource selection: $10/ton (1990$) -- $19,803 $39,693 $28,551 CO2 adder impact on resource selection: $15/ton (1990$) -- $22,303 $44,773 $32,390 CO2 adder impact on resource selection: $20/ton (1990$) -- $24,589 $49,234 $36,073 Low wind capital cost $19,424 $13,523 $47,018 $24,282 High wind capital cost $19,867 $13,703 $48,123 $24,836
Table C.12 – Total Resources Accrued by 2016 (Megawatts)
Alternative Future Scenario Used
Name
Business As Usual
(CAF00)
Low Cost Bookend (CAF14)
High Cost Bookend (CAF15)
Medium Load
Growth (CAF11)
Plan to 12% capacity reserve margin 3,327 1,507 5,338 3,172 Plan to 18% capacity reserve margin 3,831 2,028 6,068 3,918 CO2 adder implementation in 2016 -- -- -- 3,584 Regional transmission project -- -- -- 3,543 CO2 adder impact on resource selection: $10/ton (1990$) -- 1,775 6,010 3,509 CO2 adder impact on resource selection: $15/ton (1990$) -- 1,735 5,724 3,501 CO2 adder impact on resource selection: $20/ton (1990$) -- 1,722 5,745 3,488 Low wind capital cost 3,535 1,790 5,708 3,546 High wind capital cost 3,584 1,789 5,687 3,595
Table C.13 – Wind Resources Accrued by 2016 (Nameplate Megawatts)
Alternative Future Scenario Used
Name
Business As Usual
(CAF00)
Low Cost Bookend (CAF14)
High Cost Bookend (CAF15)
Medium Load
Growth (CAF11)
Plan to 12% capacity reserve margin 200 400 2,100 600 Plan to 18% capacity reserve margin 1,300 400 2,400 1,500 CO2 adder implementation in 2016 -- -- -- 400 Regional transmission project -- -- -- 900 CO2 adder impact on resource selection: $10/ton (1990$) -- 400 600 1,200 CO2 adder impact on resource selection: $15/ton (1990$) -- 400 800 600 CO2 adder impact on resource selection: $20/ton (1990$) -- 600 2,300 2,800 Low wind capital cost 1,300 500 3,200 2,000 High wind capital cost 200 400 3,100 500

PacifiCorp – 2007 IRP Appendix C – Detailed CEM Modeling Results
109
Table C.14 – Gas Resources Accrued by 2016 (Megawatts)
Alternative Future Scenario Used
Name
Business As Usual
(CAF00)
Low Cost Bookend (CAF14)
High Cost Bookend (CAF15)
Medium Load
Growth (CAF11)
Plan to 12% capacity reserve margin 25 25 849 125 Plan to 18% capacity reserve margin 125 548 1,631 734 CO2 adder implementation in 2016 -- -- -- 125 Regional transmission project -- -- -- 125 CO2 adder impact on resource selection: $10/ton (1990$) -- 302 1,361 1,029 CO2adder impact on resource selection: $15/ton (1990$) -- 125 1,336 1,236 CO2adder impact on resource selection: $20/ton (1990$) -- 125 1,211 1,361 Low wind capital cost 50 75 1,029 402 High wind capital cost 602 75 849 684
Table C.15 – Pulverized Coal Resources Accrued by 2016 (Megawatts)
Alternative Future Scenario Used
Name
Business As Usual
(CAF00)
Low Cost Bookend (CAF14)
High Cost Bookend (CAF15)
Medium Load
Growth (CAF11)
Plan to 12% capacity reserve margin 1,690 -- 2,440 1,350 Plan to 18% capacity reserve margin 1,690 -- 2,440 1,690 CO2 adder implementation in 2016 -- -- -- 1,690 Regional transmission project -- -- -- 1,690 CO2 adder impact on resource selection: $10/ton (1990$) -- -- 2,440 1,090 CO2 adder impact on resource selection: $15/ton (1990$) -- -- 2,440 750 CO2 adder impact on resource selection: $20/ton (1990$) -- -- 2,440 -- Low wind capital cost 1,690 750 2,440 1,350 High wind capital cost 1,690 750 2,440 1,350
Table C.16 – IGCC Resources Accrued by 2016 (Megawatts)
Alternative Future Scenario Used
Name
Business As Usual
(CAF00)
Low Cost Bookend (CAF14)
High Cost Bookend (CAF15)
Medium Load
Growth (CAF11)
Plan to 12% capacity reserve margin 200 -- 500 200 Plan to 18% capacity reserve margin 200 -- 500 -- CO2 adder implementation in 2016 -- -- -- 200 Regional transmission project -- -- -- -- CO2 adder impact on resource selection: $10/ton (1990$) -- -- 1,494 -- CO2 adder impact on resource selection: $15/ton (1990$) -- -- 997 -- CO2 adder impact on resource selection: $20/ton (1990$) -- -- 500 -- Low wind capital cost 200 -- 500 -- High wind capital cost -- -- 500 --

PacifiCorp – 2007 IRP Appendix C – Detailed CEM Modeling Results
110
For the detailed CEM results tables, fossil fuel resource additions are reported as nameplate mega-watts accrued as of the year listed. Wind resources are reported as the estimated megawatt peak ca-pacity contribution accrued as of the year listed. The annual figures are not additive. Contract quanti-ties were also grossed up by the planning reserve margin to reflect the assumption that contract pur-chases are firm.
Table C.17 – CEM Results: Aggregate Resource Additions Resource Additions (MW)
Scenario PVRR
(millions) 2007 2008 2009 2010 2011 2012 2013 2014 2015 2016
PVRR (Million$/ 2016 MW)
BAU/ 12% PRM $ 19,488 45 486 449 978 1,263 2,431 2,880 2,972 3,046 3,327 5.9
BAU/ 18% PRM $ 19,933 271 1,002 975 1,496 1,789 2,881 3,185 3,456 3,543 3,831 5.2
BAU/Low Wind Cap
Cost $ 19,424 236 749 715 1,237 1,528 2,693 3,174 3,443 3,243 3,535 5.5
BAU/High Wind Cap
Cost $ 19,867 45 748 722 1,236 1,523 2,683 2,855 3,231 3,302 3,584 5.5
Low Cost Bookend/ 12% PRM
$ 13,382 68 142 68 296 416 1,413 1,404 1,489 1,406 1,507 8.9
Low Cost Bookend/ 18% PRM
$ 13,672 106 681 475 831 943 1,950 1,938 2,025 1,927 2,028 6.7
Low Cost Bookend/ $10 CO2
$ 19,803 68 424 211 576 688 1,680 1,672 1,759 1,674 1,775 11.2
Low Cost Bookend/ $15 CO2
$ 22,303 85 423 209 575 673 1,653 1,641 1,724 1,640 1,735 12.9
Low Cost Bookend/ $20 CO2
$ 24,589 98 422 209 572 659 1,652 1,638 1,722 1,638 1,722 14.3
Low Cost Bookend/ Low Wind Cap Cost
$ 13,523 122 420 207 572 691 1,670 1,662 1,722 1,634 1,790 7.6
Low Cost Bookend/
High Wind Cap Cost
$ 13,703 45 425 209 575 694 1,669 1,660 1,711 1,632 1,789 7.7
High Cost Bookend/ 12% PRM
$ 48,825 - 839 1,008 1,724 2,233 3,528 3,911 4,399 4,738 5,338 9.1
High Cost Bookend/ 18% PRM
$ 49,936 82 1,404 1,565 2,308 2,837 4,158 4,506 5,283 5,521 6,068 8.2
High Cost Bookend/ $10 CO2
$ 39,693 82 1,109 1,268 2,001 2,511 3,828 4,237 4,907 5,137 6,010 6.6
High Cost Bookend/ $15 CO2
$ 44,773 72 1,108 1,267 1,999 2,510 3,808 4,204 4,653 5,143 5,724 7.8
High Cost Bookend/ $20 CO2
$ 49,234 82 1,109 1,268 2,001 2,511 3,838 4,259 4,917 5,172 5,745 8.6

PacifiCorp – 2007 IRP Appendix C – Detailed CEM Modeling Results
111
Resource Additions (MW)
Scenario PVRR
(millions) 2007 2008 2009 2010 2011 2012 2013 2014 2015 2016
PVRR (Million$/ 2016 MW)
Low Cost Bookend/ Low Wind Cap Cost
$ 47,018 368 1,130 1,298 2,031 2,528 3,863 4,211 4,661 5,152 5,708 8.2
Low Cost Bookend/
High Wind Cap Cost
$ 48,123 226 1,106 1,270 1,995 2,511 3,778 4,158 4,645 5,090 5,687 8.5
Note: Business as Usual (BAU) Table C.18 – CEM Results: Wind Resource Additions (Nameplate MW) Scenario 2007 2008 2009 2010 2011 2012 2013 2014 2015 2016
BAU/ 12% PRM 200 200 200 200 200 200 200 200 200 200
BAU/ 18% PRM 1,200 1,300 1,300 1,300 1,300 1,300 1,300 1,300 1,300 1,300
BAU/ Low Wind Cap Cost 1,100 1,300 1,300 1,300 1,300 1,300 1,300 1,300 1,300 1,300
BAU/ High Wind Cap Cost 200 200 200 200 200 200 200 200 200 200
Low Cost Bookend/ 12% PRM 300 300 300 300 300 300 300 400 400 400
Low Cost Bookend/ 18% PRM 400 400 400 400 400 400 400 400 400 400
Low Cost Bookend/ $10 CO2
300 300 300 300 300 300 400 400 400 400
Low Cost Bookend/ $15 CO2
400 400 400 400 400 400 400 400 400 400
Low Cost Bookend/ $20 CO2
500 500 500 500 500 500 500 600 600 600
Low Cost Bookend/ Low Wind Cap Cost 500 500 500 500 500 500 500 500 500 500
Low Cost Bookend/ High Wind Cap Cost 200 200 300 300 300 300 300 400 400 400
High Cost Bookend/ 12% PRM - 200 300 300 300 600 600 600 1,400 2,100
High Cost Bookend/ 18% PRM 300 300 300 300 300 400 400 400 600 2,400
High Cost Bookend/ $10 CO2
300 300 300 300 300 400 400 400 600 600
High Cost Bookend/ $15 CO2
300 300 300 300 300 400 400 400 600 800
High Cost Bookend/ $20 CO2
300 300 300 300 300 400 400 400 800 2,300
Low Cost Bookend/ Low Wind Cap Cost 2,200 2,800 2,800 2,800 2,800 2,800 2,800 3,100 3,100 3,200
Low Cost Bookend/ High Wind Cap Cost 1,000 1,000 1,000 1,000 1,000 2,000 2,100 3,000 3,100 3,100

PacifiCorp – 2007 IRP Appendix C – Detailed CEM Modeling Results
112
Table C.19 – CEM Results: Front Office Transactions Figures shown are megawatts acquired in each year, Contract quantities were grossed up by the planning reserve margin to reflect the assumption that contract purchases are firm. Annual figures are not additive. Scenario 2007 2008 2009 2010 2011 2012 2013 2014 2015 2016
BAU/12% PRM - 440 404 933 1,218 1,380 1,079 1,171 1,244 1,326
BAU/18% PRM - 719 692 1,213 1,505 1,380 934 1,205 1,291 1,380 BAU/
Low Wind Cap Cost - 499 465 987 1,278 1,380 1,111 1,380 1,180 1,272
BAU/ High Wind Cap Cost - 703 676 1,190 1,478 1,096 1,267 894 965 1,247
Low Cost Bookend/ 12% PRM - 74 - 228 347 1,337 1,328 1,377 1,294 1,370
Low Cost Bookend/ 18% PRM - 575 369 726 837 1,296 1,285 1,372 1,273 1,374
Low Cost Bookend/ $10 CO2
- 355 143 507 620 1,310 1,274 1,362 1,277 1,378
Low Cost Bookend/ $15 CO2
- 338 124 490 588 1,373 1,360 1,369 1,285 1,380
Low Cost Bookend/ $20 CO2
- 324 112 474 561 1,380 1,366 1,380 1,296 1,380
Low Cost Bookend/ Low Wind Cap Cost - 298 85 450 569 1,378 1,370 1,380 1,291 698
Low Cost Bookend/ High Wind Cap Cost - 380 127 492 612 1,362 1,352 1,380 1,302 708
High Cost Bookend/ 12% PRM - 791 914 1,631 1,728 1,380 1,013 1,002 1,244 995
High Cost Bookend/ 18% PRM - 1,303 1,136 1,879 2,294 1,363 210 488 690 971
High Cost Bookend/ $10 CO2
- 1,027 1,160 1,874 2,083 1,380 1,038 459 674 553
High Cost Bookend/ $15 CO2
- 1,036 1,195 1,908 2,111 1,377 1,022 972 697 749
High Cost Bookend/ $20 CO2
- 1,027 1,160 1,874 2,083 1,380 1,051 459 649 987
Low Cost Bookend/ Low Wind Cap Cost - 679 846 1,561 1,153 1,370 968 856 597 1,107
Low Cost Bookend/ High Wind Cap Cost - 880 1,019 1,725 2,175 1,380 1,009 914 1,342 1,189

PacifiCorp – 2007 IRP Appendix C – Detailed CEM Modeling Results
113
Table C.20 – CEM Results: Gas Additions, Including Combined Heat and Power (Nameplate MW) Scenario 2007 2008 2009 2010 2011 2012 2013 2014 2015 2016
BAU/ 12% PRM - - - - - 25 25 25 25 25
BAU/ 18% PRM - - - - - 125 125 125 125 125
BAU/ Low Wind Cap
Cost - - - - - 50 50 50 50 50
BAU/ High Wind Cap
Cost - - - - - 602 602 602 602 602
Low Cost Bookend/ 12% PRM - - - - - - - - - 25
Low Cost Bookend/ 18% PRM - - - - - 548 548 548 548 548
Low Cost Bookend/ $10 CO2
- - - - - 302 302 302 302 302
Low Cost Bookend/ $15 CO2
- - - - - 50 50 125 125 125
Low Cost Bookend/ $20 CO2
- - - - - 75 75 125 125 125
Low Cost Bookend/ Low Wind Cap
Cost - - - - - 25 25 75 75 75
Low Cost Bookend/ High Wind Cap
Cost - - - - - 75 75 75 75 75
High Cost Book-end/
12% PRM - - 25 25 417 849 849 849 849 849
High Cost Book-end/
18% PRM - - 327 327 327 1,631 1,631 1,631 1,631 1,631
High Cost Book-end/
$10 CO2 - - 25 25 327 1,361 1,361 1,361 1,361 1,361
High Cost Book-end/
$15 CO2 - - - - 302 1,336 1,336 1,336 1,336 1,336
High Cost Book-end/
$20 CO2 - - 25 25 327 1,211 1,211 1,211 1,211 1,211
Low Cost Bookend/ Low Wind Cap
Cost - - - - 904 1,004 1,004 1,004 1,004 1,029
Low Cost Bookend/ High Wind Cap
Cost - - 25 25 25 849 849 849 849 849

PacifiCorp – 2007 IRP Appendix C – Detailed CEM Modeling Results
114
Table C.21 – CEM Results: IGCC Additions (Nameplate MW)
Scenario 2007 2008 2009 2010 2011 2012 2013 2014 2015 2016
BAU/ 12% PRM - - - - - - - - - 200
BAU/ 18% PRM - - - - - - - - - 200
BAU/Low Wind Cap Cost - - - - - - - - - 200
BAU/High Wind Cap Cost - - - - - - - - - -
Low Cost Bookend/ 12% PRM - - - - - - - - - -
Low Cost Bookend/ 18% PRM - - - - - - - - - -
Low Cost Bookend/ $10 CO2
- - - - - - - - - -
Low Cost Bookend/ $15 CO2
- - - - - - - - - -
Low Cost Bookend/ $20 CO2
- - - - - - - - - -
Low Cost Bookend/ Low Wind Cap
Cost - - - - - - - - - -
Low Cost Bookend/ High Wind Cap
Cost - - - - - - - - - -
High Cost Book-end/
12% PRM - - - - - - - 500 500 500
High Cost Book-end/
18% PRM - - - - - - - 500 500 500
High Cost Book-end/
$10 CO2 - - - - - - - 500 500 1,494
High Cost Book-end/
$15 CO2 - - - - - - - 500 500 997
High Cost Book-end/
$20 CO2 - - - - - - - 500 500 500
Low Cost Bookend/ Low Wind Cap
Cost - - - - - - - 500 500 500
Low Cost Bookend/ High Wind Cap
Cost - - - - - - - 500 500 500

PacifiCorp – 2007 IRP Appendix C – Detailed CEM Modeling Results
115
Table C.22 – CEM Results: Pulverized Coal Additions (Nameplate MW) Scenario 2007 2008 2009 2010 2011 2012 2013 2014 2015 2016
BAU/ 12% PRM - - - - - 940 1,690 1,690 1,690 1,690
BAU/ 18% PRM - - - - - 940 1,690 1,690 1,690 1,690
BAU/ Low Wind Cap
Cost - - - - - 940 1,690 1,690 1,690 1,690
BAU/ High Wind Cap
Cost - - - - - 940 940 1,690 1,690 1,690
Low Cost Bookend/ 12% PRM - - - - - - - - - -
Low Cost Bookend/ 18% PRM - - - - - - - - - -
Low Cost Bookend/ $10 CO2 - - - - - - - - - -
Low Cost Bookend/ $15 CO2
- - - - - - - - - -
Low Cost Bookend/ $20 CO2
- - - - - - - - - -
Low Cost Bookend/ Low Wind Cap
Cost - - - - - - - - - 750
Low Cost Bookend/ High Wind Cap
Cost - - - - - - - - - 750
High Cost Book-end/
12% PRM - - - - - 940 1,690 1,690 1,690 2,440
High Cost Book-end/
18% PRM - - - - - 940 2,440 2,440 2,440 2,440
High Cost Book-end/
$10 CO2 - - - - - 940 1,690 2,440 2,440 2,440
High Cost Book-end/
$15 CO2 - - - - - 940 1,690 1,690 2,440 2,440
High Cost Book-end/
$20 CO2 - - - - - 940 1,690 2,440 2,440 2,440
Low Cost Bookend/ Low Wind Cap
Cost - - - - - 940 1,690 1,690 2,440 2,440
Low Cost Bookend/ High Wind Cap
Cost - - - - - 940 1,690 1,690 1,690 2,440

PacifiCorp – 2007 IRP Appendix C – Detailed CEM Modeling Results
116
Table C.23 – CEM Results: Demand-side Management Additions (MW Capacity) Scenario 2007 2008 2009 2010 2011 2012 2013 2014 2015 2016
BAU/ 12% PRM - - - - - 41 41 41 41 41
BAU/ 18% PRM - - - - - 153 153 153 153 153
BAU/ Low Wind Cap Cost - - - - - 73 73 73 73 73
BAU/ High Wind Cap Cost - - - - - - - - - -
Low Cost Bookend/ 12% PRM - - - - - 7 7 7 7 7
Low Cost Bookend/ 18% PRM - - - - - - - - - -
Low Cost Bookend/ $10 CO2
- - - - - - - - - -
Low Cost Bookend/ $15 CO2
- - - - - 145 145 145 145 145
Low Cost Bookend/ $20 CO2
- - - - - 99 99 99 99 99
Low Cost Bookend/ Low Wind Cap Cost - - - - - 145 145 145 145 145
Low Cost Bookend/ High Wind Cap Cost - - - - - 150 150 150 150 150
High Cost Bookend/ 12% PRM - - - - 19 198 198 198 198 198
High Cost Bookend/ 18% PRM - 19 19 19 133 140 140 140 140 140
High Cost Bookend/ $10 CO2
- - - 19 19 46 46 46 46 46
High Cost Bookend/ $15 CO2
- - - 19 24 46 46 46 46 46
High Cost Bookend/ $20 CO2
- - - 19 19 198 198 198 198 198
Low Cost Bookend/ Low Wind Cap Cost - - - 19 19 97 97 97 97 97
Low Cost Bookend/ High Wind Cap Cost - - - 19 85 195 195 195 195 195

PacifiCorp – 2007 IRP Appendix D – Supplementary Portfolio Information
117
APPENDIX D – SUPPLEMENTARY PORTFOLIO INFORMATION
This appendix reports additional information for the risk analysis portfolios discussed in Chapter 7. This information consists of carbon dioxide emissions quantity and cost data, as well as a component cost breakdown of the stochastic mean Present Value of Revenue Requirements (PVRR) reported for the risk analysis portfolios.
CARBON DIOXIDE EMISSIONS
Table D.1 shows cumulative CO2 emissions for 2007 through 2026 attributable to retail sales only, allocated to each state. Table D.2 reports unit emission costs (cents/MWh) by new fossil fuel resource for the risk analy-sis portfolios considered as finalists for preferred portfolio selection (Group 2 portfolios). The results are reported for 2016 based on the $8/ton CO2 adder case. Table D.1 – CO2 Emissions Attributable to Retail Sales by State
Group 1 Portfolios CO2 Emissions attributable to Retail Sales, 2007-2026 (1000 Tons)
ID System Total California Oregon Washington Utah Idaho Wyoming RA1 1,120,694 17,481 262,468 85,363 500,054 65,432 189,897 RA2 1,111,948 17,342 260,377 84,678 496,227 64,910 188,413 RA3 1,115,336 17,388 261,003 84,889 498,000 65,073 188,984 RA4 1,121,824 17,494 262,636 85,420 500,715 65,475 190,084 RA5 1,115,003 17,388 261,047 84,899 497,671 65,077 188,920 RA6 1,104,309 17,228 258,687 84,122 492,675 64,484 187,112 RA7 1,089,439 16,997 255,229 82,988 486,009 63,619 184,596 RA8 1,128,175 17,594 264,156 85,917 503,490 65,854 191,163 RA9 1,123,075 17,517 263,001 85,538 501,159 65,564 190,296 RA10 1,119,534 17,462 262,184 85,270 499,558 65,360 189,699 RA11 1,109,867 17,308 259,850 84,508 495,373 64,779 188,049 RA12 1,110,384 17,320 260,043 84,566 495,486 64,824 188,146
Group 2 Portfolios
CO2 Emissions attributable to Retail Sales, 2007-2026 (1000 Tons) ID $8 Adder California Oregon Washington Utah Idaho Wyoming
RA13 1,127,571 17,586 264,045 85,886 503,165 65,828 191,061 RA14 1,064,710 16,624 249,713 81,179 474,567 62,234 180,393 RA15 1,068,540 16,683 250,584 81,465 476,315 62,453 181,041 RA16 1,057,885 16,517 248,100 80,652 471,557 61,832 179,227 RA17 1,075,848 16,796 252,296 82,027 479,570 62,881 182,278

PacifiCorp – 2007 IRP Appendix D – Supplementary Portfolio Information
118
Table D.2 – Unit Emission Costs for Group 2 Risk Analysis Portfolio Resources, 2016 SO2 Cost
NOX Cost
Hg Cost
CO2 Cost
Portfolio, Location, and Fossil Fuel Resources Generation
(GWh) Cents/MWh Portfolio RA13 East Utah supercritical pulverized coal 1,642 15.8 38.1 5.8 880.5 Wyoming supercritical pulverized coal 4,011 16.1 39.1 5.9 898.8 Utah supercritical pulverized coal 2 (added in 2017) - Wyoming supercritical pulverized coal 2 (added in 2018) - Combined Heat and Power 140 0.1 13.2 1.4 286.4 West Combined Heat and Power 395 0.1 13.1 1.4 287.0 Portfolio RA14 East Utah supercritical pulverized coal 1,584 15.8 38.1 5.8 880.5 Wyoming supercritical pulverized coal 3,864 16.1 39.1 5.9 898.8 Combined Cycle Combustion Turbine, F Class, 2x1 w/ duct firing 2,283 0.1 4.8 2.0 411.5 Combined Cycle Combustion Turbine, G Class, 1x1 w/ duct firing 1,571 0.1 4.8 2.0 405.7 Combined Heat and Power 143 0.1 13.2 1.4 286.4 West Combined Cycle Combustion Turbine, F Class, 2x1 w/ duct firing 2,086 0.1 4.8 2.0 416.6 Combined Heat and Power 402 0.1 13.1 1.4 287.0 Portfolio RA15 East Utah supercritical pulverized coal 1,607 15.8 38.1 5.8 880.5 Wyoming supercritical pulverized coal 3,926 16.1 39.1 5.9 898.8 Combined Cycle Combustion Turbine, F Class, 2x1 w/ duct firing 2,382 0.1 4.8 2.0 411.5 Combined Heat & Power 142 0.1 13.2 1.4 286.4 West Combined Cycle Combustion Turbine, F Class, 2x1 w/ duct firing 1,956 0.1 4.8 2.0 416.6 Combined Heat and Power 392 0.1 13.1 1.4 287.0 Portfolio RA16 East Utah supercritical pulverized coal 1,544 15.8 38.1 5.8 880.5 Wyoming supercritical pulverized coal 3,821 16.1 39.1 5.9 898.8 Combined Cycle Combustion Turbine, F Class, 2x1 w/ duct firing 2,320 0.1 4.8 2.0 411.5 Combined Cycle Combustion Turbine, F Class, 2x1 w/ duct firing 2,320 0.1 4.8 2.0 411.5 Combined Heat and Power 143 0.1 13.2 1.4 286.4 West Combined Cycle Combustion Turbine, F Class, 2x1 w/ duct firing 2,058 0.1 4.8 2.0 416.6 Combined Heat and Power 401 0.1 13.1 1.4 287.0 Portfolio RA17 East Utah supercritical pulverized coal 1,651 15.8 38.1 5.8 880.5 Wyoming supercritical pulverized coal 4,044 16.1 39.1 5.9 898.8 Combined Heat & Power 141 0.1 13.2 1.4 286.4 West Combined Cycle Combustion Turbine, F Class, 2x1 w/ duct firing 1,836 0.1 4.8 2.0 416.6 Combined Heat and Power 382 0.1 13.1 1.4 287.0

PacifiCorp – 2007 IRP Appendix D – Supplementary Portfolio Information
119
Figures D.1 and D.2 show the CO2 intensity (as measured by CO2 tons produced per megawatt-hours generated) for the Group 2 portfolios in the $8/ton and $61/ton CO2 adder cases from 2007 through 2016. Figure D.1 – Annual CO2 Intensity, 2007-2016 ($8 CO2 Adder Case) (From generation plus amount assigned to net wholesale market purchases)
0.700
0.750
0.800
0.850
0.900
0.950
1.000
2007 2008 2009 2010 2011 2012 2013 2014 2015 2016
CO
2 to
ns /
MW
h
RA13 RA14 RA15 RA16 RA17

PacifiCorp – 2007 IRP Appendix D – Supplementary Portfolio Information
120
Figure D.2 – Annual CO2 Intensity, 2007-2016 ($61 CO2 Adder Case) (From generation plus amount assigned to net wholesale market purchases)
0.700
0.750
0.800
0.850
0.900
0.950
1.000
2007 2008 2009 2010 2011 2012 2013 2014 2015 2016
CO
2 to
ns /
MW
h
RA13 RA14 RA15 RA16 RA17
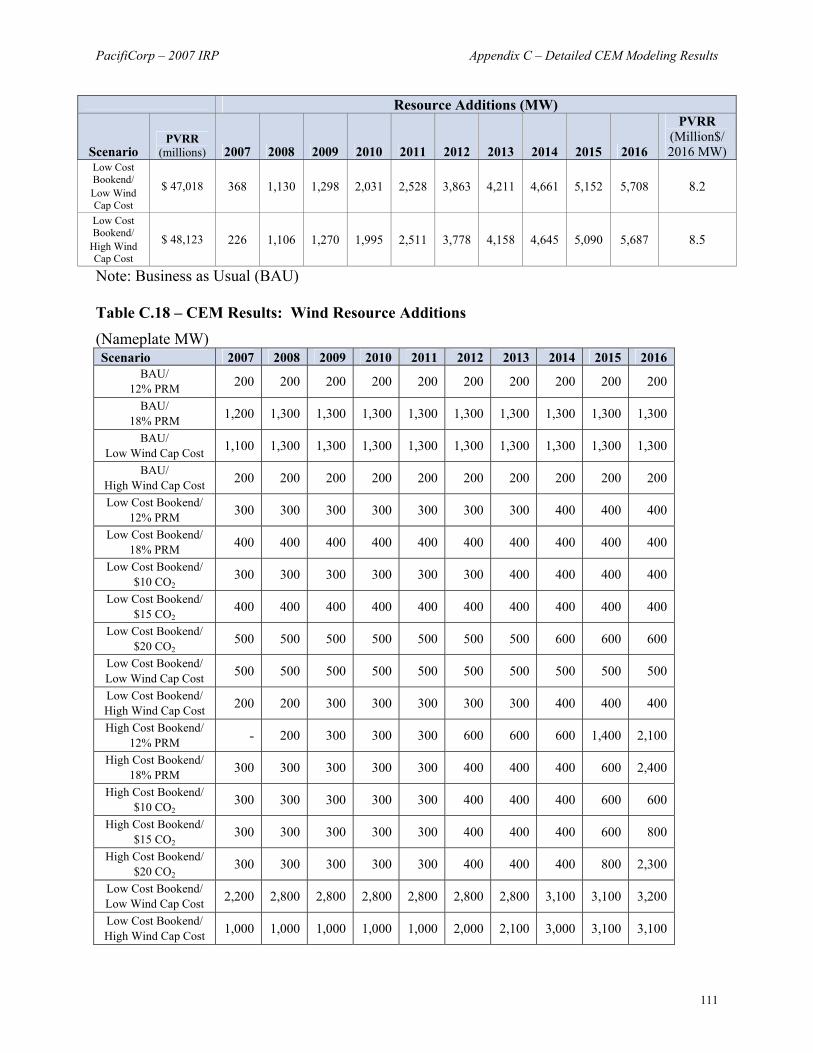
Paci
fiCor
p –
2007
IRP
Ap
pend
ix D
– S
uppl
emen
tary
Por
tfolio
Info
rmat
ion
12
1
POR
TFO
LIO
PV
RR
CO
ST C
OM
PON
EN
T C
OM
PAR
ISO
N
Tabl
es D
.3 th
roug
h D
.5 s
how
s th
e br
eakd
own
of e
ach
portf
olio
’s s
toch
astic
mea
n PV
RR
by
varia
ble
and
fixed
cos
t com
pone
nts.
Thes
e co
sts
refle
ct th
e $8
/ton
CO
2 cos
t add
er s
cena
rio. T
able
D.3
repo
rts G
roup
1 ri
sk a
naly
sis
portf
olio
s as
sum
ing
a ca
p-an
d-tra
de c
ompl
ianc
e st
rate
gy a
s de
scrib
ed in
the
Envi
ronm
enta
l Ext
erna
lity
Cos
t sec
tion
of C
hapt
er 6
. Tab
les
D.4
and
D.5
rep
ort t
he c
ost c
ompo
nent
bre
ak-
dow
n fo
r Gro
up 2
risk
ana
lysi
s por
tfolio
s for
bot
h th
e C
O2 c
ap-a
nd-tr
ade
and
tax
com
plia
nce
stra
tegi
es.
Tab
le D
.3 –
Gro
up 1
: Por
tfol
io P
VR
R C
ost C
ompo
nent
s (C
ap-a
nd-T
rade
Str
ateg
y)
Cos
t Com
pone
nt ($
000)
R
A1
RA
2 R
A3
RA
4 R
A5
RA
6 V
aria
ble
Cos
t To
tal F
uel C
ost
10,9
65,9
89
11,2
19,6
57
10,7
47,2
03
11,0
71,6
18
10,8
63,8
19
11,4
66,5
19
Var
iabl
e O
&M
Cos
t 1,
666,
016
1,68
8,45
6 1,
653,
825
1,68
5,17
0 1,
664,
323
1,60
9,74
8 To
tal E
mis
sion
Cos
t (4
91,4
56)
(524
,670
)(5
83,5
81)
(494
,617
) (5
41,9
09)
(633
,384
)Lo
ng
Term
C
ontra
cts
and
Fron
t Off
ice
Tran
sact
ions
4,
063,
902
2,98
9,76
9 3,
993,
441
2,78
4,53
9 2,
990,
020
3,94
2,40
3 Sp
ot M
arke
t Bal
anci
ng
Sale
s (7
,171
,405
)(6
,701
,180
)(7
,028
,212
)(6
,484
,120
) (6
,654
,682
)(6
,790
,395
)Pu
rcha
ses
4,09
7,60
5 4,
256,
922
4,15
6,08
3 4,
506,
043
4,06
4,02
3 4,
526,
764
Ener
gy N
ot S
erve
d 62
9,17
5 50
6,35
8 57
8,21
8 59
9,32
5 40
7,71
3 64
9,40
2 T
otal
Var
iabl
e
Net
Pow
er C
osts
13
,759
,825
13
,435
,313
13
,516
,978
13
,667
,958
12
,793
,306
14
,771
,056
Rea
l Lev
eliz
ed F
ixed
Cos
ts
7,58
5,99
4 8,
078,
725
7,99
8,11
9 7,
821,
194
9,44
4,52
8 7,
541,
457
Tot
al P
VR
R
21,3
45,8
20
21,5
14,0
38
21,5
15,0
97
21,4
89,1
52
22,2
37,8
34
22,3
12,5
13

Paci
fiCor
p –
2007
IRP
Ap
pend
ix D
– S
uppl
emen
tary
Por
tfolio
Info
rmat
ion
12
2
Cos
t Com
pone
nt ($
000)
R
A7
RA
8 R
A9
RA
10
RA
11
RA
12
Var
iabl
e C
ost
Tota
l Fue
l Cos
t 11
,011
,967
10
,861
,455
10
,650
,718
10
,807
,128
10
,476
,806
10
,584
,210
V
aria
ble
O&
M C
ost
1,66
2,83
6 1,
661,
127
1,60
0,40
5 1,
621,
957
1,62
6,32
5 1,
625,
553
Tota
l Em
issi
on C
ost
(615
,865
)(4
93,4
80)
(528
,346
)(5
17,4
75)
(576
,401
)(5
83,0
10)
Long
Te
rm
Con
tract
s an
d Fr
ont O
ffic
e Tr
ansa
ctio
ns
2,98
6,55
1 3,
765,
884
3,85
5,18
2 4,
014,
157
3,91
4,85
6 3,
572,
191
Spot
Mar
ket B
alan
cing
Sa
les
(6,7
55,4
34)
(6,8
13,2
14)
(6,8
40,7
73)
(7,0
64,9
78)
(7,0
13,1
25)
(6,7
51,0
45)
Purc
hase
s 4,
138,
731
4,55
2,75
0 4,
467,
441
4,14
0,30
6 4,
167,
820
4,45
6,95
1 En
ergy
Not
Ser
ved
496,
355
738,
005
823,
267
698,
510
583,
165
695,
599
Tot
al V
aria
ble
N
et P
ower
Cos
ts
12,9
25,1
42
14,2
72,5
26
14,0
27,8
95
13,6
99,6
05
13,1
79,4
47
13,6
00,4
49
Rea
l Lev
eliz
ed F
ixed
Cos
ts
8,71
7,10
3 7,
199,
096
7,93
5,84
7 8,
182,
478
8,58
9,96
8 8,
153,
395
Tot
al P
VR
R
21,6
42,2
45
21,4
71,6
22
21,9
63,7
42
21,8
82,0
83
21,7
69,4
15
21,7
53,8
44
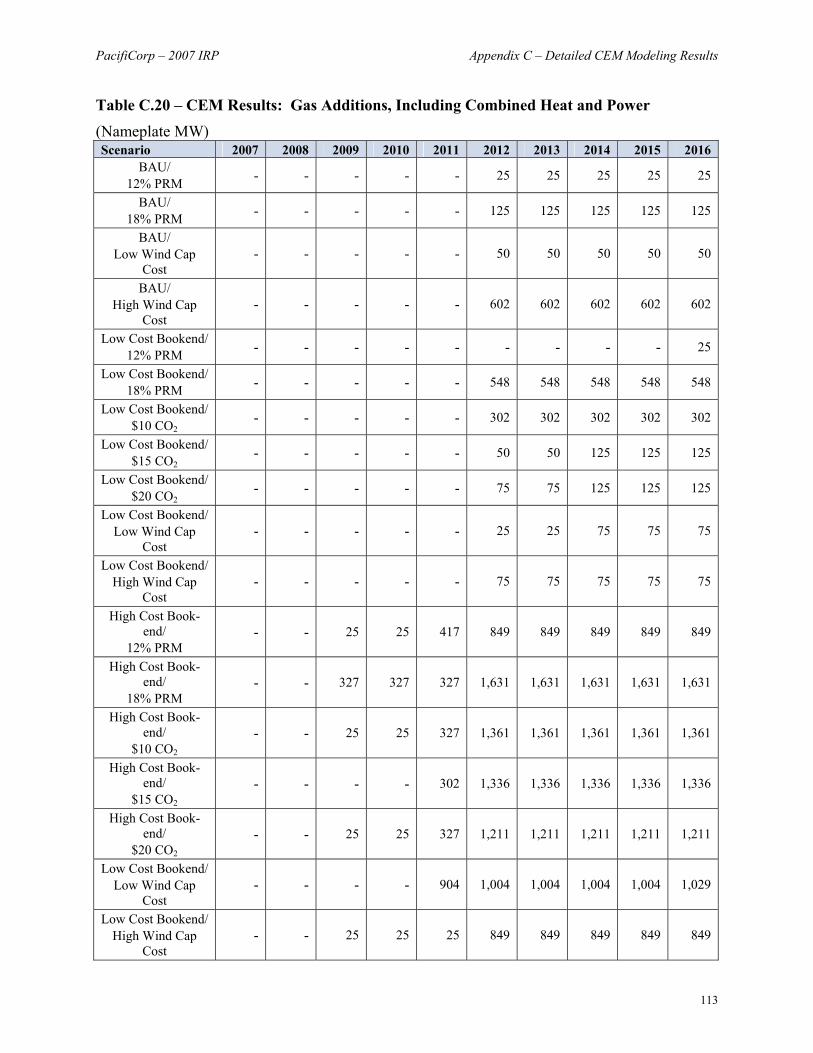
Paci
fiCor
p –
2007
IRP
Ap
pend
ix D
– S
uppl
emen
tary
Por
tfolio
Info
rmat
ion
12
3
Tab
le D
.4 –
Gro
up 2
: Por
tfol
io P
VR
R C
ost C
ompo
nent
s (C
O2 C
ap-a
nd-T
rade
Com
plia
nce
Stra
tegy
)
Cos
t Com
pone
nt ($
000)
R
A13
R
A14
R
A15
R
A16
R
A17
V
aria
ble
Cos
t To
tal F
uel C
ost
11,8
79,7
24
12,7
40,4
75
12,6
87,0
88
12,8
93,1
87
12,4
96,3
22
Var
iabl
e O
&M
Cos
t 1,
677,
644
1,68
8,63
9 1,
686,
253
1,
695,
132
1,67
5,58
5 To
tal E
mis
sion
Cos
t (5
00,7
40)
(686
,096
)(6
75,1
64)
(707
,522
)(6
60,7
52)
Long
Ter
m C
ontra
cts
and
Fron
t O
ffic
e Tr
ansa
ctio
ns
4,46
3,92
4 3,
381,
073
3,49
8,01
5
3,40
0,55
6 3,
959,
801
Spot
Mar
ket B
alan
cing
Sa
les
(7,9
70,5
03)
(8,1
39,5
26)
(8,1
29,5
46)
(8,3
11,1
08)
(8,1
56,9
26)
Purc
hase
s 5,
011,
221
4,78
1,17
6 4,
805,
009
4,
626,
554
4,85
8,92
5 En
ergy
Not
Ser
ved
942,
290
546,
119
614,
736
50
4,48
9 67
0,81
4 T
otal
Var
iabl
e
Net
Pow
er C
osts
15
,503
,559
14
,311
,859
14
,486
,390
14
,101
,289
14
,843
,769
Rea
l Lev
eliz
ed F
ixed
Cos
ts
6,50
6,39
4 7,
247,
005
7,14
5,76
0
7,52
3,53
7 6,
906,
261
Tot
al P
VR
R
22,0
09,9
53
21,5
58,8
64
21,6
32,1
50
21,6
24,8
26
21,7
50,0
30

Paci
fiCor
p –
2007
IRP
Ap
pend
ix D
– S
uppl
emen
tary
Por
tfolio
Info
rmat
ion
12
4
Tab
le D
.5 –
Gro
up 2
: Por
tfol
io P
VR
R C
ost C
ompo
nent
s (C
O2 T
ax C
ompl
ianc
e St
rate
gy)
Cos
t Com
pone
nt ($
000)
R
A13
R
A14
R
A15
R
A16
R
A17
V
aria
ble
Cos
t To
tal F
uel C
ost
11,8
79,7
24
12,7
40,4
75
12,6
87,0
88
12,8
93,1
87
12,4
96,3
22
Var
iabl
e O
&M
Cos
t 1,
677,
644
1,68
8,63
9 1,
686,
253
1,
695,
132
1,67
5,58
5 To
tal E
mis
sion
Cos
t 4,
419,
596
4,23
2,88
3 4,
243,
852
4,
211,
342
4,25
8,30
7 Lo
ng T
erm
Con
tract
s an
d Fr
ont
Off
ice
Tran
sact
ions
4,
463,
924
3,38
1,07
3 3,
498,
015
3,
400,
556
3,95
9,80
1
Spot
Mar
ket B
alan
cing
Sa
les
(7,9
70,5
03)
(8,1
39,5
26)
(8,1
29,5
46)
(8,3
11,1
08)
(8,1
56,9
26)
Purc
hase
s 5,
011,
221
4,78
1,17
6 4,
805,
009
4,
626,
554
4,85
8,92
5 En
ergy
Not
Ser
ved
942,
290
546,
119
614,
736
50
4,48
9 67
0,81
4 T
otal
Var
iabl
e
Net
Pow
er C
osts
20
,423
,895
19
,230
,838
19
,405
,407
19
,020
,153
19
,762
,827
Rea
l Lev
eliz
ed F
ixed
Cos
ts
6,50
6,39
4 7,
247,
005
7,14
5,76
0
7,52
3,53
7 6,
906,
261
Tot
al P
VR
R
26,9
30,2
89
26,4
77,8
43
26,5
51,1
66
26,5
43,6
91
26,6
69,0
89

PacifiCorp – 2007 IRP Appendix E – Stochastic Risk Analysis Methodology
125
APPENDIX E – STOCHASTIC RISK ANALYSIS METHODOLOGY
OVERVIEW
PacifiCorp analyzes potential portfolios over possible future conditions to assess the perform-ance of each portfolio under uncertainty. Global Energy’s Planning and Risk (PaR) model is used to perform a stochastic assessment of portfolios in which system loads, hydroelectric energy availability, thermal unit outages, and wholesale electric and gas prices are varied to reflect un-certainty. Stochastic representations of these variables include specific volatility and correlations parameters. In the case of four of the five uncertainties described previously (PaR treats thermal outages separately), there are potentially short-term and long-term stochastic parameters (volatil-ities and correlations). The following is a discussion of the stochastic model specification, the short-term and long-term parameters and results of the stochastic simulation studies.
STOCHASTIC VARIABLES
PacifiCorp’s analysis is performed for the following stochastic variables: ● Fuel prices (natural gas prices for the company’s western and eastern control areas), ● Electricity market prices for Mid-Columbia (Mid C), California – Oregon Border (COB),
Four Corners, and Palo Verde (PV), ● Electric transmission area loads (California, Idaho, Oregon, Utah, Washington and Wyoming
regions) and ● Hydroelectric generation The PaR’s stochastic tool determines a set of stochastic model parameters based on data entered by the user. During model execution, PaR makes time path dependent Monte Carlo draws for each stochastic variable based on the input parameters. The Monte Carlo draws are of percent-age deviations from the expected forward value of the variables. In the case of natural gas prices, electricity prices and regional loads, PaR applies Monte Carlo draws on a daily basis. In the case of hydroelectric generation, Monte Carlo draws are applied on a weekly basis.
The PaR Stochastic Model
PaR’s stochastic model is a two factor (a short-run and a long-run factor) short-run mean revert-ing model. Variable processes assume normality or log-normality as appropriate. Separate vola-tility and correlation parameters are used for modeling the short-run and long-run factors. The short-run process defines seasonal effects on forward variables, while the long-run factor defines random structural effects on electricity and natural gas markets and retail load regions. The short-run process is designed to capture the seasonal patterns inherent in electricity and natural gas markets and seasonal pressures on electricity demand. Mean reversion represents the speed at which a disturbed variable will return to its seasonal expectation. With respect to market prices, the long-run factor should be understood as an expected equilibrium, with the Monte Carlo draws defining a possible forward equilibrium state. In the case of regional electricity loads, the Monte Carlo draws define possible forward paths for electricity demand. The short-run seasonal stochastic parameters are developed using a single period auto-regressive regression equation (commonly called an AR(1) process). The standard error of the seasonal
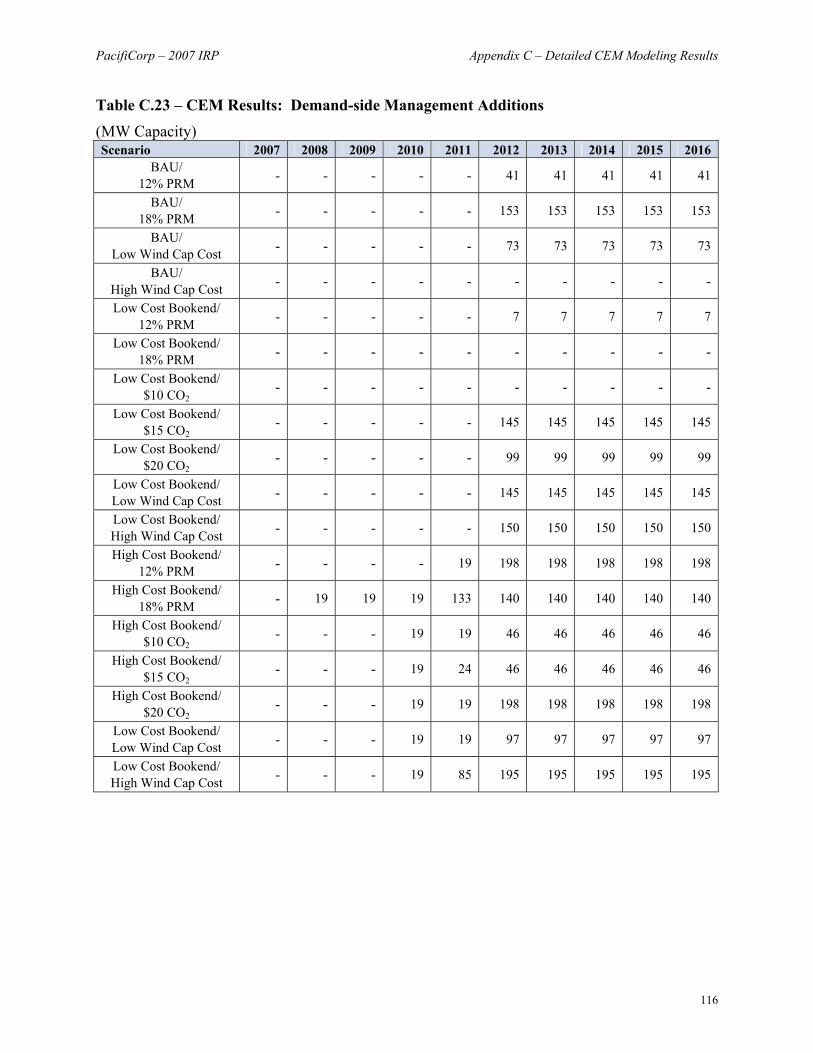
PacifiCorp – 2007 IRP Appendix E – Stochastic Risk Analysis Methodology
126
regression defines the short run volatility, while the regression coefficient for the AR(1) variable defines the mean reversion parameter. The short-run regression errors are correlated seasonally to capture inter-variable effects from informational exchanges between markets, inter-regional impacts from shocks to electricity demand and deviations from expected hydroelectric genera-tion performance. The long-run parameters are derived from a random-walk with drift regression. The standard error of the random-walk regression defines the long-run volatility for the regional electricity load variables. In the case of the natural gas and electricity market prices, the standard error of the random walk regression is interpolated with the volatilities from the company’s Official Forward Price curve for March 31, 2006 over the twenty year study period. The long-run regres-sion errors are correlated to capture inter-variable effects from changes to expected market equi-librium for natural gas and electricity markets as well as the impacts from changes in expected regional electricity loads. For a detailed specification of the PaR stochastic model, please refer to the 2004 IRP Appendix G.
STOCHASTIC OUTPUT
Presented below are graphical stylized outputs from the 100 stochastic iterations made by the Planning and Risk model. Eastern and western natural gas and electricity market prices (Figures E.1 through E.8) are presented showing the frequency of prices for 2007 and 2016. In the case of stochastic regional electricity loads (Figures E.9 through E.13), the 90th, 75th, 25th and 10th percentiles as well as the mean are presented. For hydroelectric generation (Figures E.14 and E.15), the 75th, 50th, 25th percentiles are presented. Figure E.1 – 2007 Frequency of Eastern (Palo Verde) Electricity Market Prices – 100 Iterations
51
2 1 1 - 1 - -
30
14
0
10
20
30
40
50
60
44 88 131 175 219 263 307 351 394 438$ / MWh
Freq
uenc
y of
Iter
atio
ns

PacifiCorp – 2007 IRP Appendix E – Stochastic Risk Analysis Methodology
127
Figure E.2 – 2016 Frequency of Eastern (Palo Verde) Electricity Market Prices – 100 Iterations
23
62 2 1 2 - 1
10
53
0
10
20
30
40
50
60
44 88 131 175 219 263 307 351 394 438$ / MWh
Freq
uenc
y of
Iter
atio
ns
Figure E.3 – 2007 Frequency of Western (Mid C) Electricity Market Prices – 100 Iterations
8
43
32
93 2 1 2 - -
0
10
20
30
40
50
60
28 57 85 114 142 171 199 228 256 285$ / MWh
Freq
uenc
y of
Iter
atio
ns
Figure E.4 – 2016 Frequency of Western (Mid C) Electricity Market Prices – 100 Iterations
3732
8 6 5 4 2 2 3 10
10
20
30
40
50
60
28 57 85 114 142 171 199 228 256 285
$ / MWh
Freq
uenc
y of
Iter
atio
ns

PacifiCorp – 2007 IRP Appendix E – Stochastic Risk Analysis Methodology
128
Figure E.5 – 2007 Frequency of Eastern Natural Gas Market Prices – 100 Iterations
- - - - - -410
4145
0
10
20
30
40
50
60
5 12 18 24 30 36 42 48 54 60$ / MMBtu
Freq
uenc
y of
Iter
atio
ns
Figure E.6 – 2016 Frequency of Eastern Natural Gas Market Prices – 100 Iterations
21
4- - - - 1
8 10
56
0
10
20
30
40
50
60
5 12 18 24 30 36 42 48 54 60$ / MMBtu
Freq
uenc
y of
Iter
atio
ns
Figure E.7 – 2007 Frequency of Western Natural Gas Market Prices – 100 Iterations
44
23
8
- 1 - - - -
24
0
10
20
30
40
50
60
5 10 15 20 25 31 36 41 46 51$ / MMBtu
Freq
uenc
y of
Iter
atio
ns

PacifiCorp – 2007 IRP Appendix E – Stochastic Risk Analysis Methodology
129
Figure E.8 – 2016 Frequency of Western Natural Gas Market Prices – 100 Iterations
51
23
9 74 3
- 2 - 10
10
20
30
40
50
60
5 10 15 20 25 31 36 41 46 51$ / MMBtu
Freq
uenc
y of
Iter
atio
ns
Figure E.9 – Goshen Loads
0
1,000
2,000
3,000
4,000
5,000
6,000
7,000
8,000
2007 2008 2009 2010 2011 2012 2013 2014 2015 2016 2017 2018 2019 2020 2021 2022 2023 2024 2025 2026
GW
h
90th 75th mean 25th 10th

PacifiCorp – 2007 IRP Appendix E – Stochastic Risk Analysis Methodology
130
Figure E.10 – Utah Loads
0
10,000
20,000
30,000
40,000
50,000
60,000
70,000
2007 2008 2009 2010 2011 2012 2013 2014 2015 2016 2017 2018 2019 2020 2021 2022 2023 2024 2025 2026
GW
h
90th 75th mean 25th 10th
Figure E.11 – Washington Loads
0
1,000
2,000
3,000
4,000
5,000
6,000
7,000
8,000
9,000
10,000
2007 2008 2009 2010 2011 2012 2013 2014 2015 2016 2017 2018 2019 2020 2021 2022 2023 2024 2025 2026
GW
h
90th 75th mean 25th 10th

PacifiCorp – 2007 IRP Appendix E – Stochastic Risk Analysis Methodology
131
Figure E.12 – West Main (California and Oregon) Loads
0
5,000
10,000
15,000
20,000
25,000
30,000
2007 2008 2009 2010 2011 2012 2013 2014 2015 2016 2017 2018 2019 2020 2021 2022 2023 2024 2025 2026
GW
h
90th 75th mean 25th 10th
Figure E.13 – Wyoming Loads
0
2,000
4,000
6,000
8,000
10,000
12,000
14,000
2007 2008 2009 2010 2011 2012 2013 2014 2015 2016 2017 2018 2019 2020 2021 2022 2023 2024 2025 2026
GW
h
90th 75th mean 25th 10th

PacifiCorp – 2007 IRP Appendix E – Stochastic Risk Analysis Methodology
132
Figure E.14 – 2007 Hydroelectric Generation Percentile
7,558
5,747
4,531
0
1,000
2,000
3,000
4,000
5,000
6,000
7,000
8,000
75th 50th 25th
GW
h
Figure E.15 – 2016 Hydroelectric Generation Percentile
4,051
5,115
6,699
0
1,000
2,000
3,000
4,000
5,000
6,000
7,000
8,000
75th 50th 25th
GW
h

PacifiCorp – 2007 IRP Appendix F – Public Input Process
133
APPENDIX F – PUBLIC INPUT PROCESS
A critical element of this resource plan is the public input process. PacifiCorp has pursued an open and collaborative approach involving the Commissions, customers and other stakeholders in PacifiCorp’s planning process prior to making resource planning decisions. Since these deci-sions can have significant economic and environmental consequences, conducting the resource plan with transparency and full participation from Commissions and other interested and affected parties is essential. The public has been involved in this resource plan from its earliest stages and at each decisive step. Participants have both shared comments and ideas and received information. As reflected in the report, many of the comments provided by the participants have been adopted by Pacifi-Corp and have contributed to the quality of this resource plan. PacifiCorp will adopt further comments going forward, either as elements of the Action Plan or as future refinements to the planning methodology. The cornerstone of the public input process has been full-day public input meetings held ap-proximately every six weeks throughout the year-long plan development period. These meetings have been held jointly in three locations, Salt Lake City, Portland and Cheyenne (Starting from the April 20, 2006), using telephone and video conferencing technology, to encourage wide par-ticipation while minimizing travel burdens and respecting everyone’s busy schedules. The 2007 public input meetings were augmented by a series of focused technical workshops to provide an opportunity to discuss complex topics for a multi-state utility in more detail.
PARTICIPANT LIST
Among the organizations that were represented and actively involved in this collaborative effort were:
Commissions
• Idaho Public Utilities Commission • Oregon Public Utilities Commission • Public Service Commission of Utah • Washington Utilities and Transportation Commission • Wyoming Public Service Commission
Intervenors
• Citizen’s Utility Board of Oregon • Committee for Consumer Services State of Utah • Energy Trust of Oregon • Energy Strategies, LLC • Industrial Customers of Northwest Utilities • Mountain West Consulting, LLC

PacifiCorp – 2007 IRP Appendix F – Public Input Process
134
• Northwest Energy Efficiency Alliance • Northwest Power and Conservation Council • NW Energy Coalition • Oregon Department of Energy • Renewables Northwest Project • Salt Lake City • Salt Lake Community Action Program • Southwest Energy Efficiency Project • Sierra Club , Utah Chapter • Utah Association of Energy Users • Utah Clean Energy Alliance • Utah Division of Air Quality • Utah Division of Public Utilities • Utah Energy Office • Utah Geological Survey • Utah Governor Office • Utah Legislative Watch • Wasatch Clean Air Coalition • Western Resource Advocates • West Wind Wires • Wyoming Industrial Energy Consumers • Wyoming Office Of Consumer Advocacy
Others
• Portland General Electric (PGE) • Puget Sound Energy (PSE) • Avista Utilities • Quantec LLC • John Klingele • Global Energy Decisions, LLC
PacifiCorp extends its gratitude for the time and energy these participants have given to the re-source plan. Your participation has contributed significantly to the quality of this plan, and your continued participation will help as PacifiCorp strives to improve its planning efforts going for-ward.
PUBLIC INPUT MEETINGS
PacifiCorp hosted eight full-day public input meetings, three technical workshops and three general meetings between the 2004 and 2007 IRP process which discussed various issues includ-ing inputs and assumptions, risks, modeling techniques, and analytical results. Below are the agendas from the public input meetings and the technical workshops.

PacifiCorp – 2007 IRP Appendix F – Public Input Process
135
2005 Public Process
May 18, 2005 – General Meeting • Results of IRP Stakeholder Satisfaction Survey • Overview of PacifiCorp Transmission • Procurement Update
- Implementation of Supply Side Actions in 2004 IRP Action Plan - Renewables RFP - RFP 2009 - Front Office Transactions
• DSM Update - DSM in the 2004 IRP - Class 1 and Class 2 Update - DSM Procurement
• Update on Inputs and Assumptions • Update on Models
- PaR Conversion - Capacity Expansion Module
August 3, 2005 – General Meeting • Load Forecasting Annual Review
- National Economic Outlook - Regional Economic Review - Tools and Inputs of the Residential Forecast - Preliminary Residential Sales Forecast
• IRP Benchmarking Study - Scope and Overview - Findings
• IRP Action Plan Update - RFP 2003 B Renewable - RFP 2009 - RFP 2011 - Transmission (Regional Initiatives) - DSM Update - CEM Model Update
• 2004 IRP Update Plan - Outline - Schedule
October 5, 2005 – General Meeting • Update on IRP Acknowledgement • Load and Resource Balance Update • New Portfolio Development / Overview of Analysis • Status of Update Filing • Progress on IRP Action Plan
- RFP 2003 B Renewable, RFP 2009

PacifiCorp – 2007 IRP Appendix F – Public Input Process
136
- DSM Update • Load Forecasting Technical Workshop - Annual Review
- Comparisons of State Economic Forecasts - Commercial Electric Model Design and Inputs - Preliminary Commercial Economic and Sales Forecast
2006 Public Process
December 7, 2005 – General Meeting • Overview of 2006 IRP Public Process
- IRP Team Update - 2006 IRP Work Plan - PIM Participant Working Group (“WG”) Approach - Public Process Expectations
• 2006 IRP Studies • 2004 IRP Update Summary and Revised Action Plan
January 13, 2006 – Renewables Workshop • Review and discuss Wind Resource Analysis Plan • Discuss Capacity Expansion Module (CEM) renewable supply curve modeling approach • Summary • Comments, Questions, and Suggestions • Z-Statistic Method for Estimating Resource Peak Load Carrying Capability
January 24, 2006 – Load Forecasting Workshop • Preliminary Industrial Energy Sales Forecast
- State by State Mix and Growth by Sector – 2007 and 2017 Sector by Sector Model Review
• Hourly Load Forecast - General Model Specification by Jurisdiction - Forecast Process - Improvements in the Process - System Coincident Peak Demand & Jurisdiction Contribution Results - State Peak Demands - Next Steps
• Price Elasticity - Price Elasticity in Current Models - Econometric Elasticity Calculations - Price Reaction of Customers Who Called About the Rate Change - Elasticity Among Customer Sub-Groups - Potential Further Research

PacifiCorp – 2007 IRP Appendix F – Public Input Process
137
February 10, 2006 – Demand-Side Management Workshop • 2004 IRP DSM modeling Review • Modeling Plan for 2006 IRP
- Planning Drivers and Objectives - Modeling Approach Overview - Program Assumptions for 2006 IRP
• 2005 DSM RFP Summary and Challenges • Summation and Next Steps
April 20, 2006 – General Meeting Update on IRP Inputs, Assumptions, and Studies
• Climate Change Policy Developments • CO2 Analysis in the 2006 IRP • Integrated Gasification Combined Cycle (IGCC) Analysis Update • Treatment of IGCC in the 2006 IRP • Long-Term Load Forecast • Preliminary Load & Resource Balance
May 10, 2006 – General Meeting • Natural Gas and Electricity Forecasts • Renewables Studies • Procurement Update
June 7, 2006 – General Meeting • Demand-Side Management: Class I & III Resource Assessment Update • Procurement Update: Demand-Side Management • Procurement Update: Supply-Side Resources • IRP Resource Alternatives • IRP Transmission Analysis Approach • Portfolio Analysis Scenarios and Risk Analysis • Resource Adequacy/Capacity Planning Margin
August 23, 2006 – General Meeting • Introduction: Capacity Expansion Module (CEM) Analysis • Scenario Review • General Observations
- Total Portfolio Costs - Generation, Demand-Side Management (DSM), and Market Purchases - Transmission - Sensitivity Studies
• CO2 Adder Impacts • Summary Results • Modeling Conclusions and Candidate Portfolio Development Process
Appendix: • Modeling Results - Annual Resource Additions by Scenario

PacifiCorp – 2007 IRP Appendix F – Public Input Process
138
October 31, 2006 – General Meeting • Candidate Portfolio Development • Detailed Simulation Results and Conclusions
- Stochastic Cost/Risk Trade-off Analysis Results - Reliability Analysis Results - CO2 emissions for $8/ton CO2 adder case
• Quantec DSM Proxy Supply Curve Study • Feedback on Capacity Expansion Module Results • IRP Document Overview
2007 Public Process
February 1, 2007 – General Meeting • Status of the Integrated Resource Plan • Status of the 2012 Request for Proposal • Conclusions resulting from stakeholder feedback • Proposed path forward • Impact on the current Integrated Resource Plan • Discussion and Comments
April 18, 2007 – General Meeting • Load Forecast Update
- Summary of Changes to Forecast - Changes in Economic Conditions - Major Sales Changes by Jurisdiction
• Load and Resource Balance Update • Preferred Portfolio • Action Plan • Portfolio Modeling Update
- Risk Analysis Portfolio Development - Cost and Risk Performance Results - Customer Rate Impacts - Carbon Dioxide Emissions Footprint - Supply Reliability Measures
• Class 2 DSM Decrement Analysis
PARKING LOT ISSUES
During the course of the public input meetings, certain concerns or questions needed additional explanation from PacifiCorp. These questions or issues were taken off-line or put in a “parking lot.” PacifiCorp either responded in writing in detail to address these parking lot issues, or in many cases, addressed them in a subsequent public input meeting or workshop. PacifiCorp re-sponded to different complex questions that covered all aspects of the IRP.

PacifiCorp – 2007 IRP Appendix F – Public Input Process
139
Additionally, for the 2007 planning cycle, PacifiCorp provided meeting summaries for each of the public meetings reflecting a synopsis of what was discussed during the meeting. These summaries can be found on the internet website (http://www.pacificorp.com/Arti-cle/Article23848.html) and provide additional details on a particular IRP public meeting.
PUBLIC REVIEW OF IRP DRAFT DOCUMENT
This section summarizes the substantive comments on the draft IRP document submitted by IRP public participants and provides PacifiCorp’s responses. The comments and responses are grouped by topic. At the public meeting held on October 31, 2006, the company requested that parties focus on compliance with state IRP standards and guidelines when submitting comments on the draft IRP. PacifiCorp distributed the IRP draft document for public comment on April 20, 2007, with a comment due date of May 11, 2007. The company received comments from seven parties in time to be considered for the final IRP report: ● Utah Public Service Commission Staff (UPSC) ● The Utah Committee of Consumer Services (UCCS) ● The Utah Division of Public Utilities (UDPU) ● Utah Association of Energy Users (UAE) ● Western Resource Advocates (WRA) ● The NW Energy Coalition (NWEC) ● Renewable Northwest Project (RNP) To characterize the comments at a high level, parties sought justification for, or cited perceived deficiencies in, (1) the scope of resources evaluated and their characterization (DSM, renew-ables, and IGCC in particular), (2) the treatment and interpretation of modeled risk factors and reliability, and (3) the decision criteria used to select preferred portfolio resources. A number of parties also submitted detailed questions and requests for supporting data. To address the written comments, PacifiCorp modified the final IRP report to include more justi-fication of its analytical conclusions and resource decisions, and answered specific technical questions to the extent possible given the IRP filing schedule. PacifiCorp also supplemented the “IRP Regulatory Compliance” appendix with two tables that outline how the company inter-preted and complied with each of the IRP standards for Oregon and Utah (Tables I.3 and I.4 in Appendix I). The company considered the written comments when completing these tables. Re-sponses to questions and data requests that could not be included in the final IRP report or ad-dressed in this section will be handled as separate follow-up responses.
Portfolio Optimality A number of parties disagree with, or at least question, whether the preferred portfolio develop-ment process meets Utah IRP standards and Guidelines with respect to “selection of the optimal set of resources given the expected combination of costs, risk and uncertainty.” For example, the UPSC asked for clarification on how the company’s statement in Chapter 2 —“The emphasis of

PacifiCorp – 2007 IRP Appendix F – Public Input Process
140
the IRP is to determine the most robust resource plan under a reasonably wide range of potential futures as opposed to the optimal plan for some expected view of the future”—is consistent with this guideline. The UCCS states that they are not convinced of the optimality of the preferred portfolio. The UPSC and UAE believe that fixing resources for the CEM results in suboptimal resource selection. For example, the UAE states that the Group 2 portfolios appear to be subop-timal because the CEM was used to determine the build pattern of gas plants and front office transactions, while coal and wind resources were set. WRA, on the other hand, states that model results should not be used as an alternative to informed judgment and critical thinking. Response: PacifiCorp agrees with WRA that modeling results should not be used as the sole basis for determining an optimal portfolio given the multi-objective and subjective nature of the resource planning exercise. PacifiCorp’s model solutions are dependent on model structure and the underlying assumptions. Thus, model results need to be interpreted in the light of real-world considerations. One of these considerations, cited in Chapter 7, are resource decision constraints resulting from new and expected state resource policies. In the context of capacity expansion modeling with the CEM, any one model solution is only optimal for the single set of assumptions used for the associated model run and should not be considered optimal in any broader sense due to the deterministic nature of the model and the single set of input assumptions. In contrast, the role of the Planning and Risk model has been to determine the stochastic cost and risk impacts of alternative resource strategies, not to determine an optimal portfolio from a stochastic simulation standpoint. These two models together, with their different perspectives on the resource planning problem, and across a variety of input as-sumptions, have thus helped to support the overall resource decision. In regard to the impact of fixing resources on model solution optimality, PacifiCorp points out that the main purpose of the CEM is to limit the set of potential resources to a manageable size for more detailed stochastic production cost analysis and to analyze alternative futures. The CEM was successfully used for this purpose. As discussed in Chapter 7, development of the Group 2 portfolios was informed by both Group 1 risk analysis results and resource policy considerations. CEM optimization was only used as a portfolio refinement tool; specifically, to evaluate the tim-ing of the CCCT resources and select an optimized quantity of front office transactions resources to meet PacifiCorp’s annual load obligation and planning reserve. Finally, PacifiCorp augmented its discussion on preferred portfolio selection in Chapter 7 by laying out the strategic justification for the portfolio. In essence, the company believes that its preferred portfolio represents a good balance of resource types with complementary strengths that together help to minimize resource risk. The idea of “robustness” under a reasonably wide range of potential futures reflects a decision goal to account for the possibility of various high-cost outcomes for customers and to avoid resource decisions that, in aggregate, lead to such an outcome being realized. The best way to accomplish this is through resource diversification, which the preferred portfolio proxy resources are intended to provide. Consequently, Pacifi-Corp’s definition of the optimal resource set is one that offers the best compromise of cost and risk when considering alternative futures and multiple stakeholder priorities. PacifiCorp notes that none of the state IRP standards provide definitive criteria for judging how a resource plan

PacifiCorp – 2007 IRP Appendix F – Public Input Process
141
for a multi-state utility has achieved optimality under risk and uncertainty, and given diverse resource preferences and policies among its state jurisdictions.
Planning Reserve Margin Selection and Resource Needs Assessment A number of the parties disagreed with PacifiCorp’s use of a 12 percent planning reserve margin for its preferred portfolio, citing analysis results from the 2007 IRP that seem to support a higher margin. Others requested more justification for the selection decision. One party, UAE, endorsed the 12 percent planning reserve margin, stating that it has been adequately supported by Pacifi-Corp’s cost-risk tradeoff analysis. UAE also recommended further planning margin analysis in-cluding incorporating an assessment of market response to “high carbon risk, price caps, or other externalities.” The UPSC and UCCS requested an explanation of changes in certain capacity balance components relative to the components reported in the 2004 IRP, as well as cited inter-jurisdictional cost allocation issues associated with potential Energy Not Served. Response: PacifiCorp expanded its discussion on the choice of a planning reserve margin in Chapter 7 (“Planning Reserve Margin Selection”). PacifiCorp’s position is that the planning re-serve margin should not be considered an immutable constraint on the company’s resource deci-sions given a time of rapid public policy evolution and wide uncertainty over the resulting down-stream cost impacts. Therefore, PacifiCorp now advocates a planning reserve range of 12 to 15 percent, and initially targets 12 percent for its preferred portfolio to develop some added plan-ning flexibility as public policy continues to evolve and regional resource adequacy standards are addressed. UPSC requested an explanation for the increase in wholesale sales reported in the 2007 IRP ca-pacity balance relative to that reported in the 2004 and 2004 IRP Update balances. This change is due to a reporting change for the delivery portion of exchange contracts. Exchange contract de-liveries are no longer reported in the Purchase and Renewable components as was done for the 2004 IRP and 2004 IRP Update. These delivery amounts now appear in the Sales component. Inter-jurisdictional cost allocation issues are outside of the purview of the IRP process. This in-formation will be provided as a separate response.
Relationship of PacifiCorp’s IRP with its Business Plan A number of the Utah parties expressed concern about how PacifiCorp’s IRP is related to its Business Plan, and that PacifiCorp might not be meeting its IRP obligation under the Utah Stan-dards and Guidelines to ensure that its business plan is “directly related to its Integrated Re-source Plan.” (Procedural Issue no. 9) The UDPU also pointed out a lack of sufficient informa-tion that shows that the two plans are consistent, and suggests that PacifiCorp does not comply with the Standards and Guidelines on this basis. Response: PacifiCorp’s Business Plan is directly related to the IRP; the business planning proc-ess is informed by the IRP resource analysis, the action plan, and subsequent procurement activi-ties. Because the latest Business Plan was undergoing development during the latter half of the 2007 IRP cycle, it made sense to coordinate on certain resource assumptions. These assumptions are fully described in Chapter 7. Going forward, the 2007 IRP will be used to inform the next version of the Business Plan.

PacifiCorp – 2007 IRP Appendix F – Public Input Process
142
The 2007 IRP Action Plan The UDPU believes that the draft IRP does not provide “detailed focus” on actions over the next two years as stated in Utah IRP standard 4(e). Areas that need more coverage include renewable portfolio standards, Klamath River hydroelectric relicensing, renewable resources, local renew-able projects (MEHC commitment U33), and sulfur hexafluoride emissions control (MEHC commitment 42a). Response: PacifiCorp believes that the level of detail on specific actions is comparable to what was provided in previous IRP action plans. This level of detail garnered no criticism from the UDPU in the past, and the company believes the level of detail is sufficient. Actions for acquir-ing up to 1,400 megawatts of cost-effective renewables are presented in the Renewables Action Plan, filed concurrently with this IRP in accordance with MEHC commitments.
Demand-Side Management Comments centered on the lack of modeling of Class 2 (energy efficiency) programs, and the expectation that the forthcoming DSM potentials study will address parties’ concerns regarding benefit capture and market potential. The UDPU identified several issues: (1) a lack of data on Class 2 DSM, (2) concern that the IRP models “do not accurately reflect the costs and benefits associated with DSM resources”, citing the results of the CEM low and high DSM potential sce-nario results, (3) variable amounts of DSM and CHP resources were not subjected to risk analy-sis using the PaR model. The UDPU also requested that the company explain how the DSM po-tentials study results will be incorporated in the next IRP. The UCCS requested more explanation of the DSM resources included in the initial load and resource balance. The WRA expressed concern that an insufficient amount of DSM has been included in the IRP. Response: PacifiCorp noted in the IRP report that Class 2 DSM could not be modeled in the CEM due to the lack of supply curve data for PacifiCorp’s service territory; rather, Class 2 DSM was treated as a decrement to the load forecast as in prior IRPs, while DSM decrement values determined using stochastic production cost modeling. A discussion of the handling of Class 2 DSM is provided in Chapter 6 (“Public Utility Commission Guidelines for Conservation Pro-gram Analysis in the IRP”). For the DSM potentials study, the company will receive cost-supply curves for Class 1, Class 2, and Class 3 DSM programs, which will be input into the IRP models once they have been veri-fied and approved for use. The company will also receive a set of CHP and customer-owned standby generator resource characterizations that will be included in the models as well. Responding to the UDPU comment on performing manual DSM/CHP optimization using the stochastic PaR model, PacifiCorp notes that using the PaR in this manner is not practical given the long model run-times, which reach 16 to 18 hours. This limitation has been communicated to Utah parties during previous IRP cycles, and was one of the reasons why PacifiCorp acquired the CEM (to have an automated resource selection capability). Regarding the UCCS request for more explanation on the DSM included in the load and resource balance, Table 4.10 in Chapter 4 summarizes existing DSM program contributions to the bal-

PacifiCorp – 2007 IRP Appendix F – Public Input Process
143
ance. Tables A.8 and A.15 in Appendix A outline the amounts and timing of Class 2 DSM load reductions. Expected Class 1 program contributions are described in Table A.13.
Market Reliance, Availability, and Price Risk Several parties were concerned with the level of market purchases included in the preferred port-folio, and requested verification of market availability to support these amounts and other data and analysis. The UPSC requested that PacifiCorp provide supporting analysis of cost-risk trade-offs of market reliance versus building resources. The RNP and NWEC stated their concern that PacifiCorp overestimates the wholesale value of coal and other base load plants (and undervalues short-lead-time resources such as SCCTs and DSM) given the impact of emission performance standards and renewable portfolio standards. Response: PacifiCorp added a new section in Chapter 7 that provides more information on the company’s market purchase strategy and expected market availability. Regarding analysis of cost-risk tradeoff analysis of market reliance versus building, PacifiCorp refers parties to a number of risk analysis portfolios and a sensitivity study designed to directly address the cost-risk tradeoffs of assets and market reliance. These results are documented in Chapter 7. For example, the section titled “Resource Strategy Risk Reduction” describes the comparison of portfolios with and without front office transactions after 2011. The chapter also describes a stochastic simulation study in which PacifiCorp replaced a 2012 base load resource with front office transactions. PacifiCorp acknowledges and shares parties’ concerns over the potential market impacts of new resource constraints imposed by renewable generation requirements and CO2 emission perform-ance standards. Action plan item no. 17 (Chapter 8, Table 8.2) addresses modeling enhancements to assist in the analysis of such issues. The company notes that such analysis capability is not present in existing market models that are designed to simulate integrated system operation. PacifiCorp has been exploring CEM customization possibilities with the model vendor, Global Energy Decisions.
Scope of Resource Analysis Most of the parties identified resources that PacifiCorp did not model but thought it should have, or else requested an explanation for why they were not modeled. Examples include solar, geo-thermal, and storage technologies. The UCCS requested that PacifiCorp investigate an approach that enables comparable treatment of all technologies throughout the modeling process even if they have been excluded for modeling purposes on the basis of screening criteria. The UPSC questioned why the company is not addressing retrofits, retirements, and distributed technologies as resource options. The UDPU inquired as to PacifiCorp plans to build a landfill gas power plant in the near future. The UPSC and UCCS questioned why geothermal was not modeled given that it has the lowest reported total resource cost in Tables 5.3 and 5.4 (The UPSC also questioned the difference in geothermal capital costs between the value reported in the IRP and the Blundell economic study.) The WRA stated that technology risk should not be used as a screen to eliminate resources from further consideration, and also called for more robust analysis of CHP potential. The UAE recommended that the planning horizon be extended to facilitate analysis of nuclear and other long-lead-time resources. Both the NWEC and WRA stated that the

PacifiCorp – 2007 IRP Appendix F – Public Input Process
144
CO2 risk analysis was flawed by not including IGCC with carbon capture and sequestration as an appropriately modeled resource (i.e., allowing the CEM to select carbon capture and sequestra-tion for an IGCC plant once it becomes economic to do so). Response: A summary of the process for selecting resources to include in the IRP models is pro-vided in Tables I.3 and I.4 in Appendix I (See the response to Oregon Guideline 1.a.1 in Table I.3, and the response to Utah Standard 4.b.ii in Table I.4). As noted, PacifiCorp intends to inves-tigate a CEM modeling process that accommodates a broader range of technologies within the limitations of the company’s IRP models. PacifiCorp will consider retirements and retrofits as resource options in future IRPs. Consideration of these resource options and others will be made in the context of an overall review of resource potentials, data availability, technical feasibility, and modeling constraints. Concerning the observation on the low reported geothermal total resource cost, PacifiCorp ex-panded its discussion on the geothermal project cost characterization and treatment of the renew-able production tax credit for geothermal projects (Chapter 5, ‘Other Renewable Resources”). On the differences between reported geothermal capital costs in the IRP and Blundell economic study, PacifiCorp notes that the UCCS submitted a formal data request on May 16, 2007 on this issue, to which the company will respond separately from this IRP report. Regarding the consideration of technology risk as a factor in resource screening, PacifiCorp points out this is just one factor that was used to develop the modeled resource list. PacifiCorp agrees that technology risk should not be used as a screen to exclude resources from further con-sideration. Other factors considered by the company included the outlook for commercial matur-ity during the 10-year investment horizon that was the focus of this IRP, and most importantly, practical modeling considerations of the CEM. PacifiCorp quickly approached the resource limit recommended by the model vendor and began to scale back resources and define generic proxy resources for front office transaction and renewables. The associated learning experience will be useful as the company addresses the anticipated expansion of resource options for the next IRP. Regarding landfill gas plants, PacifiCorp has reviewed potential sites for such projects in the Rocky Mountain Power and Pacific Power service territories, and selected two sites in Oregon for which feasibility studies have been conducted. The initial findings and recommendation are undergoing review. The company is also looking at five other landfill sites (one in Washington and four in Utah) for possible feasibility analysis. As to the UAE’s recommendation to extend the planning horizon to facilitate analysis of nuclear and other long-lead-time resources, the company will consider this change as it formulates its next IRP modeling plan. Concerning the modeling of IGCC with carbon capture and sequestration, PacifiCorp notes that the current version of the CEM does not allow the modeling of plant retrofits such as carbon cap-ture and sequestration. However, the company is acquiring a CEM model upgrade that includes this modeling capability, and expects to implement this functionality in time for the next IRP. Nevertheless, PacifiCorp disagrees with the WRA’s contention that the CO2 risk analysis is in-herently flawed to the extent that it “should be completely reworked before any conclusions must

PacifiCorp – 2007 IRP Appendix F – Public Input Process
145
be drawn” because of the way IGCC-based carbon capture and sequestration was addressed in the IRP models. PacifiCorp’s modeling of IGCC for this IRP first looked at the ability of carbon-capture-ready IGCC to stand on its own merits, and then performed various sensitivity analyses to investigate the potential cost impacts of adding carbon capture and sequestration. PacifiCorp believes that the uncertainties associated with carbon capture and sequestration are too great to consider it as an investment that customers and investors are willing to commit to and pay for in the period covered by the IRP action plan. The IGCC analyses performed by the company sup-port the view that a decision to add IGCC to the company’s resource portfolio will not be driven by modeling considerations, but rather as an outcome of public policy debates and collaborative public-private development ventures such as the one recently announced by the Wyoming Infra-structure Authority and PacifiCorp.
Load Forecast A number of parties requested additional explanation for why the March 2007 Utah load forecast shows a dip in the growth in 2008-2009 relative to the May 2006 forecast. The UCCS requested justification for why PacifiCorp relies on an expected (1 in 2) load forecast for planning, and inquires as to how planning to a 90% confidence interval would change the company’s resource position and resource selection decisions. Regarding the higher load growth expected for Wyo-ming, the WRA expressed concern about committing resources to uncertain and volatile extrac-tive industry loads, which account for the higher forecasted load growth. The UPSC requested the insertion of additional load forecast information in the IRP report. Response: PacifiCorp accounts for load forecast error in its IRP by using a planning reserve margin. Planning to a 90 percent confidence internal would lessen the need to plan for unex-pected load growth and, therefore, would likely reduce the level of planning reserve margin re-quired by the company. PacifiCorp is well aware of the volatile nature of extractive industry loads, and therefore applies a discount factor to the load forecasts contained in industrial customer service requests. Forecasts for the new Wyoming loads were reduced by 30 percent compared to estimates provided by cus-tomers. The load discount is based on rankings of the likelihood of occurrence of the customers’ loads and the probability associated with that likelihood. Additionally, the company looks at the market conditions that will impact each industry, supply and demand in the industry, and other events that may impact the industry such as substitution impacts. Concerning the requested load forecast information, PacifiCorp made the following report modi-fications to Chapter 4 and Appendix A: ● Data for 2006 was added to both the energy and coincident peak capacity forecasts tables in
Chapter 4, as well as to each state table in Appendix A. ● A column was added to Table 4.5 in Chapter 4 that shows loads for the Southeast Idaho re-
gion. ● A new section, “Jurisdictional Peak Load Forecast,” was added in Chapter 4 with informa-
tion similar to that reported for the coincident peak. ● An explanation for the Utah load growth dip was added to Chapter 4 (“May 2006 Load Fore-
cast Comparison”).

PacifiCorp – 2007 IRP Appendix F – Public Input Process
146
Carbon Dioxide Regulatory Risk Analysis The WRA cited a number of concerns with PacifiCorp’s CO2 risk modeling approach. First, they questioned the value of using a $0/ton CO2 cost adder and cited the $8/ton medium adder case as also “remote over the long term.” They advocate studying carbon costs in the range of plus or minus $30/ton. Second, they view the use of a year-2000 emissions cap under a cap-and-trade mechanism as unrealistic. Third, they believe that adding two coal resources by 2014 does not provide sufficient diversity to endure future carbon regulation. Fourth, they question Pacifi-Corp’s treatment of CO2 regulation as a scenario risk and propose that the company model it probabilistically. The UAE claims that PacifiCorp failed to capture the impact of higher gas prices and lower electricity demand attributable to potentially high carbon taxes. The RNP views PacifiCorp’s greenhouse gas mitigation strategy as “insufficient for the task,” and “is hardly an active strategy at all.” The RNP also faults PacifiCorp for not modeling a portfolio that decreases overall CO2 emissions, or that has no coal resources. Response: PacifiCorp is required, via the Oregon IRP Standards and Guidelines, to assess envi-ronmental externality costs using a $0/ton CO2 cost adder. Also, UPSC staff requested that the company include the $0 adder as part of a business-as-usual scenario case. The use of a single point estimate of around $30/ton, if that is what is being suggested, is not consistent with Oregon or Utah IRP guidelines that call for a number of specific adder values (in the case of Oregon) or a range of estimated external costs (in the case of Utah). PacifiCorp models a $38/ton adder (in 2008 dollars). Regarding the baseline cap and other assumptions for specifying a CO2 regulatory framework, the company will revisit them as part of its next IRP process and as a result of the outcome of the Oregon Public Utility Commission proceeding on CO2 risk in the IRP (Docket UM 1302). PacifiCorp does not understand WRA’s point regarding the use of stochastic methods to model CO2 regulatory risks. WRA supports stochastic analysis over scenario analysis, but then concedes that stochastic analysis is too complicated and should therefore be discounted or aban-doned in favor of informed judgment. From this logic, PacifiCorp is not clear what modeling approach the WRA finds acceptable for conducting CO2 risk analysis. Regarding the claim that the company has not captured gas price risk due to higher carbon taxes, PacifiCorp notes that the gas price and electricity price forecasts used for the CO2 cost adder scenarios account for the increased CO2 adder values. See the text box titled “Modeling the Im-pact of CO2 Externality Costs on Forward Electricity Prices” in the Environmental Externality Cost section of Chapter 6. Finally, PacifiCorp updated Chapter 7 of the draft IRP report with a portfolio study that entailed constraining CEM system-wide resource selection to only those resources that could meet a Cali-fornia-style greenhouse gas emission performance standard. One of the resource choices was IGCC with carbon capture and sequestration.
Transmission The UDPU had several transmission questions. First, they question whether transmission wheel-ing as a potential solution to transmission needs is appropriate given that it “fluctuates with the market”. The UDPU also stated that the IRP draft does not address renewable portfolio standard (RPS) impacts on transmission planning or the National Governor’s Conference positions on transmission planning and resources, and asks if these issues are being considered. Finally, they

PacifiCorp – 2007 IRP Appendix F – Public Input Process
147
asked for clarification on the use of 500-megawatt blocks for specifying certain transmission paths in the CEM (Bridger-Ben Lomond; Mona-Utah North; Wyoming-Bridger East; Utah North-West Main; Utah South-Four Corners). The UAE expressed support for the use of trans-mission additions to delay supply-side resources, but was not clear if transmission was put on an equal footing with generation. Response: PacifiCorp’s view is that it is prudent to include all reasonable transmission options for consideration given the complexities associated with building transmission facilities. Regard-ing RPS requirements, the company is investigating the consequences of these new regulations. Regarding specification of the above referenced transmission resources, these resources are con-sidered as proxies for a variety of potential projects to support new generation and facilitate power transfers in the east control area. Specifying 500-megawatt blocks for a proxy transmis-sion resource was an efficient method to express incremental transmission investment for the CEM to select. Transmission resources were treated on a comparable basis with respect to generation resources. The CEM makes decisions to build generation or transmission units at a given resource site in a given year. The amortized cost of both transmission and generation capacity expansion is in-cluded in the model’s PVRR minimization objective function.
Miscellaneous Two parties, NWEC and the RNP, advocated that the company rely on an upper-tail measure of stochastic risk rather than risk exposure (stochastic upper-tail mean PVRR minus the overall stochastic mean PVRR for 100 Monte Carlo model iterations). The RNP states that the IRP does not adequately consider the capital cost risks of pulverized coal plants, and cites one example of a coal plant construction estimate that increased by 50 percent over original estimates. Regarding the Intermountain Power Plant Unit 3 project (IPP 3), the UDPU requested a status update and an indication of the company’s current intentions regarding the project. The WRA also believes that an in-service date of 2012 for IPP3 or any other coal plant is unrealistic. The UPSC requested detailed information on the company’s commitment to invest $1.2 billion on cost-effective pollution control. Specific requests include the following: ● Explanation of “how and in what forum the Company plans to perform the cost-benefit
analysis for these investments, and should such analysis be part of the Integrated Resource Planning evaluation?
● Does the $1.2 billion include mandatory requirements, i.e., mercury control on existing plants?
● Does it include those existing plant retrofit projects which are necessary for permit require-ments to add new units at facilities?
● Clarify and provide a table showing the value, project description, and location of the in-vestments.

PacifiCorp – 2007 IRP Appendix F – Public Input Process
148
Response: PacifiCorp has added the upper-tail mean along with the 95th percentile in the Chap-ter 7 tables that report stochastic risk measures for the risk analysis portfolios. The company notes that risk analysis portfolio rankings are generally invariant with respect to the stochastic risk measures. PacifiCorp has been tracking construction costs for all new resource types, and has seen in-creases in costs for all resources. This fact is mentioned in Chapter 5. The company will use the bid information received for its Base Load Request For Proposal to help inform estimation of new resource capital costs for the 2007 IRP Update. Regarding the status of IPP 3, PacifiCorp and the other Intermountain Power Plant Unit 3 (IPP 3) participants acknowledge that there are some air permit challenges by certain parties and con-tractual complications associated with Los Angeles Department of Water and Power that need to be resolved. PacifiCorp and the IPP 3 development team remain focused on working through these issues and intend to exercise their development right relating to construction of the facility. The IPP 3 development team is currently evaluating bids from major engineering procurement and construction contractors. IPP 3 remains a component in filling PacifiCorp's needs for low cost reliable resources, and the plant remains as a benchmark resource for 2012. The UPSC’s request for PacifiCorp’s pollution control investment plans will be provided as a separate response.
CONTACT INFORMATION
PacifiCorp’s IRP internet website contains many of the documents and presentations that support the 2003, 2004 and 2007 Integrated Resource Plans. To access it, please visit the company’s website at http://www.PacifiCorp.com , click on the menu “News & Info” and select “Integrated Resource Planning”. PacifiCorp requests that any informal request be sent in writing to the following address or email address below. PacifiCorp IRP Resource Planning 825 N.E. Multnomah, Suite 600 Portland, Oregon 97232 Electronic Email Address: [email protected] Phone Number: (503) 813-5245

PacifiCorp – 2007 IRP Appendix G – Performance on 2004 IRP Action Plan
149
APPENDIX G – PERFORMANCE ON 2004 IRP ACTION PLAN
INTRODUCTION
This appendix summarizes the performance on the 2004 IRP action plan filed in January 2005. PacifiCorp provided an update of this action plan in November 2005 as part of the “2004 IRP Update” filed with state commissions in November 2005. The 2004 IRP Update action plan also incorporated updates to several action items in the 2004 IRP action plan. Table G.1 shows the progress of the original and updated action items listed in Table 5.2 of the 2004 IRP Update document (Chapter 5, page 46).

Paci
fiCor
p –
2007
IRP
Ap
pend
ix G
– P
erfo
rman
ce o
n 20
04 IR
P Ac
tion
Plan
s
150
Tab
le G
.1 –
Sta
tus U
pdat
e on
200
4 IR
P A
ctio
n Pl
an
Act
ion
Item
A
dditi
on
Typ
e R
esou
rce
Typ
e T
imin
g
Size
(R
ound
ed
to th
e ne
ares
t 50
MW
) L
ocat
ion
IRP
Res
ourc
e E
valu
ated
20
04 IR
P A
ctio
n Pl
an
Des
crip
tion
Stat
us
1 Su
pply
-Sid
e R
enew
able
s FY
200
6 -
2015
1,
400
Syst
em
Win
d
Con
tinue
to a
ggre
ssiv
ely
purs
ue c
ost-e
ffec
tive
rene
wab
le re
sour
ces
thro
ugh
curr
ent a
nd
futu
re R
FP(s
).
Paci
fiCor
p ha
s acq
uire
d 34
6 m
egaw
atts
of t
he 4
00 m
egaw
att
targ
et se
t for
200
7, a
s of A
pril
2007
. The
com
pany
pla
ns to
ac-
quire
all
1,40
0 m
egaw
atts
by
2010
, an
d to
acq
uire
an
addi
tiona
l 600
m
egaw
atts
from
201
1 th
roug
h 20
13.
2 D
SM
Cla
ss 2
FY
200
6 -
2015
45
0 M
Wa
Syst
em
100
MW
de
crem
ents
at
vario
us lo
ad
shap
es
Use
dec
rem
ent v
alue
s to
asse
ss c
ost-e
ffec
tive
bids
in
DSM
RFP
(s).
Acq
uire
th
e ba
se D
SM (P
acifi
-C
orp
and
ETO
com
-bi
ned)
of 2
50 M
Wa
and
up to
an
addi
tiona
l 200
M
Wa
if co
st-e
ffec
tive
prog
ram
s can
be
foun
d th
roug
h th
e R
FP p
roce
ss.
• Th
e co
mpa
ny c
ondu
cted
a c
lass
2
DSM
dec
rem
ent s
tudy
for t
he
2007
IRP.
To
addr
ess r
isk,
this
st
udy
used
stoc
hast
ic si
mul
atio
n w
ith a
n $8
/ton
CO
2 add
er.
Paci
fiCor
p al
so in
crea
sed
the
num
ber o
f loa
d sh
apes
from
eig
ht
to tw
elve
. •
The
2005
DSM
RFP
to p
rocu
re
Cla
ss 1
, 2 a
nd 3
reso
urce
s was
is
sued
acc
ordi
ng to
the
actio
n pl
an in
the
2004
IRP
(ref
eren
ce
Tabl
e 9.
3).
The
RFP
was
stru
c-tu
red
to so
licit
prop
osal
s for
bot
h sp
ecifi
c re
sour
ces t
ypes
: a c
om-
preh
ensi
ve re
side
ntia
l equ
ipm
ent
and
serv
ice
prog
ram
as w
ell a
s an
“al
l com
ers”
requ
est f
or e
ach
reso
urce
type
.
• Th
e H
ome
Ener
gy S
aver
s pro
-gr
am w
as fi
led
and
appr
oved
in
2006
in Id
aho,
Was
hing
ton
and
Uta
h an
d is
bei
ng p
ropo
sed
in
Cal
iforn
ia a
nd W
yom
ing
in
2007
. O
n M
arch
20,
200
7, th
e U
tah
Publ
ic S
ervi
ce C
omm
issi
on
appr
oved
mod
ifica
tions
to th
e

Paci
fiCor
p –
2007
IRP
Ap
pend
ix G
– P
erfo
rman
ce o
n 20
04 IR
P Ac
tion
Plan
s
151
Act
ion
Item
A
dditi
on
Typ
e R
esou
rce
Typ
e T
imin
g
Size
(R
ound
ed
to th
e ne
ares
t 50
MW
) L
ocat
ion
IRP
Res
ourc
e E
valu
ated
20
04 IR
P A
ctio
n Pl
an
Des
crip
tion
Stat
us
2007
Ene
rgy
Star
New
Hom
es
Prog
ram
and
in A
pril
2007
ex-
tend
ed th
e C
ool C
ash
air c
ondi
-tio
ner e
ffic
ienc
y pr
ogra
m.
•
The
com
pany
als
o ac
cept
ed a
pr
opos
al to
enh
ance
bus
ines
s pr
ogra
m p
enet
ratio
n of
the
new
co
nstru
ctio
n m
arke
t. In
add
ition
, on
e pr
ogra
m p
ropo
sal f
rom
the
2005
DSM
RFP
is st
ill u
nder
co
nsid
erat
ion.
It w
ill b
e ev
alu-
ated
furth
er u
sing
upd
ated
val
ua-
tion
info
rmat
ion
deriv
ed th
roug
h th
e 20
07 IR
P pl
anni
ng p
roce
ss a
s w
ell a
s res
ults
from
the
syst
em-
wid
e D
SM p
oten
tial s
tudy
resu
lts
due
in Ju
ne 2
007.
3 D
istri
bute
d G
ener
atio
n C
HP
FY 2
010
(sum
mer
of
CY
20
09) a
nd
FY 2
013
(CY
201
2)
n/a
Syst
em
Two
45 M
W
units
usi
ng
NR
EL c
ost
estim
ates
Incl
ude
CH
P as
elig
ible
re
sour
ces i
n su
pply
-sid
e R
FPs.
Con
tinue
to p
urch
ase
CH
P ou
tput
as
Qua
lifyi
ng F
acili
ties (
QF)
pur
-su
ant t
o PU
RPA
regu
latio
ns.
The
2007
pre
ferr
ed p
ortfo
lio c
onta
ins
an a
dditi
onal
100
MW
of C
HP
reso
urce
s, ci
ted
in 2
007
IRP
actio
n pl
an it
em n
o. 5
.
4 D
istri
bute
d G
ener
atio
n St
andb
y G
ener
ator
s
FY 2
010
(sum
mer
of
CY
20
09) a
nd
FY 2
013
(CY
201
2)
n/a
U
tah
75 M
W in
U
tah
Incl
ude
a pr
ovis
ion
for
Stan
dby
Gen
erat
ors i
n su
pply
-sid
e R
FPs.
Inve
s-tig
ate,
with
Air
Qua
lity
Off
icia
ls, t
he v
iabi
lity
of
this
reso
urce
opt
ion.
The
final
Bas
e Lo
ad R
FP d
oes n
ot
cont
ain
an E
ast s
ide
stan
d-by
gen
-er
atio
n re
sour
ce e
xcep
tion
due
to
Uta
h D
ivis
ion
of A
ir Q
ualit
y re
gu-
latio
ns o
n di
esel
gen
erat
ion
emis
-si
ons s
tand
ards
. Pa
cifiC
orp
will
co
ntin
ue to
inve
stig
ate
alte
rnat
ives
fo
r sta
nd-b
y ge
nera
tors
as a
re-
sour
ce. P
acifi
Cor
p m
et w
ith P
ort-
land
Gen
eral
Ele
ctric
to d
iscu
ss
thei
r sta
nd-b
y ge
nera
tion
prog
ram
.

Paci
fiCor
p –
2007
IRP
Ap
pend
ix G
– P
erfo
rman
ce o
n 20
04 IR
P Ac
tion
Plan
s
152
Act
ion
Item
A
dditi
on
Typ
e R
esou
rce
Typ
e T
imin
g
Size
(R
ound
ed
to th
e ne
ares
t 50
MW
) L
ocat
ion
IRP
Res
ourc
e E
valu
ated
20
04 IR
P A
ctio
n Pl
an
Des
crip
tion
Stat
us
5 D
SM
Cla
ss 1
FY 2
009
(sum
mer
of
CY
20
08)
50
Uta
h Ir
rigat
ion
Load
Con
trol
Proc
ure
cost
-eff
ectiv
e su
mm
er lo
ad c
ontro
l pr
ogra
m in
Uta
h by
the
sum
mer
of 2
008.
The
com
pany
laun
ched
a c
omm
er-
cial
ligh
ting
cont
rol p
rogr
am (L
oad
Ligh
tene
r) in
Uta
h in
Feb
ruar
y 20
05. H
owev
er, t
he p
rogr
am w
as
term
inat
ed in
Aug
ust 2
006
due
to
poor
pro
gram
per
form
ance
. The
co
mpa
ny e
xpan
ded
the
Idah
o irr
i-ga
tion
load
man
agem
ent p
rogr
am
and
exte
nded
the
Idah
o irr
igat
ion
load
man
agem
ent p
rogr
am in
to
Uta
h in
the
sprin
g of
200
7, a
nd
cont
inue
s to
inve
stig
ate
the
poss
i-bl
e ex
pans
ion
of U
tah'
s air
cond
i-tio
ner l
oad
cont
rol p
rogr
am b
eyon
d 10
0 M
Ws (
at th
e ge
nera
tor)
. In
ad
ditio
n, th
e co
mpa
ny is
still
ev
alua
ting,
with
in th
e 20
07 p
lan-
ning
pro
cess
, tw
o ot
her C
lass
1
prop
osal
s rec
eive
d th
roug
h th
e 20
05 D
SM R
FP.
Like
the
Cla
ss 2
pr
opos
al, t
he c
ompa
ny w
ill u
tiliz
e th
e sy
stem
-wid
e D
SM p
oten
tial
stud
y re
sults
to h
elp
furth
er a
sses
s th
e vi
abili
ty o
f the
rem
aini
ng p
ro-
posa
ls.
6 D
SM
Cla
ss 1
FY 2
009
(sum
mer
of
CY
20
08)
50
OR
/WA
/ C
A
Irrig
atio
n Lo
ad C
ontro
l
Proc
ure
cost
-eff
ectiv
e su
mm
er lo
ad c
ontro
l pr
ogra
m in
Ore
gon,
W
ashi
ngto
n, a
nd/o
r C
alifo
rnia
by
the
sum
mer
of
200
8.
The
2005
DSM
RFP
gen
erat
ed
Cla
ss 1
load
con
trol p
ropo
sals
ta
rget
ing
our w
este
rn sy
stem
. Th
e pr
opos
als w
ere
of v
ario
us si
zes a
nd
wer
e si
gnifi
cant
ly m
ore
expe
nsiv
e th
an a
ntic
ipat
ed.
The
prop
osal
s un
derw
ent f
urth
er a
naly
sis w
ithin
th
e 20
07 IR
P m
odel
ing
proc
ess a
nd
wer
e de
term
ined
not
to b
e co
st-
effe
ctiv
e. H
owev
er, t
he 2
007
IRP
mod
elin
g di
d se
lect
the
less
er c
ost
irrig
atio
n lo
ad m
anag
emen
t pro
-

Paci
fiCor
p –
2007
IRP
Ap
pend
ix G
– P
erfo
rman
ce o
n 20
04 IR
P Ac
tion
Plan
s
153
Act
ion
Item
A
dditi
on
Typ
e R
esou
rce
Typ
e T
imin
g
Size
(R
ound
ed
to th
e ne
ares
t 50
MW
) L
ocat
ion
IRP
Res
ourc
e E
valu
ated
20
04 IR
P A
ctio
n Pl
an
Des
crip
tion
Stat
us
gram
whi
ch th
e co
mpa
ny in
tend
s to
inve
stig
ate
impl
emen
ting
begi
n-ni
ng a
s ear
ly a
s 201
0.
7 Tr
ansm
issi
on
Path
-C U
p-gr
ade
FY20
11
(sum
mer
of
CY
20
10)
300
ID /
UT
Path
-C U
p-gr
ade
Purs
ue u
pgra
de o
f tra
ns-
fer c
apab
ility
from
Idah
o to
Uta
h.
Path
C tr
ansm
issi
on se
rvic
e re
-qu
ests
hav
e be
en c
ompl
eted
for t
he
syst
em im
pact
stud
ies a
nd a
re
curr
ently
und
er th
e Fa
cilit
y St
udy
phas
e. G
rid W
est w
as d
isso
lved
as
of Ju
ne 2
006.
Oth
er re
gion
al e
nti-
ties c
ontin
ue to
pur
sue
regi
onal
tra
nsm
issi
on p
lann
ing
initi
ativ
es.
Plea
se se
e C
hapt
er 3
for a
dditi
onal
tra
nsm
issi
on re
late
d to
pics
.
8 Su
pply
-Sid
e C
oal r
e-so
urce
FY 2
013
(sum
mer
of
CY
20
12)
600
Uta
h Pu
lver
ized
C
oal P
lant
Proc
ure
a hi
gh c
apac
ity
fact
or re
sour
ce in
or
deliv
ered
to U
tah
by th
e su
mm
er o
f CY
201
2.
The
Bas
e Lo
ad R
FP w
as is
sued
on
Apr
il 5,
200
7 fo
r up
to 1
,700
MW
fo
r del
iver
y in
201
2, 2
013,
and
/or
2014
. The
com
pany
is c
urre
ntly
in
the
bidd
er su
bmis
sion
pha
se o
f the
R
FP p
roce
ss.
The
RFP
con
tain
s tw
o be
nchm
ark
coal
pla
nts a
nd a
n IG
CC
opt
ion
for b
idde
rs. R
e-so
urce
s for
201
2 an
d 20
14 a
re
bein
g re
ques
ted
with
exc
eptio
ns fo
r lo
ad c
urta
ilmen
t and
Qua
lifyi
ng
Faci
lity
cont
ract
s.
9 Tr
ansm
issi
on
Reg
iona
l Tr
ansm
issi
on
FY 2
013
and
be-
yond
n/
a Sy
stem
Tr
ansm
issi
on
from
Wyo
-m
ing
to U
tah
Con
tinue
to w
ork
with
ot
her r
egio
nal e
ntiti
es to
de
velo
p G
rid W
est.
C
ontin
ue to
act
ivel
y pa
rtici
pate
in re
gion
al
trans
mis
sion
initi
ativ
es
(e.g
. RM
ATS
, NTA
C)
Paci
fiCor
p is
eng
aged
in a
num
ber
of re
gion
al tr
ansm
issi
on p
lann
ing
initi
ativ
es in
tend
ed to
add
ress
tra
nsm
issi
on is
sues
and
opp
ortu
ni-
ties.
WEC
C re
cent
ly la
unch
ed th
e Tr
ansm
issi
on E
xpan
sion
Pla
nnin
g Po
licy
Com
mitt
ee (T
EPPC
) to
addr
ess i
nter
conn
ectio
n-w
ide
trans
mis
sion
exp
ansi
on p
lann
ing.
G
rid W
est w
as d
isso
lved
as o
f Jun
e 20
06. A
gro
up c
alle
d th
e N
orth
ern
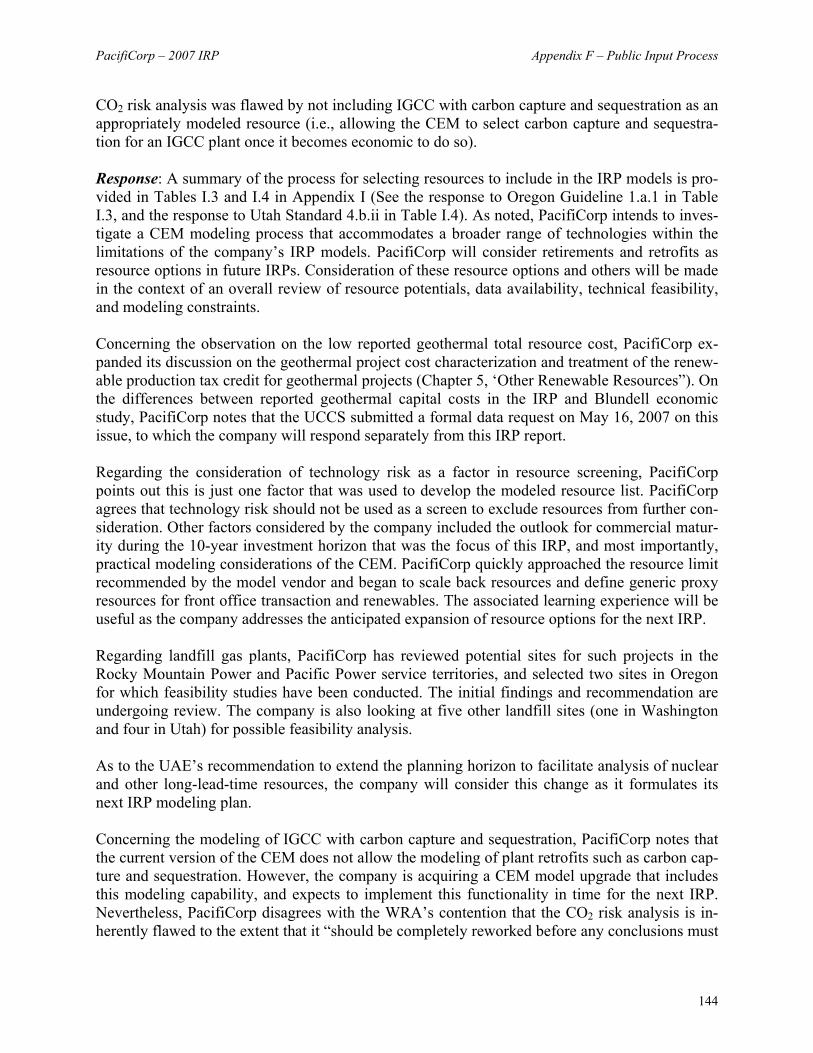
Paci
fiCor
p –
2007
IRP
Ap
pend
ix G
– P
erfo
rman
ce o
n 20
04 IR
P Ac
tion
Plan
s
154
Act
ion
Item
A
dditi
on
Typ
e R
esou
rce
Typ
e T
imin
g
Size
(R
ound
ed
to th
e ne
ares
t 50
MW
) L
ocat
ion
IRP
Res
ourc
e E
valu
ated
20
04 IR
P A
ctio
n Pl
an
Des
crip
tion
Stat
us
Tier
Tra
nsm
issi
on G
roup
was
fo
rmed
to fa
cilit
ate
regi
onal
pla
n-ni
ng in
the
abse
nce
of G
rid W
est
and
the
Roc
ky M
ount
ain
Are
a Tr
ansm
issi
on S
tudy
(RM
ATS
). Pl
ease
see
Cha
pter
3 fo
r add
ition
al
trans
mis
sion
rela
ted
topi
cs.
10
IRP
Proc
ess
Mod
elin
g 20
07 IR
P n/
a n/
a n/
a
Inco
rpor
ate
Cap
acity
Ex
pans
ion
Mod
el in
to
portf
olio
and
scen
ario
an
alys
is.
Paci
fiCor
p pl
aced
the
Cap
acity
Ex
pans
ion
Mod
ule
(lice
nsed
by
Glo
bal E
nerg
y D
ecis
ions
Inc.
) int
o fu
ll pr
oduc
tion
for t
he 2
007
IRP
proc
ess.
See
Cha
pter
s 6 a
nd 7
for
mor
e in
form
atio
n on
how
this
tool
w
as u
sed
in th
e 20
07 IR
P.

PacifiCorp – 2007 IRP Appendix H – Distribution Deferral Benefit of CHP
155
APPENDIX H – DEFERRAL OF DISTRIBUTION INFRASTRUCTURE WITH CUSTOMER-BASED COMBINED HEAT AND POWER GENERATION
INTRODUCTION
As part of Oregon Order 06-029, PacifiCorp was asked to examine the potential for customer-based high-efficiency combined heat and power (CHP) resources to defer investment in the dis-tribution system to meet load growth. The specific situation the company was ordered to exam-ine was a case where a customer utilizing CHP, sized to exactly meet the customer load, would be connected to the distribution system as normal, but no additional infrastructure would be added to accommodate the additional load. In the event of an outage to the generation, the cus-tomer would be served by PacifiCorp’s distribution system, as long as capacity was available; if this outage occurred at a time where the distribution infrastructure was incapable of serving the additional load for whatever reason, the customer would be automatically disconnected. The intent of this appendix is to first determine what distribution infrastructure deferrals would be possible for an interruptible customer with on-site generation as described above, and then to compare the cost of those deferrals to a traditional customer taking firm service and having no on-site generation. For the purposes of the comparison, it is assumed that five megawatts of cus-tomer load is to be added to PacifiCorp’s west control area 12.5 kilovolt distribution system (ei-ther a new load or a customer adding load).
TRADITIONAL CONNECTION
Extending service to a five megawatt customer to the company’s distribution system is a typical industrial new connection for PacifiCorp, a request which occurs many times per year. Gener-ally a customer receives an allowance for their connection facilities equal to one year’s expected revenue; any expenditure beyond this is an out-of-pocket expense for the customer. For a cus-tomer of this size, these connection requirements typically range from $50,000 to $150,000, not inclusive of upstream reinforcements necessary to accommodate new load. The expected reve-nue for a five megawatt, primary-metered customer ranges from $400,000 to $600,000 per year, which means that usually all of the cost is borne by PacifiCorp. The upstream reinforcements can range from $500,000 for new feeder infrastructure to more than $2,500,000 if an additional substation is required. These are also at the company’s expense. The total cost of adding a new five megawatt customer is estimated to range from $550,000 to $2,650,000 in this example. All of these connection expenses are considered capital improve-ments and are depreciated over 50 to 60 years, depending on the type of facility.
GENERATION CONNECTION
If a customer decides to serve its electricity needs with an on-site generating facility, along with being interrupted when their own generating facility is down, then the company would not ex-

PacifiCorp – 2007 IRP Appendix H – Distribution Deferral Benefit of CHP
156
pect any revenues. Therefore, the company would not pay any connection costs for this customer and would save $50,000 to $150,000 of interconnection costs describe above. Additionally, because this customer would be interruptible if the existing distribution infrastruc-ture could not serve the customer for some reason (under-voltage, over-current, etc.) during a generator outage, no additional infrastructure would be necessary. This may allow the company to defer the $500,000 to $2,500,000 investment previously identified, depending on the current loading levels on the feeder. For example, PacifiCorp rates its 12.5 kilovolt circuits for approxi-mately ten megawatts, or twice the load that is expected to be added as a result of this customer connection. Therefore, any feeder already loaded to 50 percent or more of its rating would need to be upgraded in order to provide traditional service to this particular customer. Feeders loaded below this threshold would not require upgrade. Examining Oregon’s feeder population, we find that about 61 percent of PacifiCorp Oregon circuits are currently loaded at or above 50 percent. If the five megawatt customer were to be located on one of these feeders, then there could be deferred investment of $500,000 to $2,500,000. If the five megawatt customer were to be located on one of these feeders, then there could be deferred investment of $500,000 to $2,500,000. PacifiCorp would not realize any additional capital investment savings for customers located on the other 39 percent of feeders.
CONCLUSION
The comparison above shows that a five megawatt load, coupled with a five megawatt customer-sited generation unit (customer-owned or not) located on a typical 12.5 kilovolt feeder in Oregon can potentially offset estimated connection costs of $50,000 to $150,000 under current line ex-tension policies. In addition, there may be an opportunity to avoid infrastructure costs, at an es-timated amount of $500,000 to $2,500,000. These savings would only be available if the cus-tomer agreed to be interrupted when their generation is reduced or off-line, and the distribution system is not capable of being used to serve their load. Actual savings, if any, from a customer in a situation similar to the one described in this example, would be based on their particular circumstances.

PacifiCorp – 2007 IRP Appendix I – IRP Regulatory Compliance
157
APPENDIX I – IRP REGULATORY COMPLIANCE
BACKGROUND
Least-cost planning (i.e., Integrated Resource Planning) guidelines were first imposed on regu-lated utilities by state commissions in the 1980s. Their purpose was to require utilities to con-sider all resource alternatives, including demand-side measures, on an equal comparative footing, when making resource planning decisions to meet growing load obligations. Integrated resource planning has expanded since then to incorporate the consideration of risk, uncertainty, and envi-ronmental externality costs into the resource evaluation framework. Planning rules were also intended to require utilities to involve regulators and the general public in the planning process prior to making resource decisions. PacifiCorp prepares an IRP for the states in which it provides retail service. While the rules among the jurisdictional states vary in substance and style concerning IRP submission require-ments, there is a consistent thread in intent and approach. PacifiCorp is required to file an IRP every two years with most state commissions. The IRP must look at all resource alternatives on a level playing field and propose a near-term action plan that assures adequate supply to meet load obligations at least cost, while taking into account risks and uncertainties. The IRP must be developed in an open, public process and give interested parties a meaningful opportunity to par-ticipate in the planning. This appendix provides a discussion on how the 2007 IRP complies with the various state com-mission IRP Standards and Guidelines, 2004 IRP acknowledgement requirements, and other commission decisions. Included at the end of this appendix are the following tables: ● Table I.1 – Provides an overview and comparison of the rules in each state for which IRP
submission is required.3 ● Table I.2 – Provides a description of how the 2004 IRP acknowledgement requirements and
other commission requests were addressed. ● Table I.3 – Provides an explanation of how this plan addresses each of the items contained in
the new Oregon IRP guidelines issued in January 2007. ● Table I.4 – Provides an explanation of how this plan addresses each of the items contained in
the Utah Public Service Commission IRP Standard and Guidelines issued in June 1992.
GENERAL COMPLIANCE
PacifiCorp prepares the IRP on a biennial basis and files the IRP with the state commissions. The preparation of the IRP is done in an open public process with consultation between all inter-ested parties, including commissioners and commission staff, customers, and other stakeholders. This open process provides parties with a substantial opportunity to contribute information and ideas in the planning process, and also serves to inform all parties on the planning issues and
3 California and Wyoming requirements are not summarized in Table I.1. The Wyoming requirements are discussed
in the chapter text. California guidelines exempt a utility with less than 500,000 customers in the state from filing an IRP.

PacifiCorp – 2007 IRP Appendix I – IRP Regulatory Compliance
158
approach. The public input process for this IRP, described in Volume 1, Chapter 2, as well as in Appendix F, fully complies with the IRP Standards and Guidelines. The IRP provides a framework and plan for future actions to ensure PacifiCorp continues to pro-vide reliable and least-cost electric service to its customers. The IRP evaluates, over a twenty-year planning period, the future loads of PacifiCorp customers and the capability of existing re-sources to meet this load. To fill any gap between changes in loads and existing resources, the IRP evaluates all available resource options, as required by state commission rules. These resource alternatives include sup-ply-side, demand-side, and transmission alternatives. The evaluation of the alternatives in the IRP, as detailed in Chapters 6 and 7, meets this requirement and includes the impact to system costs, system operations, supply and transmission reliability, and the impacts of numerous risks, uncertainties and externality costs that could occur. To perform the analysis and evaluation, PacifiCorp employs a suite of models that simulate the complex operation of the PacifiCorp sys-tem and its integration within the Western Interconnection. The models allow for a rigorous test-ing of a reasonably broad range of commercially feasible resource alternatives available to PacifiCorp on a consistent and comparable basis. The analytical process, including the risk and uncertainty analysis, fully complies with IRP Standards and Guidelines, and is described at a high level in Chapter 2 and in greater detail in Chapter 6. The IRP analysis is designed to define a resource plan that is least cost, after consideration of risks and uncertainties. To test resource alternatives and identify a least-cost, risk adjusted plan, portfolio resource options were developed and tested against each other. This testing included examination of various tradeoffs among the portfolios, such as average cost versus risk, reliabil-ity, customer rate impacts, and average annual CO2 emissions. This portfolio analysis and the results and conclusions drawn from the analysis are described in Chapter 7. Consistent with the IRP Standards and Guidelines of Oregon, Utah, and Washington, this IRP includes an Action Plan (See Chapter 8). The Action Plan details near-term actions that are nec-essary to ensure PacifiCorp continues to provide reliable and least-cost electric service after con-sidering risk and uncertainty. Appendix G provides a progress report that relates the 2007 IRP Action Plan with those provided in the 2004 IRP and 2004 IRP Update. The 2007 IRP and the related Action Plan are filed with each commission with a request for prompt acknowledgement. Acknowledgement means that a commission recognizes the IRP as meeting all regulatory requirements at the time the acknowledgement is made. In the case where a commission acknowledges the IRP in part or not at all, PacifiCorp works with the commission to modify and re-file an IRP that meets acknowledgement standards. State commission acknowledgement orders or letters typically stress that an acknowledgement does not indicate approval or endorsement of IRP conclusions or analysis results. Similarly, an acknowledgement does not imply that favorable ratemaking treatment for resources proposed in the IRP will be given.

PacifiCorp – 2007 IRP Appendix I – IRP Regulatory Compliance
159
California Subsection (i) of California Public Utilities Code, Section 454.5, states that utilities serving less than 500,000 customers in the state are exempt from filing an Integrated Resource Plan for Cali-fornia. PacifiCorp serves only 42,000 customers in the most northern parts of the state. Pacifi-Corp filed for and received an exemption on July 10, 2003.
Idaho The Idaho Public Utilities Commission’s Order No. 22299, issued in January 1989, specifies integrated resource planning requirements. The Order mandates that PacifiCorp submit a Re-source Management Report (RMR) on a biennial basis. The intent of the RMR is to describe the status of IRP efforts in a concise format, and cover the following areas:
Each utility's RMR should discuss any flexibilities and analyses considered during comprehensive resource planning, such as: (1) examination of load forecast un-certainties; (2) effects of known or potential changes to existing resources; (3) consideration of demand and supply side resource options; and (4) contingencies for upgrading, optioning and acquiring resources at optimum times (considering cost, availability, lead time, reliability, risk, etc.) as future events unfold.
This IRP is submitted to the Idaho PUC as the Resource Management Report for 2007, and fully addresses the above report components. The IRP also evaluates DSM using a load decrement approach, as discussed in Chapters 6 and 7. This approach is consistent with using an avoided cost approach to evaluating DSM as set forth in IPUC Order No. 21249.
Oregon This IRP is submitted to the Oregon PUC in compliance with its new planning guidelines issued in January 2007 (Order No. 07-002). These guidelines supersede previous ones, and many codify analysis requirements outlined in the Commission’s acknowledgement order for PacifiCorp’s 2004 IRP. The Commission’s new IRP guidelines consist of substantive requirements (Guideline 1), proce-dural requirements (Guideline 2), plan filing, review, and updates (Guideline 3), plan compo-nents (Guideline 4), transmission (Guideline 5), conservation (Guideline 6), demand response (Guideline 7), environmental costs (Guideline 8), direct access loads (Guideline 9), multi-state utilities (Guideline 10), reliability (Guideline 11), distributed generation (Guideline 12), and re-source acquisition (Guideline 13). Consistent with the earlier guidelines (Order 89-507), the Commission notes that acknowledgement does not guarantee favorable ratemaking treatment, only that the plan seems reasonable at the time acknowledgment is given. Table I.3 provides considerable detail on how this plan addresses each of the requirements.
Utah This IRP is submitted to the Utah Public Service Commission in compliance with its 1992 Order on Standards and Guidelines for Integrated Resource Planning (Docket No. 90-2035-01, “Report and Order on Standards and Guidelines”). Table I.4 documents how PacifiCorp complies with each of these standards.

PacifiCorp – 2007 IRP Appendix I – IRP Regulatory Compliance
160
Washington This IRP is submitted to the Washington Utilities and Transportation Commission (WUTC) in compliance with its rule requiring least cost planning (Washington Administrative Code 480-100-238), and the rule amendment issued on January 9, 2006 (WAC 480-100-238, Docket No. UE-030311). In addition to a least cost plan, the rule requires provision of a two-year action plan and a progress report that “relates the new plan to the previously filed plan.” The rule amendment also now requires PacifiCorp to submit a work plan for informal commis-sion review not later than 12 months prior to the due date of the plan. The work plan is to lay out the contents of the IRP, the resource assessment method, and timing and extent of public partici-pation. PacifiCorp filed a work plan with the Commission on February 21, 2006, and had a fol-low-up conference call with WUTC staff to make sure the work plan met staff expectations. Finally, the rule amendment now requires PacifiCorp to provide an assessment of transmission system capability and reliability. This requirement was met in this IRP by modeling the com-pany’s current transmission system along with both generation and transmission resource options as part of its resource portfolio analyses. These analyses used such reliability metrics as Loss of Load Probability and Energy Not Served to assess the impacts of different resource combinations on system reliability. The stochastic simulation and risk analysis section of Chapter 7 reports the reliability analysis results.
Wyoming On October 4, 2001, the Public Service Commission of Wyoming issued an Order and Stipula-tion requiring PacifiCorp to file annual resource planning and transmission reports for a three-year time period beginning in 2002, each to be submitted on March 31, Each report “will address (1) load and resource planning issues affecting Wyoming, and (2) transmission investment, op-eration and planning issues affecting Wyoming.” PacifiCorp submitted its last report in March 2004.

Paci
fiCor
p –
2007
IRP
Ap
pend
ix I
– IR
P Re
gula
tory
Com
plia
nce
16
1
Tab
le I.
1 –
Inte
grat
ed R
esou
rce
Plan
ning
Sta
ndar
ds a
nd G
uide
lines
Sum
mar
y by
Sta
te
Top
ic
Ore
gon
Uta
h W
ashi
ngto
n Id
aho
Sour
ce
Ord
er 8
9-50
7 Le
ast-c
ost P
lann
ing
for R
e-so
urce
Acq
uisi
tions
, A
pril
20, 1
989.
O
rder
No.
07-
002,
Inve
stig
atio
n In
to In
tegr
ated
Res
ourc
e Pl
an-
ning
, Jan
uary
8, 2
007.
Doc
ket 9
0-20
35-0
1 St
anda
rds a
nd G
uide
lines
for
Inte
grat
ed R
esou
rce
Plan
ning
Ju
ne 1
8, 1
992.
WA
C 4
80-1
00-2
51 L
east
cos
t pl
anni
ng, M
ay 1
9, 1
987,
and
as
amen
ded
from
WA
C 4
80-1
00-
238
Leas
t Cos
t Pla
nnin
g Ru
le-
mak
ing,
Jan
uary
9, 2
006
(Doc
ket #
UE-
0303
11)
Ord
er 2
2299
El
ectr
ic U
tility
Con
serv
atio
n St
anda
rds a
nd P
ract
ices
Ja
nuar
y, 1
989.
Filin
g R
equi
rem
ents
Le
ast-c
ost p
lans
mus
t be
filed
w
ith th
e C
omm
issi
on.
An
Inte
grat
ed R
esou
rce
Plan
(I
RP)
is to
be
subm
itted
to
Com
mis
sion
.
Subm
it a
leas
t cos
t pla
n to
the
Com
mis
sion
. Pl
an to
be
deve
l-op
ed w
ith c
onsu
ltatio
n of
Com
-m
issi
on st
aff,
and
with
pub
lic
invo
lvem
ent.
Subm
it “R
esou
rce
Man
agem
ent
Rep
ort”
(RM
R) o
n pl
anni
ng
stat
us.
Als
o fil
e pr
ogre
ss re
ports
on
con
serv
atio
n an
d lo
w-in
com
e pr
ogra
ms.
Freq
uenc
y Pl
ans f
iled
bien
nial
ly. I
nter
im
repo
rts o
n pl
an p
rogr
ess a
lso
requ
ired
(info
rmat
iona
l fili
ng
only
). O
rder
07-
002
requ
ires I
RP
filin
g w
ithin
two
year
s of i
ts
prev
ious
IRP
ackn
owle
dgem
ent
orde
r.
File
bie
nnia
lly.
File
bie
nnia
lly.
RM
P to
be
filed
at l
east
bie
nni-
ally
. C
onse
rvat
ion
repo
rts to
be
filed
ann
ually
.
Com
mis
sion
re
spon
se
Leas
t-cos
t pla
n (L
CP)
ack
now
l-ed
ged
if fo
und
to c
ompl
y w
ith
stan
dard
s and
gui
delin
es.
A
deci
sion
mad
e in
the
LCP
proc
-es
s doe
s not
gua
rant
ee fa
vora
ble
rate
-mak
ing
treat
men
t. Th
e O
PUC
may
dire
ct th
e ut
ility
to
revi
se th
e IR
P or
con
duct
add
i-tio
nal a
naly
sis b
efor
e an
ac-
know
ledg
emen
t ord
er is
issu
ed.
Not
e, h
owev
er, t
hat R
ate
Plan
le
gisl
atio
n al
low
s pre
-app
rova
l of
nea
r-te
rm re
sour
ce in
vest
-m
ents
.
IRP
ackn
owle
dged
if fo
und
to
com
ply
with
stan
dard
s and
gu
idel
ines
. Pr
uden
ce re
view
s of
new
reso
urce
acq
uisi
tions
will
oc
cur d
urin
g ra
te m
akin
g pr
o-ce
edin
gs.
The
plan
will
be
cons
ider
ed, w
ith
othe
r ava
ilabl
e in
form
atio
n,
whe
n ev
alua
ting
the
perf
orm
ance
of
the
utili
ty in
rate
pro
ceed
ings
. W
UTC
send
s a le
tter d
iscu
ssin
g th
e re
port,
mak
ing
sugg
estio
ns
and
requ
irem
ents
and
ack
now
l-ed
ges t
he re
port.
Rep
ort d
oes n
ot c
onst
itute
pre
-ap
prov
al o
f pro
pose
d re
sour
ce
acqu
isiti
ons.
Id
aho
send
s a sh
ort l
ette
r sta
ting
that
they
acc
ept t
he fi
ling
and
ackn
owle
dge
the
repo
rt as
satis
-fy
ing
Com
mis
sion
requ
irem
ents
.

Paci
fiCor
p –
2007
IRP
Ap
pend
ix I
– IR
P Re
gula
tory
Com
plia
nce
16
2
Top
ic
Ore
gon
Uta
h W
ashi
ngto
n Id
aho
Proc
ess
The
publ
ic a
nd o
ther
util
ities
are
al
low
ed si
gnifi
cant
invo
lvem
ent
in th
e pr
epar
atio
n of
the
plan
, w
ith o
ppor
tuni
ties t
o co
ntrib
ute
and
rece
ive
info
rmat
ion.
Ord
er
07-0
02 re
quire
s tha
t the
util
ity
pres
ent I
RP
resu
lts to
the
OPU
C
at a
pub
lic m
eetin
g pr
ior t
o th
e de
adlin
e fo
r writ
ten
publ
ic c
om-
men
ts. C
omm
issi
on st
aff a
nd
parti
es sh
ould
com
plet
e th
eir
com
men
ts a
nd re
com
men
datio
ns
with
in si
x m
onth
s afte
r IR
P fil
ing.
C
ompe
titiv
e se
cret
s mus
t be
prot
ecte
d.
Plan
ning
pro
cess
ope
n to
the
publ
ic a
t all
stag
es.
IRP
deve
l-op
ed in
con
sulta
tion
with
the
Com
mis
sion
, its
staf
f, w
ith a
m-
ple
oppo
rtuni
ty fo
r pub
lic in
put.
In c
onsu
ltatio
n w
ith C
omm
issi
on
staf
f, de
velo
p an
d im
plem
ent a
pu
blic
invo
lvem
ent p
lan.
In-
volv
emen
t by
the
publ
ic in
de-
velo
pmen
t of t
he p
lan
is re
-qu
ired.
For
the
amen
ded
rule
s is
sued
in Ja
nuar
y 20
06, P
acifi
-C
orp
is re
quire
d to
subm
it a
wor
k pl
an fo
r inf
orm
al c
omm
is-
sion
revi
ew n
ot la
ter t
han
12
mon
ths p
rior t
o th
e du
e da
te o
f th
e pl
an. T
he w
ork
plan
is to
lay
out t
he c
onte
nts o
f the
IRP,
re-
sour
ce a
sses
smen
t met
hod,
and
tim
ing
and
exte
nt o
f pub
lic p
ar-
ticip
atio
n.
Util
ities
to w
ork
with
Com
mis
-si
on st
aff w
hen
revi
ewin
g an
d up
datin
g R
MR
s. R
egul
ar p
ublic
w
orks
hops
shou
ld b
e pa
rt of
pr
oces
s.
Focu
s 20
-yea
r pla
n, w
ith e
nd-e
ffec
ts,
and
a sh
ort-t
erm
(tw
o-ye
ar)
actio
n pl
an. T
he IR
P pr
oces
s sh
ould
resu
lt in
the
sele
ctio
n of
th
at m
ix o
f opt
ions
whi
ch y
ield
s, fo
r soc
iety
ove
r the
long
run,
the
best
com
bina
tion
of e
xpec
ted
cost
s and
var
ianc
e of
cos
ts.
20-y
ear p
lan,
with
shor
t-ter
m
(fou
r-ye
ar) a
ctio
n pl
an.
Spec
ific
actio
ns fo
r the
firs
t tw
o ye
ars a
nd
antic
ipat
ed a
ctio
ns in
the
seco
nd
two
year
s to
be d
etai
led.
The
IRP
proc
ess s
houl
d re
sult
in th
e se
-le
ctio
n of
the
optim
al se
t of
reso
urce
s giv
en th
e ex
pect
ed
com
bina
tion
of c
osts
, ris
k an
d un
certa
inty
.
20-y
ear p
lan,
with
shor
t-ter
m
(two-
year
) act
ion
plan
. Th
e pl
an d
escr
ibes
mix
of r
e-so
urce
s suf
ficie
nt to
mee
t cur
rent
an
d fu
ture
load
s at “
low
est r
ea-
sona
ble”
cos
t to
utili
ty a
nd ra
te-
paye
rs. R
esou
rce
cost
, mar
ket
vola
tility
risk
s, de
man
d-si
de
reso
urce
unc
erta
inty
, res
ourc
e di
spat
chab
ility
, rat
epay
er ri
sks,
polic
y im
pact
s, an
d en
viro
n-m
enta
l ris
ks, m
ust b
e co
nsid
ered
.
20-y
ear p
lan
to m
eet l
oad
oblig
a-tio
ns a
t lea
st-c
ost,
with
equ
al
cons
ider
atio
n to
dem
and
side
re
sour
ces.
Pla
n to
add
ress
risk
s an
d un
certa
intie
s. Em
phas
is o
n cl
arity
, und
erst
anda
bilit
y, re
-so
urce
cap
abili
ties a
nd p
lann
ing
flexi
bilit
y.
Elem
ents
B
asic
ele
men
ts in
clud
e:
• A
ll re
sour
ces e
valu
ated
on
a co
nsis
tent
and
com
para
ble
ba-
sis.
• R
isk
and
unce
rtain
ty m
ust b
e co
nsid
ered
. •
The
prim
ary
goal
mus
t be
leas
t cos
t, co
nsis
tent
with
the
IRP
will
incl
ude:
•
Ran
ge o
f for
ecas
ts o
f fut
ure
load
gro
wth
•
Eval
uatio
n of
all
pres
ent a
nd
futu
re re
sour
ces,
incl
udin
g de
man
d si
de, s
uppl
y si
de a
nd
mar
ket,
on a
con
sist
ent a
nd
com
para
ble
basi
s.
The
plan
shal
l inc
lude
: •
A ra
nge
of fo
reca
sts o
f fut
ure
dem
and
usin
g m
etho
ds th
at
exam
ine
the
effe
ct o
f eco
-no
mic
forc
es o
n th
e co
nsum
p-tio
n of
ele
ctric
ity a
nd th
at a
d-dr
ess c
hang
es in
the
num
ber,
type
and
eff
icie
ncy
of e
lect
ri-
Dis
cuss
ana
lyse
s con
side
red
incl
udin
g:
• Lo
ad fo
reca
st u
ncer
tain
ties;
•
Kno
wn
or p
oten
tial c
hang
es
to e
xist
ing
reso
urce
s;
• Eq
ual c
onsi
dera
tion
of d
e-m
and
and
supp
ly si
de re
-so
urce
opt
ions
;

Paci
fiCor
p –
2007
IRP
Ap
pend
ix I
– IR
P Re
gula
tory
Com
plia
nce
16
3
Top
ic
Ore
gon
Uta
h W
ashi
ngto
n Id
aho
long
-run
pub
lic in
tere
st.
• Th
e pl
an m
ust b
e co
nsis
tent
w
ith O
rego
n an
d fe
dera
l en-
ergy
pol
icy.
•
Exte
rnal
cos
ts m
ust b
e co
n-si
dere
d, a
nd q
uant
ified
whe
re
poss
ible
. O
PUC
spec
ifies
en-
viro
nmen
tal a
dder
s (O
rder
N
o. 9
3-69
5, D
ocke
t UM
424
). •
Iden
tify
acqu
isiti
on st
rate
gies
fo
r act
ion
plan
reso
urce
s, as
-se
ss a
dvan
tage
s/di
sadv
anta
ges
of re
sour
ce o
wne
rshi
p ve
rsus
pu
rcha
ses,
and
iden
tify
benc
hmar
k re
sour
ces c
onsi
d-er
ed fo
r com
petit
ive
bidd
ing.
•
Mul
ti-st
ate
utili
ties s
houl
d pl
an th
eir g
ener
atio
n an
d tra
nsm
issi
on sy
stem
s on
an
inte
grat
ed-s
yste
m b
asis
. •
Avo
ided
cos
t fili
ng re
quire
d w
ithin
30
days
of a
ckno
wl-
edge
men
t.
• A
naly
sis o
f the
role
of c
om-
petit
ive
bidd
ing
• A
pla
n fo
r ada
ptin
g to
diff
er-
ent p
aths
as t
he fu
ture
unf
olds
. •
A c
ost e
ffec
tiven
ess m
etho
d-ol
ogy.
•
An
eval
uatio
n of
the
finan
cial
, co
mpe
titiv
e, re
liabi
lity
and
oper
atio
nal r
isks
ass
ocia
ted
with
reso
urce
opt
ions
, and
ho
w th
e ac
tion
plan
add
ress
es
thes
e ris
ks.
• D
efin
ition
of h
ow ri
sks a
re
allo
cate
d be
twee
n ra
tepa
yers
an
d sh
areh
olde
rs
• D
SM a
nd su
pply
side
re-
sour
ces e
valu
ated
at “
Tota
l R
esou
rce
Cos
t” ra
ther
than
ut
ility
cos
t.
cal e
nd-u
ses.
• A
n as
sess
men
t of c
omm
er-
cial
ly a
vaila
ble
cons
erva
tion,
in
clud
ing
load
man
agem
ent,
as w
ell a
s an
asse
ssm
ent o
f cu
rren
tly e
mpl
oyed
and
new
po
licie
s and
pro
gram
s nee
ded
to o
btai
n th
e co
nser
vatio
n im
-pr
ovem
ents
. •
Ass
essm
ent o
f a w
ide
rang
e of
co
nven
tiona
l and
com
mer
-ci
ally
ava
ilabl
e no
ncon
ven-
tiona
l gen
erat
ing
tech
nolo
gies
•
An
asse
ssm
ent o
f tra
nsm
is-
sion
syst
em c
apab
ility
and
re-
liabi
lity
(Add
ed p
er a
men
ded
rule
s iss
ued
in Ja
nuar
y 20
06).
• A
com
para
tive
eval
uatio
n of
en
ergy
supp
ly re
sour
ces (
in-
clud
ing
trans
mis
sion
and
dis
-tri
butio
n) a
nd im
prov
emen
ts
in c
onse
rvat
ion
usin
g “l
owes
t re
ason
able
cos
t” c
riter
ia.
• In
tegr
atio
n of
the
dem
and
fore
cast
s and
reso
urce
eva
lua-
tions
into
a lo
ng-r
ange
(at
leas
t 10
year
s) p
lan.
•
All
plan
s sha
ll al
so in
clud
e a
prog
ress
repo
rt th
at re
late
s the
ne
w p
lan
to th
e pr
evio
usly
fil
ed p
lan.
• C
ontin
genc
ies f
or u
pgra
d-in
g, o
ptio
ning
and
acq
uirin
g re
sour
ces a
t opt
imum
tim
es;
• R
epor
t on
exis
ting
reso
urce
st
ack,
load
fore
cast
and
ad-
ditio
nal r
esou
rce
men
u.

PacifiCorp – 2007 IRP Appendix I – IRP Regulatory Compliance
164
Table I.2 – Handling of 2004 IRP Acknowledgement and Other IRP Requirements
State IRP Requirement or
Recommendation How the Requirement or Recommendation
is Addressed in the 2007 IRP ID Staff recommends that PacifiCorp con-
tinue to evaluate and investigate IGCC in its next IRP. (Acceptance of Filing, Case No. PAC-E-05-2, p. 6)
PacifiCorp incorporated various IGCC re-sources, distinguished by location and tech-nology configuration (including CO2 capture and sequestration), in its capacity expansion optimization and stochastic modeling studies. Chapter 7 describes the IGCC modeling re-sults.
ID As we indicated in our acceptance of the Company’s 2003 Electric IRP fil-ing, in addition to being apprised through periodic status reports of sup-ply resources the Company is actually building or contracting for and demand side programs the Company is imple-menting, the Commission expects to receive periodic updates as to the Com-pany’s specific plans for issuing re-quests for proposals (RFPs). (Accep-tance of Filing, Case No. PAC-E-05-2, p. 7)
PacifiCorp provided the Idaho Public Utility Commission procurement updates on April 12 and August 30, 2006, and plans to provide them on a quarterly basis.
OR Use decrement values to assess cost-effective bids in DSM RFP(s). Acquire the base DSM (PacifiCorp and ETO combined) of 250 MWa and 200 MWa or more of additional Class 2 DSM found cost-effective through RFP or in-house programs, up to the levels re-quired to serve load growth, and as ap-proved by each State’s Commission. (Action Item 1 revision, OPUC Order 06-029, p. 60)
See the “Class 2 Demand-side Management Decrement Analysis” section in Chapter 7 for updated decrement values. See the “Existing Resources” section of Chapter 4 for an update on the progress of Class 2 DSM programs, as well as Appendix G, “Action Plan Status”.
OR Execute an agreement with the Energy Trust of Oregon, as soon as possible, to reserve funds for the above-market costs of renewable resources that bene-fit Oregon ratepayers and enable timely completion of resource agreements with the recent extension of the federal production tax credit. (Additional Ac-tion Item, OPUC Order 06-029, p. 60)
A master agreement to fund the above-market costs of new renewable energy resources was signed on April 6, 2006.

PacifiCorp – 2007 IRP Appendix I – IRP Regulatory Compliance
165
State IRP Requirement or
Recommendation How the Requirement or Recommendation
is Addressed in the 2007 IRP OR For the next IRP or Action Plan, de-
velop supply curves for various types of Class 1 DSM resources, model them as portfolio options that compete with supply-side options, and analyze cost and risk reduction benefits. Evaluate this approach for Class 2 DSM re-sources and recommend whether this approach is preferable to the current decrement approach. (Additional Ac-tion Item, OPUC Order 06-029, p. 60)
PacifiCorp used Class 1 DSM proxy supply curves, developed by Quantec LLC, for port-folio optimization modeling using the Capac-ity Expansion Module. See Appendix B for the complete Quantec DSM study. Chapter 5 outlines the supply curves used in the CEM. For Class 2 DSM, the company chose to con-tinue using the decrement approach for the 2007 IRP, but enhanced it by adopting sto-chastic simulation to capture risk. Pacifi-Corp’s plan to use decrement analysis was presented and discussed at the February 10, 2006 technical workshop on demand-side management.
OR For the next IRP or Action Plan, as-sume existing interruptible contracts continue unless they are not renegoti-able or other resources would provide better value. (Additional Action Item, OPUC Order 06-029, p. 60)
PacifiCorp adopted the assumption that exist-ing interruptible contracts are extended until beyond the end of the 20-year IRP study pe-riod.
OR For the next IRP or Action Plan, assess IGCC technology in a location poten-tially suitable for CO2 sequestration, including cost, commercialization status, technology risk, and compara-tive performance under future uncer-tainties, including market prices and CO2 regulation. (Additional Action Item, OPUC Order 06-029, p. 61)
PacifiCorp included several IGCC plant con-figurations and locations as resource options in its “alternative future” scenario modeling, including one with carbon capture and se-questration. IGCC resources were also in-cluded in risk analysis portfolios for stochas-tic simulation. See “Resource Options” in Chapter 5 for IGCC cost and performance characteristics. See Chapter 7 for IGCC mod-eling results.
OR For the next IRP or Action Plan, ana-lyze the costs and risks of portfolios that include various combinations of additional transmission to reach re-sources that are shorter term or lower cost, along with new generating re-sources and their associated transmis-sion. (Additional Action Item, OPUC Order 06-029, p. 61)
PacifiCorp included various transmission re-sources in its capacity optimization model. For a CEM sensitivity study, the company included a proxy resource representing the Frontier Line project, reflecting a strategy to access markets in California and the south-west U.S. See “Resource Expansion Alterna-tives” in Chapter 5 for details on the trans-mission resources modeled, and Chapter 7 for modeling results.

PacifiCorp – 2007 IRP Appendix I – IRP Regulatory Compliance
166
State IRP Requirement or
Recommendation How the Requirement or Recommendation
is Addressed in the 2007 IRP OR Conduct an economic analysis of
achievable Class 1 and Class 2 DSM measures in PacifiCorp’s service area over the IRP study period, and assess how the Company’s base and planned programs compare with the cost-effective amounts determined in the study. (New IRP requirement, OPUC Order 06-029, p. 61)
Due to the timing of OPUC’s 2004 acknowl-edgment Order (in January 2006), and as agreed to by OPUC staff, this requirement is being met via the MEHC commitment to per-form a multi-state DSM potentials study to be completed by June 2007. Development and use of Quantec’s proxy DSM supply curves was intended as a compromise strategy until the DSM potentials study becomes available for use in the next IRP.
OR Determine the expected load reductions from Class 3 DSM programs such as new interruptible contracts and the En-ergy Exchange at various prices, and model these programs as portfolio op-tions that compete with supply-side op-tions. (New IRP requirement, OPUC Order 06-029, p. 61)
PacifiCorp incorporated supply curves into its portfolio modeling for the following Class 3 DSM resources: Curtailable Rates, Demand Buyback, and Critical Peak Pricing. See Chapter 4 and Appendix B for details.
OR Evaluate loss of load probability, ex-pected unserved energy, and worst-case unserved energy, as well as Class 3 DSM alternatives for meeting unserved energy. (New IRP requirement, OPUC Order 06-029, p. 61)
PacifiCorp included these supply reliability metrics as part of its stochastic portfolio risk analysis. The Planning and Risk Module (PaR) 12-percent capacity reserve margin sensitivity study included the maximum available amount of Class 3 DSM as indi-cated by the Quantec proxy supply curves.
OR Evaluate alternatives for determining the expected annual peak demand for determining the planning margin — for example, planning to the average of the eight-hour super-peak period. (New IRP requirement, OPUC Order 06-029, p. 61)
This requirement was met via a Capacity Ex-pansion Module sensitivity analysis. See Chapter 7 for a results summary.
OR Evaluate, within portfolio modeling, the potential for reducing costs and risks of generation and transmission by including high-efficiency CHP re-sources and aggregated dispatchable customer standby generation of various sizes within load-growth areas. (New IRP requirement, OPUC Order 06-029, p. 61)
CHP and aggregated dispatchable customer standby generation were modeled as part of a 12% planning reserve margin sensitivity analysis using PaR. See Chapter 7 for a re-sults summary.

PacifiCorp – 2007 IRP Appendix I – IRP Regulatory Compliance
167
State IRP Requirement or
Recommendation How the Requirement or Recommendation
is Addressed in the 2007 IRP OR Evaluate the potential value of CHP re-
sources in deferring a major distribu-tion system investment associated with load growth, assuming physical assur-ance of load shedding when the genera-tor goes off line, up to the number of hours required to defer the investment. (New IRP requirement, OPUC Order 06-029, p. 61)
PacifiCorp conducted a study of distribution system investment deferral potential assum-ing a 5-megawatt CHP interconnection pro-ject in the company’s west control area. See Appendix H.
OR If pumped storage technology becomes a viable resource option in the future, the Commission expects PacifiCorp to analyze the associated environmental costs that ratepayers might incur. (OPUC Order 06-029, p. 53)
Pumped storage was not evaluated in this IRP due to an expected commercial operations date beyond the 10-year acquisition horizon.
OR Analyze planning margin cost-risk tradeoffs within stochastic modeling of portfolios. If feasible, analyze the cost-risk tradeoff of all portfolios at various planning margins. If not feasible, build all portfolios to a set planning margin, test them stochastically, and adjust top-performing portfolios to higher and lower planning margins for further sto-chastic evaluation. (New requirement, OPUC Order 06-029, p. 61)
PacifiCorp’s approach to meeting this re-quirement was to use the CEM to derive op-timal portfolios using planning reserve mar-gins set at 12%, 15%, and 18%. To determine the stochastic impacts, these same portfolios were run with the PaR model in stochastic mode. PacifiCorp also simulated risk analysis portfolios derived from CEM runs con-strained with both 12% and 15% planning reserve margins.
OR For the next IRP or Action Plan, ana-lyze renewable resources in a manner comparable to other supply-side op-tions, including testing cost and risk metrics for portfolios with amounts higher and lower than current targets, further refine wind’s capacity contribu-tion, and consider the effect of fuel type for thermal resource additions on the Company’s cost to integrate wind re-sources. (Additional Action Item, OPUC Order 06-029, p. 60)
Proxy wind projects were included as re-source options in CEM runs, and included in stochastic simulations for evaluating risk analysis portfolios. See Appendix J for the results of PacifiCorp’s updated studies on wind integration costs, determination of cost-effective wind resources, and wind capacity planning contribution. Appendix J also in-cludes a discussion on the effect of fuel type on wind integration costs. Chapter 7 outlines stochastic simulation results for portfolios with incremental wind additions.
OR We also expect the Company to fully explore whether delaying a commitment to coal until IGCC technology is further commercialized is a reasonable course of action. (OPUC Order 06-029, p. 51)
PacifiCorp developed and evaluated a portfo-lio that excludes pulverized coal as a resource option. PacifiCorp also evaluated two addi-tional portfolios that were specified by OPUC staff. These two portfolios, each developed according to 12% and 15% planning reserve

PacifiCorp – 2007 IRP Appendix I – IRP Regulatory Compliance
168
State IRP Requirement or
Recommendation How the Requirement or Recommendation
is Addressed in the 2007 IRP margins respectively, (1) defer pulverized coal until after 2014, (2), include an IGCC plant in 2014, and (3) include 600 MW of additional wind. The portfolio evaluation re-sults are summarized in Chapter 7.
UT We direct the Company to structure the public input process to allow sufficient time for discussion of issues raised by parties and to address relevant issues raised in this IRP. (Utah PSC, Docket No. 05-2035-01, p. 21)
PacifiCorp organized the public meeting schedule to front-load discussions on key modeling approaches and issues (DSM, re-newables, CO2 analysis, etc.). The company also distributed papers on scenario analysis and risk analysis portfolio development to provide interim information prior to public meetings. See Chapter 2, “Stakeholder En-gagement”.
UT We believe a comprehensive annual update to the IRP between the biennial IRP filings should continue. (Utah PSC, Docket No. 05-2035-01, p. 21)
PacifiCorp will continue with biennial IRP updates, since this is now a requirement un-der the new Oregon PUC.
UT We find reasonable the Division’s re-quest for semi-annual updates of the load and resource balance. (Utah PSC, Docket No. 05-2035-01, p. 21)
PacifiCorp provided a semi-annual update of its load and resource balance at the April 20, 2007 IRP public meeting.
UT We direct the Company to investigate improving the transparency of the IRP modeling to increase confidence in the results. (Utah PSC, Docket No. 05-2035-01, p. 21)
PacifiCorp provided stakeholders with a de-tailed modeling plan and scenario/risk analy-sis methodology, and solicited comments on them prior to the start of IRP modeling. Model results documentation has been dis-tributed at the conclusion of the key portfolio analysis milestones—evaluation of CEM runs, selection of risk analysis portfolios for stochastic simulation, and selection of the preferred portfolio.
UT Include a section that specifically ad-dresses the PURPA Fuel Sources Stan-dard in all future Integrated Resource Plans. (“Determination Concerning The PURPA Fuel Sources Standard”, Docket No. 06-999-03)
A section on fuel source diversity is included in Chapter 8, “Action Plan”.
UT Per agreement with Utah Commission staff, include a 20-year forecasted aver-age heat rate trend for the company’s fossil fuel generator fleet that includes IRP resources and currently planned retirements.
A section titled, “Forecasted Heat Rate Trend,” is included in Chapter 7.

PacifiCorp – 2007 IRP Appendix I – IRP Regulatory Compliance
169
State IRP Requirement or
Recommendation How the Requirement or Recommendation
is Addressed in the 2007 IRP WA The recommended reserve margin is
greatly influenced by the nature, mix, and capacity of available resources, and risks associated with any particular re-source. Thus, the company should quantify the reserve margin in a way that incorporates risks posed by each specific resource. (WUTC IRP Ac-knowledgment Letter, Docket UE-050095, p. 10)
PacifiCorp outlined at IRP public meetings (January 13 and May 10, 2006) an innovative statistical approach for determining the amount of an additional resource needed to a keep a utility system's Loss of Load Probabil-ity (LOLP) constant. This method, which ac-counts for resource-specific reliability char-acteristics, was applied in this IRP to deter-mine the Peak Load Carrying Capability for wind resources. PacifiCorp is evaluating this approach for applicability to all resource ad-ditions modeled in the IRP.
WA The Commission expects PacifiCorp’s next plan to further refine wind en-ergy's reserve value and effects on the stability of power systems. PacifiCorp should also work to minimize any qualifications around its estimates of the value of wind. The Commission en-courages PacifiCorp to continue to ex-plore renewable resources, and to de-velop these resources when economic and compatible with system objectives. (WUTC IRP Acknowledgment Letter, Docket UE-050095, p. 7)
See Appendix J for the results of PacifiCorp’s updated studies on wind integration costs, determination of cost-effective wind re-sources, and wind capacity planning contri-bution. Chapter 7 outlines stochastic simula-tion results for risk analysis portfolios with different amounts and timing of wind re-sources. PacifiCorp’s preferred portfolio in-cludes 2,000 megawatts of renewables, as opposed to 1,400 megawatts for the original MEHC renewables commitment.
WA We encourage PacifiCorp to further re-fine its approach by developing load curves for its west-side control area. The company should explicitly look at the load shapes for residential heating and lighting to assess the potential for DSM and energy efficiency measures in Washington. (WUTC IRP Acknowl-edgment Letter, Docket UE-050095, p. 7)
PacifiCorp evaluated its load shapes for Class 2 DSM decrement calculation, and deter-mined that residential lighting load shapes for the west and east control areas should be added. These load shapes are reported in Chapter 5. Decrement results for the new load shapes are reported in Chapter 7, “Class 2 DSM Decrement Analysis”.
WA In the Commission’s letter regarding PacifiCorp’s 2002 IRP, the company needs to explore ways to quantify the risk preferences of customers and shareholders. Only by understanding its risks and the risk preferences of stakeholders can PacifiCorp rank and prioritize alternative resource portfo-lios. (WUTC IRP Acknowledgment
PacifiCorp has relied on the public process (including the 2004 IRP stakeholder satisfac-tion survey conducted in 2005) to solicit cus-tomer and other stakeholder views on what risk factors to consider and how to address them in resource portfolio evaluation. Pacifi-Corp's uncertainty and risk analysis frame-work for the 2007 IRP reflects this input. For example, the company used risk metrics and

PacifiCorp – 2007 IRP Appendix I – IRP Regulatory Compliance
170
State IRP Requirement or
Recommendation How the Requirement or Recommendation
is Addressed in the 2007 IRP Letter, Docket UE-050095, p. 7) risk trade-off analysis to address such criteria
as overall portfolio cost, supply reliability, and rate volatility impact, among others.
WA The company should consider the costs and advantages of implementing a multi-objective function optimization [model] as part of its next plan. (WUTC IRP Acknowledgment Letter, Docket UE-050095, p. 8)
PacifiCorp and WUTC staff participated in a conference call on April 18, 2006, pertaining to this issue and others identified in the WUTC IRP acknowledgment letter. Pacifi-Corp indicated that it was not aware of a commercially available multi-objective opti-mization modeling tool suitable for integrated resource planning.
WA The company needs to develop avoided costs for general purpose energy and capacity in both the short and long-term. Furthermore, PacifiCorp should derive an avoided cost schedule for transmission and distribution resources. (WUTC IRP Acknowledgment Letter, Docket UE-050095, p. 8)
PacifiCorp makes avoided cost filings after each IRP is filed. The company will consider expanding its avoided cost schedules to cover the areas identified by the WUTC.
WA PacifiCorp’s plan does not directly con-sider the price influence of various en-ergy commodities upon on another. PacifiCorp should consider whether its plan would benefit from linking gas, coal and oil prices through a high-level market fundamentals tool. (WUTC IRP Acknowledgment Letter, Docket UE-050095, p. 8)
PacifiCorp and WUTC staff participated in a conference call on April 18, 2006, pertaining to this issue and others identified in the WUTC IRP acknowledgment letter. The company stated that its fundamentals model-ing tool, MIDAS, addresses energy commod-ity interactions. This topic is addressed in Appendix A in the discussion on commodity prices.
WA The Commission encourages Pacifi-Corp to investigate using the most up-to-date models and tools, including, for example, those commonly used by other utilities such as the AURORA production cost and dispatch model. Also, additional detail regarding the al-gorithms and mathematics of the mod-eling tools would improve the value of the report. (WUTC IRP Acknowledg-ment Letter, Docket UE-050095, p. 4)
PacifiCorp routinely evaluates other com-puter models for applicability to the IRP process, including AURORA and its com-petitor products. PacifiCorp conducted an IRP benchmarking study in 2005 in which electric utility use of computer models was investigated. This study was included as Ap-pendix C of the 2004 IRP Update. Regarding the recommendation to disclose additional details on model algorithms and mathematics in the IRP, the company notes that its modeling tools are covered under vendor license agreements that prohibit dis-tribution of proprietary material except when required under regulatory commission order.

PacifiCorp – 2007 IRP Appendix I – IRP Regulatory Compliance
171
State IRP Requirement or
Recommendation How the Requirement or Recommendation
is Addressed in the 2007 IRP WA The Company used the MIDAS model
to compute variations off the base fore-cast. The plan did not document the assumptions, model structure or reli-ability of PIRA or MIDAS forecasts. PacifiCorp needs to allow access to the models used to forecast prices to Commission staff. Without knowledge of how the models operate staff cannot evaluate the fundamentals forecast model used by PIRA or other agencies. The Commission notes that other utili-ties in our jurisdiction provide staff ac-cess to representatives of the gas supply and price consultants to discuss the me-chanics of studies, data source, and pol-icy assumptions used in forecast mod-els. (WUTC IRP Acknowledgment Let-ter, Docket UE-050095, p. 5)
PacifiCorp proposes to institute a series of technical workshops on fundamentals model-ing for the next IRP, similar to the load fore-casting workshops held for the 2004 and 2007IRPs. PacifiCorp will work with Commission staff to provide knowledge of PacifiCorp's models and associated data and access to the company's consultants and studies upon re-quest and under appropriate confidentiality conditions where necessary.
WA Increasingly volatile natural gas prices have made short-term price predictions based on fundamentals modeling less reliable. Therefore, price forecasts gen-erated from non-fundamental models and the forwards market should support or supplement the price forecasts used in the two-year actions plan. (WUTC IRP Acknowledgment Letter, Docket UE-050095, p. 5)
PacifiCorp and WUTC staff participated in a conference call on April 18, 2006, pertaining to this issue and others identified in the WUTC IRP acknowledgment letter. Pacifi-Corp noted that it uses market information for the first six years of forward gas prices.
WA Given the importance of individual state policies in PacifiCorp’s resource acquisition decisions, the Commission specifically requests that the Company model and evaluate the effects of state specific policies on its decisions to ac-quire certain resources. (WUTC IRP Acknowledgment Letter, Docket UE-050095, p. 10)
PacifiCorp and WUTC staff participated in a conference call on April 18, 2006, pertaining to this issue and others identified in the WUTC IRP acknowledgment letter. The Commission’s concern was focused on state economic development policies in other states. PacifiCorp agreed to address this issue in narrative fashion given that state economic development initiatives would impact the load forecast and not resource modeling di-rectly. See the load forecasting section enti-tled, “Treatment of State Economic Devel-opment Policies” in Appendix A.

PacifiCorp – 2007 IRP Appendix I – IRP Regulatory Compliance
172
Table I.3 – Oregon Public Utility Commission IRP Standard and Guidelines
No. Requirement How the Guideline is Addressed in the
2007 IRP Guideline 1. Substantive Requirements
1.a.1 All resources must be evaluated on a con-sistent and comparable basis: All known resources for meeting the util-ity’s load should be considered, including supply-side options which focus on the generation, purchase and transmission of power – or gas purchases, transportation, and storage – and demand-side options which focus on conservation and demand response.
PacifiCorp considered a wide range of re-sources including renewables, cogeneration (combined heat and power), power pur-chases, thermal resources, and transmission. Chapters 5 and 6 document how PacifiCorp developed and assessed these technologies. In brief, the company used a combination of PacifiCorp generation staff expertise, Elec-tric Power Research Institute Technical As-sessment Guide (TAG®) data, and capacity expansion optimization modeling to assess these technologies. Generation resource types were initially assessed by PacifiCorp’s generation experts, and a list that captures the salient technology types and configura-tions was assembled (Chapter 5, Tables 5.1 and 5.2). Decisions on what generation re-sources to include in the Capacity Expansion Module was based on generation staff rec-ommendations and the need to limit resource options to a manageable number based on model constraints and run-time considera-tions. (The company notes that the need to place restrictions on the number of resource options is a common IRP problem for utili-ties that use such optimization models for long-term planning.) Based on the modeling lessons learned for this IRP and the anticipated expansion of resource options arising from the DSM po-tentials study due in June 2007, PacifiCorp intends to explore new resource screening methods to accommodate a broader range of technologies while meeting the requirement to assess technologies on a ‘consistent and comparable basis.”
1.a.2 All resources must be evaluated on a con-sistent and comparable basis: Utilities should compare different resource
PacifiCorp considered various combinations of fuel types, technologies, lead times, in-service dates, durations, and locations for

PacifiCorp – 2007 IRP Appendix I – IRP Regulatory Compliance
173
No. Requirement How the Guideline is Addressed in the
2007 IRP
fuel types, technologies, lead times, in-service dates, durations and locations in portfolio risk modeling.
both capacity expansion optimization model-ing (deterministic risk modeling via scenario analysis) as well as stochastic risk modeling. Chapters 6 and 7 document the modeling methodology and results, respectively. Chapter 5 describes resource attributes in detail. The range of resource attributes ac-counted for in stochastic risk analysis is in-dicated in Chapter 7, Tables 7.17 and 7.31 through 7.35. These tables list the resources included in the risk analysis portfolios.
1.a.3 All resources must be evaluated on a con-sistent and comparable basis: Consistent assumptions and methods should be used for evaluation of all re-sources.
PacifiCorp fully complies with this require-ment. The company used the Electric Power Research Institute’s Technical Assessment Guide (TAG®) to develop generic supply-side resource attributes based on a consistent characterization methodology. For demand-side resources, the company used Quantec LLC’s proxy supply curves, which applied a consistent methodology for determining technical, market, and achievable DSM po-tential. All portfolio resources were evalu-ated using the same sets of inputs. These inputs are documented in Appendix A.
1.a.4 All resources must be evaluated on a con-sistent and comparable basis: The after-tax marginal weighted-average cost of capital (WACC) should be used to discount all future resource costs.
PacifiCorp applied its after-tax WACC of 7.1 percent to discount all cost streams.
1.b.1 Risk and uncertainty must be considered: At a minimum, utilities should address the following sources of risk and uncertainty: 1. Electric utilities: load requirements, hydroelectric generation, plant forced out-ages, fuel prices, electricity prices, and costs to comply with any regulation of greenhouse gas emissions.
PacifiCorp fully complies with this require-ment. Each of the sources of risk identified in this guideline is treated as a stochastic variable in Monte Carlo production cost simulation. See the stochastic modeling methodology section in Chapter 7.
1.b.2 Risk and uncertainty must be considered: Utilities should identify in their plans any additional sources of risk and uncertainty.
PacifiCorp evaluated additional risks and uncertainties, including resource capital costs, coal prices, and the level of DSM achievable potential. See Chapter 6 for a discussion on what variables were modeled for scenario and stochastic risk analysis.

PacifiCorp – 2007 IRP Appendix I – IRP Regulatory Compliance
174
No. Requirement How the Guideline is Addressed in the
2007 IRP
1.c The primary goal must be the selection of a portfolio of resources with the best com-bination of expected costs and associated risks and uncertainties for the utility and its customers (“best cost/risk portfolio”).
PacifiCorp evaluated cost/risk tradeoffs for each of the risk analysis portfolios consid-ered. See Chapter 7 for the company’s port-folio risk analysis and determination of the preferred portfolio.
1.c.1 The planning horizon for analyzing re-source choices should be at least 20 years and account for end effects. Utilities should consider all costs with a reasonable likelihood of being included in rates over the long term, which extends beyond the planning horizon and the life of the re-source.
PacifiCorp used a 20-year study period for portfolio modeling, and a real levelized revenue requirement methodology for treat-ment of end effects.
1.c.2 Utilities should use present value of reve-nue requirement (PVRR) as the key cost metric. The plan should include analysis of current and estimated future costs for all long-lived resources such as power plants, gas storage facilities, and pipelines, as well as all short-lived resources such as gas supply and short-term power pur-chases.
PacifiCorp fully complies. Chapter 6 pro-vides a description of the PVRR methodol-ogy.
1.c.3.1 To address risk, the plan should include, at a minimum: 1. Two measures of PVRR risk: one that measures the variability of costs and one that measures the severity of bad out-comes.
PacifiCorp uses the standard deviation of stochastic production costs as the measure of cost variability. For the severity of bad out-comes, the company calculates several measures, including stochastic upper-tail PVRR (mean of highest five Monte Carlo iterations), risk exposure (upper-tail mean PVRR minus overall mean PVRR), and 95th percentile stochastic PVRR.
1.c.3.2 To address risk, the plan should include, at a minimum: 2. Discussion of the proposed use and im-pact on costs and risks of physical and financial hedging.
A discussion on costs and risks of physical and financial hedging is provided in Chapter 5.
1.c.4 The utility should explain in its plan how its resource choices appropriately balance cost and risk.
Chapter 7 summarizes the results of Pacifi-Corp’s cost/risk tradeoff analysis, and de-scribes what criteria the company used to determine what resource combinations pro-vide an appropriate balance between cost and risk.

PacifiCorp – 2007 IRP Appendix I – IRP Regulatory Compliance
175
No. Requirement How the Guideline is Addressed in the
2007 IRP
1.d The plan must be consistent with the long-run public interest as expressed in Oregon and federal energy policies.
PacifiCorp considered both current and ex-pected state and federal energy policies in portfolio modeling. Chapter 7 describes the decision process used to derive portfolios, which includes consideration of state re-source policy directions.
Guideline 2. Procedural Requirements 2.a The public, which includes other utilities,
should be allowed significant involvement in the preparation of the IRP. Involvement includes opportunities to contribute infor-mation and ideas, as well as to receive information. Parties must have an oppor-tunity to make relevant inquiries of the utility formulating the plan. Disputes about whether information requests are relevant or unreasonably burdensome, or whether a utility is being properly respon-sive, may be submitted to the Commission for resolution.
PacifiCorp fully complies with this require-ment. Chapter 2 provides an overview of the public process, while Appendix F documents the details on public meetings held for the 2007 IRP.
2.b While confidential information must be protected, the utility should make public, in its plan, any non-confidential informa-tion that is relevant to its resource evalua-tion and action plan. Confidential informa-tion may be protected through use of a protective order, through aggregation or shielding of data, or through any other mechanism approved by the Commission.
Both IRP volumes provide non-confidential information the company used for portfolio evaluation, as well as other data requested by stakeholders. PacifiCorp also provided stakeholders with non-confidential informa-tion to support public meeting discussions via email.
2.c The utility must provide a draft IRP for public review and comment prior to filing a final plan with the Commission.
PacifiCorp distributed a draft IRP document for external review on April 20, 2007.
Guideline 3: Plan Filing, Review, and Updates 3.a A utility must file an IRP within two years
of its previous IRP acknowledgment order. If the utility does not intend to take any significant resource action for at least two years after its next IRP is due, the utility may request an extension of its filing date from the Commission.
This Plan complies with this requirement.
3.b The utility must present the results of its filed plan to the Commission at a public
PacifiCorp will adhere to this guideline.
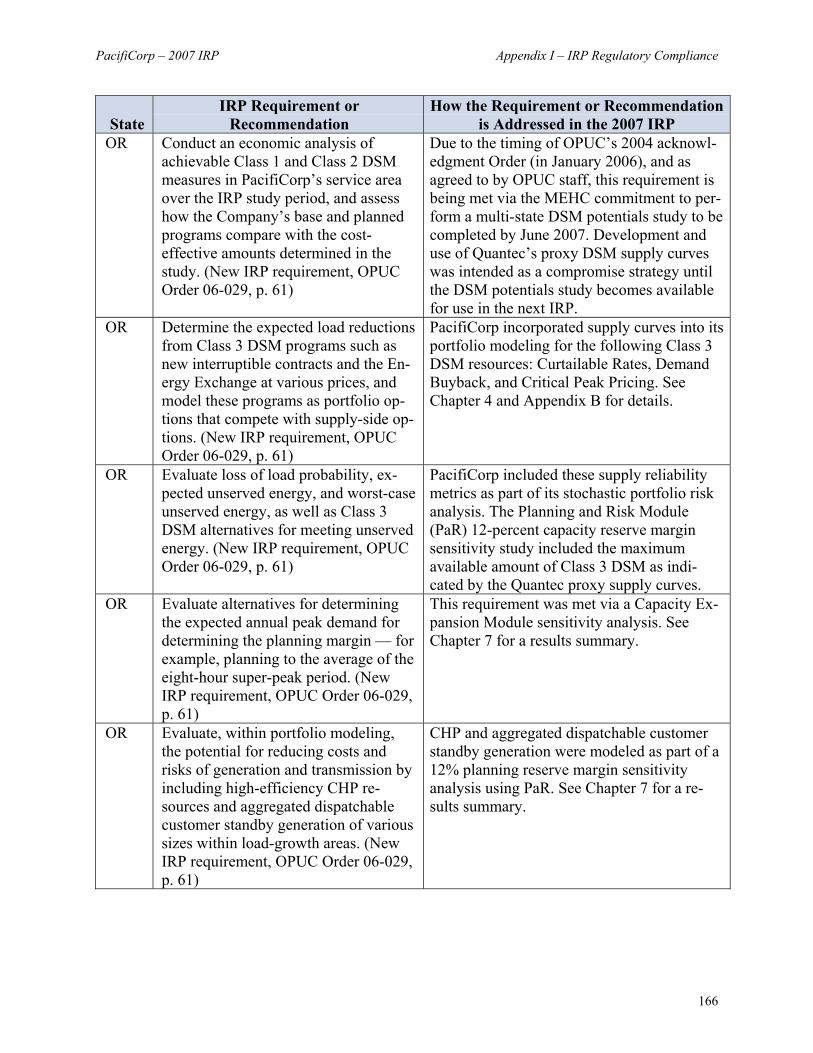
PacifiCorp – 2007 IRP Appendix I – IRP Regulatory Compliance
176
No. Requirement How the Guideline is Addressed in the
2007 IRP
meeting prior to the deadline for written public comment.
3.c Commission staff and parties should com-plete their comments and recommenda-tions within six months of IRP filing.
Not applicable
3.d The Commission will consider comments and recommendations on a utility’s plan at a public meeting before issuing an order on acknowledgment. The Commission may provide the utility an opportunity to revise the plan before issuing an acknowl-edgment order.
Not applicable
3.e The Commission may provide direction to a utility regarding any additional analyses or actions that the utility should undertake in its next IRP.
Not applicable
3.f Each utility must submit an annual update on its most recently acknowledged plan. The update is due on or before the ac-knowledgment order anniversary date. Once a utility anticipates a significant de-viation from its acknowledged IRP, it must file an update with the Commission, unless the utility is within six months of filing its next IRP. The utility must sum-marize the update at a Commission public meeting. The utility may request acknowl-edgment of changes in proposed actions identified in an update.
Not applicable
3.g Unless the utility requests acknowledge-ment of changes in proposed actions, the annual update is an informational filing that: 1. Describes what actions the utility has taken to implement the plan; 2. Provides an assessment of what has changed since the acknowledgment order that affects the action plan, including changes in such factors as load, expiration of resource contracts, supply-side and de-mand-side resource acquisitions, resource costs, and transmission availability; and 3. Justifies any deviations from the ac-
Not applicable

PacifiCorp – 2007 IRP Appendix I – IRP Regulatory Compliance
177
No. Requirement How the Guideline is Addressed in the
2007 IRP
knowledged action plan. Guideline 4. Plan Components (at a minimum, must include…) 4.a An explanation of how the utility met each
of the substantive and procedural require-ments
The purpose of this table is to comply with this guideline.
4.b Analysis of high and low load growth sce-narios in addition to stochastic load risk analysis with an explanation of major as-sumptions
PacifiCorp developed low, medium, and high load growth forecasts for scenario analysis using the Capacity Expansion Mod-ule. Stochastic variability of loads was also captured in the risk analysis. See Chapter 6 for a description of the load forecast data and Chapter 7 for scenario and risk analysis results.
4.c For electric utilities, a determination of the levels of peaking capacity and energy ca-pability expected for each year of the plan, given existing resources; identification of capacity and energy needed to bridge the gap between expected loads and resources; modeling of all existing transmission rights, as well as future transmission addi-tions associated with the resource portfo-lios tested
This Plan complies with the requirement. See Chapter 4 for details on annual capacity and energy balances. Existing transmission rights are reflected in the IRP model topolo-gies, as mentioned in Appendix A (Trans-mission System).
4.d For gas utilities only Not applicable 4.e Identification and estimated costs of all
supply-side and demand side resource options, taking into account anticipated advances in technology
Chapter 5 identifies the resources included in this IRP, and provides their detailed cost and performance attributes (see Tables 5.1 through 5.4).
4.f Analysis of measures the utility intends to take to provide reliable service, including cost-risk tradeoffs
In addition to incorporating a planning re-serve margin for all portfolios evaluated, the company used several measures to evaluate relative portfolio supply reliability. These are described in Chapter 6. PacifiCorp con-ducted several sensitivity studies to deter-mine the cost/risk tradeoff of different plan-ning reserve margin levels. These studies, and resulting company conclusions, are documented in Chapter 7.
4.g Identification of key assumptions about the future (e.g., fuel prices and environ-mental compliance costs) and alternative scenarios considered
Appendix A and Chapter 6 describe the key assumptions and alternative scenarios used in this IRP.

PacifiCorp – 2007 IRP Appendix I – IRP Regulatory Compliance
178
No. Requirement How the Guideline is Addressed in the
2007 IRP
4.h Construction of a representative set of resource portfolios to test various operat-ing characteristics, resource types, fuels and sources, technologies, lead times, in-service dates, durations and general loca-tions – system-wide or delivered to a spe-cific portion of the system
This Plan documents the development and results for 56 portfolios evaluated in this IRP (Chapter 7).
4.i Evaluation of the performance of the can-didate portfolios over the range of identi-fied risks and uncertainties
Chapter 7 presents the deterministic and stochastic portfolio modeling results, and describes portfolio attributes that explain relative differences in cost and risk perform-ance.
4.j Results of testing and rank ordering of the portfolios by cost and risk metric, and interpretation of those results.
Chapter 7 provides tables and charts with performance measure results, including rank ordering as appropriate.
4.k Analysis of the uncertainties associated with each portfolio evaluated.
PacifiCorp fully complies with this guide-line. See the responses to 1.b.1 and 1.b.2 above.
4.l Selection of a portfolio that represents the best combination of cost and risk for the utility and its customers.
See 1.c above.
4.m Identification and explanation of any in-consistencies of the selected portfolio with any state and federal energy policies that may affect a utility’s plan and any barriers to implementation.
This IRP is presumed to have no inconsis-tencies.
An action plan with resource activities the utility intends to undertake over the next two to four years to acquire the identified resources, regardless of whether the activ-ity was acknowledged in a previous IRP, with the key attributes of each resource specified as in portfolio testing.
Chapter 8 presents the 2007 IRP Action Plan.
Guideline 5: Transmission 5 Portfolio analysis should include costs to
the utility for the fuel transportation and electric transmission required for each resource being considered. In addition, utilities should consider fuel transportation and electric transmission facilities as re-source options, taking into account their value for making additional purchases and
PacifiCorp evaluated proxy transmission resources on a comparable basis with respect to other proxy resources in this IRP. For example, the Capacity Expansion Module was allowed to select the most economic transmission options given other supply and demand-side resource options selected by the model. Fuel transportation costs were

PacifiCorp – 2007 IRP Appendix I – IRP Regulatory Compliance
179
No. Requirement How the Guideline is Addressed in the
2007 IRP
sales, accessing less costly resources in remote locations, acquiring alternative fuel supplies, and improving reliability.
factored into resource costs.
Guideline 6: Conservation 6.a Each utility should ensure that a conserva-
tion potential study is conducted periodi-cally for its entire service territory.
A multi-state demand-side management po-tentials study is scheduled for completion in June 2007.
6.b To the extent that a utility controls the level of funding for conservation programs in its service territory, the utility should include in its action plan all best cost/risk portfolio conservation resources for meet-ing projected resource needs, specifying annual savings targets.
A discussion on the treatment of conserva-tion programs (Class 2 DSM) is included in Chapter 6, “Oregon Public Utility Commis-sion Guidelines for Conservation Program Analysis in the IRP.”
6.c To the extent that an outside party admin-isters conservation programs in a utility’s service territory at a level of funding that is beyond the utility’s control, the utility should: 1. Determine the amount of conservation
resources in the best cost/risk portfolio without regard to any limits on funding of conservation programs; and
2. Identify the preferred portfolio and ac-tion plan consistent with the outside party’s projection of conservation ac-quisition.
See the response for 6.b above.
Guideline 7: Demand Response 7 Plans should evaluate demand response
resources, including voluntary rate pro-grams, on par with other options for meet-ing energy, capacity, and transmission needs (for electric utilities) or gas supply and transportation needs (for natural gas utilities).
PacifiCorp evaluated demand response re-sources (Class 3 DSM) on a consistent basis with other resources in its CEM alternative future scenario analysis, as well as con-ducted a sensitivity analysis using the Plan-ning and Risk Module. See Chapter 7.
Guideline 8: Environmental Costs 8 Utilities should include in their base-case
analyses the regulatory compliance costs they expect for carbon dioxide (CO2), ni-trogen oxides, sulfur oxides, and mercury emissions. Utilities should analyze the range of potential CO2 regulatory costs in
This IRP fully complies with the CO2 com-pliance cost analysis requirements in Order No. 93-695. Modeling results for the CO2 cost adder levels are reported in Chapter 7.

PacifiCorp – 2007 IRP Appendix I – IRP Regulatory Compliance
180
No. Requirement How the Guideline is Addressed in the
2007 IRP
Order No. 93-695, from zero to $40 (1990$). In addition, utilities should per-form sensitivity analysis on a range of reasonably possible cost adders for nitro-gen oxides, sulfur oxides, and mercury, if applicable.
Guideline 9: Direct Access Loads 9 An electric utility’s load-resource balance
should exclude customer loads that are effectively committed to service by an alternative electricity supplier.
PacifiCorp continues to plan for load for direct access customers.
Guideline 10: Multi-state Utilities 10 Multi-state utilities should plan their gen-
eration and transmission systems, or gas supply and delivery, on an integrated sys-tem basis that achieves a best cost/risk portfolio for all their retail customers.
The 2007 IRP conforms to the multi-state planning approach as stated in Chapter 2.
Guideline 11: Reliability 11 Electric utilities should analyze reliability
within the risk modeling of the actual port-folios being considered. Loss of load probability, expected planning reserve margin, and expected and worst-case un-served energy should be determined by year for top-performing portfolios. Natural gas utilities should analyze, on an inte-grated basis, gas supply, transportation, and storage, along with demand-side re-sources, to reliably meet peak, swing, and base-load system requirements. Electric and natural gas utility plans should dem-onstrate that the utility’s chosen portfolio achieves its stated reliability, cost and risk objectives.
PacifiCorp fully complies with this guide-line. See the response to 1.c.3.1 above. Chapter 8 describes the role of reliability, cost, and risk measures in determining the preferred portfolio. Scatter plots of portfolio cost versus risk at different CO2 cost adder levels were used to inform the cost/risk tradeoff analysis. The preferred portfolio was also shown to meet reliability goals on the basis of average annual Energy Not Served and other reliability measures (Chap-ter 7).
Guideline 12: Distributed Generation 12 Electric utilities should evaluate distrib-
uted generation technologies on par with other supply-side resources and should consider, and quantify where possible, the additional benefits of distributed genera-tion.
PacifiCorp evaluated several types of distri-bution generation, including combined heat and power and customer-owned standby generation. The results of these evaluations are documented in Chapter 8.
Guideline 13: Resource Acquisition

PacifiCorp – 2007 IRP Appendix I – IRP Regulatory Compliance
181
No. Requirement How the Guideline is Addressed in the
2007 IRP
13.a An electric utility should, in its IRP: 1. Identify its proposed acquisition strat-
egy for each resource in its action plan. 2. Assess the advantages and disadvan-
tages of owning a resource instead of purchasing power from another party
3. Identify any Benchmark Resources it plans to consider in competitive bidding
Chapter 8 outlines the procurement approach for each proxy resource type identified in the action plan. A discussion of the advantages and disad-vantages of owning a resource instead of purchasing it is included in Chapter 8. Benchmark resources for the 2012 are cited in Chapter 3, Recent Resource Procurement Activities.
13.b For gas utilities only Not applicable
Table I.4 – Utah Public Service Commission IRP Standard and Guidelines
No. Requirement How the Standards and Guidelines are
Addressed in the 2007 IRP Procedural Issues 1 The Commission has the legal authority to
promulgate Standards and Guidelines for integrated resource planning.
Not addressed; this is a Utah Public Service Commission responsibility
2 Information Exchange is the most reason-able method for developing and imple-menting integrated resource planning in Utah.
Information exchange has been conducted throughout the IRP process.
3 Prudence Reviews of new resource acqui-sitions will occur during ratemaking pro-ceedings.
Not addressed; ratemaking occurs outside of the IRP process
4 PacifiCorp's integrated resource planning process will be open to the public at all stages. The Commission, its staff, the Di-vision, the Committee, appropriate Utah state agencies, and other interested parties can participate. The Commission will pur-sue a more active-directive role if deemed necessary, after formal review of the plan-ning process.
PacifiCorp’s public process is described in Chapter 2. A record of public meetings is provided as Appendix F.
5 Consideration of environmental external-ities and attendant costs must be included in the integrated resource planning analy-
PacifiCorp used a scenario analysis approach along with externality cost adders to model environmental externality costs. See Chapter

PacifiCorp – 2007 IRP Appendix I – IRP Regulatory Compliance
182
No. Requirement How the Standards and Guidelines are
Addressed in the 2007 IRP sis. 6 for a description of the methodology em-
ployed. 6 The integrated resource plan must evaluate
supply-side and demand-side resources on a consistent and comparable basis.
Supply, transmission, and demand-side re-sources were evaluated on a comparable basis using PacifiCorp’s capacity expansion optimization model (CEM). (The one excep-tion was Class 2 DSM, due to the unavail-ability of supply curves for this IRP.) Also see the response to number 4.b.ii below.
7 Avoided Cost should be determined in a manner consistent with the Company's Integrated Resource Plan.
Consistent with the Utah rules, PacifiCorp determination of avoided costs will be han-dled in a manner consistent with the IRP, with the caveat that the costs may be up-dated if better information becomes avail-able.
8 The planning standards and guidelines must meet the needs of the Utah service area, but since coordination with other jurisdictions is important, must not ignore the rules governing the planning process already in place in other jurisdictions.
This IRP was developed in consultation with parties from all state jurisdictions, and meets all formal state IRP guidelines.
9 The Company's Strategic Business Plan must be directly related to its Integrated Resource Plan.
PacifiCorp’s business plan is directly related to the IRP; the business planning process is informed by the IRP resource analysis, the action plan, and subsequent procurement activities. Due to timing and scope differ-ences, these two plans do not match in all respects. The 2007 IRP will be used to in-form the next version of the Business Plan.
Standards and Guidelines 1 Definition: Integrated resource planning is
a utility planning process which evaluates all known resources on a consistent and comparable basis, in order to meet current and future customer electric energy ser-vices needs at the lowest total cost to the utility and its customers, and in a manner consistent with the long-run public inter-est. The process should result in the selec-tion of the optimal set of resources given the expected combination of costs, risk
Chapter 2 discusses the planning principles used for developing this IRP, and the quali-fications surrounding the company’s long term resource planning process. The com-pany notes that this definition does not spec-ify what constitutes “optimality” given re-source decision-making constrained by (1) consideration of risk, uncertainty, disparate state policy goals and stakeholder interests, and (2) the complexity and limitations of the IRP modeling effort. As indicated in Chapter

PacifiCorp – 2007 IRP Appendix I – IRP Regulatory Compliance
183
No. Requirement How the Standards and Guidelines are
Addressed in the 2007 IRP and uncertainty. 2, PacifiCorp believes that a successful IRP
attempts to derive a robust resource plan under a reasonably wide range of potential futures
2 The Company will submit its Integrated Resource Plan biennially.
For this IRP, the company received a filing extension from the Utah Public Service Commission and other state commissions. This extension was necessary to realign the IRP process to address new and expected changes in state resource policy that came into play well into this IRP development cycle.
3 IRP will be developed in consultation with the Commission, its staff, the Division of Public Utilities, the Committee of Con-sumer Services, appropriate Utah state agencies and interested parties. PacifiCorp will provide ample opportunity for public input and information exchange during the development of its Plan.
PacifiCorp’s public process is described in Chapter 2. A record of public meetings is provided as Appendix F.
4.a PacifiCorp's integrated resource plans will include: a range of estimates or forecasts of load growth, including both capacity (kW) and energy (kWh) requirements.
PacifiCorp implemented a load forecast range for both deterministic scenario analy-sis as well as for stochastic short-term and long-term variability. Details concerning the load forecasts used in the 2007 IRP are pro-vided in Chapter 4 and Appendix A. Details on the forecast ranges developed for sce-nario and stochastic analysis are documented in Chapter 6 and Appendix E, respectively.
4.a.i The forecasts will be made by jurisdiction and by general class and will differentiate energy and capacity requirements. The Company will include in its forecasts all on-system loads and those off-system loads which they have a contractual obli-gation to fulfill. Non-firm off-system sales are uncertain and should not be explicitly incorporated into the load forecast that the utility then plans to meet. However, the Plan must have some analysis of the off-system sales market to assess the impacts such markets will have on risks associated with different acquisition strategies.
Price risk associated with market sales is captured in the company’s stochastic simula-tion results. Current off-system sales agree-ments are included in the IRP models. The company is not planning to enter into additional long term firm sales agreements; therefore, associated risks do not impact the selection of the preferred portfolio. For sys-tem balancing sales, PacifiCorp recognizes that transactions may be affected by new resource constraints imposed by regulators (carbon emission and renewable portfolio standards in particular). These impacts will

PacifiCorp – 2007 IRP Appendix I – IRP Regulatory Compliance
184
No. Requirement How the Standards and Guidelines are
Addressed in the 2007 IRP be considered in future IRP resource analy-ses.
4.a.ii Analyses of how various economic and demographic factors, including the prices of electricity and alternative energy sources, will affect the consumption of electric energy services, and how changes in the number, type and efficiency of end-uses will affect future loads.
Appendix A documents how demographic and price factors are used in the load fore-casting process. Appendix A also documents price elasticity studies conducted on Utah load.
4.b An evaluation of all present and future resources, including future market oppor-tunities (both demand-side and supply-side), on a consistent and comparable ba-sis.
Resources were evaluated on a consistent and comparable basis using the Capacity Expansion Module. There were some excep-tions due to the availability of data for this IRP, such as Class 2 DSM. Chapter 6 pro-vides a discussion on how Class 2 DSM re-source potential was addressed in this IRP.
4.b.i An assessment of all technically feasible and cost-effective improvements in the efficient use of electricity, including load management and conservation.
PacifiCorp contracted with Quantec, LLC to assess the technical, market, and achievable potential for various dispatchable and price-responsive load control programs (Pacifi-Corp Class1 and Class 3 DSM). The associ-ated assessment is described in Chapter 5, while Quantec’s assessment report is in-cluded as Appendix B. PacifiCorp’s treatment of conservation pro-grams (Class 2 DSM) is addressed in Chap-ter 6 (“Public Utility Commission Guide-lines for Conservation Program Analysis in the IRP”).
4.b.ii An assessment of all technically feasible generating technologies including: renew-able resources, cogeneration, power pur-chases from other sources, and the con-struction of thermal resources.
PacifiCorp considered a wide range of re-sources including renewables, cogeneration (combined heat and power), power pur-chases, thermal resources, and transmission. Chapters 5 and 6 document how PacifiCorp developed and assessed these technologies. In brief, the company used a combination of PacifiCorp generation staff expertise, Elec-tric Power Research Institute Technical As-sessment Guide (TAG®) data, and capacity expansion optimization modeling to assess these technologies. Generation resource types were initially assessed by PacifiCorp’s

PacifiCorp – 2007 IRP Appendix I – IRP Regulatory Compliance
185
No. Requirement How the Standards and Guidelines are
Addressed in the 2007 IRP generation experts, and a list that captures the salient technology types and configura-tions was assembled (Chapter 5, Tables 5.1 and 5.2). Decisions on what generation re-sources to include in the Capacity Expansion Module was based on generation staff rec-ommendations and the need to limit resource options to a manageable number based on model constraints and run-time considera-tions. (The company notes that the need to place restrictions on the number of resource options is a common IRP problem for utili-ties that use such optimization models for long-term planning.) Based on the modeling lessons learned for this IRP and the anticipated expansion of resource options arising from the DSM po-tentials study due in June 2007, PacifiCorp intends to explore new resource screening methods to accommodate a broader range of technologies while meeting the requirement to assess technologies on a ‘consistent and comparable basis.”
4.b.iii The resource assessments should include: life expectancy of the resources, the rec-ognition of whether the resource is replac-ing/adding capacity or energy, dis-patchability, lead-time requirements, flexibility, efficiency of the resource and opportunities for customer participation.
PacifiCorp captures and models these re-source attributes in its IRP models. The proxy demand curves used to represent de-mand-side management programs explicitly incorporates estimated rates of program and event participation.
4.c An analysis of the role of competitive bid-ding for demand-side and supply-side re-source acquisitions
A description of the role of competitive bid-ding and other procurement methods is pro-vided in Chapter 8 (“IRP Resource Pro-curement Strategy”).
4.d A 20-year planning horizon. This IRP uses a 20-year study horizon (2007-2026)
4.e An action plan outlining the specific re-source decisions intended to implement the integrated resource plan in a manner consistent with the Company's strategic business plan. The action plan will span a four-year horizon and will describe spe-
The action plan is provided in Chapter 8. A status report of the actions outlined in the previous action plan (2004 IRP and the 2004 IRP Update) is provided as Appendix G.

PacifiCorp – 2007 IRP Appendix I – IRP Regulatory Compliance
186
No. Requirement How the Standards and Guidelines are
Addressed in the 2007 IRP cific actions to be taken in the first two years and outline actions anticipated in the last two years. The action plan will include a status report of the specific actions con-tained in the previous action plan.
4.f A plan of different resource acquisition paths for different economic circum-stances with a decision mechanism to se-lect among and modify these paths as the future unfolds.
Chapter 8 includes a section that describes PacifiCorp’s strategy for meeting this re-quirement. In short, the company will use its IRP models, in conjunction with scenario analysis, to evaluate resource bids submitted under its Base Load Request For Proposals, issued on April 5, 2007.
4.g An evaluation of the cost-effectiveness of the resource options from the perspectives of the utility and the different classes of ratepayers. In addition, a description of how social concerns might affect cost ef-fectiveness estimates of resource options.
PacifiCorp provides resource-specific utility and total resource cost information in Chap-ter 5 (Tables 5.2 through 5.4). The IRP document addresses the impact of social concerns on resource cost-effectiveness in the following ways: ● Portfolios were evaluated using CO2
adders that ranged from $0 to $61 per ton.
● The cost impact of renewable portfolio standards is captured in several portfolio scenario analyses (Chapter 7)
● PacifiCorp conducted a study to deter-mine the cost and risk impact of wide-spread adoption of a greenhouse gas emissions performance standard (Chap-ter 7)
● Appendix B includes a section on DSM program valuation, which covers societal value factors (for example, environ-mental and reliability benefits)
4.h An evaluation of the financial, competi-tive, reliability, and operational risks asso-ciated with various resource options and how the action plan addresses these risks in the context of both the Business Plan and the 20-year Integrated Resource Plan. The Company will identify who should
Discussions on market risks by resource type are included in Chapter 5 (“Resource De-scriptions”). Resource capital cost uncertainty and tech-nological risk is addressed in Chapter 5 (“Handling of Technology Improvement

PacifiCorp – 2007 IRP Appendix I – IRP Regulatory Compliance
187
No. Requirement How the Standards and Guidelines are
Addressed in the 2007 IRP bear such risk, the ratepayer or the stock-holder.
Trends and Cost Uncertainty”). For reliability risks, the stochastic simulation model incorporates stochastic volatility of forced outages for thermal plants and hydro availability. These risks are factored into the comparative evaluation of portfolios and the selection of the preferred portfolio upon which the action plan is based. Identification of the classes of risk and how these risks are allocated to ratepayers and investors is discussed in Chapter 2.
4.i Considerations permitting flexibility in the planning process so that the Company can take advantage of opportunities and can prevent the premature foreclosure of op-tions.
PacifiCorp discusses how planning flexibil-ity came into play for the selection of the preferred portfolio (Chapter 7, “Preferred Portfolio Selection and Justification”).
4.j An analysis of tradeoffs; for example, be-tween such conditions of service as reli-ability and dispatchability and the acquisi-tion of lowest cost resources.
PacifiCorp examined the trade-off between portfolio cost and risk. This trade-off analy-sis is documented in Chapter 7. A discussion on the trade-off between cost and the plan-ning reserve margin is also provided in Chapter 7 (“Planning Reserve Margin Selec-tion”)
4.k A range, rather than attempts at precise quantification, of estimated external costs which may be intangible, in order to show how explicit consideration of them might affect selection of resource options. The Company will attempt to quantify the magnitude of the externalities, for exam-ple, in terms of the amount of emissions released and dollar estimates of the costs of such externalities.
PacifiCorp estimated environmental exter-nality costs for CO2, NOX, SO2, and mercury with use of cost adders and assumptions regarding the form of compliance strategy (for example, cap-and-trade versus a per-ton tax for CO2). For CO2 externality costs, the company used scenarios with various cost adder levels to capture a reasonable range of cost impacts.
4.l A narrative describing how current rate design is consistent with the Company's integrated resource planning goals and how changes in rate design might facilitate integrated resource planning objectives.
This narrative is provided in Chapter 4 (“Ex-isting DSM Program Status”).
5 PacifiCorp will submit its IRP for public comment, review and acknowledgement.
PacifiCorp distributed the draft IRP docu-ment for public review and comment on April 20, 2007. This IRP report constitutes

PacifiCorp – 2007 IRP Appendix I – IRP Regulatory Compliance
188
No. Requirement How the Standards and Guidelines are
Addressed in the 2007 IRP the formal submission of the IRP for ac-knowledgement.
6 The public, state agencies and other inter-ested parties will have the opportunity to make formal comment to the Commission on the adequacy of the Plan. The Commis-sion will review the Plan for adherence to the principles stated herein, and will judge the merit and applicability of the public comment. If the Plan needs further work the Commission will return it to the Com-pany with comments and suggestions for change. This process should lead more quickly to the Commission's acknowl-edgement of an acceptable Integrated Re-source Plan. The Company will give an oral presentation of its report to the Com-mission and all interested public parties. Formal hearings on the acknowledgement of the Integrated Resource Plan might be appropriate but are not required.
Not addressed; this is a post-filing activity.
7 Acknowledgement of an acceptable Plan will not guarantee favorable ratemaking treatment of future resource acquisitions.
Not addressed; this is not a PacifiCorp activ-ity.
8 The Integrated Resource Plan will be used in rate cases to evaluate the performance of the utility and to review avoided cost calculations.
Not addressed; this refers to a post-filing activity.

PacifiCorp – 2007 IRP Appendix J – Wind Resource Methodology
189
APPENDIX J – WIND RESOURCE METHODOLOGY
This appendix summarizes the wind resource analyses used to help characterize wind resources included in PacifiCorp’s IRP models. Specifically, the appendix covers (1) the expected cost of integrating various amounts of wind generation with other portfolio resources—reflecting a re-finement and update of previous analysis conducted for PacifiCorp’s integrated resource plan-ning, (2) a resource screening effort to determine a base amount of wind resources to include in portfolios subjected to stochastic production cost simulation, and (3) the calculation of capacity planning contribution of wind resources, accounting for generation variability. In addition to summarizing the results of its wind resource studies, this appendix briefly de-scribes current efforts by organizations in the Pacific Northwest to assess wind integration impli-cations. Finally, the last section of this appendix discusses the role of resource fuel type on the company’s strategy for integrating wind resources. This discussion addresses an Oregon Public Utility Commission requirement to investigate this topic for the 2007 IRP. A new methodology was developed to explicitly calculate the load following reserve requirement based on the uncertainty in load for the next hour on an operational basis, which allowed Pacifi-Corp to apply the same analytical approach to estimating the incremental reserve requirements for wind. The availability of hourly wind data for resources distributed across PacifiCorp service territories over comparable historical time horizons enabled analysts to include proxy wind re-sources with realistic operating characteristics into the analysis. Further, a development in tech-niques for estimating load carrying capability allowed analysts to estimate the capacity contribu-tions of various wind combinations of wind developments that restricted interactions due to cor-related generation from nearby plants. Analysts were able to improve the characterization of wind operations and interactions with the power system in the present analysis.
WIND INTEGRATION COSTS
Across all analyses, wind integration costs have generally been divided into two categories – incremental reserve requirements and system balancing costs. The former is related to the need for dynamic resources to be held in reserve, able to respond on a roughly ten minute basis to rap-idly changing load/resource balance conditions. Since wind resource generation can be quite variable over time periods from about ten minutes to several hours, it will be necessary to in-crease the amount of reserves as the quantity of wind resources on the system increases. System balancing costs represent the difference in value between the energy delivered from wind re-sources compared to that delivered from less volatile resources. Consistent with previous stud-ies, PacifiCorp reviewed both categories of wind integration costs: the incremental reserve re-quirement and the system balancing cost.
Incremental Reserve Requirements
Operating reserves are divided into categories based on purpose and on characteristics. Naming conventions for categorizing reserves by their intended purpose are not standard in the industry. Reserves held for responding to the sudden failure of generation or transmission equipment are usually called “contingency reserves”. Reserves held to respond to changes in system frequency
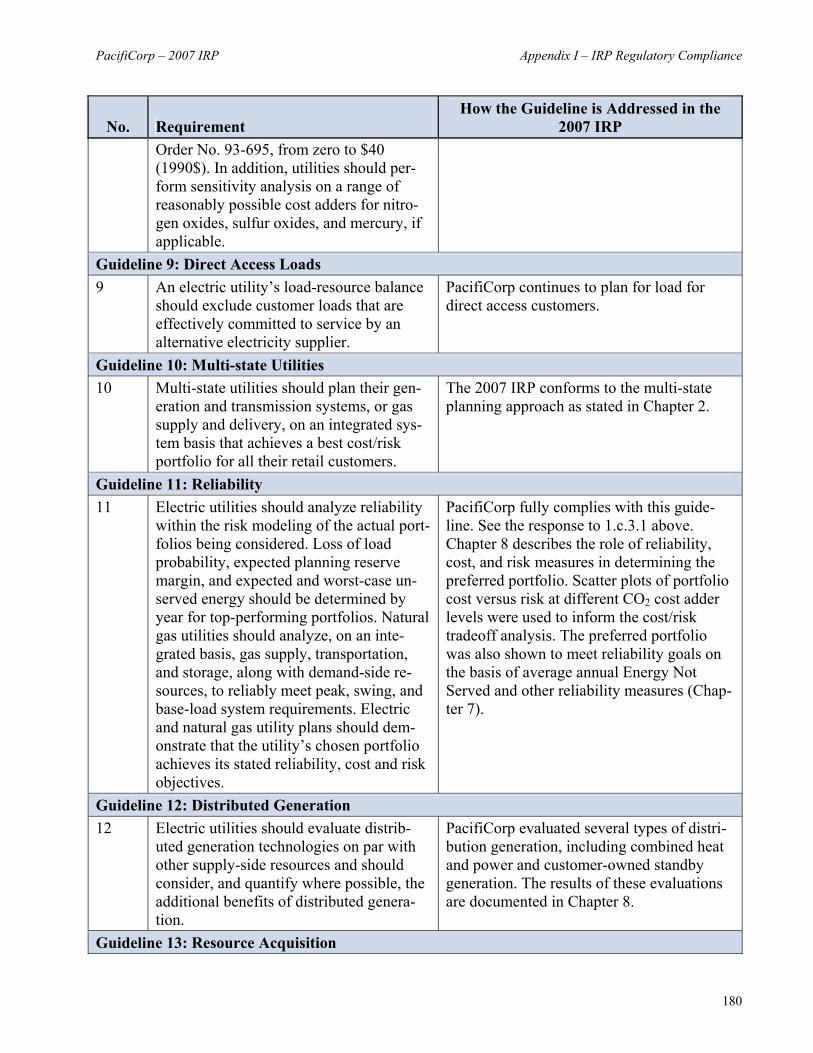
PacifiCorp – 2007 IRP Appendix J – Wind Resource Methodology
190
over a period of a few seconds will be referred to as “regulating reserves”. Generation that can be brought on over a multiple-minute time period will be termed “load following reserves.” Wind projects are not expected to affect the need to hold contingency reserves, as there is no significant difference between wind generation and other types of generation with respect to sudden equipment failures, or other outages. The multiplicity of individual generators within a typical wind farm inherently makes them less susceptible to losing the entire output of the farm due to generator or turbine failures (but not transmission-related outages). Wind projects are subject to relatively rapid shutdown when wind speeds reach the cutout level. However, this has not been a significant problem in practice, as individual wind turbines do not tend to shut down simultaneously. Similarly, regulating reserve requirements do not appear to be significantly affected by wind turbines4. The second-by-second variations in wind project output are found to be not signifi-cantly different from other generating units and the ambient fluctuations of the load. They are also not correlated with either load fluctuations, or distant wind projects. Wind variations over periods of ten minutes to an hour are significant, and can cause operators to rapidly start up units on short notice within an hour. Fluctuations of the combined output of a collection of wind projects increases with the amount of total wind generation connected to the system. For the 2007 IRP, a new methodology was developed to explicitly calculate the load following reserve requirement based on the uncertainty in load for the next hour on an operational basis. Operators have estimates of the behavior of loads for the next hour and move to bring on or back off resources as necessary to accommodate the expected change. Knowing that the actual load of the next hour will likely be different than the forecast and that there will be deviations within the hour, operators hold additional resources ready to respond should they underestimate the need for resources. (Generally, overestimates are not a problem, though it is an additional concern). Reserve levels are established to ensure that the shortfall can be met a minimum percentage of the time—generally around 95 percent. The methodology is graphically illustrated in Figure J.1, which shows how the load forecast changes from one hour to the next. Assuming that the range of actual outcomes for the next hour can be approximated by a normal distribution, the amount of additional reserve capability that is necessary to provide assurance of having adequate re-sources available at least 95 percent of the time can be calculated. This methodology can be applied first to the system load alone and then again to the system load net of wind generation. The difference between the two results is the estimated incremental re-serve requirement due to the wind resources.
4 DeMeo, Grant, Milligan, and Schuerger, “Wind Plant Integration: Costs, Status, and Issues”, IEEE Power & En-
ergy Magazine, Vol 3 Number 6, Nov/Dec 2005, p. 41.

PacifiCorp – 2007 IRP Appendix J – Wind Resource Methodology
191
Figure J.1 – Load Following Reserve Requirement Illustration
Figure J.2 shows the variability of the load forecast and the variability of the wind energy rolled together by performing the same analysis on the forecast of load net of wind energy. The ex-pected value of load net of wind will be less than or equal to the load forecast for any given hour. However, the variability of load net of wind is greater than that of load alone. It is the difference of between the variability of load and the variability of load net of wind for a given hour that described the incremental reserves that should be attributed to wind resources. Figure J.2 – Load Following Reserve Requirement for Load Net of Wind
95%
Load
Begin Hour 1 Begin Hour 2
Load Following Reserves
Range of O
utcomesN
et L
oad
95%
Load
Begin Hour 1 Begin Hour 2
Load Following Reserves
Range of O
utcomesN
et L
oad
95%
Load
Begin Hour 1 Begin Hour 2
Load Following Reserves
Range of O
utcomes
Net
Loa
d
Effect of WindLoad Following Reserves w/ Wind
95%
Range of O
utcomesLoad Net of Wind
Effect of Wind

PacifiCorp – 2007 IRP Appendix J – Wind Resource Methodology
192
Early in the 2007 IRP process, the result of applying this methodology to the PacifiCorp system with an additional 1,400 megawatts of wind resources was an estimated 30 megawatts of addi-tional reserve requirements. That amount of spinning reserve was added to the stochastic PaR model runs to simulate the additional cost. In follow up analyses of the preferred portfolio, the company confirmed that using even the sim-plest forecast techniques greatly reduced the forecast error of both load and wind and conse-quently reduced the anticipated need for load following reserves. Figure J.3 displays the esti-mated incremental load following requirement calculated using PacifiCorp’s updated load fore-cast and varying the level of wind resources following the build pattern of the preferred portfolio. For the 1,400 megawatt level of wind installation, the estimated need for incremental reserves is approximately 22 megawatts. For the preferred portfolio with 2,000 megawatts of wind re-sources, Figure J.4 shows an estimated need for 43 megawatts of additional load following re-serves due to wind resources. This analysis represents a reduction in the estimate of needed reserves compared with previous estimates. The major difference from prior studies is the development of a systematic method for estimating load following reserve requirements. The 2003 IRP study was based on the hourly variability of wind resources, whereas the current analysis is based on the hourly uncertainty in generation. It is further benefited by the more extensive operating data available since the 2003 study. Figure J.3 – Incremental Reserve Cost Associated with Various Wind Capacity Amounts
Incremental Reserve Requirement as a Function of Installed Wind Resources
R2 = 0.91560
102030405060
0 500 1000 1500 2000 2500
Installed Wind Capacity (MW)
Incr
emen
tal R
eser
ve
Req
uire
men
t (M
W)
By running the PaR model studies with and without the incremental load following reserves, the company can estimate the cost of the incremental reserves at varying levels. This can be con-

PacifiCorp – 2007 IRP Appendix J – Wind Resource Methodology
193
verted to a unit cost by dividing the cost by the total amount of wind energy. Figure J.4 shows the results of those studies. Figure J.4 – Operating Cost of Incremental Load Following Reserves
From Figure J.4, the unit cost of 43 megawatts of incremental reserves attributed to the 2,000 megawatts of wind capacity in the preferred portfolio is estimated to be $1.10 per megawatt hour of wind energy.
System Balancing Costs System balancing costs represent the additional operating costs incurred as a result of adding wind generation to PacifiCorp’s system. For the 2003 IRP, the system balancing costs associated with wind resources were evaluated by comparing one model run with wind resources specified with an hourly energy pattern to another run where the hourly wind energy was replaced by an equal amount of energy expressed as a flat annual shape. This methodology was repeated for the 2007 IRP preferred portfolio with the following modifications.
• First, the hourly wind patterns for the base study were substantially upgraded. Data from multiple Pacific Northwest sources, including PacifiCorp’s actual wind energy, was modified for project size and mapped to the proxy wind resources by location. In the case of multiple “plants,” some of the data was shifted by an hour or two to represent di-versity within a wind area. The Wyoming projects were updated to a 40 percent capacity factor to be consistent with actual information coming from that area.
• The comparison to the annual block size was repeated for several sized accumulations of
wind projects across PacifiCorp’s system using the wind data and build patterns consis-tent with the preferred portfolio analysis.
y = 0.0175x1.1006
R2 = 0.9995$0.00
$0.50
$1.00
$1.50
$2.00
$2.50
$3.00
- 20 40 60 80 100
Reserve Increment (MW)
Cos
t of R
eser
ves
($/M
Wh)
Cost of Incremental Reserves for 2000 MW of Wind2007$
Based on RA 14

PacifiCorp – 2007 IRP Appendix J – Wind Resource Methodology
194
Using the equivalent annual block against the hourly wind patterns confirmed earlier findings that as wind resources accumulate the system balancing costs also increase on a unit cost basis. The 2007 IRP results are shown in Figure J.5. The results are similar to previous studies. Figure J.5 – PacifiCorp System Balancing Cost
System Balancing Cost as a function of Installed Wind Capacity (MW)
10 Year Levelized $2007
y = 0.002xR2 = 0.9415
0.001.002.003.004.005.00
0 500 1000 1500 2000 2500
Installed Wind (MW)
Cos
t ($/
MW
h)
From Figure J.5 it can be seen that 2000 megawatts of wind capacity installed on PacifiCorp’s system brings with it approximately $4.00 per megawatt-hour less than an equivalent amount of energy shaped as an annual base load resource While some of the regional studies employed smaller sized energy blocks for similar compari-sons, PacifiCorp continues to use the annual block-size approach. Equivalent energy generated at a constant rate for the entire year and priced at market is the competing resource that Pacifi-Corp uses in its resource economic evaluations. Use of Wind Integration Cost Estimates in the 2007 IRP Portfolio Analysis Wind integration costs for the purposes of the CEM runs were based on 2004 IRP results due to the timing of the needed analyses. In the PaR model, the system balancing costs are implicit as the wind resources are represented as hourly generation patterns from the quasi-historical data. The incremental load-following reserve requirement, calculated outside of the main IRP models, was added as a constraint in the stochastic PaR runs for the candidate and preferred portfolios in the 2007 IRP. (CEM does not model reserve requirements, and so was not affected by the analy-sis).

PacifiCorp – 2007 IRP Appendix J – Wind Resource Methodology
195
Because the hourly generation patterns of wind and the increased incremental reserves are mod-eled explicitly in the PaR model the PVRR includes both types of cost. The integration cost for the 2,000 megawatts of wind resources included in the preferred portfolio is estimated to be $5.10 per megawatt hour of wind energy. PacifiCorp is continuing to explore methodologies to confirm and quantify wind variability with respect to the need for operating reserves. In particular, sub-hourly data is being captured to test the impact of deviations within the hour. Continued study of the impacts of integrating large quantities of wind in PacifiCorp’s system is identified in the IRP action plan (See Chapter 8).
DETERMINATION OF COST-EFFECTIVE WIND RESOURCES
PacifiCorp used the CEM to help determine the quantity of wind considered reasonable given a range of alternative assumptions concerning future portfolio costs. The explicit costs of wind (capital and integration costs, less production tax credits and the value of renewable energy cred-its) were entered into the CEM. The results of the alternative future scenario CEM runs were examined to find a rough cost-effectiveness order for the proxy wind resource sites. Nearly all of the CEM runs found wind to be part of a cost-effective resource portfolio. Fixed in each of the runs were the 400 megawatt MEHC acquisition commitments made to state commissions. In the “medium case” alternative future scenario (Alternative Future #11), the CEM added 700 nameplate megawatts of wind resources to the system, for a total of 1,100 megawatts of additional renewable resources by 2016. Figure J.6 shows the cost-effective wind capacity amounts (both nameplate and capacity contri-bution) selected by the CEM for each of the 16 alternative future scenarios. The average for all the alternative future runs was over 1,200 megawatts (235 megawatt capacity contribution), or 1,600 megawatts including the 400 megawatt base assumption quantity. These results are consis-tent with the 1,400 megawatt determination for the level of cost-effective renewables reported in PacifiCorp’s 2004 IRP.

PacifiCorp – 2007 IRP Appendix J – Wind Resource Methodology
196
Figure J.6 – Renewables Capacity Additions for Alternative Future Scenarios
0
500
1,000
1,500
2,000
2,500
3,000
3,500
Meg
awat
ts
Wind Capacity Contribution Renewables Nameplate
Wind Capacity Contribution 82 196 60 277 259 215 354 514 0 514 85 148 95 222 99 410 235
Renew ables Nameplate 300 1,000 400 1,400 1,400 1,400 2,200 3,100 - 3,100 400 700 400 900 400 2,300 1213
CAF00 CAF01 CAF02 CAF03 CAF04 CAF05 CAF06 CAF07 CAF08 CAF09 CAF10 CAF11 CAF12 CAF13 CAF14 CAF15 Ave.
A CEM sensitivity run was performed to test the quantity of wind selected given the expiration of renewable production tax credits, but with otherwise favorable scenario conditions for wind development. These favorable conditions included a high CO2 adder ($25/ton in 1990 dollars), high natural gas and electricity prices, and a high system-wide renewable sales percentage re-quirement attributable to renewable portfolio standards. See Chapter 6, Modeling and Risk Analysis Approach, for more details on scenario assumptions. In this sensitivity, the CEM selected 1,900 megawatts of wind by 2016 (capacity contribution of 335 megawatts). Figure J.7 shows the cumulative annual resource addition pattern for 2008 through 2016. The sensitivity results indicate that given the assumed favorable scenario condi-tions, the expiration of the production tax credits results in 1,200 megawatts less wind capacity selected for the optimal portfolio. Based on these results, PacifiCorp identified 1,000 to 1,600 megawatts of additional nameplate wind capacity for specifying proxy renewable resources to be included in portfolios subjected to stochastic production cost simulation.

PacifiCorp – 2007 IRP Appendix J – Wind Resource Methodology
197
Figure J.7 – Cumulative Capacity Contribution of Renewable Additions for the PTC Sensi-tivity Study
200 200
400
600
800
1,000
1,200
1,900
1,700
1,500
0
200
400
600
800
1,000
1,200
1,400
1,600
1,800
2,000
2007 2008 2009 2010 2011 2012 2013 2014 2015 2016
Capacity Contribution (MW) Nameplate (MW)
WIND CAPACITY PLANNING CONTRIBUTION
For planning purposes, most resources are assumed to contribute their nominal (or “nameplate”) capacity to meeting the planning reserve margin level. It is recognized that wind resources can-not be depended on to contribute their full nameplate capacity to meeting planning reserve mar-gin, since the probability of achieving that level on a peak hour is relatively low, and virtually zero for a large portfolio of diverse wind resources. Nevertheless, it was recognized that some level of capacity contribution attributed to wind projects is appropriate, and PacifiCorp has adopted the effective load carrying capability of wind projects as the standard. In short, the ef-fective load carrying capability of a resource is the amount of incremental load the system can meet with the incremental resource without degrading the reliability of meeting load. PacifiCorp used the stochastic PaR model to estimate the monthly load carrying capability of a wind resource using an analytical method based on the Z statistic.5 The analytical method of es-timating load carrying capability was necessary in order to compute the capacity contributions from a large number of wind projects and different combinations of projects. The result of this analysis as applied to the proxy (100-megawatt) wind resources is shown in Table J.1 below. Key observations from these results include the following.
5 See, Dragoon, K., Dvortsov, V, “Z-method for power system resource adequacy applications” IEEE Transactions
on Power Systems (Volume 21, Issue 2, May 2006), pp. 982 – 988.

PacifiCorp – 2007 IRP Appendix J – Wind Resource Methodology
198
• The incremental capacity contribution within an area declines due to correlations (lack of diversity) among wind projects in an area.
• The capacity contribution decline is greatest for projects with more variability of their on-peak contributions.
• The capacity contribution varies over the year, primarily due to expected on-peak generation.
Table J.1 – Incremental Capacity Contributions from Proxy Wind Resources
Regional Resource Additions (MW) Jan Feb Mar Apr May Jun Jul Aug Sep Oct Nov Dec
NC OR -100 1 18 28 17 25 35 37 27 22 14 5 5-200 0 8 16 7 14 24 28 18 12 5 0 0-300 0 0 3 0 3 14 19 10 2 0 0 0-400 0 0 0 0 0 3 10 1 0 0 0 0
SE WA -100 19 14 33 13 13 10 12 7 10 14 16 16-200 8 2 20 2 1 0 2 0 0 3 5 4-300 0 0 8 0 0 0 0 0 0 0 0 0-400 0 0 0 0 0 0 0 0 0 0 0 0
EC NV -100 18 20 32 32 23 28 27 23 21 23 19 28-200 15 17 29 26 20 24 23 20 17 20 17 24-300 13 14 25 20 16 20 20 18 13 16 14 21-400 10 12 21 14 13 17 16 15 9 13 12 17
SE ID -100 26 37 59 35 31 32 25 32 22 32 38 32-200 20 31 53 29 26 27 21 28 17 26 32 26-300 14 24 47 24 22 22 17 24 13 21 25 20-400 8 17 41 18 17 17 13 20 8 16 18 14
WC UT -100 13 10 25 31 35 27 20 26 26 24 20 19-200 10 9 21 27 31 24 18 22 22 20 17 16-300 7 7 17 22 26 20 15 18 18 16 14 13-400 4 6 13 17 21 17 12 15 13 13 11 10
SW WY -100 33 27 36 33 30 30 23 24 25 31 24 34-200 27 24 29 27 26 25 20 21 22 26 21 28-300 21 20 22 21 21 21 18 18 19 21 18 22-400 16 16 15 16 16 16 15 16 16 16 15 16-500 10 12 8 10 11 11 13 13 13 11 13 10-600 5 8 1 4 6 7 10 10 9 6 10 4-700 0 5 0 0 2 2 7 7 6 1 7 0
SC MT -100 42 34 35 24 26 26 27 26 28 32 42 33-200 34 27 26 19 23 21 24 23 24 28 33 26-300 26 20 18 14 19 16 21 20 21 23 25 18-400 18 14 10 9 15 11 18 18 18 19 17 11
SE WY -100 35 26 30 25 22 19 13 15 18 23 44 37-200 30 21 24 21 18 16 11 13 15 18 43 32-300 25 16 19 17 14 12 9 10 11 13 43 27-400 20 12 13 13 10 9 7 8 7 9 42 23-500 15 7 7 9 6 6 5 6 3 4 41 18-600 9 2 2 5 2 3 3 3 0 0 40 13-700 4 0 0 1 0 0 1 1 0 0 39 8

PacifiCorp – 2007 IRP Appendix J – Wind Resource Methodology
199
REGIONAL STUDIES
Utilities are studying wind resources in order to quantify the full cost of integrating wind energy into existing systems. In March 2007, Northwest Power and Conservation Council released the Northwest Wind Integration Action Plan (the Action Plan). A joint product of the region’s util-ity, regulatory, consumer and environmental organizations, the Action Plan addresses several major questions surrounding the growth of wind energy and suggests areas that need further con-sideration. The Action Plan summarizes the results of wind integration cost studies performed by PacifiCorp (in its 2004 IRP), Avista, Idaho Power, Puget Sound Energy, and Bonneville Power. The report lists the key findings of these northwest studies. All of the studies find that the cost of integrat-ing wind starts low as the variability of small quantities of wind generation is lost in the volatility of the system load, and grows as the amount of wind resource increases. Collectively the studies list the size of the control area in relation to the amount of wind, the geographic diversity of the wind locations, the amount of flexibility of the receiving utility, and the access to robust markets as key factors affecting the cost of integrating wind energy. Table J.2 reproduces the data from the report. The Action Plan includes a summary of each of the study methodologies in its appendix B. PacifiCorp’s estimate of wind integration costs ranked among the lowest of the wind integration costs. Only Bonneville Power ranked lower. PacifiCorp’s low integration cost is likely the result of the opportunity to maximize the use of each of the key factors: a large system, wide geographic coverage allowing for dispersed wind sites, and a flexible system with multiple points of access to the energy markets. Table J.2 – Wind Integration Costs from Northwest Utility Studies 6
Wind Penetration ($/MWh of Wind Generation)
Utility Peak Load
(MW) 5% 10% 20% 30% Avista 2,200 $ 2.75 $ 6.99 $ 6.65 $ 8.84 Idaho Power 3,100 $ 9.75 $11.72 $16.16 Puget Sound Energy 4,650 $ 3.73 $ 4.06 PacifiCorp (2003-2004 IRP) 9,400 $ 1.86 $ 3.19 $ 5.94 BPA (within-hour impacts only) 9,090 $ 1.90 $ 2.40 $ 3.70 $ 4.60 In the wake of the regional load peak of July 24, 2006, when wind turbines made only a small contribution to generating capacity at the time of the peak, the wind resource contribution to peak capacity is being reassessed by Northwest Resource Adequacy Forum (NWRA Forum) as Action #1 of the Action Plan.7
6 Source: NWRA Forum, Northwest Wind Integration Action Plan, (March 2007 pre-publication version), page 31. 7 NWRA Forum, Northwest Wind Integration Action Plan (March 2007, pre-publication version). See Action 1,
p.48,

PacifiCorp – 2007 IRP Appendix J – Wind Resource Methodology
200
EFFECT OF RESOURCE ADDITION FUEL TYPE ON THE COMPANY'S COST TO INTEGRATE WIND RESOURCES
As the company installs larger volumes of wind resource generation, the cost to integrate these intermittent resources is anticipated to increase. This is because more non-wind resources must be held back to allow flexibility to follow the intra-hour volatility of the wind generation. Re-sources with greatest the dispatch flexibility that are not already in use to serve load are typically used for integration. The hour to hour dispatch of non-wind resources is not a trivial decision. The company’s owned hydro plants with storage capability and the Mid-Columbia hydro contracts, all of which have the highest flexibility, can often provide the needed flexibility. However, these hydro resources do not have enough volume to integrate all of the anticipated wind variability. Partially loaded gas turbines can provide additional flexibility. Due to its low cost, coal is normally fully utilized to serve load rather than backed off to provide wind integration. It is flexible resources that are operating on the margin that influence the cost of wind integra-tion. When evaluating the effect of the fuel type of resource additions on PacifiCorp’s cost to integrate wind resources, it is most likely that the IRP natural gas-fired additions will have the most effect on integration costs.