packing the kits. packing a ketso after a workshop: move the centrepiece to the side so you can fold...
TRANSCRIPT

Packing the kits

Packing a Ketso after a workshop:
• Move the centrepiece to the side so you can fold the felt
• The slits are there to help you move the felt
• Move any leaves that are crossing over the slits or overhanging the felts, keeping the clusters of leaves (e.g. making sure that if leaves are pointing at each other, you keep them together) and making sure you move the icons with the leaves!

Packing a Ketso after a workshop:
• Check that all of the leaves and icons are stuck firmly to the felt and that none of them are on top of the coloured branches or ovals, where they won't stick
• Fold the kit twice along the slits
• Stack all your felts together then gently fold them one more time so they fit in the bag, without creasing the leaves

Remember: Ketso washes clean in water
• After you have captured your results, all you need to do is dunk the leaves in water
• Make sure you don’t get the kit wet before you get the data!
• A drop of washing up liquid can help clean up if you have left the leaves a long time (rinse if off)
• A salad spinner helps with drying, and you can stack leaves between towels to dry
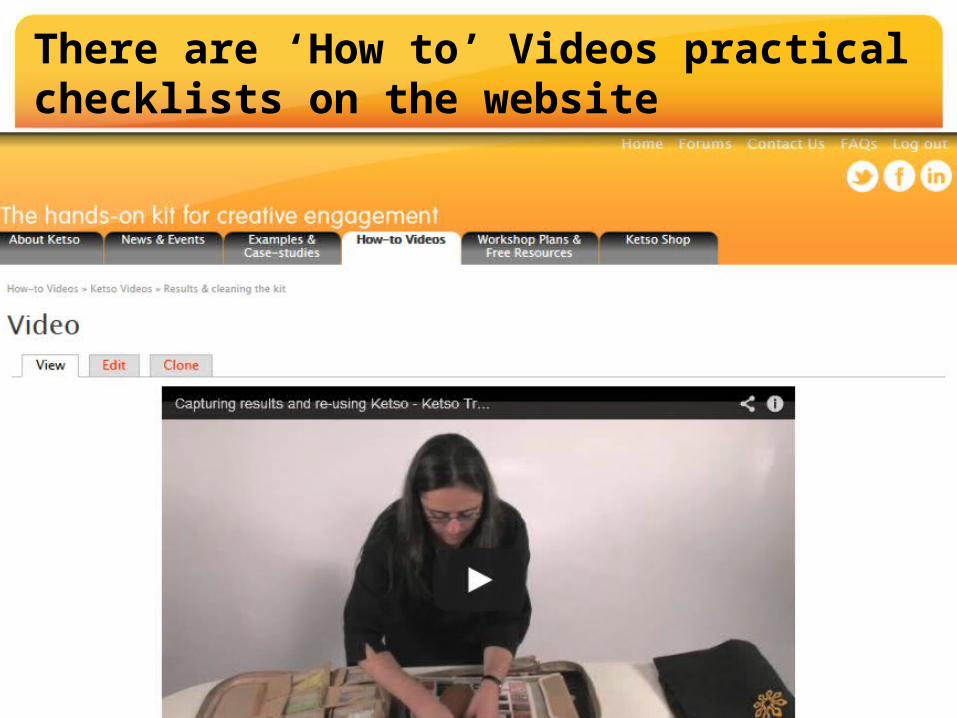
There are ‘How to’ Videos practical checklists on the website

Capturing results from Ketso workspaces
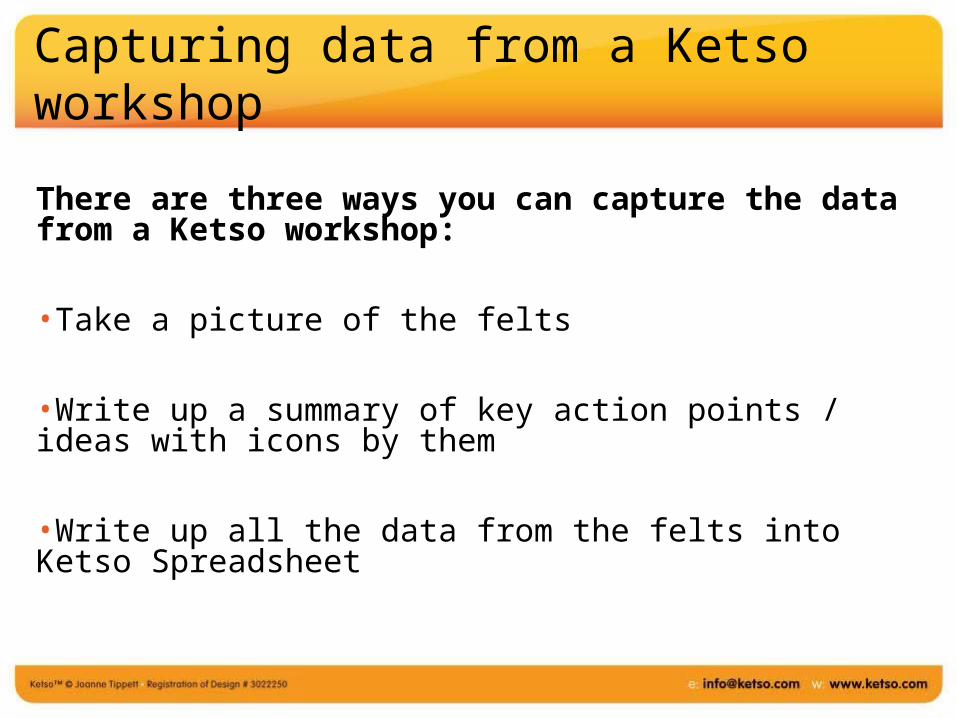
Capturing data from a Ketso workshop
There are three ways you can capture the data from a Ketso workshop:
•Take a picture of the felts
•Write up a summary of key action points / ideas with icons by them
•Write up all the data from the felts into Ketso Spreadsheet

Take a picture of the felts
• Take a picture of each quadrant as well as an overview of whole felt to show the relationships.
• Check that the leaves are in focus and readable before you rinse them clean!
• You need a decent quality camera (8 mega pixels or more), an IPad also works well.
• Taking a picture helps to capture the key patterns and relationships.
• It is a good idea to take a picture, even if you are typing everything up, preferably before you move the felts.

Write up a summary of key action points / ideas with icons by them
• You can simply write up the key action points
• And / or write up the ideas that have icons by them.
• For this you can use a simple Word template that Ketso provides (See ‘Workshop Plans and Free Resources’ on the Ketso website).
• The Word Template does not allow for much analysis, but is fine to capture a few key points.

Write up all the data from the felts into Ketso Spreadsheet
• There is a also a bespoke Ketso Spreadsheet, which leads you through the process of entering the data from multiple felts & provides tools to help with analysis.
•
• This allows for analysis and shows more of the relationships between the ideas.
• It takes roughly 45 minutes to an hour to write up one felt.
• If you have lots of felts, you may just want to write up the ideas with icons by them, but still use the spreadsheet to see patterns.

Write up all the data from the felts into Ketso Spreadsheet
• There is a also a bespoke Ketso Spreadsheet, which leads you through the process of entering the data from multiple felts & provides tools to help with analysis.
• This allows for analysis and shows more of the relationships between the ideas.
• It takes roughly 45 minutes to an hour to write up one felt.
• If you have lots of felts, you may just want to write up the ideas with icons by them, but still use the spreadsheet to assist with analysis.

Capturing results: a Bespoke Ketso Spreadsheet leads you through process

You need to enable macros and editing

Title is on the centrepiece, Hint, put data from all felts from the same workshop or series of workshops in the same spreadsheet, don’t do a separate spreadsheet per felt
The green arrows lead you through the stages

This form is for the legend – the meanings you assigned to the leaves. The default is our most standard Ketso Seed.

The next form is for the felts, you can name each felt if you wish to see whether there is a difference in the responses from different groups, e.g. if workshops were held in different places

Branches go in this form, if you have pre-set branches they can be entered straight away (you may want to note which branches were pre-set in the comments field at the bottom)

You can add more branches as you are working through each felt and new ones come up, go back to branch button on the top left

When you have finished the set up, you see this form for entering the data on each felt
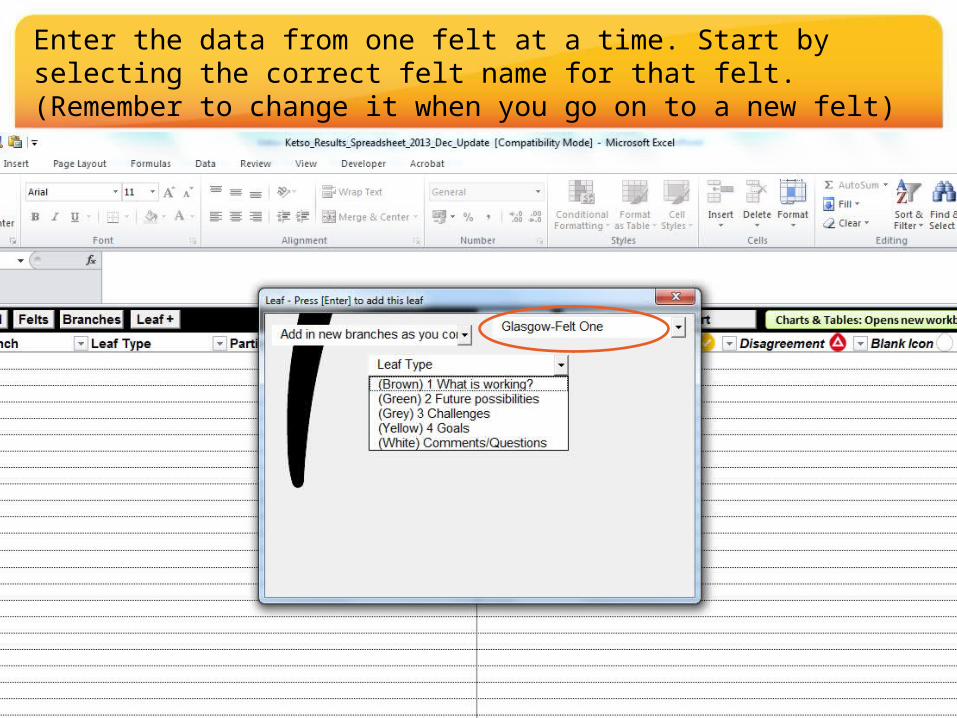
Enter the data from one felt at a time. Start by selecting the correct felt name for that felt. (Remember to change it when you go on to a new felt)

Then select the branch name that you are starting with (remember to change it when you go on to a new branch)

Then select the leaf colour of the first leaf you are entering

Then this space pops up for writing the words that are on the leaf. When you are finished typing up what is on the leaf, press enter. A new form pops up, set to the same felt and branch.

As you enter more leaves, they fill up the spreadsheet. If you have gone out of data entry mode, you can use the ‘Leaf +’ button to enter more data.

If a leaf has icons by it, you can record it in the data entry form, then they show up in the spreadsheet and help you see what has been identified as important

If leaves are clustered together on the felt, you can number them in order to show that the ideas are related to each other. There is a space for this in the form, and a help file

There is a button for sorting the leaves in different ways

Sort by colour then icon – this is the quickest and roughest check of what is important in the dataset

Then you can read the existing assets / future possibilities etc. that people highlighted as important

You can report at this stage, cut and paste the key points under the headings of ‘leaf type’ - this may be enough and is good for a quick feedback loop to get some key ideas out there

Or cut and paste clusters of ideas as images, just showing the areas highlighted as priorities

You can create a report using the branches or key themes as headings, choosing some clusters / ideas identified as priorities

It can be useful to see all of the ideas associated with the different branches from across different felts

The ‘Charts & Tables’ button allows you to create charts from the data, giving another way to look for patterns. For example…

Great Manchester Wetlands Partnership
You can see the total number of leaf types. Note that the numbers may be affected by the workshop process, e.g. if people were asked to only put in one key challenge each.

You can see the distribution of leaf types by branch (themes given to structure discussion).
Great Manchester Wetlands Partnership – Leaf Types By Branch

Note that the ones with fewest ideas are usually emergent branches & likely to have only been at one table (exercise caution in interpretation & usually focus on pre-set branches.
Great Manchester Wetlands Partnership – Leaf Types By Branch

Great Manchester Wetlands Partnership
You can see the distribution of leaf types by felt (this can help with comparisons between workshops or groups).
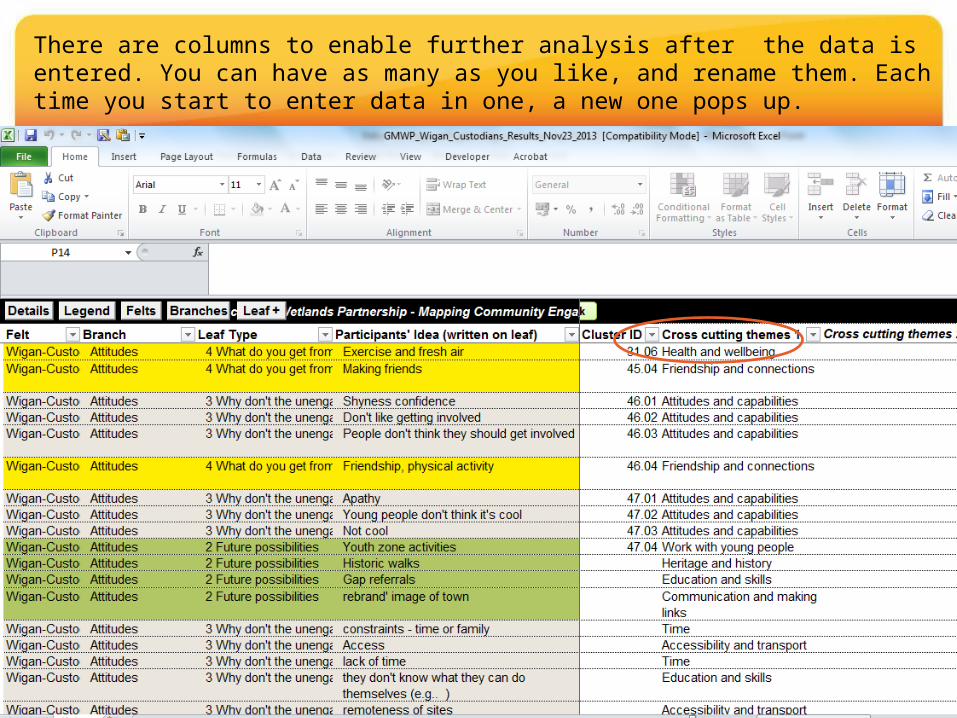
There are columns to enable further analysis after the data is entered. You can have as many as you like, and rename them. Each time you start to enter data in one, a new one pops up.

We have a few suggestions for columns that are useful – have a column for ‘notes and thoughts’ & for ‘tags’ – to note themes

It is useful to have a column for ‘quotes’ – you can just put a y there – and later you can filter just for these ideas, so you can get words from participants to enliven a report.

You may also want to have a column for ‘actionable ideas’ – so as you are going through the data, you can note concrete actions that could be taken.

It is also possible to do a more systematic, line by line coding of the data (though this is not always necessary, it depends what you want to get out of any analysis).

You can look for emerging themes, and/or you can use an existing framework & see which ideas fit with it, e.g. the criteria for a funding bid, a research framework, your strategic goals.

Great Manchester Wetlands Partnership
Using the charts button, you can also see types of ideas by cross-cutting theme (if you have used this function)

This can help you to notice surprising emergent themes….
Number of Ideas by Cross-Cutting Theme
0 10 20 30 40 50 60 70 80 90
Planning system
Assets and ownership
Business
New business models
Volunteering opportunities
Use of natural resources
Creativity and design
Outdoor activities
Bureaucracy
Time
Learning from each other
Accountability and gaps
Perceptions
Democracy
Levels of scale
Motivation
Partnerships and sharing
Capacity building
Support and facilitation
Inequality and power
Sustainability and integration
Finance
Barriers
Opportunities
Solutions
Big Society and the Environment North West

… For instance a major theme to emerge from a workshop about the Big Society which was run with environmental groups
Number of Ideas by Cross-Cutting Theme
0 10 20 30 40 50 60 70 80 90
Planning system
Assets and ownership
Business
New business models
Volunteering opportunities
Use of natural resources
Creativity and design
Outdoor activities
Bureaucracy
Time
Learning from each other
Accountability and gaps
Perceptions
Democracy
Levels of scale
Motivation
Partnerships and sharing
Capacity building
Support and facilitation
Inequality and power
Sustainability and integration
Finance
Barriers
Opportunities
Solutions
Big Society and the Environment North West
Top three themes:•Finance
•Sustainability & integration
•Inequality & power •(and this had the most challenges)
http://ketso.com/examples-case-studies/environment-sustainability#Big_Society

Great Manchester Wetlands Partnership
Sometimes you find out things that surprise you and your participants, such as this reason why people volunteer in biodiversity projects (yellow leaves) – friendship & connections

Sorting with the drop down button
• You can also sort data easily by using the button next to every column

Filtering data
• Each column has a square button with a downward arrow at the top
• These can be used to filter the data, e.g.• Show only the
‘Education’ branch’

Filtering by key word
• The filters can be used to filter the data in lots of different ways, e.g.• Show only those leaves
that contain a particular key word or phrase – such as ‘schools’ or ‘learning’

Advice for coding
• Go for the quick wins first! Coding can be overwhelming, especially when it is a big dataset.
• Add as many columns as you need• Keep a column for questions / confusing areas,
especially if there is more than one person coding• Keep a column just for quick ideas and notes,
especially if you are using a pre-set coding scheme – don’t lose thoughts as you go along
• It is a good idea if possible to have more than one person coding for themes to cross-check – but this does require communication and checking in!

What if the way people have used branches and leaves seem confused? • Ideas can pop up across branches, these may
suggest an emergent theme – use columns:• Colours can be messed up – either because:• people got confused and used the wrong colour• they have just had an idea and written it down• the stage of green leaves (future possibilities) often
merges into yellow (goals / visions of success)• one person’s ‘what is working’ (brown) is another
person's ‘future idea’ (green)
• If it’s just a few, and obvious, you may change the colour – but note in a column that you have done so
Making the most of your analysis
• After any stages of coding, it is a good idea to do a visual and numerical analysis on the new columns to get some powerful charts and see what patterns are emerging
• When you write the report, make sure to cross-check with icons so that ideas marked as important get special attention
• You can visualise your work in a word cloud
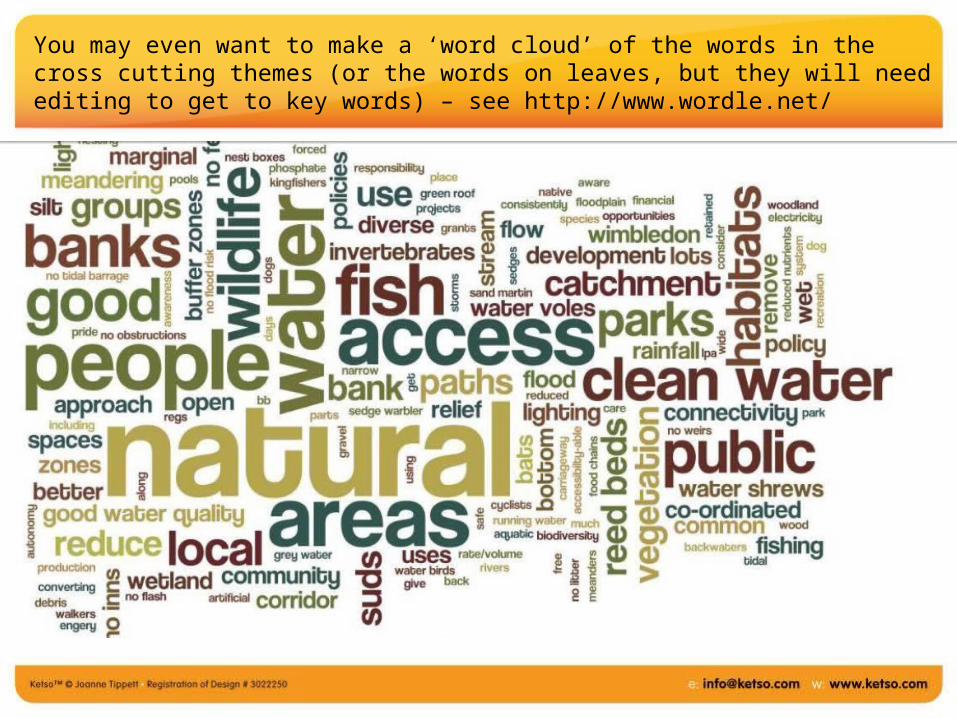
You may even want to make a ‘word cloud’ of the words in the cross cutting themes (or the words on leaves, but they will need editing to get to key words) – see http://www.wordle.net/

Make participants work for you – get them to use the icons (including the table swap). It is important to get people to point the icons right at the leaf they are talking about.

If a leaf has icons by it, you can record it in the data entry form, and you can also record the white icons as connections
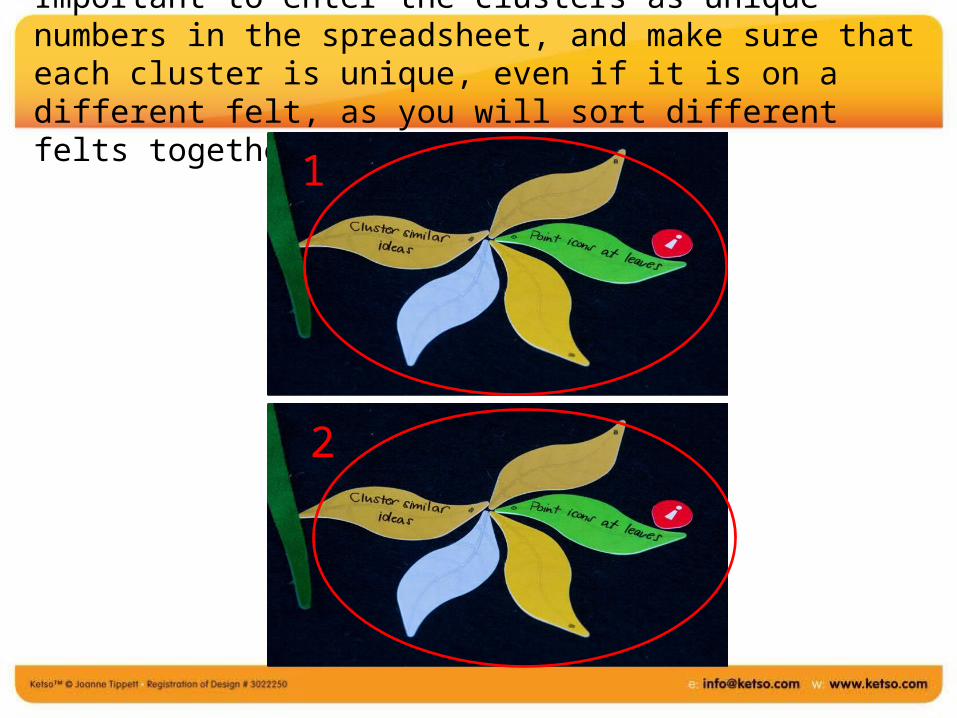
Important to enter the clusters as unique numbers in the spreadsheet, and make sure that each cluster is unique, even if it is on a different felt, as you will sort different felts together
1
2

There are lots of resources on the Ketso website to help.
The FAQs link to examples of reports – from simple summaries to full reports:http://ketso.com/faqs#reports
Further examples of reports can be found throughout the case studies:http://ketso.com/examples-case-studies
The software can be downloaded here:http://ketso.com/resources-downloads/downloads/software

Joe Brady, Head of Integration Services Scottish Refugee Council
“I have discovered that using the Ketso spreadsheet allows the analyst to see surprising themes from the synthesis of participants’ ideas that may run counter to the dominant power structures and perceived wisdom.
Ketso is unique in its ability to not only surface new thoughts but also to provide a credible and traceable evidence base for recommendations that emerge from consultation.”