page 1 of 19 - files.nc.gov
TRANSCRIPT

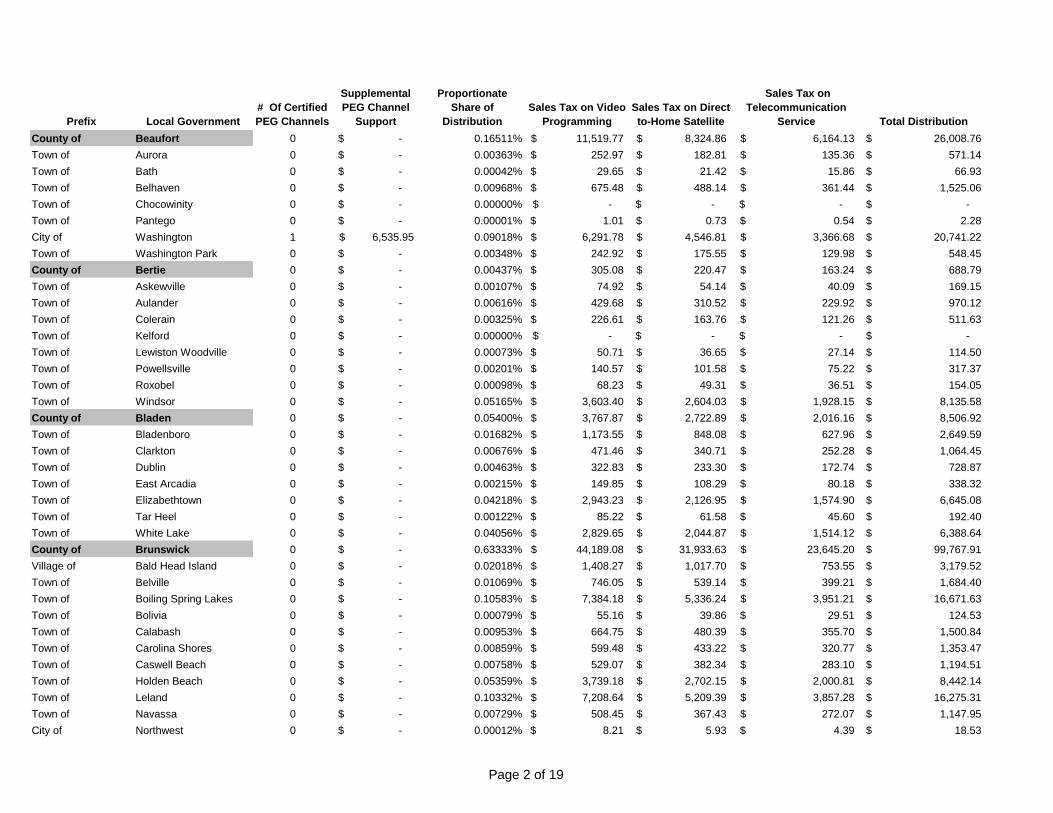
Distribution Date September 15, 2021VIDEO PROGRAMMING DISTRIBUTION
Deposit Date September 15, 2021
Qtr 4/01/2021 - 6/30/2021
Prefix Local Government
# Of Certified
PEG Channels
Supplemental
PEG Channel
Support
Proportionate
Share of
Distribution
Sales Tax on Video
Programming
Sales Tax on Direct-
to-Home Satellite
Sales Tax on
Telecommunication
Service Total Distribution
County of Alamance 1 6,535.95$ 0.23850% 16,641.00$ 12,025.76$ 8,904.46$ 44,107.17$
Village of Alamance 0 -$ 0.00095% 66.05$ 47.73$ 35.34$ 149.12$
City of Burlington 1 6,535.95$ 0.48983% 34,176.34$ 24,697.83$ 18,287.47$ 83,697.59$
Town of Elon 0 -$ 0.14238% 9,934.48$ 7,179.24$ 5,315.86$ 22,429.58$
City of Graham 0 -$ 0.13589% 9,481.07$ 6,851.58$ 5,073.24$ 21,405.89$
Town of Green Level 0 -$ 0.01065% 742.86$ 536.84$ 397.50$ 1,677.20$
Town of Haw River 0 -$ 0.01862% 1,299.04$ 938.76$ 695.10$ 2,932.90$
City of Mebane 0 -$ 0.09648% 6,731.55$ 4,864.62$ 3,602.00$ 15,198.17$
Town of Ossipee 0 -$ 0.00276% 192.89$ 139.39$ 103.21$ 435.49$
Town of Swepsonville 0 -$ 0.00690% 481.11$ 347.68$ 257.44$ 1,086.23$
County of Alexander 2 13,071.90$ 0.14636% 10,212.08$ 7,379.85$ 5,464.40$ 36,128.23$
Town of Taylorsville 0 -$ 0.04562% 3,183.16$ 2,300.34$ 1,703.28$ 7,186.78$
County of Alleghany 3 19,607.85$ 0.01821% 1,270.54$ 918.16$ 679.85$ 22,476.40$
Town of Sparta 0 -$ 0.01072% 747.89$ 540.47$ 400.19$ 1,688.55$
County of Anson 0 -$ 0.02987% 2,083.80$ 1,505.88$ 1,115.03$ 4,704.71$
Town of Ansonville 0 -$ 0.00272% 189.70$ 137.09$ 101.51$ 428.30$
Town of Lilesville 0 -$ 0.00299% 208.81$ 150.89$ 111.73$ 471.43$
Town of McFarlan 0 -$ 0.00000% -$ -$ -$ -$
Town of Morven 0 -$ 0.00090% 62.72$ 45.32$ 33.56$ 141.60$
Town of Peachland 0 -$ 0.00084% 58.28$ 42.11$ 31.18$ 131.57$
Town of Polkton 0 -$ 0.00140% 97.46$ 70.43$ 52.15$ 220.04$
Town of Wadesboro 0 -$ 0.04225% 2,947.71$ 2,130.19$ 1,577.29$ 6,655.19$
County of Ashe 0 -$ 0.11306% 7,888.70$ 5,700.84$ 4,221.17$ 17,810.71$
Town of Jefferson 0 -$ 0.01240% 864.86$ 625.00$ 462.78$ 1,952.64$
Town of Lansing 0 -$ 0.00040% 28.24$ 20.41$ 15.11$ 63.76$
Town of West Jefferson 0 -$ 0.00100% 69.51$ 50.23$ 37.19$ 156.93$
County of Avery 0 -$ 0.07020% 4,897.79$ 3,539.43$ 2,620.77$ 11,057.99$
Town of Banner Elk 0 -$ 0.00863% 602.21$ 435.19$ 322.24$ 1,359.64$
Town of Crossnore 0 -$ 0.00069% 48.48$ 35.04$ 25.94$ 109.46$
Town of Elk Park 0 -$ 0.00527% 367.54$ 265.60$ 196.67$ 829.81$
Village of Grandfather Village 0 -$ 0.00011% 7.97$ 5.76$ 4.27$ 18.00$
Town of Newland 0 -$ 0.00581% 405.30$ 292.90$ 216.87$ 915.07$
Village of Sugar Mountain 0 -$ 0.01061% 740.13$ 534.86$ 396.04$ 1,671.03$
Page 1 of 19
Prefix Local Government
# Of Certified
PEG Channels
Supplemental
PEG Channel
Support
Proportionate
Share of
Distribution
Sales Tax on Video
Programming
Sales Tax on Direct-
to-Home Satellite
Sales Tax on
Telecommunication
Service Total Distribution
County of Beaufort 0 -$ 0.16511% 11,519.77$ 8,324.86$ 6,164.13$ 26,008.76$
Town of Aurora 0 -$ 0.00363% 252.97$ 182.81$ 135.36$ 571.14$
Town of Bath 0 -$ 0.00042% 29.65$ 21.42$ 15.86$ 66.93$
Town of Belhaven 0 -$ 0.00968% 675.48$ 488.14$ 361.44$ 1,525.06$
Town of Chocowinity 0 -$ 0.00000% -$ -$ -$ -$
Town of Pantego 0 -$ 0.00001% 1.01$ 0.73$ 0.54$ 2.28$
City of Washington 1 6,535.95$ 0.09018% 6,291.78$ 4,546.81$ 3,366.68$ 20,741.22$
Town of Washington Park 0 -$ 0.00348% 242.92$ 175.55$ 129.98$ 548.45$
County of Bertie 0 -$ 0.00437% 305.08$ 220.47$ 163.24$ 688.79$
Town of Askewville 0 -$ 0.00107% 74.92$ 54.14$ 40.09$ 169.15$
Town of Aulander 0 -$ 0.00616% 429.68$ 310.52$ 229.92$ 970.12$
Town of Colerain 0 -$ 0.00325% 226.61$ 163.76$ 121.26$ 511.63$
Town of Kelford 0 -$ 0.00000% -$ -$ -$ -$
Town of Lewiston Woodville 0 -$ 0.00073% 50.71$ 36.65$ 27.14$ 114.50$
Town of Powellsville 0 -$ 0.00201% 140.57$ 101.58$ 75.22$ 317.37$
Town of Roxobel 0 -$ 0.00098% 68.23$ 49.31$ 36.51$ 154.05$
Town of Windsor 0 -$ 0.05165% 3,603.40$ 2,604.03$ 1,928.15$ 8,135.58$
County of Bladen 0 -$ 0.05400% 3,767.87$ 2,722.89$ 2,016.16$ 8,506.92$
Town of Bladenboro 0 -$ 0.01682% 1,173.55$ 848.08$ 627.96$ 2,649.59$
Town of Clarkton 0 -$ 0.00676% 471.46$ 340.71$ 252.28$ 1,064.45$
Town of Dublin 0 -$ 0.00463% 322.83$ 233.30$ 172.74$ 728.87$
Town of East Arcadia 0 -$ 0.00215% 149.85$ 108.29$ 80.18$ 338.32$
Town of Elizabethtown 0 -$ 0.04218% 2,943.23$ 2,126.95$ 1,574.90$ 6,645.08$
Town of Tar Heel 0 -$ 0.00122% 85.22$ 61.58$ 45.60$ 192.40$
Town of White Lake 0 -$ 0.04056% 2,829.65$ 2,044.87$ 1,514.12$ 6,388.64$
County of Brunswick 0 -$ 0.63333% 44,189.08$ 31,933.63$ 23,645.20$ 99,767.91$
Village of Bald Head Island 0 -$ 0.02018% 1,408.27$ 1,017.70$ 753.55$ 3,179.52$
Town of Belville 0 -$ 0.01069% 746.05$ 539.14$ 399.21$ 1,684.40$
Town of Boiling Spring Lakes 0 -$ 0.10583% 7,384.18$ 5,336.24$ 3,951.21$ 16,671.63$
Town of Bolivia 0 -$ 0.00079% 55.16$ 39.86$ 29.51$ 124.53$
Town of Calabash 0 -$ 0.00953% 664.75$ 480.39$ 355.70$ 1,500.84$
Town of Carolina Shores 0 -$ 0.00859% 599.48$ 433.22$ 320.77$ 1,353.47$
Town of Caswell Beach 0 -$ 0.00758% 529.07$ 382.34$ 283.10$ 1,194.51$
Town of Holden Beach 0 -$ 0.05359% 3,739.18$ 2,702.15$ 2,000.81$ 8,442.14$
Town of Leland 0 -$ 0.10332% 7,208.64$ 5,209.39$ 3,857.28$ 16,275.31$
Town of Navassa 0 -$ 0.00729% 508.45$ 367.43$ 272.07$ 1,147.95$
City of Northwest 0 -$ 0.00012% 8.21$ 5.93$ 4.39$ 18.53$
Page 2 of 19
Prefix Local Government
# Of Certified
PEG Channels
Supplemental
PEG Channel
Support
Proportionate
Share of
Distribution
Sales Tax on Video
Programming
Sales Tax on Direct-
to-Home Satellite
Sales Tax on
Telecommunication
Service Total Distribution
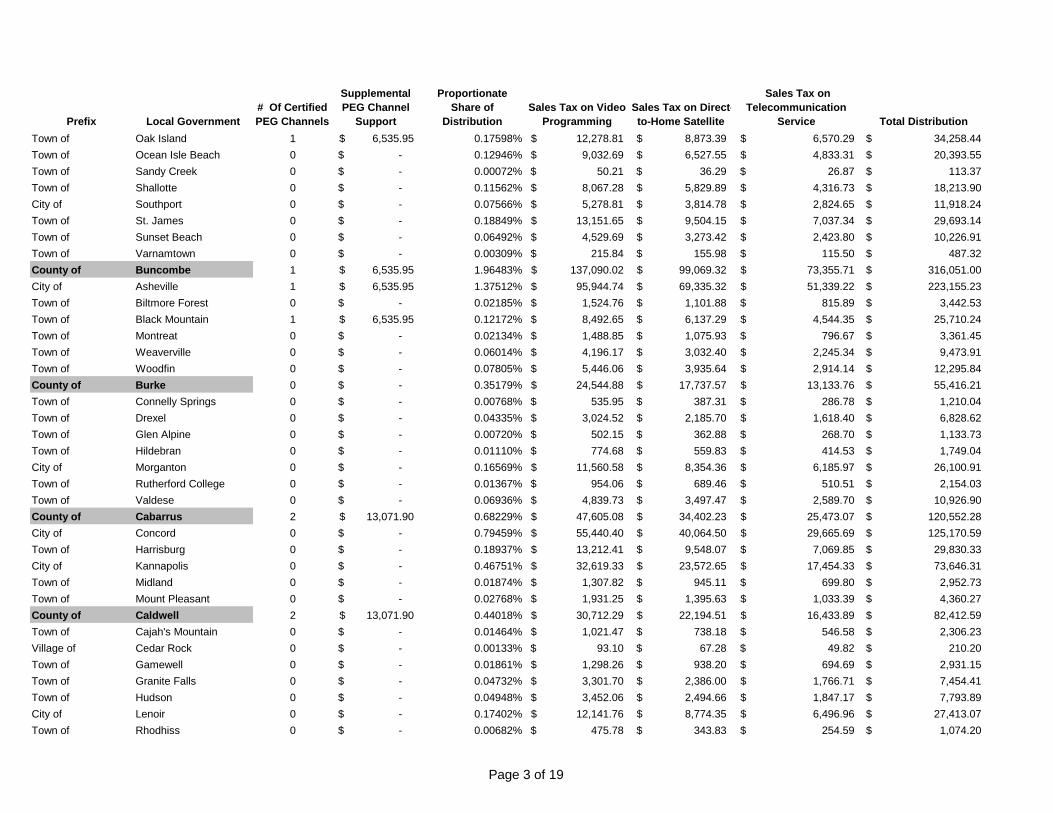
Town of Oak Island 1 6,535.95$ 0.17598% 12,278.81$ 8,873.39$ 6,570.29$ 34,258.44$
Town of Ocean Isle Beach 0 -$ 0.12946% 9,032.69$ 6,527.55$ 4,833.31$ 20,393.55$
Town of Sandy Creek 0 -$ 0.00072% 50.21$ 36.29$ 26.87$ 113.37$
Town of Shallotte 0 -$ 0.11562% 8,067.28$ 5,829.89$ 4,316.73$ 18,213.90$
City of Southport 0 -$ 0.07566% 5,278.81$ 3,814.78$ 2,824.65$ 11,918.24$
Town of St. James 0 -$ 0.18849% 13,151.65$ 9,504.15$ 7,037.34$ 29,693.14$
Town of Sunset Beach 0 -$ 0.06492% 4,529.69$ 3,273.42$ 2,423.80$ 10,226.91$
Town of Varnamtown 0 -$ 0.00309% 215.84$ 155.98$ 115.50$ 487.32$
County of Buncombe 1 6,535.95$ 1.96483% 137,090.02$ 99,069.32$ 73,355.71$ 316,051.00$
City of Asheville 1 6,535.95$ 1.37512% 95,944.74$ 69,335.32$ 51,339.22$ 223,155.23$
Town of Biltmore Forest 0 -$ 0.02185% 1,524.76$ 1,101.88$ 815.89$ 3,442.53$
Town of Black Mountain 1 6,535.95$ 0.12172% 8,492.65$ 6,137.29$ 4,544.35$ 25,710.24$
Town of Montreat 0 -$ 0.02134% 1,488.85$ 1,075.93$ 796.67$ 3,361.45$
Town of Weaverville 0 -$ 0.06014% 4,196.17$ 3,032.40$ 2,245.34$ 9,473.91$
Town of Woodfin 0 -$ 0.07805% 5,446.06$ 3,935.64$ 2,914.14$ 12,295.84$
County of Burke 0 -$ 0.35179% 24,544.88$ 17,737.57$ 13,133.76$ 55,416.21$
Town of Connelly Springs 0 -$ 0.00768% 535.95$ 387.31$ 286.78$ 1,210.04$
Town of Drexel 0 -$ 0.04335% 3,024.52$ 2,185.70$ 1,618.40$ 6,828.62$
Town of Glen Alpine 0 -$ 0.00720% 502.15$ 362.88$ 268.70$ 1,133.73$
Town of Hildebran 0 -$ 0.01110% 774.68$ 559.83$ 414.53$ 1,749.04$
City of Morganton 0 -$ 0.16569% 11,560.58$ 8,354.36$ 6,185.97$ 26,100.91$
Town of Rutherford College 0 -$ 0.01367% 954.06$ 689.46$ 510.51$ 2,154.03$
Town of Valdese 0 -$ 0.06936% 4,839.73$ 3,497.47$ 2,589.70$ 10,926.90$
County of Cabarrus 2 13,071.90$ 0.68229% 47,605.08$ 34,402.23$ 25,473.07$ 120,552.28$
City of Concord 0 -$ 0.79459% 55,440.40$ 40,064.50$ 29,665.69$ 125,170.59$
Town of Harrisburg 0 -$ 0.18937% 13,212.41$ 9,548.07$ 7,069.85$ 29,830.33$
City of Kannapolis 0 -$ 0.46751% 32,619.33$ 23,572.65$ 17,454.33$ 73,646.31$
Town of Midland 0 -$ 0.01874% 1,307.82$ 945.11$ 699.80$ 2,952.73$
Town of Mount Pleasant 0 -$ 0.02768% 1,931.25$ 1,395.63$ 1,033.39$ 4,360.27$
County of Caldwell 2 13,071.90$ 0.44018% 30,712.29$ 22,194.51$ 16,433.89$ 82,412.59$
Town of Cajah's Mountain 0 -$ 0.01464% 1,021.47$ 738.18$ 546.58$ 2,306.23$
Village of Cedar Rock 0 -$ 0.00133% 93.10$ 67.28$ 49.82$ 210.20$
Town of Gamewell 0 -$ 0.01861% 1,298.26$ 938.20$ 694.69$ 2,931.15$
Town of Granite Falls 0 -$ 0.04732% 3,301.70$ 2,386.00$ 1,766.71$ 7,454.41$
Town of Hudson 0 -$ 0.04948% 3,452.06$ 2,494.66$ 1,847.17$ 7,793.89$
City of Lenoir 0 -$ 0.17402% 12,141.76$ 8,774.35$ 6,496.96$ 27,413.07$
Town of Rhodhiss 0 -$ 0.00682% 475.78$ 343.83$ 254.59$ 1,074.20$
Page 3 of 19

Prefix Local Government
# Of Certified
PEG Channels
Supplemental
PEG Channel
Support
Proportionate
Share of
Distribution
Sales Tax on Video
Programming
Sales Tax on Direct-
to-Home Satellite
Sales Tax on
Telecommunication
Service Total Distribution
Town of Sawmills 0 -$ 0.03816% 2,662.32$ 1,923.95$ 1,424.59$ 6,010.86$
County of Camden 0 -$ 0.05801% 4,047.78$ 2,925.16$ 2,165.93$ 9,138.87$
County of Carteret 0 -$ 0.58717% 40,968.21$ 29,606.04$ 21,921.74$ 92,495.99$
Town of Atlantic Beach 0 -$ 0.11165% 7,789.75$ 5,629.33$ 4,168.23$ 17,587.31$
Town of Beaufort 0 -$ 0.03654% 2,549.35$ 1,842.31$ 1,364.14$ 5,755.80$
Town of Bogue 0 -$ 0.00738% 514.95$ 372.13$ 275.55$ 1,162.63$
Town of Cape Carteret 0 -$ 0.03773% 2,632.26$ 1,902.23$ 1,408.50$ 5,942.99$
Town of Cedar Point 0 -$ 0.03721% 2,595.94$ 1,875.98$ 1,389.06$ 5,860.98$
Town of Emerald Isle 0 -$ 0.14594% 10,182.40$ 7,358.40$ 5,448.52$ 22,989.32$
Town of Indian Beach 0 -$ 0.02035% 1,419.56$ 1,025.86$ 759.60$ 3,205.02$
Town of Morehead City 0 -$ 0.16588% 11,573.88$ 8,363.97$ 6,193.08$ 26,130.93$
Town of Newport 0 -$ 0.05560% 3,879.39$ 2,803.47$ 2,075.83$ 8,758.69$
Town of Peletier 0 -$ 0.00848% 591.49$ 427.45$ 316.50$ 1,335.44$
Town of Pine Knoll Shores 0 -$ 0.03157% 2,202.58$ 1,591.71$ 1,178.58$ 4,972.87$
County of Caswell 0 -$ 0.01896% 1,323.19$ 956.21$ 708.03$ 2,987.43$
Town of Milton 0 -$ 0.00079% 54.84$ 39.63$ 29.34$ 123.81$
Town of Yanceyville 0 -$ 0.01571% 1,095.97$ 792.01$ 586.44$ 2,474.42$
County of Catawba 0 -$ 0.80749% 56,340.45$ 40,714.92$ 30,147.30$ 127,202.67$
Town of Brookford 0 -$ 0.00462% 322.32$ 232.93$ 172.47$ 727.72$
Town of Catawba 0 -$ 0.00495% 345.49$ 249.67$ 184.87$ 780.03$
City of Claremont 0 -$ 0.04510% 3,146.68$ 2,273.98$ 1,683.76$ 7,104.42$
City of Conover 0 -$ 0.08425% 5,878.39$ 4,248.07$ 3,145.48$ 13,271.94$
City of Hickory 0 -$ 0.52891% 36,903.22$ 26,668.44$ 19,746.60$ 83,318.26$
Town of Long View 0 -$ 0.02506% 1,748.71$ 1,263.72$ 935.72$ 3,948.15$
Town of Maiden 0 -$ 0.02569% 1,792.13$ 1,295.10$ 958.95$ 4,046.18$
City of Newton 0 -$ 0.09561% 6,670.59$ 4,820.56$ 3,569.38$ 15,060.53$
County of Chatham 2 13,071.90$ 0.21460% 14,972.79$ 10,820.22$ 8,011.81$ 46,876.72$
Town of Goldston 0 -$ 0.00113% 79.11$ 57.17$ 42.33$ 178.61$
Town of Pittsboro 0 -$ 0.04220% 2,944.21$ 2,127.66$ 1,575.42$ 6,647.29$
Town of Siler City 0 -$ 0.04363% 3,043.81$ 2,199.64$ 1,628.72$ 6,872.17$
County of Cherokee 0 -$ 0.06836% 4,769.62$ 3,446.80$ 2,552.18$ 10,768.60$
Town of Andrews 0 -$ 0.00696% 485.66$ 350.97$ 259.87$ 1,096.50$
Town of Murphy 0 -$ 0.01245% 868.82$ 627.86$ 464.90$ 1,961.58$
County of Chowan 0 -$ 0.02021% 1,409.87$ 1,018.86$ 754.41$ 3,183.14$
Town of Edenton 0 -$ 0.03105% 2,166.12$ 1,565.37$ 1,159.07$ 4,890.56$
County of Clay 0 -$ 0.03074% 2,144.48$ 1,549.73$ 1,147.50$ 4,841.71$
Town of Hayesville 0 -$ 0.00188% 131.04$ 94.70$ 70.12$ 295.86$
Page 4 of 19

Prefix Local Government
# Of Certified
PEG Channels
Supplemental
PEG Channel
Support
Proportionate
Share of
Distribution
Sales Tax on Video
Programming
Sales Tax on Direct-
to-Home Satellite
Sales Tax on
Telecommunication
Service Total Distribution
County of Cleveland 0 -$ 0.37666% 26,280.40$ 18,991.76$ 14,062.42$ 59,334.58$
Town of Belwood 0 -$ 0.00444% 309.90$ 223.95$ 165.82$ 699.67$
Town of Boiling Springs 0 -$ 0.04241% 2,959.17$ 2,138.47$ 1,583.43$ 6,681.07$
Town of Casar 0 -$ 0.00000% -$ -$ -$ -$
Town of Earl 0 -$ 0.00340% 237.18$ 171.40$ 126.91$ 535.49$
Town of Fallston 0 -$ 0.00473% 330.33$ 238.72$ 176.76$ 745.81$
Town of Grover 0 -$ 0.00318% 221.87$ 160.34$ 118.72$ 500.93$
City of Kings Mountain 0 -$ 0.05421% 3,782.03$ 2,733.12$ 2,023.73$ 8,538.88$
Town of Kingstown 0 -$ 0.00311% 216.80$ 156.67$ 116.01$ 489.48$
Town of Lattimore 0 -$ 0.00072% 50.14$ 36.23$ 26.83$ 113.20$
Town of Lawndale 0 -$ 0.00432% 301.46$ 217.85$ 161.31$ 680.62$
Town of Mooresboro 0 -$ 0.00148% 103.30$ 74.65$ 55.27$ 233.22$
Town of Patterson Springs 0 -$ 0.00262% 182.93$ 132.20$ 97.88$ 413.01$
Town of Polkville 0 -$ 0.00233% 162.42$ 117.38$ 86.91$ 366.71$
City of Shelby 1 6,535.95$ 0.19762% 13,788.33$ 9,964.26$ 7,378.02$ 37,666.56$
Town of Waco 0 -$ 0.00086% 59.78$ 43.20$ 31.99$ 134.97$
County of Columbus 2 13,071.90$ 0.04197% 2,928.66$ 2,116.42$ 1,567.10$ 19,684.08$
Town of Boardman 0 -$ 0.00000% -$ -$ -$ -$
Town of Bolton 0 -$ 0.00106% 74.22$ 53.63$ 39.71$ 167.56$
Town of Brunswick 0 -$ 0.00406% 283.13$ 204.60$ 151.50$ 639.23$
Town of Cerro Gordo 0 -$ 0.00015% 10.27$ 7.42$ 5.49$ 23.18$
Town of Chadbourn 0 -$ 0.01335% 931.22$ 672.95$ 498.29$ 2,102.46$
Town of Fair Bluff 0 -$ 0.00414% 289.17$ 208.97$ 154.73$ 652.87$
Town of Lake Waccamaw 0 -$ 0.00665% 463.67$ 335.07$ 248.11$ 1,046.85$
Town of Sandyfield 0 -$ 0.00217% 151.12$ 109.21$ 80.86$ 341.19$
Town of Tabor City 0 -$ 0.02012% 1,404.00$ 1,014.61$ 751.27$ 3,169.88$
City of Whiteville 0 -$ 0.06296% 4,392.53$ 3,174.30$ 2,350.41$ 9,917.24$
County of Craven 0 -$ 0.39116% 27,291.82$ 19,722.68$ 14,603.62$ 61,618.12$
Town of Bridgeton 0 -$ 0.00447% 312.01$ 225.48$ 166.95$ 704.44$
Town of Cove City 0 -$ 0.00086% 60.26$ 43.55$ 32.24$ 136.05$
Town of Dover 0 -$ 0.00085% 59.62$ 43.09$ 31.90$ 134.61$
City of Havelock 0 -$ 0.12484% 8,710.54$ 6,294.75$ 4,660.94$ 19,666.23$
City of New Bern 1 6,535.95$ 0.33877% 23,636.70$ 17,081.27$ 12,647.80$ 59,901.72$
Town of River Bend 1 6,535.95$ 0.04101% 2,861.12$ 2,067.62$ 1,530.96$ 12,995.65$
Town of Trent Woods 0 -$ 0.02781% 1,940.02$ 1,401.98$ 1,038.09$ 4,380.09$
Town of Vanceboro 0 -$ 0.00531% 370.53$ 267.77$ 198.27$ 836.57$
County of Cumberland 1 6,535.95$ 0.64056% 44,693.47$ 32,298.14$ 23,915.10$ 107,442.66$
Page 5 of 19
Prefix Local Government
# Of Certified
PEG Channels
Supplemental
PEG Channel
Support
Proportionate
Share of
Distribution
Sales Tax on Video
Programming
Sales Tax on Direct-
to-Home Satellite
Sales Tax on
Telecommunication
Service Total Distribution
Town of Eastover 0 -$ 0.02701% 1,884.76$ 1,362.04$ 1,008.52$ 4,255.32$
Town of Falcon 0 -$ 0.00345% 240.54$ 173.83$ 128.71$ 543.08$
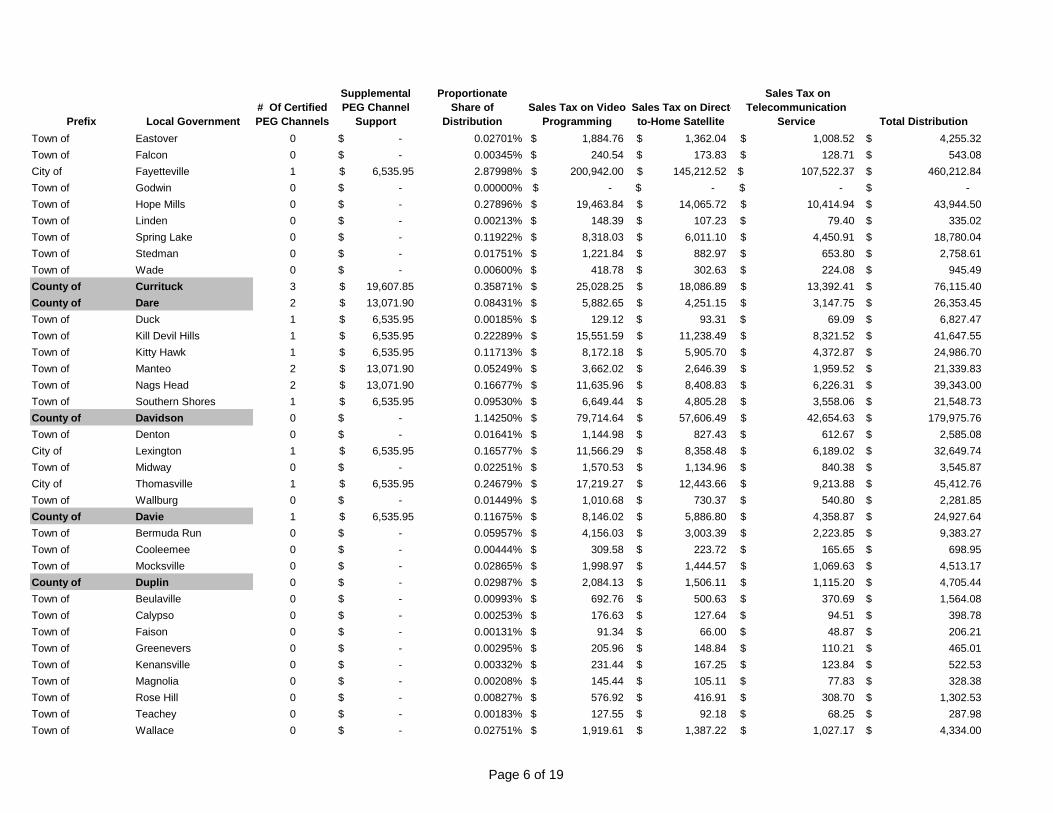
City of Fayetteville 1 6,535.95$ 2.87998% 200,942.00$ 145,212.52$ 107,522.37$ 460,212.84$
Town of Godwin 0 -$ 0.00000% -$ -$ -$ -$
Town of Hope Mills 0 -$ 0.27896% 19,463.84$ 14,065.72$ 10,414.94$ 43,944.50$
Town of Linden 0 -$ 0.00213% 148.39$ 107.23$ 79.40$ 335.02$
Town of Spring Lake 0 -$ 0.11922% 8,318.03$ 6,011.10$ 4,450.91$ 18,780.04$
Town of Stedman 0 -$ 0.01751% 1,221.84$ 882.97$ 653.80$ 2,758.61$
Town of Wade 0 -$ 0.00600% 418.78$ 302.63$ 224.08$ 945.49$
County of Currituck 3 19,607.85$ 0.35871% 25,028.25$ 18,086.89$ 13,392.41$ 76,115.40$
County of Dare 2 13,071.90$ 0.08431% 5,882.65$ 4,251.15$ 3,147.75$ 26,353.45$
Town of Duck 1 6,535.95$ 0.00185% 129.12$ 93.31$ 69.09$ 6,827.47$
Town of Kill Devil Hills 1 6,535.95$ 0.22289% 15,551.59$ 11,238.49$ 8,321.52$ 41,647.55$
Town of Kitty Hawk 1 6,535.95$ 0.11713% 8,172.18$ 5,905.70$ 4,372.87$ 24,986.70$
Town of Manteo 2 13,071.90$ 0.05249% 3,662.02$ 2,646.39$ 1,959.52$ 21,339.83$
Town of Nags Head 2 13,071.90$ 0.16677% 11,635.96$ 8,408.83$ 6,226.31$ 39,343.00$
Town of Southern Shores 1 6,535.95$ 0.09530% 6,649.44$ 4,805.28$ 3,558.06$ 21,548.73$
County of Davidson 0 -$ 1.14250% 79,714.64$ 57,606.49$ 42,654.63$ 179,975.76$
Town of Denton 0 -$ 0.01641% 1,144.98$ 827.43$ 612.67$ 2,585.08$
City of Lexington 1 6,535.95$ 0.16577% 11,566.29$ 8,358.48$ 6,189.02$ 32,649.74$
Town of Midway 0 -$ 0.02251% 1,570.53$ 1,134.96$ 840.38$ 3,545.87$
City of Thomasville 1 6,535.95$ 0.24679% 17,219.27$ 12,443.66$ 9,213.88$ 45,412.76$
Town of Wallburg 0 -$ 0.01449% 1,010.68$ 730.37$ 540.80$ 2,281.85$
County of Davie 1 6,535.95$ 0.11675% 8,146.02$ 5,886.80$ 4,358.87$ 24,927.64$
Town of Bermuda Run 0 -$ 0.05957% 4,156.03$ 3,003.39$ 2,223.85$ 9,383.27$
Town of Cooleemee 0 -$ 0.00444% 309.58$ 223.72$ 165.65$ 698.95$
Town of Mocksville 0 -$ 0.02865% 1,998.97$ 1,444.57$ 1,069.63$ 4,513.17$
County of Duplin 0 -$ 0.02987% 2,084.13$ 1,506.11$ 1,115.20$ 4,705.44$
Town of Beulaville 0 -$ 0.00993% 692.76$ 500.63$ 370.69$ 1,564.08$
Town of Calypso 0 -$ 0.00253% 176.63$ 127.64$ 94.51$ 398.78$
Town of Faison 0 -$ 0.00131% 91.34$ 66.00$ 48.87$ 206.21$
Town of Greenevers 0 -$ 0.00295% 205.96$ 148.84$ 110.21$ 465.01$
Town of Kenansville 0 -$ 0.00332% 231.44$ 167.25$ 123.84$ 522.53$
Town of Magnolia 0 -$ 0.00208% 145.44$ 105.11$ 77.83$ 328.38$
Town of Rose Hill 0 -$ 0.00827% 576.92$ 416.91$ 308.70$ 1,302.53$
Town of Teachey 0 -$ 0.00183% 127.55$ 92.18$ 68.25$ 287.98$
Town of Wallace 0 -$ 0.02751% 1,919.61$ 1,387.22$ 1,027.17$ 4,334.00$
Page 6 of 19

Prefix Local Government
# Of Certified
PEG Channels
Supplemental
PEG Channel
Support
Proportionate
Share of
Distribution
Sales Tax on Video
Programming
Sales Tax on Direct-
to-Home Satellite
Sales Tax on
Telecommunication
Service Total Distribution
Town of Warsaw 0 -$ 0.01189% 829.27$ 599.28$ 443.74$ 1,872.29$
County of Durham 0 -$ 0.64273% 44,844.69$ 32,407.41$ 23,996.01$ 101,248.11$
City of Durham 3 19,607.85$ 3.02611% 211,138.16$ 152,580.86$ 112,978.24$ 496,305.11$
County of Edgecombe 0 -$ 0.06189% 4,318.43$ 3,120.75$ 2,310.75$ 9,749.93$
Town of Conetoe 0 -$ 0.00110% 76.53$ 55.31$ 40.95$ 172.79$
Town of Leggett 0 -$ 0.00000% -$ -$ -$ -$
Town of Macclesfield 0 -$ 0.00130% 90.87$ 65.67$ 48.62$ 205.16$
Town of Pinetops 0 -$ 0.00614% 428.43$ 309.61$ 229.25$ 967.29$
Town of Princeville 0 -$ 0.01082% 755.02$ 545.62$ 404.00$ 1,704.64$
Town of Speed 0 -$ 0.00000% -$ -$ -$ -$
Town of Tarboro 3 19,607.85$ 0.10940% 7,632.82$ 5,515.92$ 4,084.26$ 36,840.85$
Town of Whitakers 0 -$ 0.00430% 300.17$ 216.92$ 160.62$ 677.71$
County of Forsyth 1 6,535.95$ 0.72358% 50,485.44$ 36,483.75$ 27,014.33$ 120,519.47$
Town of Bethania 0 -$ 0.00322% 224.88$ 162.51$ 120.33$ 507.72$
Village of Clemmons 0 -$ 0.26065% 18,186.32$ 13,142.50$ 9,731.34$ 41,060.16$
Town of Kernersville 0 -$ 0.34801% 24,281.11$ 17,546.96$ 12,992.62$ 54,820.69$
Town of Lewisville 1 6,535.95$ 0.16517% 11,524.36$ 8,328.18$ 6,166.59$ 32,555.08$
Town of Rural Hall 0 -$ 0.03153% 2,200.17$ 1,589.97$ 1,177.29$ 4,967.43$
Village of Tobaccoville 0 -$ 0.01612% 1,124.64$ 812.73$ 601.79$ 2,539.16$
Town of Walkertown 0 -$ 0.05463% 3,811.94$ 2,754.73$ 2,039.74$ 8,606.41$
City of Winston-Salem 1 6,535.95$ 2.90249% 202,512.84$ 146,347.70$ 108,362.91$ 463,759.40$
County of Franklin 0 -$ 0.17774% 12,401.60$ 8,962.13$ 6,635.99$ 27,999.72$
Town of Bunn 0 -$ 0.00163% 113.82$ 82.25$ 60.90$ 256.97$
Town of Centerville 0 -$ 0.00000% -$ -$ -$ -$
Town of Franklinton 0 -$ 0.01737% 1,211.70$ 875.64$ 648.37$ 2,735.71$
Town of Louisburg 0 -$ 0.02596% 1,811.08$ 1,308.79$ 969.09$ 4,088.96$
Town of Youngsville 0 -$ 0.01770% 1,234.81$ 892.35$ 660.74$ 2,787.90$
County of Gaston 0 -$ 0.57928% 40,417.62$ 29,208.15$ 21,627.13$ 91,252.90$
City of Belmont 0 -$ 0.14379% 10,032.29$ 7,249.93$ 5,368.19$ 22,650.41$
City of Bessemer City 0 -$ 0.04922% 3,433.95$ 2,481.58$ 1,837.48$ 7,753.01$
City of Cherryville 0 -$ 0.05599% 3,906.62$ 2,823.16$ 2,090.40$ 8,820.18$
Town of Cramerton 0 -$ 0.06555% 4,573.27$ 3,304.92$ 2,447.12$ 10,325.31$
Town of Dallas 0 -$ 0.02319% 1,617.99$ 1,169.25$ 865.77$ 3,653.01$
City of Gastonia 0 -$ 0.70352% 49,086.40$ 35,472.72$ 26,265.72$ 110,824.84$
Town of High Shoals 0 -$ 0.00265% 185.19$ 133.83$ 99.09$ 418.11$
City of Lowell 0 -$ 0.03919% 2,734.39$ 1,976.03$ 1,463.15$ 6,173.57$
Town of McAdenville 0 -$ 0.00681% 474.81$ 343.13$ 254.07$ 1,072.01$
Page 7 of 19

Prefix Local Government
# Of Certified
PEG Channels
Supplemental
PEG Channel
Support
Proportionate
Share of
Distribution
Sales Tax on Video
Programming
Sales Tax on Direct-
to-Home Satellite
Sales Tax on
Telecommunication
Service Total Distribution
City of Mount Holly 0 -$ 0.17478% 12,194.81$ 8,812.69$ 6,525.34$ 27,532.84$
Town of Ranlo 0 -$ 0.02751% 1,919.30$ 1,387.00$ 1,027.00$ 4,333.30$
Town of Spencer Mountain 0 -$ 0.00000% -$ -$ -$ -$
Town of Stanley 0 -$ 0.01745% 1,217.28$ 879.67$ 651.35$ 2,748.30$
County of Gates 0 -$ 0.00180% 125.78$ 90.90$ 67.30$ 283.98$
Town of Gatesville 0 -$ 0.00000% -$ -$ -$ -$
County of Graham 0 -$ 0.00524% 365.61$ 264.21$ 195.64$ 825.46$
Town of Fontana Dam 0 -$ 0.00001% 0.96$ 0.69$ 0.51$ 2.16$
Town of Robbinsville 0 -$ 0.00074% 51.40$ 37.14$ 27.50$ 116.04$
Town of Lake Santeetlah 0 -$ 0.00000% -$ -$ -$ -$
County of Granville 1 6,535.95$ 0.05756% 4,016.38$ 2,902.47$ 2,149.13$ 15,603.93$
Town of Butner 0 -$ 0.01207% 842.33$ 608.72$ 450.72$ 1,901.77$
Town of Creedmoor 0 -$ 0.12435% 8,676.51$ 6,270.16$ 4,642.73$ 19,589.40$
City of Oxford 0 -$ 0.08750% 6,104.89$ 4,411.75$ 3,266.68$ 13,783.32$
Town of Stem 0 -$ 0.00329% 229.24$ 165.66$ 122.66$ 517.56$
Town of Stovall 0 -$ 0.00197% 137.73$ 99.53$ 73.70$ 310.96$
County of Greene 3 19,607.85$ 0.01135% 792.03$ 572.36$ 423.81$ 21,396.05$
Town of Hookerton 3 19,607.85$ 0.00097% 67.75$ 48.96$ 36.25$ 19,760.81$
Town of Snow Hill 3 19,607.85$ 0.00601% 419.45$ 303.12$ 224.44$ 20,554.86$
Town of Walstonburg 3 19,607.85$ 0.00027% 18.85$ 13.62$ 10.09$ 19,650.41$
County of Guilford 1 6,535.95$ 1.01759% 70,999.44$ 51,308.37$ 37,991.20$ 166,834.96$
Town of Gibsonville 0 -$ 0.08389% 5,853.45$ 4,230.05$ 3,132.13$ 13,215.63$
City of Greensboro 3 19,607.85$ 3.91513% 273,167.12$ 197,406.64$ 146,169.42$ 636,351.03$
City of High Point 1 6,535.95$ 1.29083% 90,064.08$ 65,085.60$ 48,192.53$ 209,878.16$
Town of Jamestown 0 -$ 0.06565% 4,580.72$ 3,310.30$ 2,451.11$ 10,342.13$
Town of Oak Ridge 0 -$ 0.09245% 6,450.50$ 4,661.51$ 3,451.61$ 14,563.62$
Town of Pleasant Garden 0 -$ 0.03818% 2,663.93$ 1,925.11$ 1,425.45$ 6,014.49$
Town of Sedalia 0 -$ 0.00294% 205.32$ 148.38$ 109.87$ 463.57$
Town of Stokesdale 0 -$ 0.05131% 3,580.00$ 2,587.12$ 1,915.63$ 8,082.75$
Town of Summerfield 0 -$ 0.13085% 9,129.51$ 6,597.52$ 4,885.12$ 20,612.15$
Town of Whitsett 0 -$ 0.00276% 192.89$ 139.39$ 103.21$ 435.49$
County of Halifax 0 -$ 0.11664% 8,138.09$ 5,881.06$ 4,354.62$ 18,373.77$
Town of Enfield 0 -$ 0.01811% 1,263.53$ 913.10$ 676.11$ 2,852.74$
Town of Halifax 0 -$ 0.00180% 125.29$ 90.54$ 67.04$ 282.87$
Town of Hobgood 0 -$ 0.00098% 68.22$ 49.30$ 36.50$ 154.02$
Town of Littleton 0 -$ 0.01411% 984.30$ 711.32$ 526.69$ 2,222.31$
City of Roanoke Rapids 0 -$ 0.18323% 12,784.50$ 9,238.83$ 6,840.88$ 28,864.21$
Page 8 of 19

Prefix Local Government
# Of Certified
PEG Channels
Supplemental
PEG Channel
Support
Proportionate
Share of
Distribution
Sales Tax on Video
Programming
Sales Tax on Direct-
to-Home Satellite
Sales Tax on
Telecommunication
Service Total Distribution
Town of Scotland Neck 0 -$ 0.02133% 1,488.30$ 1,075.54$ 796.38$ 3,360.22$
Town of Weldon 0 -$ 0.02088% 1,456.95$ 1,052.88$ 779.60$ 3,289.43$
County of Harnett 0 -$ 0.27629% 19,277.43$ 13,931.01$ 10,315.19$ 43,523.63$
Town of Angier 0 -$ 0.05912% 4,124.97$ 2,980.94$ 2,207.24$ 9,313.15$
Town of Coats 0 -$ 0.02759% 1,924.84$ 1,391.01$ 1,029.97$ 4,345.82$
City of Dunn 1 6,535.95$ 0.08993% 6,274.55$ 4,534.36$ 3,357.46$ 20,702.32$
Town of Erwin 0 -$ 0.01898% 1,324.25$ 956.98$ 708.60$ 2,989.83$
Town of Lillington 0 -$ 0.04395% 3,066.31$ 2,215.90$ 1,640.76$ 6,922.97$
County of Haywood 1 6,535.95$ 0.40934% 28,560.19$ 20,639.27$ 15,282.32$ 71,017.73$
Town of Canton 0 -$ 0.06075% 4,238.42$ 3,062.93$ 2,267.94$ 9,569.29$
Town of Clyde 0 -$ 0.01591% 1,109.89$ 802.07$ 593.89$ 2,505.85$
Town of Maggie Valley 0 -$ 0.06125% 4,273.63$ 3,088.38$ 2,286.78$ 9,648.79$
Town of Waynesville 0 -$ 0.15933% 11,116.74$ 8,033.61$ 5,948.48$ 25,098.83$
County of Henderson 2 13,071.90$ 0.60836% 42,446.26$ 30,674.17$ 22,712.64$ 108,904.97$
Village of Flat Rock 0 -$ 0.05647% 3,939.85$ 2,847.16$ 2,108.18$ 8,895.19$
Town of Fletcher 0 -$ 0.08841% 6,168.39$ 4,457.64$ 3,300.65$ 13,926.68$
City of Hendersonville 0 -$ 0.15464% 10,789.31$ 7,796.99$ 5,773.27$ 24,359.57$
Town of Laurel Park 0 -$ 0.03576% 2,494.89$ 1,802.95$ 1,334.99$ 5,632.83$
Town of Mills River 0 -$ 0.03452% 2,408.41$ 1,740.46$ 1,288.72$ 5,437.59$
County of Hertford 0 -$ 0.04695% 3,275.63$ 2,367.16$ 1,752.76$ 7,395.55$
Town of Ahoskie 0 -$ 0.04169% 2,908.49$ 2,101.85$ 1,556.31$ 6,566.65$
Village of Cofield 0 -$ 0.00000% -$ -$ -$ -$
Town of Como 0 -$ 0.00041% 28.69$ 20.74$ 15.35$ 64.78$
Town of Harrellsville 0 -$ 0.00046% 32.20$ 23.27$ 17.23$ 72.70$
Town of Murfreesboro 0 -$ 0.03390% 2,365.02$ 1,709.10$ 1,265.50$ 5,339.62$
Town of Winton 0 -$ 0.00435% 303.72$ 219.48$ 162.52$ 685.72$
County of Hoke 0 -$ 0.02793% 1,948.86$ 1,408.36$ 1,042.82$ 4,400.04$
City of Raeford 0 -$ 0.05022% 3,504.11$ 2,532.28$ 1,875.02$ 7,911.41$
County of Hyde 0 -$ 0.00379% 264.24$ 190.96$ 141.39$ 596.59$
County of Iredell 0 -$ 0.66418% 46,341.25$ 33,488.92$ 24,796.81$ 104,626.98$
Town of Harmony 0 -$ 0.00333% 232.29$ 167.86$ 124.29$ 524.44$
Town of Love Valley 0 -$ 0.00057% 39.53$ 28.57$ 21.15$ 89.25$
Town of Mooresville 2 13,071.90$ 0.21629% 15,090.72$ 10,905.44$ 8,074.92$ 47,142.98$
City of Statesville 0 -$ 0.18994% 13,252.36$ 9,576.93$ 7,091.22$ 29,920.51$
Town of Troutman 0 -$ 0.03164% 2,207.60$ 1,595.34$ 1,181.27$ 4,984.21$
County of Jackson 0 -$ 0.08912% 6,218.24$ 4,493.67$ 3,327.33$ 14,039.24$
Town of Dillsboro 0 -$ 0.00236% 164.90$ 119.17$ 88.24$ 372.31$
Page 9 of 19

Prefix Local Government
# Of Certified
PEG Channels
Supplemental
PEG Channel
Support
Proportionate
Share of
Distribution
Sales Tax on Video
Programming
Sales Tax on Direct-
to-Home Satellite
Sales Tax on
Telecommunication
Service Total Distribution
Town of Forest Hills 0 -$ 0.00172% 119.78$ 86.56$ 64.10$ 270.44$
Town of Sylva 0 -$ 0.02026% 1,413.36$ 1,021.38$ 756.28$ 3,191.02$
Town of Webster 0 -$ 0.00171% 119.24$ 86.17$ 63.80$ 269.21$
County of Johnston 0 -$ 0.51292% 35,787.59$ 25,862.22$ 19,149.64$ 80,799.45$
Town of Archer Lodge 2 13,071.90$ 0.01857% 1,295.88$ 936.48$ 693.42$ 15,997.68$
Town of Benson 0 -$ 0.02513% 1,753.21$ 1,266.97$ 938.13$ 3,958.31$
Town of Clayton 2 13,071.90$ 0.30336% 21,166.09$ 15,295.86$ 11,325.80$ 60,859.65$
Town of Four Oaks 0 -$ 0.01007% 702.69$ 507.81$ 376.00$ 1,586.50$
Town of Kenly 0 -$ 0.00510% 356.17$ 257.39$ 190.58$ 804.14$
Town of Micro 0 -$ 0.00116% 81.18$ 58.67$ 43.44$ 183.29$
Town of Pine Level 0 -$ 0.00819% 571.18$ 412.77$ 305.64$ 1,289.59$
Town of Princeton 0 -$ 0.00132% 92.37$ 66.75$ 49.43$ 208.55$
Town of Selma 0 -$ 0.03634% 2,535.34$ 1,832.19$ 1,356.64$ 5,724.17$
Town of Smithfield 1 6,535.95$ 0.09923% 6,923.59$ 5,003.39$ 3,704.75$ 22,167.68$
Town of Wilson's Mills 0 -$ 0.01279% 892.71$ 645.13$ 477.68$ 2,015.52$
County of Jones 0 -$ 0.00687% 479.56$ 346.56$ 256.61$ 1,082.73$
Town of Maysville 0 -$ 0.00966% 674.15$ 487.18$ 360.73$ 1,522.06$
Town of Pollocksville 0 -$ 0.00311% 217.28$ 157.02$ 116.26$ 490.56$
Town of Trenton 0 -$ 0.00140% 97.56$ 70.50$ 52.20$ 220.26$
County of Lee 2 13,071.90$ 0.19665% 13,720.42$ 9,915.19$ 7,341.68$ 44,049.19$
Town of Broadway 0 -$ 0.00813% 567.48$ 410.09$ 303.65$ 1,281.22$
City of Sanford 1 6,535.95$ 0.21986% 15,339.95$ 11,085.55$ 8,208.28$ 41,169.73$
County of Lenoir 2 13,071.90$ 0.12636% 8,816.60$ 6,371.39$ 4,717.69$ 32,977.58$
City of Kinston 1 6,535.95$ 0.16147% 11,265.98$ 8,141.46$ 6,028.33$ 31,971.72$
Town of La Grange 0 -$ 0.03459% 2,413.39$ 1,744.06$ 1,291.39$ 5,448.84$
Town of Pink Hill 0 -$ 0.00115% 80.30$ 58.03$ 42.97$ 181.30$
County of Lincoln 0 -$ 0.30989% 21,621.77$ 15,625.17$ 11,569.63$ 48,816.57$
City of Lincolnton 0 -$ 0.06291% 4,389.17$ 3,171.87$ 2,348.61$ 9,909.65$
County of Macon 0 -$ 0.11598% 8,092.24$ 5,847.93$ 4,330.09$ 18,270.26$
Town of Franklin 0 -$ 0.03934% 2,745.00$ 1,983.70$ 1,468.83$ 6,197.53$
Town of Highlands 0 -$ 0.04072% 2,840.90$ 2,053.00$ 1,520.14$ 6,414.04$
County of Madison 0 -$ 0.02278% 1,589.53$ 1,148.69$ 850.55$ 3,588.77$
Town of Hot Springs 0 -$ 0.00271% 189.06$ 136.63$ 101.17$ 426.86$
Town of Mars Hill 0 -$ 0.00873% 609.35$ 440.35$ 326.06$ 1,375.76$
Town of Marshall 0 -$ 0.00429% 299.20$ 216.22$ 160.10$ 675.52$
County of Martin 0 -$ 0.04587% 3,200.55$ 2,312.90$ 1,712.59$ 7,226.04$
Town of Bear Grass 0 -$ 0.00033% 23.25$ 16.80$ 12.44$ 52.49$
Page 10 of 19
Prefix Local Government
# Of Certified
PEG Channels
Supplemental
PEG Channel
Support
Proportionate
Share of
Distribution
Sales Tax on Video
Programming
Sales Tax on Direct-
to-Home Satellite
Sales Tax on
Telecommunication
Service Total Distribution
Town of Everetts 0 -$ 0.00000% -$ -$ -$ -$
Town of Hamilton 0 -$ 0.00153% 106.87$ 77.23$ 57.18$ 241.28$
Town of Hassell 0 -$ 0.00000% -$ -$ -$ -$
Town of Jamesville 0 -$ 0.00277% 193.50$ 139.83$ 103.54$ 436.87$
Town of Oak City 0 -$ 0.00236% 164.50$ 118.88$ 88.02$ 371.40$
Town of Parmele 0 -$ 0.00000% -$ -$ -$ -$
Town of Robersonville 0 -$ 0.01317% 919.12$ 664.21$ 491.82$ 2,075.15$
Town of Williamston 0 -$ 0.05158% 3,599.14$ 2,600.95$ 1,925.87$ 8,125.96$
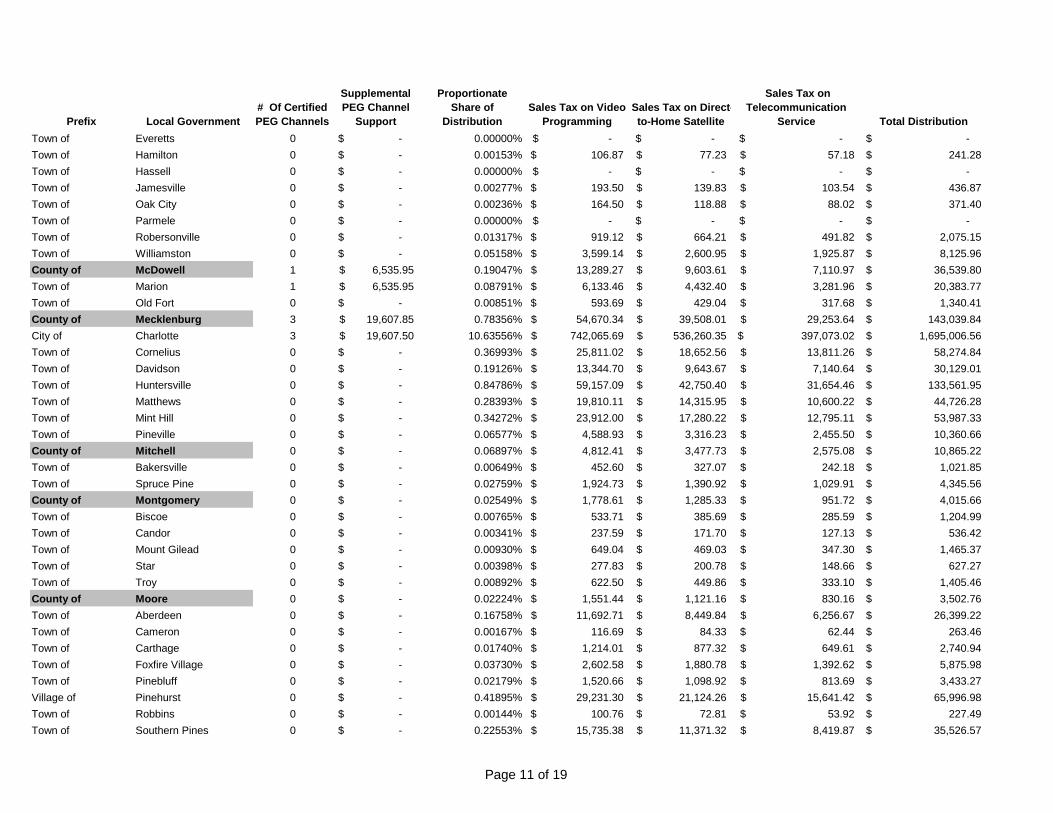
County of McDowell 1 6,535.95$ 0.19047% 13,289.27$ 9,603.61$ 7,110.97$ 36,539.80$
Town of Marion 1 6,535.95$ 0.08791% 6,133.46$ 4,432.40$ 3,281.96$ 20,383.77$
Town of Old Fort 0 -$ 0.00851% 593.69$ 429.04$ 317.68$ 1,340.41$
County of Mecklenburg 3 19,607.85$ 0.78356% 54,670.34$ 39,508.01$ 29,253.64$ 143,039.84$
City of Charlotte 3 19,607.50$ 10.63556% 742,065.69$ 536,260.35$ 397,073.02$ 1,695,006.56$
Town of Cornelius 0 -$ 0.36993% 25,811.02$ 18,652.56$ 13,811.26$ 58,274.84$
Town of Davidson 0 -$ 0.19126% 13,344.70$ 9,643.67$ 7,140.64$ 30,129.01$
Town of Huntersville 0 -$ 0.84786% 59,157.09$ 42,750.40$ 31,654.46$ 133,561.95$
Town of Matthews 0 -$ 0.28393% 19,810.11$ 14,315.95$ 10,600.22$ 44,726.28$
Town of Mint Hill 0 -$ 0.34272% 23,912.00$ 17,280.22$ 12,795.11$ 53,987.33$
Town of Pineville 0 -$ 0.06577% 4,588.93$ 3,316.23$ 2,455.50$ 10,360.66$
County of Mitchell 0 -$ 0.06897% 4,812.41$ 3,477.73$ 2,575.08$ 10,865.22$
Town of Bakersville 0 -$ 0.00649% 452.60$ 327.07$ 242.18$ 1,021.85$
Town of Spruce Pine 0 -$ 0.02759% 1,924.73$ 1,390.92$ 1,029.91$ 4,345.56$
County of Montgomery 0 -$ 0.02549% 1,778.61$ 1,285.33$ 951.72$ 4,015.66$
Town of Biscoe 0 -$ 0.00765% 533.71$ 385.69$ 285.59$ 1,204.99$
Town of Candor 0 -$ 0.00341% 237.59$ 171.70$ 127.13$ 536.42$
Town of Mount Gilead 0 -$ 0.00930% 649.04$ 469.03$ 347.30$ 1,465.37$
Town of Star 0 -$ 0.00398% 277.83$ 200.78$ 148.66$ 627.27$
Town of Troy 0 -$ 0.00892% 622.50$ 449.86$ 333.10$ 1,405.46$
County of Moore 0 -$ 0.02224% 1,551.44$ 1,121.16$ 830.16$ 3,502.76$
Town of Aberdeen 0 -$ 0.16758% 11,692.71$ 8,449.84$ 6,256.67$ 26,399.22$
Town of Cameron 0 -$ 0.00167% 116.69$ 84.33$ 62.44$ 263.46$
Town of Carthage 0 -$ 0.01740% 1,214.01$ 877.32$ 649.61$ 2,740.94$
Town of Foxfire Village 0 -$ 0.03730% 2,602.58$ 1,880.78$ 1,392.62$ 5,875.98$
Town of Pinebluff 0 -$ 0.02179% 1,520.66$ 1,098.92$ 813.69$ 3,433.27$
Village of Pinehurst 0 -$ 0.41895% 29,231.30$ 21,124.26$ 15,641.42$ 65,996.98$
Town of Robbins 0 -$ 0.00144% 100.76$ 72.81$ 53.92$ 227.49$
Town of Southern Pines 0 -$ 0.22553% 15,735.38$ 11,371.32$ 8,419.87$ 35,526.57$
Page 11 of 19

Prefix Local Government
# Of Certified
PEG Channels
Supplemental
PEG Channel
Support
Proportionate
Share of
Distribution
Sales Tax on Video
Programming
Sales Tax on Direct-
to-Home Satellite
Sales Tax on
Telecommunication
Service Total Distribution
Town of Taylortown 0 -$ 0.00349% 243.26$ 175.80$ 130.17$ 549.23$
Town of Vass 0 -$ 0.00861% 600.49$ 433.95$ 321.32$ 1,355.76$
Village of Whispering Pines 0 -$ 0.05761% 4,019.91$ 2,905.02$ 2,151.02$ 9,075.95$
County of Nash 3 19,607.85$ 0.14741% 10,284.78$ 7,432.39$ 5,503.30$ 42,828.32$
Town of Bailey 0 -$ 0.00079% 54.95$ 39.71$ 29.40$ 124.06$
Town of Castalia 0 -$ 0.00061% 42.34$ 30.60$ 22.66$ 95.60$
Town of Dortches 0 -$ 0.00087% 60.36$ 43.62$ 32.30$ 136.28$
Town of Middlesex 0 -$ 0.00090% 62.57$ 45.22$ 33.48$ 141.27$
Town of Momeyer 0 -$ 0.00101% 70.14$ 50.69$ 37.53$ 158.36$
Town of Nashville 1 6,535.95$ 0.06161% 4,298.39$ 3,106.27$ 2,300.03$ 16,240.64$
Town of Red Oak 0 -$ 0.01751% 1,221.48$ 882.71$ 653.60$ 2,757.79$
City of Rocky Mount 2 13,071.90$ 0.53171% 37,098.79$ 26,809.77$ 19,851.25$ 96,831.71$
Town of Sharpsburg 0 -$ 0.01451% 1,012.61$ 731.77$ 541.84$ 2,286.22$
Town of Spring Hope 1 6,535.95$ 0.00540% 376.60$ 272.15$ 201.51$ 7,386.21$
County of New Hanover 2 13,071.90$ 1.59748% 111,459.63$ 80,547.29$ 59,641.10$ 264,719.92$
Town of Carolina Beach 0 -$ 0.13121% 9,154.73$ 6,615.74$ 4,898.62$ 20,669.09$
Town of Kure Beach 0 -$ 0.05023% 3,504.47$ 2,532.54$ 1,875.21$ 7,912.22$
City of Wilmington 1 6,535.95$ 1.94537% 135,732.45$ 98,088.26$ 72,629.29$ 312,985.95$
Town of Wrightsville Beach 0 -$ 0.08394% 5,856.66$ 4,232.37$ 3,133.85$ 13,222.88$
County of Northampton 0 -$ 0.00825% 575.69$ 416.03$ 308.05$ 1,299.77$
Town of Conway 0 -$ 0.00160% 111.36$ 80.48$ 59.59$ 251.43$
Town of Garysburg 0 -$ 0.01136% 792.37$ 572.61$ 423.99$ 1,788.97$
Town of Gaston 0 -$ 0.01716% 1,197.60$ 865.45$ 640.82$ 2,703.87$
Town of Jackson 0 -$ 0.00216% 150.88$ 109.04$ 80.74$ 340.66$
Town of Lasker 0 -$ 0.00054% 37.62$ 27.19$ 20.13$ 84.94$
Town of Rich Square 0 -$ 0.00503% 351.12$ 253.74$ 187.88$ 792.74$
Town of Seaboard 0 -$ 0.00796% 555.14$ 401.18$ 297.05$ 1,253.37$
Town of Severn 0 -$ 0.00111% 77.27$ 55.84$ 41.35$ 174.46$
Town of Woodland 0 -$ 0.00616% 430.06$ 310.79$ 230.12$ 970.97$
County of Onslow 1 6,535.95$ 1.33337% 93,031.83$ 67,230.27$ 49,780.54$ 216,578.59$
Town of Holly Ridge 0 -$ 0.02369% 1,653.18$ 1,194.69$ 884.60$ 3,732.47$
City of Jacksonville 1 6,535.95$ 0.56391% 39,345.11$ 28,433.10$ 21,053.24$ 95,367.40$
Town of North Topsail Beach 0 -$ 0.06149% 4,290.30$ 3,100.42$ 2,295.70$ 9,686.42$
Town of Richlands 0 -$ 0.03045% 2,124.34$ 1,535.17$ 1,136.71$ 4,796.22$
Town of Swansboro 0 -$ 0.03762% 2,625.00$ 1,896.98$ 1,404.62$ 5,926.60$
County of Orange 1 6,535.95$ 0.35931% 25,069.58$ 18,116.76$ 13,414.52$ 63,136.81$
Town of Carrboro 2 13,071.90$ 0.24330% 16,975.38$ 12,267.41$ 9,083.38$ 51,398.07$
Page 12 of 19

Prefix Local Government
# Of Certified
PEG Channels
Supplemental
PEG Channel
Support
Proportionate
Share of
Distribution
Sales Tax on Video
Programming
Sales Tax on Direct-
to-Home Satellite
Sales Tax on
Telecommunication
Service Total Distribution
Town of Chapel Hill 3 19,607.85$ 0.93713% 65,385.58$ 47,251.47$ 34,987.27$ 167,232.17$
Town of Hillsborough 0 -$ 0.08306% 5,794.97$ 4,187.79$ 3,100.84$ 13,083.60$
County of Pamlico 0 -$ 0.01423% 992.91$ 717.54$ 531.30$ 2,241.75$
Town of Alliance 0 -$ 0.00328% 229.20$ 165.63$ 122.64$ 517.47$
Town of Arapahoe 0 -$ 0.00330% 230.41$ 166.51$ 123.29$ 520.21$
Town of Bayboro 0 -$ 0.00957% 667.96$ 482.71$ 357.42$ 1,508.09$
Town of Grantsboro 0 -$ 0.00175% 122.45$ 88.49$ 65.52$ 276.46$
Town of Mesic 0 -$ 0.00078% 54.55$ 39.42$ 29.19$ 123.16$
Town of Minnesott Beach 0 -$ 0.00433% 302.30$ 218.46$ 161.76$ 682.52$
Town of Oriental 0 -$ 0.01461% 1,019.12$ 736.48$ 545.32$ 2,300.92$
Town of Stonewall 0 -$ 0.00044% 31.02$ 22.42$ 16.60$ 70.04$
Town of Vandemere 0 -$ 0.00093% 64.64$ 46.71$ 34.59$ 145.94$
County of Pasquotank 3 19,607.85$ 0.19664% 13,720.10$ 9,914.95$ 7,341.51$ 50,584.41$
City of Elizabeth City 0 -$ 0.17051% 11,896.90$ 8,597.40$ 6,365.93$ 26,860.23$
County of Pender 0 -$ 0.40964% 28,581.16$ 20,654.43$ 15,293.54$ 64,529.13$
Town of Atkinson 0 -$ 0.00163% 113.82$ 82.25$ 60.90$ 256.97$
Town of Burgaw 0 -$ 0.02932% 2,045.48$ 1,478.18$ 1,094.52$ 4,618.18$
Village of Saint Helena 0 -$ 0.00212% 147.84$ 106.84$ 79.11$ 333.79$
Town of Surf City 0 -$ 0.09748% 6,801.58$ 4,915.22$ 3,639.47$ 15,356.27$
Town of Topsail Beach 0 -$ 0.02701% 1,884.63$ 1,361.95$ 1,008.45$ 4,255.03$
Town of Watha 0 -$ 0.00156% 109.04$ 78.80$ 58.34$ 246.18$
County of Perquimans 0 -$ 0.02583% 1,802.52$ 1,302.61$ 964.51$ 4,069.64$
Town of Hertford 0 -$ 0.01912% 1,333.98$ 964.01$ 713.80$ 3,011.79$
Town of Winfall 0 -$ 0.00323% 225.52$ 162.97$ 120.67$ 509.16$
County of Person 0 -$ 0.08586% 5,990.71$ 4,329.24$ 3,205.58$ 13,525.53$
City of Roxboro 0 -$ 0.08884% 6,198.56$ 4,479.44$ 3,316.80$ 13,994.80$
County of Pitt 1 6,535.95$ 0.49683% 34,664.97$ 25,050.94$ 18,548.93$ 84,800.79$
Town of Ayden 0 -$ 0.04508% 3,144.99$ 2,272.76$ 1,682.86$ 7,100.61$
Town of Bethel 0 -$ 0.01251% 872.78$ 630.72$ 467.02$ 1,970.52$
Town of Falkland 0 -$ 0.00022% 15.46$ 11.17$ 8.27$ 34.90$
Town of Farmville 0 -$ 0.04166% 2,906.81$ 2,100.63$ 1,555.41$ 6,562.85$
Town of Fountain 0 -$ 0.00065% 45.69$ 33.02$ 24.45$ 103.16$
City of Greenville 2 13,071.90$ 1.11067% 77,493.58$ 56,001.42$ 41,466.16$ 188,033.06$
Town of Grifton 0 -$ 0.00630% 439.90$ 317.89$ 235.38$ 993.17$
Town of Grimesland 0 -$ 0.00381% 265.88$ 192.14$ 142.27$ 600.29$
Village of Simpson 0 -$ 0.00202% 140.60$ 101.61$ 75.23$ 317.44$
Town of Winterville 0 -$ 0.09286% 6,479.22$ 4,682.26$ 3,466.97$ 14,628.45$
Page 13 of 19

Prefix Local Government
# Of Certified
PEG Channels
Supplemental
PEG Channel
Support
Proportionate
Share of
Distribution
Sales Tax on Video
Programming
Sales Tax on Direct-
to-Home Satellite
Sales Tax on
Telecommunication
Service Total Distribution
County of Polk 0 -$ 0.03263% 2,276.38$ 1,645.05$ 1,218.07$ 5,139.50$
Town of Columbus 0 -$ 0.01106% 771.54$ 557.56$ 412.84$ 1,741.94$
City of Saluda 0 -$ 0.01584% 1,105.46$ 798.87$ 591.52$ 2,495.85$
Town of Tryon 0 -$ 0.02465% 1,719.71$ 1,242.76$ 920.20$ 3,882.67$
County of Randolph 0 -$ 0.47179% 32,918.10$ 23,788.56$ 17,614.20$ 74,320.86$
City of Archdale 0 -$ 0.14661% 10,229.44$ 7,392.39$ 5,473.69$ 23,095.52$
City of Asheboro 0 -$ 0.20038% 13,981.08$ 10,103.55$ 7,481.16$ 31,565.79$
Town of Franklinville 0 -$ 0.00347% 242.21$ 175.03$ 129.60$ 546.84$
Town of Liberty 0 -$ 0.01717% 1,198.12$ 865.83$ 641.10$ 2,705.05$
Town of Ramseur 0 -$ 0.01278% 892.00$ 644.61$ 477.30$ 2,013.91$
City of Randleman 0 -$ 0.03246% 2,265.00$ 1,636.82$ 1,211.98$ 5,113.80$
Town of Seagrove 0 -$ 0.00103% 72.05$ 52.07$ 38.56$ 162.68$
Town of Staley 0 -$ 0.00188% 131.36$ 94.93$ 70.29$ 296.58$
City of Trinity 0 -$ 0.05905% 4,119.77$ 2,977.19$ 2,204.45$ 9,301.41$
County of Richmond 2 13,071.90$ 0.20221% 14,108.45$ 10,195.59$ 7,549.31$ 44,925.25$
Town of Dobbins Heights 0 -$ 0.00593% 414.05$ 299.22$ 221.55$ 934.82$
Town of Ellerbe 0 -$ 0.00982% 685.41$ 495.32$ 366.76$ 1,547.49$
City of Hamlet 1 6,535.95$ 0.07235% 5,047.98$ 3,647.97$ 2,701.13$ 17,933.03$
Town of Hoffman 0 -$ 0.00362% 252.30$ 182.33$ 135.01$ 569.64$
Town of Norman 0 -$ 0.00000% -$ -$ -$ -$
City of Rockingham 1 6,535.95$ 0.10476% 7,309.16$ 5,282.03$ 3,911.07$ 23,038.21$
County of Robeson 1 6,535.95$ 0.22843% 15,937.77$ 11,517.57$ 8,528.16$ 42,519.45$
Town of Fairmont 0 -$ 0.01946% 1,357.67$ 981.13$ 726.48$ 3,065.28$
Town of Lumber Bridge 0 -$ 0.00130% 91.04$ 65.79$ 48.71$ 205.54$
City of Lumberton 0 -$ 0.20759% 14,484.25$ 10,467.17$ 7,750.40$ 32,701.82$
Town of Marietta 0 -$ 0.00079% 54.84$ 39.63$ 29.34$ 123.81$
Town of Maxton 0 -$ 0.01281% 893.50$ 645.70$ 478.11$ 2,017.31$
Town of McDonald 0 -$ 0.00049% 34.11$ 24.65$ 18.25$ 77.01$
Town of Orrum 0 -$ 0.00041% 28.69$ 20.74$ 15.35$ 64.78$
Town of Parkton 0 -$ 0.00545% 380.12$ 274.70$ 203.40$ 858.22$
Town of Pembroke 0 -$ 0.01483% 1,034.91$ 747.88$ 553.77$ 2,336.56$
Town of Proctorville 0 -$ 0.00051% 35.71$ 25.81$ 19.11$ 80.63$
Town of Raynham 0 -$ 0.00000% -$ -$ -$ -$
Town of Red Springs 0 -$ 0.03101% 2,163.91$ 1,563.77$ 1,157.89$ 4,885.57$
Town of Rennert 0 -$ 0.00000% -$ -$ -$ -$
Town of Rowland 0 -$ 0.00311% 216.99$ 156.81$ 116.11$ 489.91$
Town of Saint Pauls 0 -$ 0.00969% 676.23$ 488.68$ 361.84$ 1,526.75$
Page 14 of 19

Prefix Local Government
# Of Certified
PEG Channels
Supplemental
PEG Channel
Support
Proportionate
Share of
Distribution
Sales Tax on Video
Programming
Sales Tax on Direct-
to-Home Satellite
Sales Tax on
Telecommunication
Service Total Distribution
County of Rockingham 2 13,071.90$ 0.27701% 19,327.74$ 13,967.36$ 10,342.11$ 56,709.11$
City of Eden 0 -$ 0.16109% 11,239.50$ 8,122.32$ 6,014.16$ 25,375.98$
Town of Madison 0 -$ 0.02765% 1,929.16$ 1,394.13$ 1,032.28$ 4,355.57$
Town of Mayodan 0 -$ 0.02770% 1,932.46$ 1,396.51$ 1,034.04$ 4,363.01$
City of Reidsville 1 6,535.95$ 0.14296% 9,974.65$ 7,208.27$ 5,337.35$ 29,056.22$
Town of Stoneville 0 -$ 0.00622% 433.83$ 313.51$ 232.14$ 979.48$
Town of Wentworth 0 -$ 0.01242% 866.89$ 626.46$ 463.86$ 1,957.21$
County of Rowan 1 6,535.95$ 0.49985% 34,875.42$ 25,203.03$ 18,661.54$ 85,275.94$
Town of China Grove 0 -$ 0.03045% 2,124.27$ 1,535.12$ 1,136.68$ 4,796.07$
Town of Cleveland 0 -$ 0.00739% 515.49$ 372.52$ 275.83$ 1,163.84$
Town of East Spencer 0 -$ 0.00511% 356.87$ 257.90$ 190.96$ 805.73$
Town of Faith 0 -$ 0.01042% 726.90$ 525.30$ 388.96$ 1,641.16$
Town of Granite Quarry 0 -$ 0.03678% 2,566.43$ 1,854.65$ 1,373.27$ 5,794.35$
Town of Landis 0 -$ 0.01455% 1,015.31$ 733.72$ 543.28$ 2,292.31$
Town of Rockwell 0 -$ 0.02064% 1,440.30$ 1,040.85$ 770.69$ 3,251.84$
City of Salisbury 0 -$ 0.33288% 23,225.71$ 16,784.27$ 12,427.88$ 52,437.86$
Town of Spencer 0 -$ 0.01233% 860.19$ 621.62$ 460.28$ 1,942.09$
County of Rutherford 0 -$ 0.05272% 3,678.52$ 2,658.32$ 1,968.35$ 8,305.19$
Town of Bostic 0 -$ 0.00260% 181.73$ 131.33$ 97.24$ 410.30$
Town of Chimney Rock Village 0 -$ 0.00085% 59.39$ 42.92$ 31.78$ 134.09$
Town of Ellenboro 0 -$ 0.00208% 144.87$ 104.69$ 77.52$ 327.08$
Town of Forest City 0 -$ 0.05037% 3,514.33$ 2,539.66$ 1,880.49$ 7,934.48$
Town of Lake Lure 0 -$ 0.03641% 2,540.33$ 1,835.79$ 1,359.31$ 5,735.43$
Town of Ruth 0 -$ 0.00000% -$ -$ -$ -$
Town of Rutherfordton 0 -$ 0.04268% 2,978.15$ 2,152.19$ 1,593.58$ 6,723.92$
Town of Spindale 0 -$ 0.01341% 935.54$ 676.08$ 500.60$ 2,112.22$
County of Sampson 0 -$ 0.06557% 4,574.92$ 3,306.11$ 2,448.00$ 10,329.03$
Town of Autryville 0 -$ 0.00263% 183.22$ 132.40$ 98.04$ 413.66$
City of Clinton 0 -$ 0.05021% 3,503.52$ 2,531.85$ 1,874.70$ 7,910.07$
Town of Garland 0 -$ 0.00388% 271.04$ 195.87$ 145.03$ 611.94$
Town of Harrells 0 -$ 0.00092% 64.40$ 46.54$ 34.46$ 145.40$
Town of Newton Grove 0 -$ 0.00258% 179.82$ 129.95$ 96.22$ 405.99$
Town of Roseboro 0 -$ 0.00969% 675.79$ 488.37$ 361.61$ 1,525.77$
Town of Salemburg 0 -$ 0.00463% 322.79$ 233.27$ 172.72$ 728.78$
Town of Turkey 0 -$ 0.00104% 72.61$ 52.47$ 38.85$ 163.93$
County of Scotland 0 -$ 0.07509% 5,239.38$ 3,786.28$ 2,803.55$ 11,829.21$
Town of East Laurinburg 0 -$ 0.01239% 864.34$ 624.62$ 462.50$ 1,951.46$
Page 15 of 19

Prefix Local Government
# Of Certified
PEG Channels
Supplemental
PEG Channel
Support
Proportionate
Share of
Distribution
Sales Tax on Video
Programming
Sales Tax on Direct-
to-Home Satellite
Sales Tax on
Telecommunication
Service Total Distribution
Town of Gibson 0 -$ 0.00429% 299.02$ 216.09$ 160.00$ 675.11$
Town of Laurinburg 0 -$ 0.28923% 20,180.47$ 14,583.59$ 10,798.40$ 45,562.46$
Town of Wagram 0 -$ 0.00000% -$ -$ -$ -$
County of Stanly 1 6,535.95$ 0.16476% 11,495.57$ 8,307.37$ 6,151.18$ 32,490.07$
City of Albemarle 0 -$ 0.15509% 10,821.11$ 7,819.97$ 5,790.28$ 24,431.36$
Town of Badin 0 -$ 0.01157% 807.38$ 583.46$ 432.02$ 1,822.86$
City of Locust 0 -$ 0.02757% 1,923.54$ 1,390.06$ 1,029.27$ 4,342.87$
Village of Misenheimer 0 -$ 0.00000% -$ -$ -$ -$
Town of New London 0 -$ 0.00866% 604.16$ 436.60$ 323.28$ 1,364.04$
Town of Norwood 0 -$ 0.02702% 1,884.99$ 1,362.21$ 1,008.64$ 4,255.84$
Town of Oakboro 0 -$ 0.02156% 1,504.12$ 1,086.96$ 804.84$ 3,395.92$
Town of Red Cross 0 -$ 0.00359% 250.28$ 180.87$ 133.92$ 565.07$
Town of Richfield 0 -$ 0.00704% 491.26$ 355.01$ 262.87$ 1,109.14$
Town of Stanfield 0 -$ 0.01119% 780.83$ 564.27$ 417.81$ 1,762.91$
County of Stokes 0 -$ 0.14483% 10,104.83$ 7,302.35$ 5,407.01$ 22,814.19$
Town of Danbury 0 -$ 0.00171% 119.02$ 86.01$ 63.69$ 268.72$
City of King 0 -$ 0.05235% 3,652.85$ 2,639.76$ 1,954.61$ 8,247.22$
Town of Walnut Cove 0 -$ 0.01168% 814.84$ 588.85$ 436.01$ 1,839.70$
County of Surry 0 -$ 0.28857% 20,134.02$ 14,550.03$ 10,773.54$ 45,457.59$
Town of Dobson 0 -$ 0.01143% 797.74$ 576.50$ 426.87$ 1,801.11$
Town of Elkin 0 -$ 0.03398% 2,371.13$ 1,713.51$ 1,268.77$ 5,353.41$
City of Mount Airy 0 -$ 0.08516% 5,941.63$ 4,293.77$ 3,179.32$ 13,414.72$
Town of Pilot Mountain 0 -$ 0.00932% 650.21$ 469.88$ 347.92$ 1,468.01$
County of Swain 0 -$ 0.04468% 3,117.44$ 2,252.85$ 1,668.12$ 7,038.41$
Town of Bryson City 0 -$ 0.02549% 1,778.55$ 1,285.28$ 951.69$ 4,015.52$
County of Transylvania 0 -$ 0.15050% 10,500.53$ 7,588.30$ 5,618.75$ 23,707.58$
City of Brevard 0 -$ 0.06309% 4,402.15$ 3,181.25$ 2,355.55$ 9,938.95$
Town of Rosman 0 -$ 0.00359% 250.48$ 181.01$ 134.03$ 565.52$
County of Tyrrell 0 -$ 0.00067% 46.77$ 33.80$ 25.03$ 105.60$
Town of Columbia 0 -$ 0.02793% 1,948.84$ 1,408.34$ 1,042.81$ 4,399.99$
County of Union 1 6,535.95$ 0.66452% 46,364.91$ 33,506.02$ 24,809.47$ 111,216.35$
Town of Fairview 0 -$ 0.01134% 791.50$ 571.98$ 423.52$ 1,787.00$
Town of Hemby Bridge 0 -$ 0.02014% 1,405.18$ 1,015.47$ 751.90$ 3,172.55$
Town of Indian Trail 0 -$ 0.42371% 29,563.06$ 21,364.01$ 15,818.94$ 66,746.01$
Town of Lake Park 0 -$ 0.02768% 1,931.31$ 1,395.68$ 1,033.43$ 4,360.42$
Town of Marshville 0 -$ 0.01567% 1,093.01$ 789.87$ 584.86$ 2,467.74$
Town of Marvin 0 -$ 0.09924% 6,924.47$ 5,004.03$ 3,705.22$ 15,633.72$
Page 16 of 19

Prefix Local Government
# Of Certified
PEG Channels
Supplemental
PEG Channel
Support
Proportionate
Share of
Distribution
Sales Tax on Video
Programming
Sales Tax on Direct-
to-Home Satellite
Sales Tax on
Telecommunication
Service Total Distribution
Town of Mineral Springs 0 -$ 0.02907% 2,028.35$ 1,465.81$ 1,085.36$ 4,579.52$
City of Monroe 0 -$ 0.29625% 20,670.09$ 14,937.42$ 11,060.39$ 46,667.90$
Town of Stallings 0 -$ 0.24525% 17,111.63$ 12,365.87$ 9,156.29$ 38,633.79$
Town of Unionville 0 -$ 0.03945% 2,752.59$ 1,989.18$ 1,472.89$ 6,214.66$
Town of Waxhaw 0 -$ 0.27848% 19,430.36$ 14,041.52$ 10,397.02$ 43,868.90$
Town of Weddington 0 -$ 0.13525% 9,436.56$ 6,819.41$ 5,049.42$ 21,305.39$
Village of Wesley Chapel 0 -$ 0.13873% 9,679.55$ 6,995.01$ 5,179.45$ 21,854.01$
Town of Wingate 0 -$ 0.03078% 2,147.61$ 1,551.99$ 1,149.17$ 4,848.77$
County of Vance 0 -$ 0.17419% 12,153.89$ 8,783.12$ 6,503.45$ 27,440.46$
City of Henderson 0 -$ 0.14112% 9,846.37$ 7,115.56$ 5,268.71$ 22,230.64$
Town of Kittrell 0 -$ 0.00053% 36.94$ 26.70$ 19.77$ 83.41$
Town of Middleburg 0 -$ 0.00000% -$ -$ -$ -$
County of Wake 3 19,607.85$ 1.91387% 133,534.83$ 96,500.13$ 71,453.36$ 321,096.17$
Town of Apex 0 -$ 0.78411% 54,708.68$ 39,535.72$ 29,274.15$ 123,518.55$
Town of Cary 1 6,535.95$ 2.19660% 153,261.61$ 110,755.86$ 82,008.99$ 352,562.41$
Town of Fuquay-Varina 0 -$ 0.36952% 25,782.10$ 18,631.67$ 13,795.79$ 58,209.56$
Town of Garner 2 13,071.90$ 0.36498% 25,465.32$ 18,402.74$ 13,626.28$ 70,566.24$
Town of Holly Springs 1 6,535.95$ 0.42955% 29,970.43$ 21,658.40$ 16,036.92$ 74,201.70$
Town of Knightdale 2 13,071.90$ 0.17034% 11,885.05$ 8,588.83$ 6,359.59$ 39,905.37$
Town of Morrisville 0 -$ 0.84474% 58,939.18$ 42,592.92$ 31,537.86$ 133,069.96$
City of Raleigh 3 19,607.85$ 6.65933% 464,635.57$ 335,773.02$ 248,622.56$ 1,068,639.00$
Town of Rolesville 2 13,071.90$ 0.10347% 7,219.55$ 5,217.27$ 3,863.12$ 29,371.84$
Town of Wake Forest 1 6,535.95$ 0.55861% 38,975.32$ 28,165.86$ 20,855.36$ 94,532.49$
Town of Wendell 2 13,071.90$ 0.09724% 6,784.51$ 4,902.88$ 3,630.33$ 28,389.62$
Town of Zebulon 2 13,071.90$ 0.04131% 2,882.41$ 2,083.00$ 1,542.35$ 19,579.66$
County of Warren 0 -$ 0.01614% 1,126.34$ 813.96$ 602.70$ 2,543.00$
Town of Macon 0 -$ 0.00062% 43.36$ 31.33$ 23.20$ 97.89$
Town of Norlina 0 -$ 0.00648% 451.90$ 326.57$ 241.81$ 1,020.28$
Town of Warrenton 0 -$ 0.02020% 1,409.71$ 1,018.74$ 754.32$ 3,182.77$
County of Washington 0 -$ 0.01774% 1,237.64$ 894.39$ 662.25$ 2,794.28$
Town of Creswell 0 -$ 0.00117% 81.56$ 58.94$ 43.64$ 184.14$
Town of Plymouth 0 -$ 0.02294% 1,600.44$ 1,156.57$ 856.38$ 3,613.39$
Town of Roper 0 -$ 0.00722% 503.91$ 364.15$ 269.64$ 1,137.70$
County of Watauga 0 -$ 0.45949% 32,059.42$ 23,168.03$ 17,154.73$ 72,382.18$
Town of Beech Mountain 0 -$ 0.04262% 2,973.99$ 2,149.18$ 1,591.36$ 6,714.53$
Town of Blowing Rock 0 -$ 0.06065% 4,231.93$ 3,058.24$ 2,264.47$ 9,554.64$
Town of Boone 1 6,535.95$ 0.22221% 15,503.74$ 11,203.91$ 8,295.92$ 41,539.52$
Page 17 of 19
Prefix Local Government
# Of Certified
PEG Channels
Supplemental
PEG Channel
Support
Proportionate
Share of
Distribution
Sales Tax on Video
Programming
Sales Tax on Direct-
to-Home Satellite
Sales Tax on
Telecommunication
Service Total Distribution
Town of Seven Devils 0 -$ 0.02024% 1,412.09$ 1,020.46$ 755.59$ 3,188.14$
County of Wayne 1 6,535.95$ 0.64188% 44,785.52$ 32,364.66$ 23,964.35$ 107,650.48$
Town of Eureka 0 -$ 0.00085% 59.43$ 42.95$ 31.80$ 134.18$
Town of Fremont 0 -$ 0.00846% 590.27$ 426.56$ 315.85$ 1,332.68$
City of Goldsboro 1 6,535.95$ 0.31568% 22,025.33$ 15,916.80$ 11,785.57$ 56,263.65$
Town of Mount Olive 0 -$ 0.02740% 1,911.63$ 1,381.46$ 1,022.90$ 4,315.99$
Town of Pikeville 0 -$ 0.00794% 553.68$ 400.12$ 296.27$ 1,250.07$
Town of Seven Springs 0 -$ 0.00000% -$ -$ -$ -$
Town of Walnut Creek 0 -$ 0.00745% 519.61$ 375.50$ 278.04$ 1,173.15$
County of Wilkes 0 -$ 0.31326% 21,856.79$ 15,795.00$ 11,695.38$ 49,347.17$
Town of North Wilkesboro 0 -$ 0.05019% 3,501.52$ 2,530.41$ 1,873.64$ 7,905.57$
Town of Ronda 0 -$ 0.00661% 461.15$ 333.26$ 246.76$ 1,041.17$
Town of Wilkesboro 0 -$ 0.05309% 3,704.25$ 2,676.91$ 1,982.11$ 8,363.27$
County of Wilson 0 -$ 0.09664% 6,742.54$ 4,872.56$ 3,607.88$ 15,222.98$
Town of Black Creek 0 -$ 0.00729% 508.84$ 367.72$ 272.28$ 1,148.84$
Town of Elm City 0 -$ 0.00574% 400.76$ 289.62$ 214.45$ 904.83$
Town of Lucama 0 -$ 0.00605% 422.19$ 305.10$ 225.91$ 953.20$
Town of Saratoga 0 -$ 0.00188% 131.36$ 94.93$ 70.29$ 296.58$
Town of Sims 0 -$ 0.00331% 231.04$ 166.96$ 123.63$ 521.63$
Town of Stantonsburg 0 -$ 0.01493% 1,042.04$ 753.04$ 557.59$ 2,352.67$
City of Wilson 3 19,607.85$ 0.48691% 33,973.01$ 24,550.90$ 18,178.67$ 96,310.43$
County of Yadkin 0 -$ 0.10719% 7,478.89$ 5,404.69$ 4,001.89$ 16,885.47$
Town of Boonville 0 -$ 0.00891% 621.57$ 449.18$ 332.60$ 1,403.35$
Town of East Bend 0 -$ 0.00510% 355.57$ 256.95$ 190.26$ 802.78$
Town of Jonesville 0 -$ 0.02317% 1,616.41$ 1,168.11$ 864.93$ 3,649.45$
Town of Yadkinville 0 -$ 0.02324% 1,621.46$ 1,171.77$ 867.63$ 3,660.86$
County of Yancey 0 -$ 0.09827% 6,856.76$ 4,955.10$ 3,669.00$ 15,480.86$
Town of Burnsville 0 -$ 0.02203% 1,536.98$ 1,110.72$ 822.43$ 3,470.13$
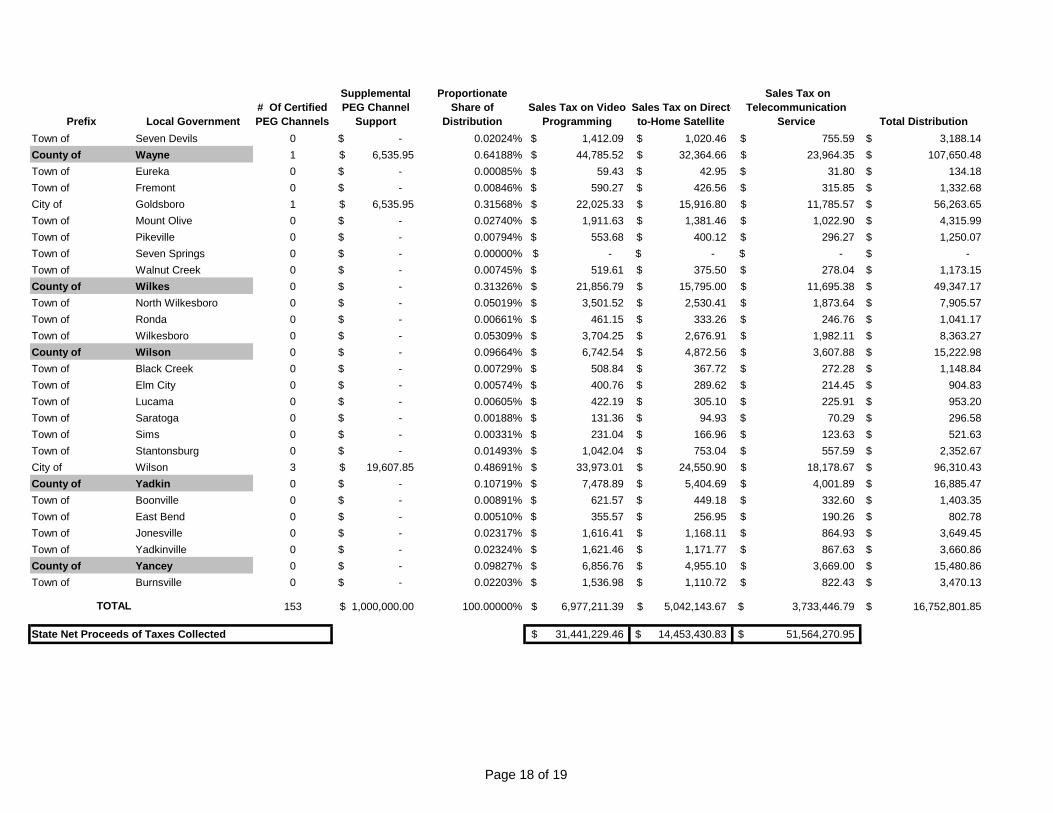
TOTAL 153 1,000,000.00$ 100.00000% 6,977,211.39$ 5,042,143.67$ 3,733,446.79$ 16,752,801.85$
State Net Proceeds of Taxes Collected 31,441,229.46$ 14,453,430.83$ 51,564,270.95$
Page 18 of 19

Prefix Local Government
# Of Certified
PEG Channels
Supplemental
PEG Channel
Support
Proportionate
Share of
Distribution
Sales Tax on Video
Programming
Sales Tax on Direct-
to-Home Satellite
Sales Tax on
Telecommunication
Service Total Distribution
Notes:
1) 7.70% of the net proceeds of the State Sales Tax on Telecommunication Services
2) 23.60% of the net proceeds of the State Sales Tax on Video Programming Services, other than on Direct‑to‑Home Satellite Service
3) 37.10% of the net proceeds of the State Sales Tax on Direct‑to‑Home Satellite Service
D) For questions concerning the breakdown of the amount distributed, please contact the Distribution Unit at (919) 814-1118.
A county's or city's proportionate share is based on its certified amount of revenue from cable franchise fees and PEG channel subscriber fees for the first six months of FY06-07 compared to the
statewide total of those revenues. The proportionate share for counties and cities that had no cable revenues during this time is based on an amount equal to $2 per capita [G.S. 105-164-44I(c)].
Proportional shares are adjusted each fiscal year by changes in certified populations estimated by the State Budget Officer [G.S. 105-164-44I(d)]. For the purposes of this distribution, the population of a
county is the population of its unincorporated areas plus the populations of any ineligible cities in the county [G.S. 105-164-44I(g)].
A) The share of each certified PEG channel that North Carolina counties and cities receive is one-fourth of the sum of $4,000,000 and the amount of any funds returned to the Secretary in the prior fiscal
divided by the number of certified PEG channels [G.S. 105-164-44I(b)]. A qualifying PEG channel is one that meets the programming requirements under G.S. 66-357(d). A county or city must certify to
the Secretary by July 15 of each year the qualifying PEG channels it operates. A county or city may not receive PEG channel support for more than three qualifying PEG channels. The money
distributed to a county or city for PEG channel support must be used by it for the operation and support of PEG channels. The term "PEG channel" means "A public, educational, or governmental
access channel provided to a county or city." [G.S. 66-350].
B) According to G.S. 105-164.44J(c), a county or city must use the supplemental PEG channel support funds distributed to it for the operation and support of each of the qualifying PEG channels it
certifies by allocating the amount it receives equally among each of the qualifying PEG channels. A county or city must distribute the supplemental PEG channel support funds to the PEG channel
operator of the qualifying PEG channel within 30 days of its receipt of the supplemental PEG channel support funds from the Department, or as specified in an inter-local agreement. If a qualifying PEG
channel has more than one PEG channel operator, the county or city must distribute the amount allocated for that PEG channel equally to each PEG channel operator, or as specified in an inter-local
agreement.
C) North Carolina counties and cities receive a quarterly distribution of their proportionate share of each of the following three taxes, minus $1,000,000 per quarter for Supplemental PEG
Channel Support, to replace local cable television franchise taxes repealed as of January 1, 2007 [G.S. 105-164.44F(a) and G.S. 105-164-44I(a), (b)]:
Page 19 of 19