page 1 · record cash recovery at ` 5993 crore vis -à-vis ` 5494 crore last ... performance of...
TRANSCRIPT

Page 1www.canarabank.com

Page 2www.canarabank.com
HIGHLIGHTS – MARCH’2015
Net profit at ` 2703 crore, up by 10.8% y.o.y.
Gross profit at ` 6950 crore, up by 2.3% y.o.y.
Total provisions at ` 4248 crore compared to ` 4358 crore in FY14
Non-interest income for FY15 at ` 4550 crore, up by 15.7% y-o-y.
ROAA for FY15 at 0.55%, up from 0.54% last year.
ROE for FY15 at 11.06%, up from 10.59% last year.
NIM (Domestic) at 2.36% and NIM (Global) at 2.25%.
Net profit for Q4 FY15 at ` 613 crore.
Gross profit for Q4 FY15 at ` 1733 crore.
Total Provisions for Q4FY15 at ` 1120 crore.
Non-interest income for Q4FY15 at `1326 crore, up by 23.9% y-o-y.
Major
HIghlights

Page 3www.canarabank.com
HIGHLIGHTS – MARCH’2015
Total Business at ` 8.04 lakh crore, up by 11.4% y.o.y.
Total Deposits at ` 4.74 lakh crore, up by 12.6% y-o-y.
Advances (net) at ` 3.30 lakh crore, up by 9.6% y-o-y.
Growth in retail business- Priority Credit (21%), Agriculture (21%),
MSME (21%), MSE (26%), Retail Lending (26%), Direct Housing Loans
(29%), Vehicle Loans (22%) and other personal loans (80%).
Mandatory norms complied under Priority Credit, Agriculture, MSE
(Accounts and Amount), Minority Communities, Weaker Section &
women beneficiaries.
Gross NPA Ratio at 3.89% from 2.49% as at March 2014.
Net NPA ratio at 2.65% from 1.98% as at March 2014.
Record Cash Recovery at ` 5993 crore vis-à-vis ` 5494 crore last
year.
Record increase in e-transactions to 50.21% from 43.84% last year.
930 branches and 2221 ATMs added, taking the total to 5682
branches and 8533 ATMs (the Highest ATM Network among
Nationalized Banks).
Major
Highlights

Page 4www.canarabank.com
PERFORMANCE HIGHLIGHTS- BUSINESS
ParametersMAR’14 JUNE’14 SEP’14 DEC’14 MAR’15
y.o.y
Growth(%)
Deposits 420723 428976 461193 462450 473840 12.6
Advances
(net)301067 302964 310860 312269 330036 9.6
Business 721790 731940 772053 774718 803876 11.4
C-D Ratio 71.56 70.62 67.40 67.52 69.65 --
`
Market share in deposits at 4.82%. Market share in Advances up by 6 bps to
4.54% over Mar 14.

Page 5www.canarabank.com
PERFORMANCE HIGHLIGHTS- OVERSEAS BUSINESS
Parameters MAR’ 14 MAR’15y.o.y
Growth %
Deposits 21870 29138 33.2
Advances 19224 22693 18.0
Total Business 41094 51831 26.1
Gross Profit 242 270 11.6
Overseas Business constitute 6.45% of the Global Business
`

Page 6www.canarabank.com
PERFORMANCE HIGHLIGHTS- PROFITABILITY-Q4FY15
Parameters Q4FY14 Q1FY15 Q2FY15 Q3FY15 Q4FY15y.o.y
Gr(%)
Total
Income 11610 11728 11915 12228 12429 7.1
Total
Expenses 9728 9933 10290 10431 10697 10.0
Operating
Profit 1882 1795 1626 1797 1733 -7.9
Net Profit 611 807 627 656 613 0.4
NIM (%)
Domestic 2.40 2.42 2.36 2.36 2.36 --
NIM (%)
Global 2.27 2.30 2.24 2.24 2.25 --
`

Page 7www.canarabank.com
PERFORMANCE HIGHLIGHTS- PROFITABILITY-FY15
Parameters Mar’13 Mar’14 Mar’15y.o.y
Growth(%)
Total Income 37231 43480 48300 11.1
Total Expenses 31341 36684 41350 12.7
Operating Profit 5890 6796 6950 2.3
Net Profit 2872 2438 2703 10.8
`

Page 8www.canarabank.com
PERFORMANCE HIGHLIGHTS- EXPANDING THE REACH
Particulars Mar’13 Mar’14 Mar’15 Y-o-Y incr.
Branch Network 3728 4755 5682 930*
ATM Strength 3526 6312 8533 2221
Debit Card (In Lakh) 95.53 151.30 254.71 103.41
5675 domestic
Branches
7 overseas branches
at Johannesburg,
New York, London,
Leicester, Shanghai,
Manama & Hong Kong
Population group No. of branches % to total
Rural 1804 32%
Semi-Urban 1756 31%
Rural + Semi-Urban 3560 63%
Urban 1111 19%
Metro 1004 18%
TOTAL Domestic 5675 100%
E-Lounges 132

Page 9www.canarabank.com

Page 10www.canarabank.com
SEGMENT WISE DEPOSITS
Parameters MAR’14 JUN’14 SEPT’14 DEC’14 MAR’15
y.o.y
Growth
(%)
Total Deposits 420723 428976 461193 462450 473840 12.6
Current 17744 16749 17743 18696 19846 11.8
Saving 85536 81594 86287 86322 93686 9.5
CASA 103279 98343 104030 105019 113532 9.9
CASA (%)Dom 25.76 24.15 23.71 24.05 25.47 --
Term Deposits 317443 330633 357163 357431 360308 13.5
PRDs + CDs64443 56458 69194 58873 50534 -21.6
% PRDs +CDs to
Total Deposits15.32 13.16 15.00 12.73 10.66 --
`
Note: PRDs – Preferential Rate Deposits. CDs- Certificate of Deposits

Page 11www.canarabank.com
LOANS & ADVANCES SEGMENT
Parameters MAR’14 JUN’14 SEP’14 DEC’14 MAR’15
y.o.y
Growth
(%)
Advances (Net) 301067 302964 310860 312269 330036 9.6
Total Priority 97762 103694 108748 112693 118234 20.9
Agriculture 48797 53956 54890 56474 58868 20.6
- Direct Agriculture 44268 45202 46705 47928 51437 16.2
- Indirect Agri 4529 8754 8185 8545 7431 64.1
Other Priority 13345 13718 14317 14735 15116 13.3
MSME 50040 49316 55011 56969 60604 21.1
MSE 36703 37186 41227 43408 46305 26.2
Retail Credit 33529 36197 38884 40172 42298 26.2
`

Page 12www.canarabank.com
ACHIEVEMENT UNDER MANDATED TARGETS – PRIORITY SECTOR
Achieved the mandated targets in respect of:
Total Priority (40.89% against 40% norm)
Agriculture (20.36% against 18% norm)
Direct agriculture (17.79% against 13.5% norm)
Credit to specified minority communities (19.26% against 15% norm)
Weaker Section (13.37% against 10% norm)
M&SE (26.16% y.o.y growth against 20% norm)
Number of Micro Enterprises accounts (33.22% growth against 10% norm)
Credit to women beneficiaries increased to 13.07% as against 5% norm.
Mandated
Targets
under
Priority
Sector

Page 13www.canarabank.com
Performance of Retail Advances
Type of Advances MAR’14 JUN’14 SEP’14 DEC’14 MAR’15y.o.y
Growth
Housing loans Direct 12822 13541 14391 15225 16480 28.5%
Vehicle loans 3099 3335 3490 3628 3770 21.6%
Education loans 4901 5046 5336 5492 5636 15.0%
Other Personal Loans 5845 7469 9785 10170 10540 80.3%
Retail Total 33529 36197 38884 40172 42298 26.1%
`

Page 14www.canarabank.com
EXPOSURE - INFRASTRUCTURE
Parameters MAR’14 JUN’14 SEP’14 DEC’14 MAR’15% Share
Total Adv
y.o.y
Growth
Roads 6980 7242 7517 7851 8195 2.48 17.4%
Ports 1092 1093 831 827 835 0.25 -23.5%
Airports 1827 1788 1688 1657 1364 0.41 -25.3%
Power
(Generation,
Transmission
& Distribution)
38294 42165 43539 45620 45154 13.68 17.9%
Telecom 6572 6628 5609 6678 6204 1.88 -5.6%
Other
Infrastructure 2983 2836 2902 3045 2961 0.90 -0.7%
Total
Infrastructure57748 61751 62086 65678 64713 19.61 12.1%
`

Page 15www.canarabank.com
Parameters MAR’14 JUN’14 SEP’14 DEC’14 MAR’15
% Share
Total
Adv
y.o.y
Growth
-Power
Generation 20003 21985 22707 23824 24459 7.41 22.3%
-Power
Transmission 2215 2166 2205 2126 1533 0.46 -30.8%
-Power
Distribution 16076 18014 18627 19670 19162 5.81 19.2%
Total Power 38294 42165 43539 45620 45154 13.68 17.9%
Of which SEBs 23002 25723 25941 27755 26864 8.14 16.8%
`
EXPOSURE - POWER SECTOR & AVIATION
Exposure to
Aviation 1761 2009 1935 1879 1872 0.57 6.3%

Page 16www.canarabank.com
MAR’14 JUN’14 SEP’14 DEC’14 MAR’15y.o.y
Growth (%)
EXPOSURE TO CAPITAL MARKET
Outstanding 2210 2365 2348 2458 2331 5.5
EXPOSURE TO NBFCs
Total 26163 25474 24589 23523 24241 -7.3
Out of above :
HFCs 8144 8367 7475 7212 7350 -9.7
Private 12163 11621 12151 11287 10781 -11.4
Public 5536 5176 4671 4758 5971 7.9
EXPOSURE TO COMMERCIAL REAL ESTATE
Outstanding 3483 3086 3561 3607 2824 -18.9
`
EXPOSURE TO OTHER SECTORS

Page 17www.canarabank.com

Page 18www.canarabank.com
PROFITABILITY- Q4 FY15
Parameters Q4 FY14 Q1 FY15 Q2 FY15 Q3 FY15 Q4 FY15
y.o.y
Growth
(%)
Total Income 11610 11728 11915 12228 12429 7.1
Total Expenses 9728 9933 10290 10431 10697 10.0
Operating Profit 1882 1795 1626 1797 1733 -7.9
Provisions 1271 988 999 1141 1120 -11.9
Net Profit 611 807 627 656 613 0.4
Net Int. Income 2535 2429 2368 2380 2486 -1.9
Non Int. Income 1070 1027 1021 1176 1326 23.9
`

Page 19www.canarabank.com
PROFITABILITY – FY15
Parameters Mar’13 Mar’14 Mar’15y.o.y
Growth (%)
Total Income 37231 43480 48300 11.1
Total Expenses 31341 36684 41350 12.7
Operating Profit 5890 6796 6950 2.3
Provisions 3018 4358 4248 -2.5
Net Profit 2872 2438 2703 10.8
Net Int. Income 7879 8944 9664 8.0
Non Int. Income 3153 3933 4550 15.7
`

Page 20www.canarabank.com
BREAK-UP : INCOME – Q4 FY15
Parameters Q4 FY14 Q1FY15 Q2 FY15 Q3 FY15 Q4 FY15
y.o.y
Growth
(%)
Interest on Advances 7683 7905 8005 8064 8093 5.3
Interest on Investments 2598 2625 2681 2792 2826 8.8
Other Interest Income 259 171 208 196 185 -28.7
Total Interest Income 10540 10701 10894 11052 11103 5.4
Non - Interest Income 1070 1027 1021 1176 1326 23.9
Total Income 11610 11728 11915 12228 12429 7.1
`

Page 21www.canarabank.com
BREAK-UP : INCOME – FY15
Parameters Mar’13 Mar’14 Mar’15y.o.y
Growth (%)
Interest on Advances 24380 28458 32066 12.7
Interest on Investments 9112 10251 10924 6.6
Other Interest Income 586 839 760 -9.4
Total Interest Income 34078 39548 43750 10.6
Non – Interest Income 3153 3933 4550 15.7
Total Income 37231 43480 48300 11.1
`
Page 22www.canarabank.com
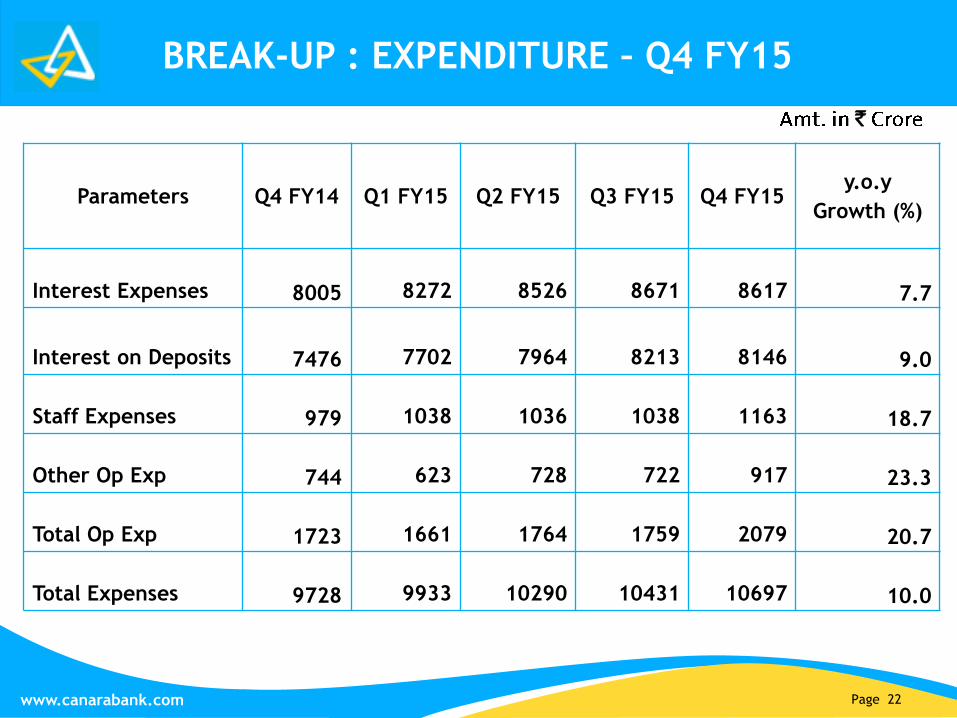
BREAK-UP : EXPENDITURE – Q4 FY15
`
Parameters Q4 FY14 Q1 FY15 Q2 FY15 Q3 FY15 Q4 FY15y.o.y
Growth (%)
Interest Expenses 8005 8272 8526 8671 8617 7.7
Interest on Deposits 7476 7702 7964 8213 8146 9.0
Staff Expenses 979 1038 1036 1038 1163 18.7
Other Op Exp 744 623 728 722 917 23.3
Total Op Exp 1723 1661 1764 1759 2079 20.7
Total Expenses 9728 9933 10290 10431 10697 10.0

Page 23www.canarabank.com
BREAK-UP : EXPENDITURE – FY15
Parameters Mar’13 Mar’14 Mar’15
y.o.y
Growth (%)
Interest Expenses 26199 30603 34086 11.4
Interest on Deposits 25250 28658 32026 11.7
Staff Expenses 3254 3672 4274 16.4
Other Op Exp 1888 2409 2989 24.1
Total Op Exp 5142 6081 7264 19.5
Total Expenses 31341 36684 41350 12.7
`

Page 24www.canarabank.com
BREAK-UP: NON-INTEREST INCOME
Parameters Q4FY14 Q1FY15 Q2FY15 Q3FY15 Q4FY15y.o.y
Growth(%)
Com & Exchange 284 209 224 226 269 -5.3
-Of which Bancassurance 21 11 17 20 11 -47.6
Profit from Exch. Transactions 226 263 206 251 61 -73.0
Rent – Lockers 2 66 4 2 3 50.0
Dividend Income 19 7 22 32 21 10.5
Recovery in W/Off A/cs 111 118 90 93 80 -27.9
Service Charges & Oth. MscIncome 353 168 331 271 383 8.5
Total (Excluding Treasury
Trading Profit) 995 832 877 875 817 -17.8
Trading Profit 75 91 144 301 509 579.0
Total (Including Treasury
Trading Profit) 1070 1027 1021 1176 1326 23.9
`
23.9% y-o-y increase in Non –Interest Income

Page 25www.canarabank.com
BREAK-UP: NON-INTEREST INCOME- FY15
Parameters Mar’13 Mar’14 Mar’15
y.o.y
Growth
(%)
Com & Exchange 798 940 929 -1.2
-Of which Bancassurance 43 47 58 23.4
Profit from Exch. Transactions 464 670 782 16.6
Rent – Lockers 59 67 75 11.9
Dividend Income 57 70 81 15.7
Recovery in W/Off A/cs 301 425 381 -10.3
Service Charges & Oth. Msc Inc 798 1097 1096 --
Total (Excluding Treasury Trading Profit) 2477 3269 3402 4.1
Trading Profit 676 664 1148 72.9
Total (Including Treasury Trading Profit) 3153 3933 4550 15.7
`
15.7% y-o-y increase in Non –Interest Income.

Page 26www.canarabank.com
BREAK-UP : PROVISIONS- Q4FY15
Provisions for Q4 FY14 Q1 FY15 Q2 FY15 Q3 FY15 Q4 FY15
NPAs 802 1125 912 952 782
Standard Assets 1121 - - 81 73
Provisions on
Investments362 (416) (22) (236) 16
Tax 180 200 185 300 110
Restructured &
Others(16) 79 (76) 44 139
Total Provision
&Contingency1271 988 999 1141 1120
`
Page 27www.canarabank.com
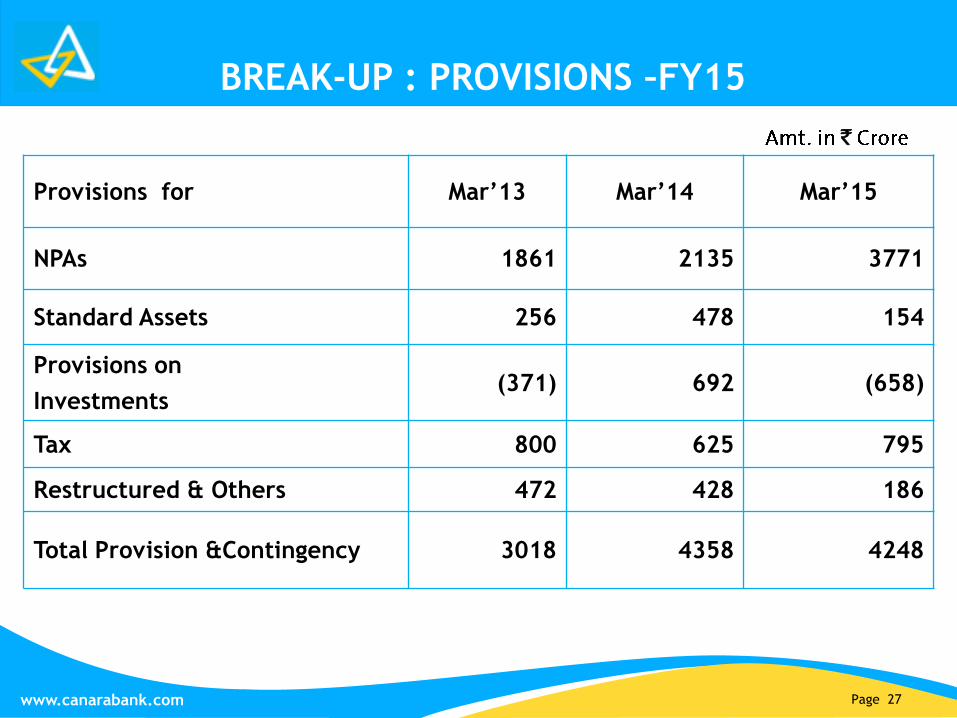
BREAK-UP : PROVISIONS –FY15
Provisions for Mar’13 Mar’14 Mar’15
NPAs 1861 2135 3771
Standard Assets 256 478 154
Provisions on
Investments(371) 692 (658)
Tax 800 625 795
Restructured & Others 472 428 186
Total Provision &Contingency 3018 4358 4248
`

Page 28www.canarabank.com
EARNINGS PROFILE
Parameters Q4FY14 Q1FY15 Q2FY15 Q3FY15 Q4Y15
NIM – Domestic 2.40 2.42 2.36 2.36 2.36
NIM – Global 2.27 2.30 2.24 2.24 2.25
ROAA 0.54 0.66 0.51 0.53 0.50
EPS (`)(not Annualized) 13.65 17.49 13.59 14.22 13.29
ROE (Annualized) 10.59 13.47 11.78 11.27 11.06
Cost-Income Ratio (Cumulative) 47.22 48.06 50.03 49.84 49.67

Page 29www.canarabank.com
COST AND YIELD TRENDS
Mar’14 Jun’14 Sep’14 Dec’14 Mar’15
Cost of Deposits 7.42 7.44 7.40 7.40 7.38
Cost of Funds 6.80 6.80 6.82 6.83 6.84
Yield on Advances 10.54 10.69 10.69 10.76 10.75
Yield on Funds 8.79 8.80 8.77 8.75 8.78
Yield on Investments 8.03 8.05 8.04 8.02 8.00
(In

Page 30www.canarabank.com
Investment Classification
Parameters Mar’13
% Share
in Total
Portfolio
Mar’14
% Share
in Total
Portfolio
Mar’15
% Share
in Total
Portfolio
SLR 102003 85% 108095 85% 122508 85%
Non SLR 18700 15% 18758 15% 22084 15%
Total (Domestic) 120703 100% 126853 100% 144592 100%
Held For Trading 741 1% 157 0.1% 947 0.7%
Available For
Sale 47105 39% 41351 32% 41181 28.3%
Held To Maturity 72699 60% 85320 67% 103217 71.0%
M.DURATION 4.73 yrs -- 4.63yrs -- 4.37yrs --
Total (Global) 121133 100% 126828 100% 145346 100%
`

Page 31www.canarabank.com

Page 32www.canarabank.com
ASSET QUALITY
PARTICULARS Mar’14 June’14 Sep’14 Dec’14 Mar’15
Gross NPA 7570 8160 9164 10574 13040
Gross NPA Ratio (%) 2.49 2.67 2.92 3.35 3.89
Net NPA 5965 6150 7170 7556 8740
Net NPA Ratio (%) 1.98 2.03 2.31 2.42 2.65
Cash Recovery (cumulative) 5494 2019 3213 4427 5993
Cash Recovery of ` 1566 crore during the Q4 FY15
`

Page 33www.canarabank.com
GROSS NPA MOVEMENT
PARTICULARS Mar’14 June’14 Sep’14 Dec’14 Mar’15
Opening Gross NPA (` Crore) 6260 7570 7570 7570 7570
Additions 8443 2595 5773 8065 10870
Sub Total 14703 10165 13343 15635 18440
Less: Reduction (a+b+c+d)) 7134 2005 4179 5061 5400
a) Write Off (Including Addn Prudential Write-
off) 1591 800 1854 1874 1473
b) Upgradation 2853 535 1197 1574 2031
c) Recovery for movement (excluding recovery
in w/o a/c and unapplied interest) 2689 670 1128 1613 1896
Gross NPA - Closing Balance 7570 8160 9164 10574 13040
Gross Advances 303431 305723 313431 315856 334947
Gross NPA % 2.49 2.67 2.92 3.35 3.89
Net NPA 5965 6150 7170 7556 8740
Net NPA % 1.98 2.03 2.31 2.42 2.65
Total Cash Recovery (incl.rec. in Wr.-off a/cs,
recovery in Current Year slippage & U/A interest)5494 2019 3213 4427 5993
`

Page 34www.canarabank.com
NPA COMPOSITION
Parameters MAR’14 JUN’14 SEPT’14 DEC’14 MAR’15
Gross Advances 303431 305723 313431 315856 334947
Sub-Standard 3436 4167 5416 6055 7076
Doubtful 4134 3993 3748 4518 5964
Loss NIL NIL NIL NIL NIL
Provision Coverage
Ratio(%) 60.11 60.10 58.68 59.44 57.29
`

Page 35www.canarabank.com
SECTORQ4
FY14
Q1
FY15
Q2
FY15
Q3
FY15
Q4
FY15
% to total Slippages
Micro & Small Ent. 38 631 970 627 496 17.68
Agriculture 719 390 373 316 266 9.48
Other Priority Sector 74 184 200 156 89 3.17
Total Priority Sector 831 1205 1543 1099 850 30.30
Medium Industries 73 174 391 16 138 4.92
Large Industries 920 767 1071 962 1361 48.52
Other Non-Priority 221 398 171 212 122 4.35
Total Non-Priority 1214 1338 1633 1190 1621 57.79
Total (Domestic) 2046 2544 3176 2289 2471 88.09
Overseas 88 51 2 3 334 11.91
Total (Global) 2134 2595 3178 2292 2805 100.00
SECTOR-WISE NPA SLIPPAGES
`

Page 36www.canarabank.com
SECTOR- WISE NPA OUTSTANDING
SECTOR Mar’14 Jun’14 Sep’14 Dec’14 Mar’15
Micro & Small Enterprises 1727 1959 2401 2715 3048
Agriculture 979 1179 1189 1330 1410
Other Priority Segments 250 358 402 435 380
Medium Enterprises 389 441 727 825 829
Large Industries 3279 3067 3386 4087 5815
Other Non-Priority Segments 946 1155 1059 1182 1558
Total 7570 8160 9164 10574 13040
`

Page 37www.canarabank.com
Particulars Mar’14 Jun’14 Sep’14 Dec’14 Mar’15
Gross Advances 303431 305723 313431 315856 334947
Gross NPA 7570 8160 9164 10574 13040
Gross NPA % 2.49 2.67 2.92 3.35 3.89
Priority Sector Advances 97762 103694 108748 112693 118234
PS as % to Gross Advances 32.20 33.92 34.69 35.68 35.30
Total PS NPA 2956 3496 3992 4480 4838
Total PS NPA% 3.02 3.37 3.67 3.98 4.09
Share of PS NPA to Gross NPA 39.05 42.84 43.56 42.37 37.10
Agriculture NPA 979 1179 1189 1330 1410
Agriculture NPA% 2.01 2.18 2.17 2.36 2.40
MSE NPA 1727 1959 2401 2715 3048
MSE NPA % 4.71 5.44 6.07 6.54 6.89
Other Priority NPA 250 358 402 435 380
Other Priority NPA % 1.87 2.61 2.81 2.95 2.51
`

Page 38www.canarabank.com
RESTRUCTURED ASSETS
`
Particulars
Total
Restructured
Of Which
Standard NPAs
No. Of
A/C sAmount No. Of
A/C sAmount No. Of
A/C sAmount
Total cumulative outstanding liability as
at 31.03.2014
26090 23205 19860 20248 6230 2957
A/C Restructured in FY 2014-15 Q1,
June’14
1399 1358 1340 879 59 479
Total Restructured O/S 30/06/2014 25600 24000 18701 20901 6899 3099
A/C Restructured in FY 2014-15 Q2, Sep’14 8900 930 8694 819 206 111
Total Restructured O/S 30/09/2014 30810 24557 23648 20392 7162 4165
A/C Restructured in FY 2014-15 Q3,
Dec’14
13145 1095 12958 1025 187 70
Total Restructured O/S 31.12.2014 39588 25400 32350 20675 7238 4725
A/C Restructured in FY 2014-15 Q4, Mar’15 13754 3438 13573 3407 181 31
Total Restructured O/S 31.03.2015 44724 28371 37612 22621 7112 5750

Page 39www.canarabank.com
RESTRUCTURED ASSETS UNDER CDR
POSITION AS ON A/C Amount
MARCH-2014 96 10446
JUNE- 2014 94 9224
SEPTEMBER-2014 85 9261
DECEMBER-2014 77 9956
MARCH-2015 86 10490
`

Page 40www.canarabank.com
SECTOR WISE RESTRUCTURED ACCOUNTS
Name of the Sector As on 31st Mar 2015Details of restructured Accounts No. of a/cs Amnt % to cumulative Outstanding Amt.
INFRASTRUCTURE(a+b+c+d+e+f+g+h) 136 13319 50.47Of Which Power
POWER (a+b+c+d) 69 10041 35.39
State DISCOMS (a) 27 6476 22.83
State Transmission (b) -- -- --
State Generation (c) -- -- --
Private (d) 42 3565 12.41Of Which ROADS (e) 48 2077 7.32Of Which PORTS (f) 5 281 0.99Of Which AVIATION (g) 3 1035 3.65Of Which TELECOMMUNICATION(h) 11 885 3.12MINING 27 18 0.06IRON AND STEEL 146 3307 11.66TEXTILE 731 1955 6.89ENGINEERING 381 947 3.34PHARMACEUTICAL 41 356 1.26CEMENT 18 351 1.24HARDWARE 18 79 0.28SHIPPING 8 13 0.04EDIBLE OIL 14 43 0.15AGRICULTURE 13316 470 1.66EDUCATION 10808 230 0.80HOUSING 5187 295 1.04CHEMICAL 37 44 0.16CONSTRUCTION 162 3051 10.75OTHER INDUSTRIES 594 1531 5.40OTHER SERVICES 13100 1362 4.80
TOTAL 44724 28371 100.00

Page 41www.canarabank.com
AMOUNT RESTRUCTURED DURING Q4 FY15
No. of Accounts Amount
Agriculture 3933 108
MSME 3949 326
Housing 4311 137
Large Advances 65 2835
Others 1496 32
Total 13754 3438
`

Page 42www.canarabank.com
SECTOR WISE RESTRUCTURED ADVANCES OUTSTANDING AS AT MAR 2015
No. of Accounts Amount
Agriculture 13316 470
MSME 11518 1509
Housing 15995 525
Large Advances 605 25470
Others 3290 397
Total 44724 28371
`

Page 43www.canarabank.com
CAPITAL ADEQUACY – NEW BASEL III NORMS
CRAR of 10.56% at MAR 2015 Vs. 9% norm
CET ratio at 7.37% vs. 5.5% norm
Tier I ratio at 8.02% vs. 7% norm
Tier II ratio at 2.54%
Paid-up Capital at ` 475.20 crore
Sufficient headroom available for raising further capital

Page 44www.canarabank.com
CAPITAL ADEQUACY – BASEL III
BASEL III
Particulars Mar’14 JUN’14 SEPT’14 DEC’14 Mar’15
Risk-weighted Assets
312226 321819 322093 330813 342248
Tier I Capital 23991 23803 23859 23932 27459
Tier I Ratio%CET: 7.41%
AT I: 0.27%
Tier I:7.68%
CET: 7.12%
AT I: 0.27%
Tier I:7.39%
CET: 7.13%
AT I: 0.28%
Tier I:7.41%
CET: 6.97%
AT I: 0.26%
Tier I:7.23%
CET: 7.37%
AT I: 0.65%
Tier I:8.02%
Tier II Capital 9205 9133 8959 8722 8678
Tier II Ratio% 2.95 2.84 2.78 2.64 2.54
Total Capital 33196 32936 32819 32654 36137
CRAR% 10.63 10.23 10.19 9.87 10.56
`

Page 45www.canarabank.com
SHAREHOLDING PATTERN
Govt. 69.91
FIIs 10.58
Indian
Financial Inst8.36
Mutual Funds 4.86
Resident
Individuals4.84
Others 1.45

Page 46www.canarabank.com
Pradhan Mantri Jan - Dhan Yojana(PMJDY)
`

Page 47www.canarabank.com
Financial Inclusion (FI)
``
``
`

Page 48www.canarabank.com
IMPORTANT CUSTOMER-FRIENDLY TECHNOLOGY INITIATIVES

Page 49www.canarabank.com
IMPORTANT CUSTOMER-FRIENDLY TECHNOLOGY INITIATIVES

Page 50www.canarabank.com
EXPANDED CLIENTELE BASE
Mar’13 Mar’14 Mar’15Y-o-Y
Increase
Y-o-Y
Growth (%)
Clientele Base 470 555 657 102 18.38%
No. of Deposit A/cs 417 489 585 96 19.63%
No. of Borrowal A/cs 53 66 72 6 9.09%
Over 1 Crore Clientele added during the year.

Page 51www.canarabank.com
MAJOR AWARDS/ACCOLADES IN Q3FY15
o
o
o
o
o

Page 52www.canarabank.com
MAJOR AWARDS/ACCOLADES IN Q4FY15

Page 53www.canarabank.com
GOALS – MAR’16
Retail deposits
Retail credit
Fee income
Containing NPA
Improving operational financial ratios- NIM,
RoA, RoE and Cost-to-Income.

Page 54www.canarabank.com