page | 1 solar car
TRANSCRIPT
P a g e | 1
SOLAR CAR
Submitted to
Dr. Mosaddequr Rahman
Submitted by
Tarik M. Abdullah Khan (09221020)
Srea Rahman (09210005)
Monzurul Karim Afgani (09221022)
Khairul Eahsun Fahim (10121069)
Department of Electrical and Electronics Engineering
BRAC University, Dhaka, Bangladesh
P a g e | 2
Declaration We hereby declare that this thesis titled “Solar Car” and the work presented in it and
submitted to the Department of Electrical and Electronics Engineering of BRAC
University is our own and has been generated by us as the result of our own original
research. It was not submitted elsewhere for the award of any other degree or any other
publication.
Date:
Supervisor
__________________________________
DrMdMosaddequrRahman Tarik M. Abdullah Khan
Student ID: 09221020
Srea Rahman Student ID: 09210005
Khairul Ehsun Fahim
Student ID: 10121069
Monzurul Karim Afgani
Student ID: 09221022
P a g e | 3
Acknowledgement
We would like to express the deepest and most sincere appreciation to our thesis
supervisor Dr. Mosaddequr Rahman, Associate Professor of EEE department, BRAC
University for his non-stop guidance, stimulating suggestions and encouragement
throughout the course of this work. Without his supervision and constant help this
dissertation would not have been possible. We would also like to express our sincere
thanks to Dr. Khalilur Rahman, Associate Professor of CSE department for his helpful
suggestions and invaluable guidance throughout the mechanical construction of the solar
car.

P a g e | 4
Abstract
One of the front runners in the area of renewable energy resources today is
solar power. Photovoltaic cells are used to convert solar energy in to useful
electrical energy. The objective of this paper is to construct an efficient solar
car, for the daily office commuters of Dhaka city so that they can travel a
fixed distance that they need to commute everyday on a reliable and
economical car that essentially runs on free renewable solar energy. All
calculations would be made bearing in mind the maximum distance travelled
by Dhaka office commuter i.e. from Uttara to Motijheel since overcoming this
distance would be the primary objective of the solar car to be built. The paper
illustrates how the charge generated by an array of solar panels is received
and its flow in and out of a battery pack is to be controlled using a
microcontroller based charge controller to ensure efficient storing of charge in
a battery pack. The stored energy would be divulged to a DC motor which
would run the car. The design of a motor controller to control the car’s speed
and forward/reverse direction of motion is shown. The mechanical
construction from scratch of the chassis along with all necessary mechanical
systems is illustrated. Finally the wiring of the electrical system onto the
mechanical body is demonstrated.
P a g e | 5
Table of Contents 1. INTRODUCTION .................................................................................................................................... 9
1.1 MOTIVATION ......................................................................................................................................10
1.1.1 POLLUTION ...............................................................................................................................10
1.1.2 GLOBAL WARMING ..................................................................................................................10
1.1.3 FUEL PRICES ............................................................................................................................12
1.2 PROJECT OBJECTIVE ................................................................................................... 13
1.3 PROJECT OVERVIEW ................................................................................................... 14
1.3.1 SOLAR PANEL ...........................................................................................................................14
1.3.2 BATTERIES.................................................................................................................................15
1.3.3 CHARGE CONTROLLER ...........................................................................................................15
1.3.4 PLUG-IN CHARGING ................................................................................................................15
1.3.5 MOTOR AND MOTOR CONTROLLER .....................................................................................16
1.3.6 STEERING, SUSPENSION, BRAKES, WHEELS .......................................................................16
1.4 SCOPE OF THE PROJECT ............................................................................................. 17
2. ELECTRIC VEHICLE RATING CALCULATIONS .........................................................................18
2.1 INTRODUCTION ............................................................................................................. 18
2.2 MOTOR POWER RATING ............................................................................................. 18
2.2.1 THE ROLLING RESISTANCE ....................................................................................................19
2.2.2 AERODYNAMIC DRAG FORCE ...............................................................................................20
2.2.3 FORCE OF ACCELERATION ....................................................................................................21
2.3 BATTERY CAPACITY: ................................................................................................... 23
2.4 PANEL WATTAGE: ......................................................................................................... 26
2.5 CONCLUSION .................................................................................................................. 27
3. SOLAR PANEL TEST ............................................................................................................................28
3.1 INTRODUCTION ............................................................................................................. 28
3.2 HOW SOLAR PANELS WORK ...................................................................................... 29
P a g e | 6
3.3 TYPES OF SOLAR PANELS ........................................................................................... 29
3.3.1 MONOCRYSTALLINE SILICON ................................................................................................30
3.3.2 POLYCRYSTALLINE SILICON ..................................................................................................30
3.3.3 THIN FILM AMORPHOUS MODULES.....................................................................................30
3.4 BATTERY TESTING ....................................................................................................... 32
3.5 CONCLUSION .................................................................................................................. 35
4. BATTERY: ..............................................................................................................................................36
4.1 STAGES OF THE BATTERY .......................................................................................... 37
4.1.1 STAGE 1: BULK CHARGE: .......................................................................................................37
4.1.2 STAGE 2: ABSORPTION CHARGE: ..........................................................................................37
4.1.3 STAGE 3: FLOAT CHARGE: .....................................................................................................37
4.2 BATTERY STATE OF CHARGE AND SET POINTS: ................................................. 38
4.2.1 VOLTAGE AND BATTERY: .......................................................................................................38
4.2.2 CURRENT AND BATTERY: .......................................................................................................44
4.2.3 TEMPARATURE AND BATTERY: .............................................................................................46
5. CHARGE CONTROLLER: ...................................................................................................................47
5.1 PULSE WIDTH MODULATION (PWM): ..................................................................... 49
5.2 CHARGE CONTROLLER SET POINTS: ..................................................................... 50
5.2.1 HIGH VOLTAGE DISCONNECTS (HVD): ................................................................................51
5.2.2 ARRAY RECONNECT VOLTAGE (ARV): ..................................................................................51
5.2.3 VOLTAGE REGULATION HYSTERESIS (VRH)........................................................................52
5.2.4 LOW VOLTAGE DISCONNECTS (LVD): ..................................................................................52
5.2.5 LOAD RECONNECT VOLTAGE (LRV): ....................................................................................52
5.2.6 LOW VOLTAGE LOAD DISCONNECTS HYSTERESIS (LVLH): .............................................53
5.3 CHARGE CONTROLLER PARAMETERS .................................................................. 54
5.4 PROTEUS ISIS IMPLEMENTATION: ........................................................................ 55
5.4.1 VOLTAGE INPUT TO MICROCONTROLLER: .........................................................................55
P a g e | 7
5.4.2 CIRCUIT TO CONTROL STAGES OF CHARGING: ................................................................57
5.4.3 LOAD DISCONNECT/RECONNECT CIRCUIT AT LVD/LVR: .................................................58
5.4.4 OVER-VOLTAGE PROTECTION: ...........................................................................................59
5.5 TOTAL CIRCUIT LAYOUT: ........................................................................................ 60
6. MOTOR ...................................................................................................................................................61
6.1 MOTOR SPECIFICATIONS ...............................................................................................................61
6.2 MOTOR WORKING MECHANISM .............................................................................. 62
6.3 SPEED CONTROL: .......................................................................................................... 64
6.4 FORWARD/REVERSE DIRECTION CONTROL ....................................................... 65
7. POWER SUPPLY AND VARIAC: ........................................................................................................67
7.1 INTRODUCTION: ............................................................................................................ 67
7.2 AC TO DC RECTIFICATION ......................................................................................... 67
8. SOLAR CAR ELECTRICAL WIRING SYSTEM: .............................................................................70
8.1HIGH-VOLTAGE, HIGH-CURRENT POWER SYSTEM: .......................................... 71
8.2 MOTOR CONTROLLER: ............................................................................................... 71
8.3 MAIN CONTACTER:....................................................................................................... 71
8.4 MAIN CIRCUIT BREAKER AND SAFETY FUSE: ..................................................... 72
8.5 GEAR BOX: ....................................................................................................................... 72
8.6 SHUNTS: ............................................................................................................................ 72
8.7 LOW VOLTAGE LOW CURRENT INSTRUMENTATION SYSTEM: ......................................... 73
9. DESIGNING THE CHASSIS AND MECHANICAL SYSTEM INSTALLAION ............................74
9.1 INTRODUCTION: ............................................................................................................ 74
9.2 MATERIALS: .................................................................................................................... 75
9.2.1 DESCRIPTION OF THE MS BOX: ............................................................................................75
9.2.2 DIMENSION OF THE MATERIAL: ...........................................................................................75
9.3 MECHANICAL PROGRESS: ......................................................................................... 76
9.3.1 SUSPENSION SYSTEM: .............................................................................................................78

P a g e | 8
9.3.2 SUSPENSION SYSTEM INSTALLATION: .................................................................................81
9.3.3 STEERING SYSTEM INSTALLATION: ......................................................................................82
9.3.4 BRAKING SYSTEM: ...................................................................................................................84
9.3.5 INSTALLATION OF BRAKING SYSTEM: .................................................................................85
9.4 AERODYANAMIC SHAPING: ....................................................................................... 87
9.4.2 USING FRONT SPLITTER/AIR DRUM: ....................................................................................88
9.4.3 USING DRAG REDUCTION SYSTEM: .....................................................................................88
9.4.4 ADDING REAR SPOILERS: .......................................................................................................89
9.5 CONCLUSION: ................................................................................................................. 90
10. CONCLUSION AND FUTURE DIRECTIONS .................................................................................92
REFERENCES ............................................................................................................................................93
APPENDIX ..................................................................................................................................................94

P a g e | 9
1. INTRODUCTION
The quests for a constant, safe, clean, environmental-friendly fuel is never-ending.
Carbon-based fuels, such as fossil fuels are unsustainable and hazardous to our
environment. Some of the alternatives are renewable energy sources which include all
fuel types and energy carriers, different from the fossil ones, such as the sun, wind, tides,
hydropower and biomass. Amongst these elements, solar energy is preferred since it
could provide the cleanest sustainable energy for the longest duration of time – the next
few billion years. Photovoltaic production becomes double every two years, increasing
by an average of 48 percent each year since 2002. Due to its innumerable benefits in
environmental, economic and social aspects PV systems have becomes the world’s fastest
growing energy technology. It can arguably be said that the only limitation to solar power
as an energy source is our understanding of developing efficient and cost effective
technology which can implement it.
Nothing on earth is free of cost, but what if we could find a way to implement free rides?
Indeed it would be wonderful if our cars could continue to run without us having to spend
billions on fossil fuels every year and to deal with natural hazards that their combustion
leave behind. If we could drive a solar-powered car, that auto dream would come true.
Solar cars would harness energy from the sun via solar panels. A solar panel is a packaged,
connected assembly of solar cells, also called photovoltaic cells which are solid state
devices that can convert solar energy directly into electrical energy through quantum
mechanical transitions. They are noiseless and pollution-free with no rotating parts and
need minimum maintenance. The electricity thus generated would then fuel the battery that
would run the car's motors. Therefore we would obtain an electrically driven vehicle that
would travel on “free” energy with no harmful emissions, that can utilize its full power at
all speeds, and would have very little maintenance cost.
P a g e | 10
1.1 MOTIVATION
1.1.1 POLLUTION
The earth is suffering as a result of the destruction wreaked upon it by humanity. Whether
it is the pesticides contaminating the rivers, chemicals from factories polluting the seas or
the exhaust fumes from vehicles and industries polluting the air, the systematic
destruction of our different ecosystems all over the world has led to a dreadful mess. Our
main focus is on the transportation industry which is the second largest source of
pollution and health hazards.
Dhaka has been named one of the worst polluted cities of the world where the roads
congested with vehicles bombard the countless hordes of people streaming past on the
pavements with deafening noise and toxic exhaust fumes from burning fuel especially
during peak office hours when cars stuck in traffic produce more and more harmful
emissions. As a result thousands of people are becoming victims of heart and lung
problems, depression, memory loss, asthma and even premature deaths.
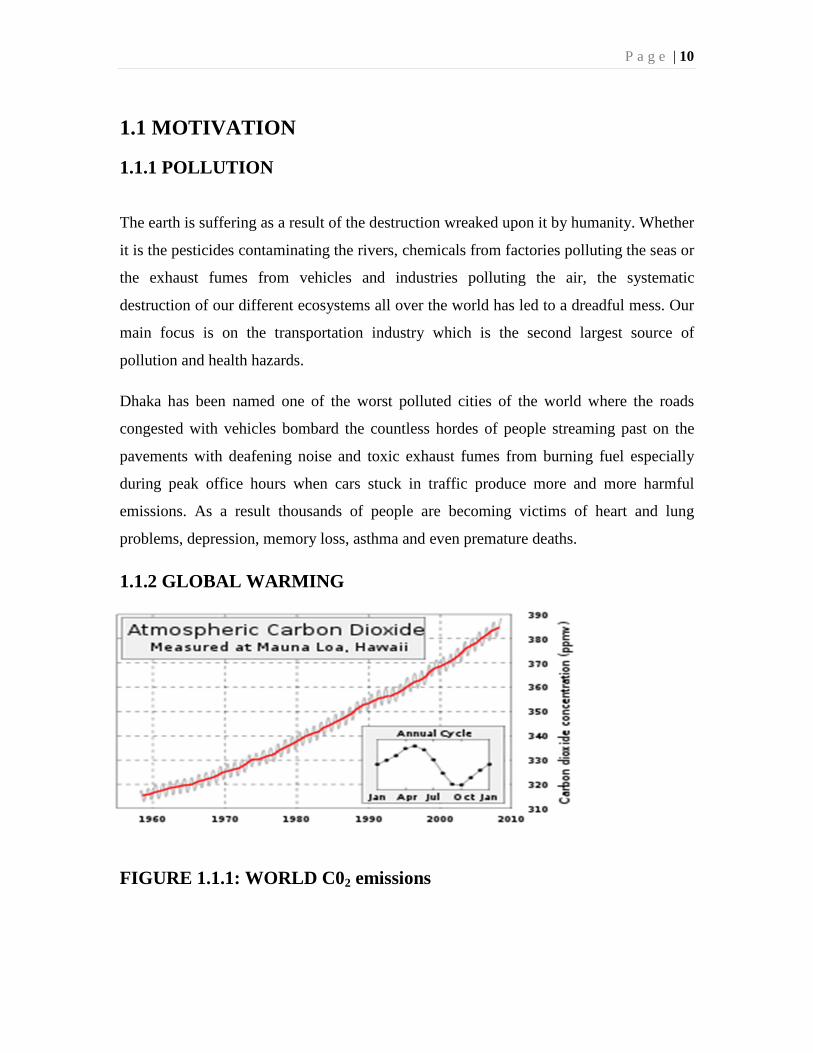
1.1.2 GLOBAL WARMING
FIGURE 1.1.1: WORLD C02 emissions

P a g e | 11
FIGURE 1.1.2: CO2 Emission by Various Sectors The CO2 of the world is rising at an extremely alarming rate. As shown in
FIGURE1.1.1
The conventional cars’ exhaust fumes today are one of the biggest contributors to the
atmospheric CO2 As illustrated in FIGURE 1.1.2. The global warming resulting from
this causes global temperatures to increase and consequently raises the sea levels as well.
FIGURE 1.1.3: World temperature trend
P a g e | 12
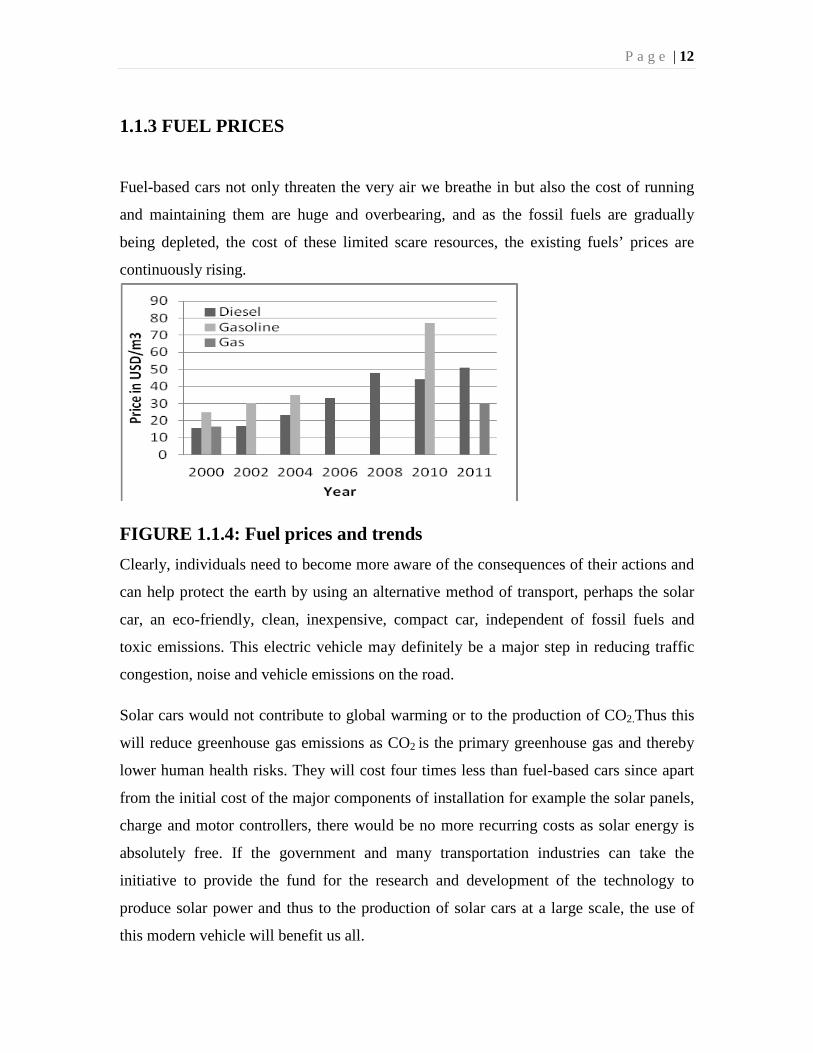
1.1.3 FUEL PRICES
Fuel-based cars not only threaten the very air we breathe in but also the cost of running
and maintaining them are huge and overbearing, and as the fossil fuels are gradually
being depleted, the cost of these limited scare resources, the existing fuels’ prices are
continuously rising.
FIGURE 1.1.4: Fuel prices and trends Clearly, individuals need to become more aware of the consequences of their actions and
can help protect the earth by using an alternative method of transport, perhaps the solar
car, an eco-friendly, clean, inexpensive, compact car, independent of fossil fuels and
toxic emissions. This electric vehicle may definitely be a major step in reducing traffic
congestion, noise and vehicle emissions on the road.
Solar cars would not contribute to global warming or to the production of CO2.Thus this
will reduce greenhouse gas emissions as CO2 is the primary greenhouse gas and thereby
lower human health risks. They will cost four times less than fuel-based cars since apart
from the initial cost of the major components of installation for example the solar panels,
charge and motor controllers, there would be no more recurring costs as solar energy is
absolutely free. If the government and many transportation industries can take the
initiative to provide the fund for the research and development of the technology to
produce solar power and thus to the production of solar cars at a large scale, the use of
this modern vehicle will benefit us all.
P a g e | 13
1.2 PROJECT OBJECTIVE
The main objective of this project is to construct a solar car to allow transport for people
travelling a certain amount of distance every day, for instance, the office commuters of
Dhaka city with virtually no cost as it will run off free renewable solar energy. Since cars
are the major mode of transport for office commuters in Dhaka city, shifting to this eco-
friendly car would be beneficial on an enormous scale.
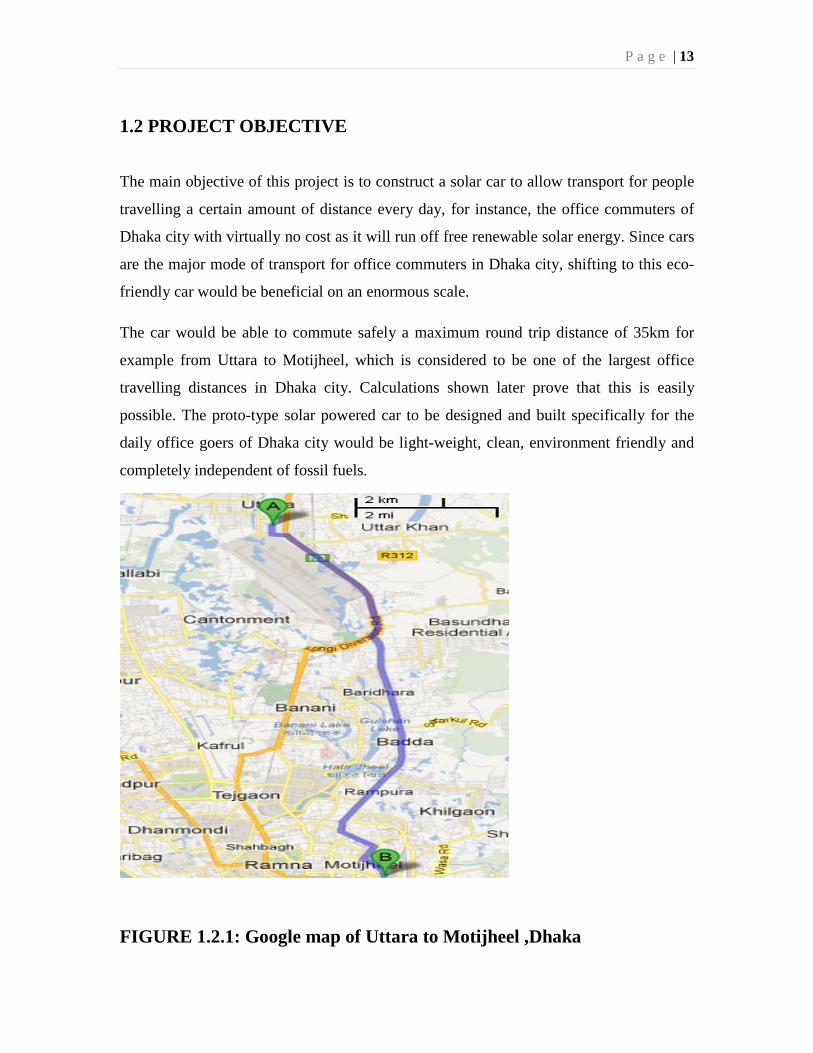
The car would be able to commute safely a maximum round trip distance of 35km for
example from Uttara to Motijheel, which is considered to be one of the largest office
travelling distances in Dhaka city. Calculations shown later prove that this is easily
possible. The proto-type solar powered car to be designed and built specifically for the
daily office goers of Dhaka city would be light-weight, clean, environment friendly and
completely independent of fossil fuels.
FIGURE 1.2.1: Google map of Uttara to Motijheel ,Dhaka
P a g e | 14
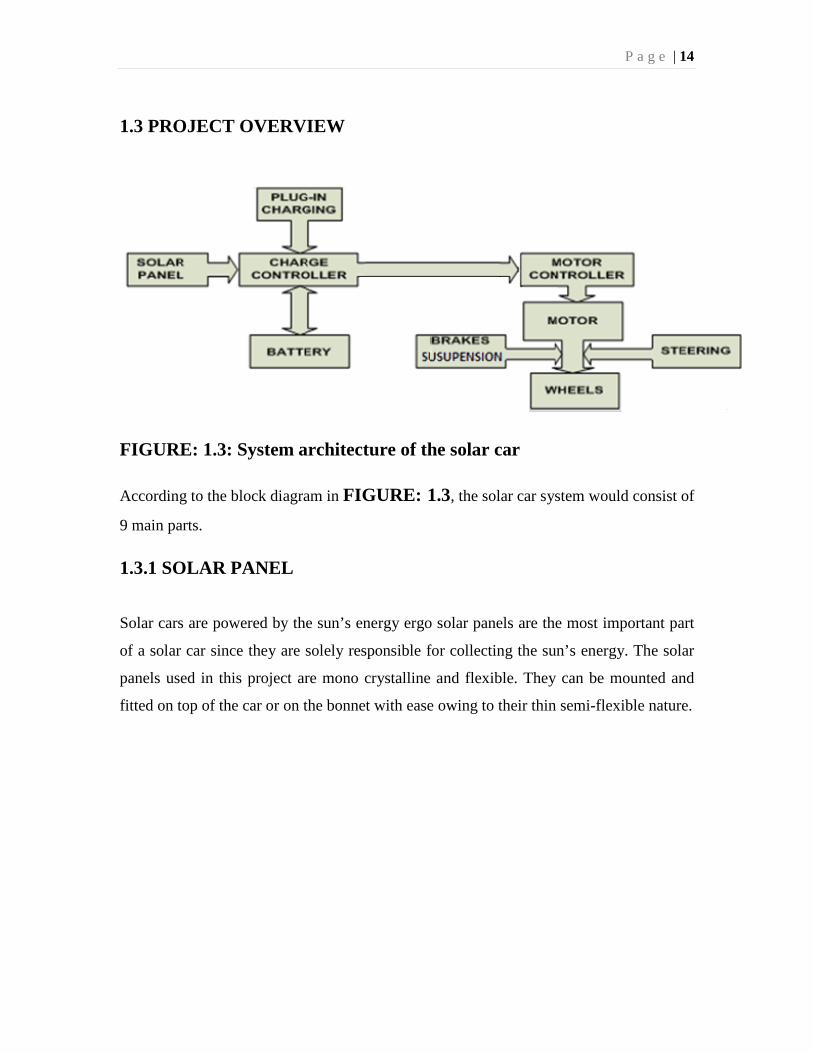
1.3 PROJECT OVERVIEW
FIGURE: 1.3: System architecture of the solar car
According to the block diagram in FIGURE: 1.3, the solar car system would consist of
9 main parts.
1.3.1 SOLAR PANEL
Solar cars are powered by the sun’s energy ergo solar panels are the most important part
of a solar car since they are solely responsible for collecting the sun’s energy. The solar
panels used in this project are mono crystalline and flexible. They can be mounted and
fitted on top of the car or on the bonnet with ease owing to their thin semi-flexible nature.
P a g e | 15
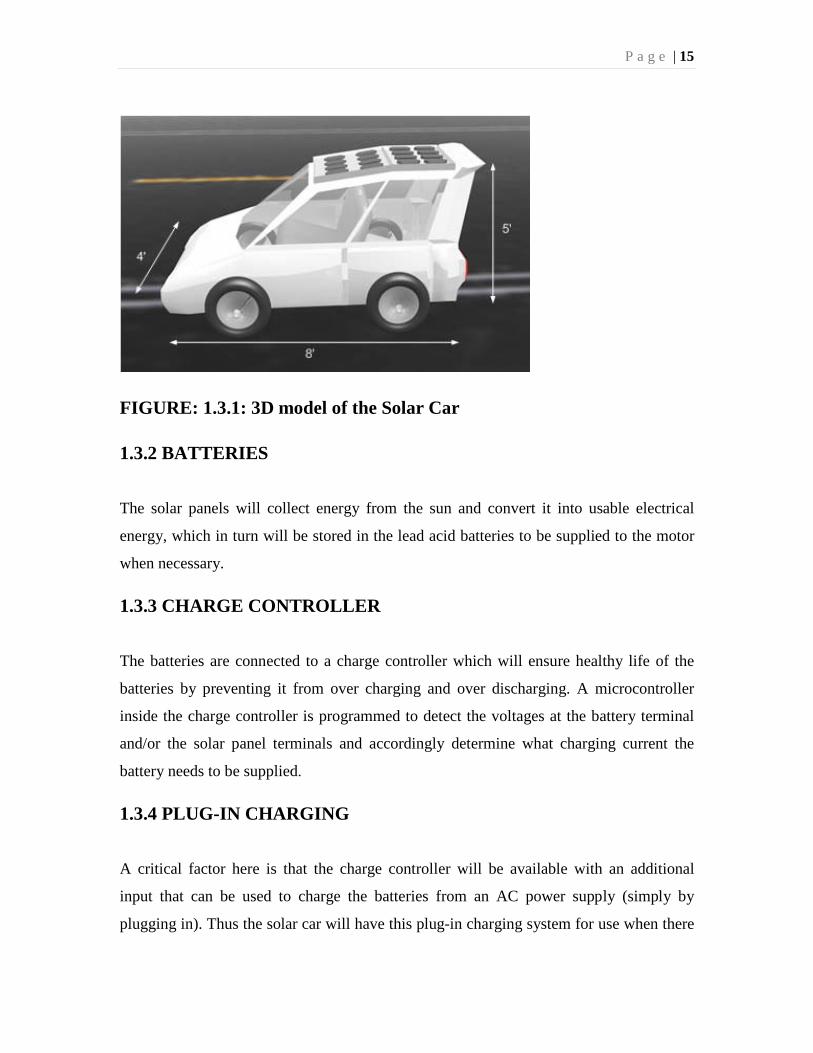
FIGURE: 1.3.1: 3D model of the Solar Car
1.3.2 BATTERIES
The solar panels will collect energy from the sun and convert it into usable electrical
energy, which in turn will be stored in the lead acid batteries to be supplied to the motor
when necessary.
1.3.3 CHARGE CONTROLLER
The batteries are connected to a charge controller which will ensure healthy life of the
batteries by preventing it from over charging and over discharging. A microcontroller
inside the charge controller is programmed to detect the voltages at the battery terminal
and/or the solar panel terminals and accordingly determine what charging current the
battery needs to be supplied.
1.3.4 PLUG-IN CHARGING
A critical factor here is that the charge controller will be available with an additional
input that can be used to charge the batteries from an AC power supply (simply by
plugging in). Thus the solar car will have this plug-in charging system for use when there

P a g e | 16
is not enough sunshine due to fog, cloud or rain. This provision for an external plug-in
system to charge the batteries from the conventional AC power supply will allow the car
to increase its overall utility.
1.3.5 MOTOR AND MOTOR CONTROLLER
The motor used is a DC-series excitation motor which is rated at 1 kW, 60V, 23 A. This
DC-series motor is sufficient to get the car up and running as will be shown in details
later. The motor controller is designed to control the speed of rotation of the motor as
well as the direction of its rotation. In other words, it determines the cars speed and
forward/reverse direction of motion of the wheels.
1.3.6 STEERING, SUSPENSION, BRAKES, WHEELS
These four components make up the mechanical part of the solar car. Front wheel
steering is used as it tends to be more stable and safe. The suspension used is
sophisticated enough to allow the user a stable ride and to protect the car and panels from
sudden shocks and blows. A drum braking system as in conventional cars is used to
provide the safety features of the car while travelling. The wheel selection is dependent
upon the rolling resistance which would determine how far the solar car can travel with
the available energy. Since thicker wheels tend to have higher rolling resistance, thinner
but strong wheels are opted for.
P a g e | 17
1.4 SCOPE OF THE PROJECT
The scope of the project involves designing and constructing a proto-type solar powered
clean car that would be economical, reliable and environmentally friendly. The
specifications of the motor driving the car is calculated based on the intended desired
speed and acceleration to be achieved. This will in turn help calculate the battery capacity
and solar panel wattage required to travel the desired maximum round trip distance of
Uttara to Motijheel on solar power alone. A charge controller with the option of addition
charging from AC lines, and a motor controller to control the speeding and direction of
motion of the car is designed. The chassis of the car is constructed with key components
such as suspension system, a rack and pinion steering system, drum braking system all
put into place. Finally an aerodynamic outer body shape is proposed.
P a g e | 18
2. ELECTRIC VEHICLE RATING CALCULATIONS
2.1 INTRODUCTION
Solar cars compared to internal combustion engine vehicles are simpler in that they have
few major components. However, being an electrical system makes precise calculations
of the ratings of these major components of the car imperative at the design stage. The
ratings of the 3 major components of the car that will be determined are
1) The motor power rating required to achieve the necessary speed and acceleration.
2) The battery capacity which can support the distance required to be travelled.
3) The solar panel specifications needed to keep the battery sufficiently charged for
the journey.
The power rating of the motor will determine the battery capacity i.e. Ampere-hour
charge and voltage needed to overcome the maximum distance that the solar car will
travel on solar power alone. Consequently this in turn will determine the panel wattage
required to sustain the battery charge.
2.2 MOTOR POWER RATING
The power needed to propel a vehicle can be determined by combining the forces that
needs to be applied to the vehicle to move it with the vehicle speed at which this
propelling force must be sustained. The drive torque generated by the motor for the
wheels produces a drive force at the tire/road contact - it is this drive force that moves the
vehicle. At the design stage it's easier to frame the calculation around this drive force
P a g e | 19
rather than the drive torque. Thus the calculations in this section start by determining the
size of this drive force, and given a set of speed at which the vehicle should move, the
drive power is found.
The total drive force that has to act on the vehicle to make it move (or keep it moving)
can be estimated by adding together individual force components that arise from different
physical effects. These are force to overcome the rolling resistance of the wheels on the
drive surface, force to overcome aerodynamic drag and force to accelerate the vehicle's
mass. There may be other effects but these are usually the main ones. These opposing
forces are accounted for as follows:
2.2.1 THE ROLLING RESISTANCE
The rolling resistance force is the force resisting the rolling motion of the tires as they roll
over the road surface. Factors that contribute to rolling resistance are the (amount of)
deformation of the wheels, the deformation of the roadbed surface, and movement below
the surface. Additional contributing factors include wheel diameter, speed, load on
wheels etc. For example, a rubber tire will have higher rolling resistance on a paved road
than a steel railroad wheel on a steel rail. Similarly, sand on the ground will give more
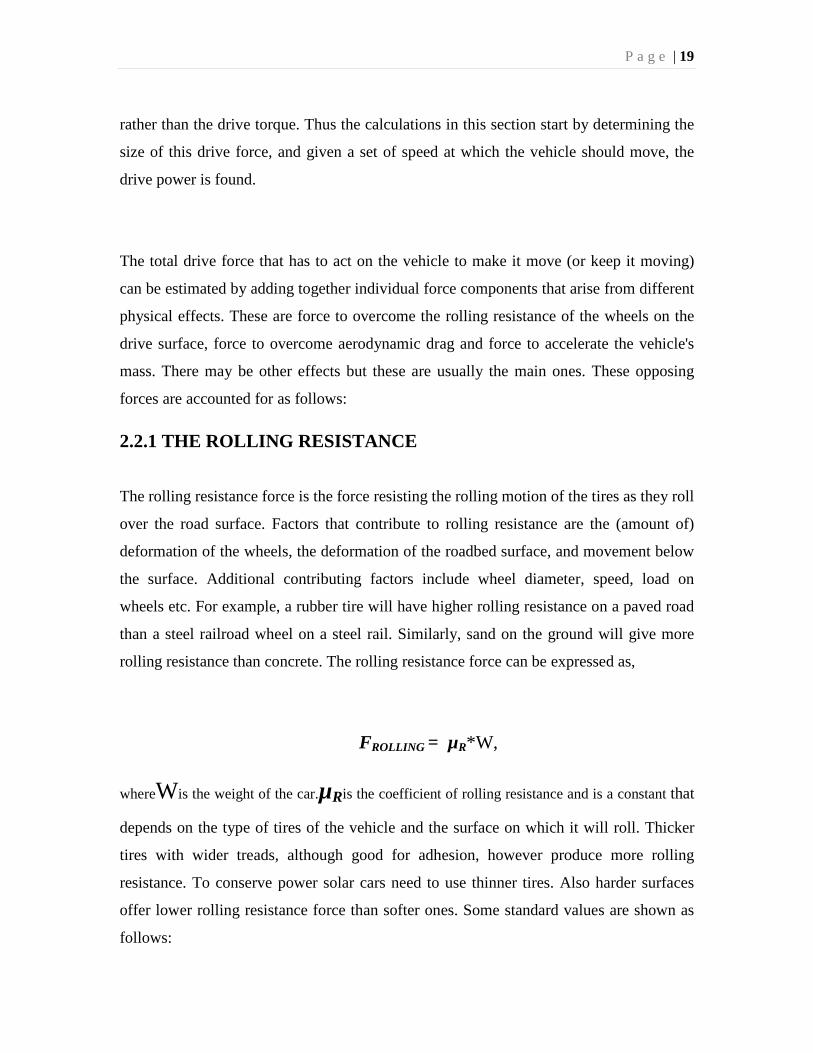
rolling resistance than concrete. The rolling resistance force can be expressed as,
FROLLING = µR*W,
whereWis the weight of the car.µRis the coefficient of rolling resistance and is a constant that
depends on the type of tires of the vehicle and the surface on which it will roll. Thicker
tires with wider treads, although good for adhesion, however produce more rolling
resistance. To conserve power solar cars need to use thinner tires. Also harder surfaces
offer lower rolling resistance force than softer ones. Some standard values are shown as
follows:
P a g e | 20
µR Description
0.0003 to 0.0004 "Pure rolling resistance" Railroad steel wheel on steel rail
0.0010 to 0.0024 Railroad steel wheel on steel rail. Passenger rail car about 0.0020
0.001 to 0.0015 Hardened steel ball bearings on steel
0.0022 to 0.005 Production bicycle tires at 120 psi (8.3 bar) and 50 km/h (31 mph), measured on rollers
0.0045 to 0.008 Large truck (Semi) tires
0.010 to 0.015 Ordinary car tires on concrete
0.0385 to 0.073 Stage coach (19th century) on dirt road. Soft snow on road for worst case.
0.3 Ordinary car tires on sand
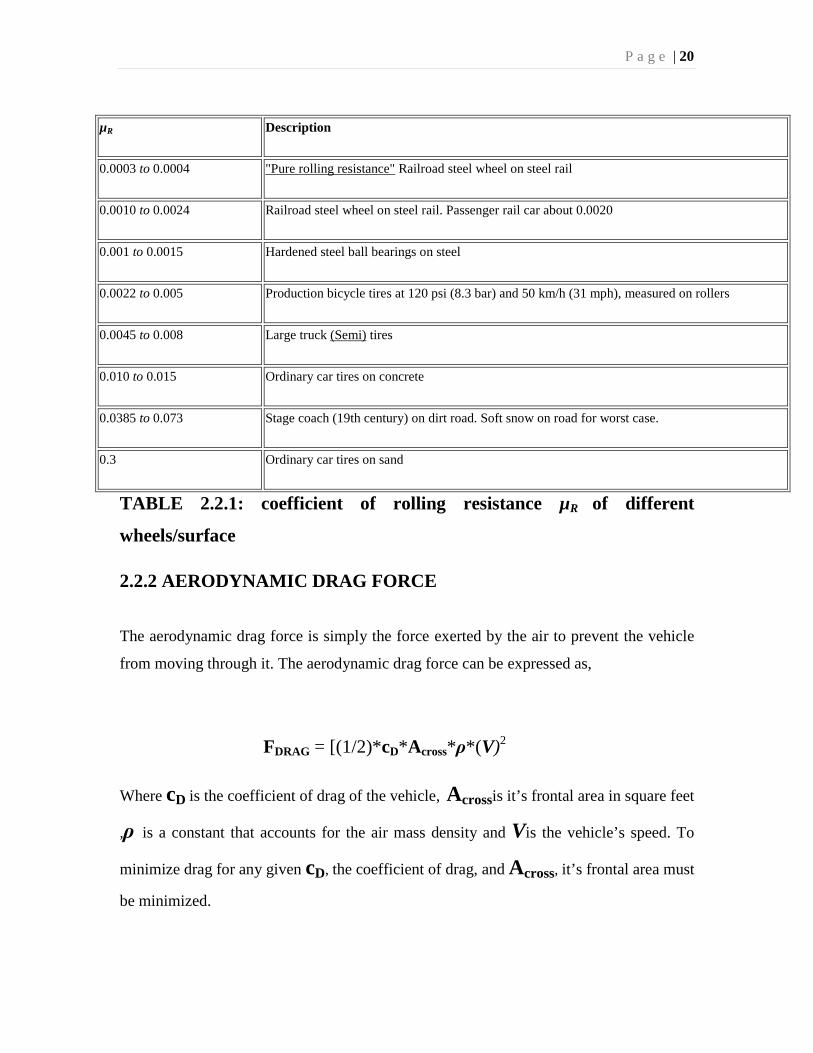
TABLE 2.2.1: coefficient of rolling resistance µR of different
wheels/surface
2.2.2 AERODYNAMIC DRAG FORCE
The aerodynamic drag force is simply the force exerted by the air to prevent the vehicle
from moving through it. The aerodynamic drag force can be expressed as,
FDRAG = [(1/2)*cD*Across*ρ*(V)2
Where cD is the coefficient of drag of the vehicle, Acrossis it’s frontal area in square feet
,ρ is a constant that accounts for the air mass density and Vis the vehicle’s speed. To
minimize drag for any given cD, the coefficient of drag, and Across, it’s frontal area must
be minimized.
P a g e | 21
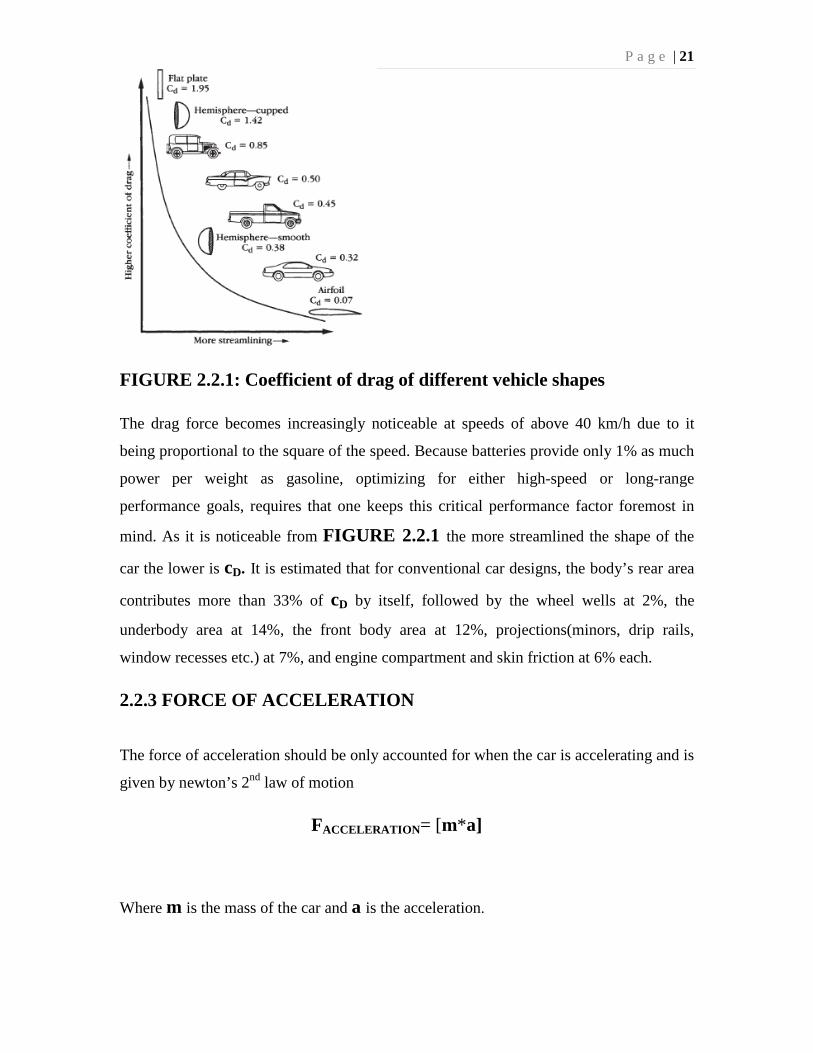
FIGURE 2.2.1: Coefficient of drag of different vehicle shapes
The drag force becomes increasingly noticeable at speeds of above 40 km/h due to it
being proportional to the square of the speed. Because batteries provide only 1% as much
power per weight as gasoline, optimizing for either high-speed or long-range
performance goals, requires that one keeps this critical performance factor foremost in
mind. As it is noticeable from FIGURE 2.2.1 the more streamlined the shape of the
car the lower is cD. It is estimated that for conventional car designs, the body’s rear area
contributes more than 33% of cD by itself, followed by the wheel wells at 2%, the
underbody area at 14%, the front body area at 12%, projections(minors, drip rails,
window recesses etc.) at 7%, and engine compartment and skin friction at 6% each.
2.2.3 FORCE OF ACCELERATION
The force of acceleration should be only accounted for when the car is accelerating and is
given by newton’s 2nd law of motion
FACCELERATION= [m*a]
Where m is the mass of the car and a is the acceleration.

P a g e | 22
The total driving force thus required to overcome the sum of these opposing forces to
move the car is,
FT= FROLLING + FDRAG + FAC
= [µR*W] + [(1/2)*cD*Across*ρ*(V)2] + [m*a]
Table 2.2.2: parameters for calculation of motor power
At the design stage the following necessary assumptions of what the most probable
values of the above parameters might be was made as given below in Table 2.2.2
The power needed to be supplied by the motor in order to provide the current speed and
acceleration will therefore be,
PT = FT* V
Thus the maximum power needed to be supplied to achieve different values of
acceleration while the car is at its maximum assumed speed of 60 km/h, can be obtained
by plotting a graph of motor Power vs. car acceleration with the speed constant at 60
km/h as shown in FIGURE 2.2.2
Weight, W= mg 500 kg * 9.81 ms-2
Top speed, VMAX 60 km/h = 16.7 ms-1
Coefficient of rolling resistance, µR 0.01
Coefficient of drag, cD 0.35
Frontal area, ACROSS 1 m *1.1 m
Mass density of air, ρ 1.2 kgm-3
P a g e | 23
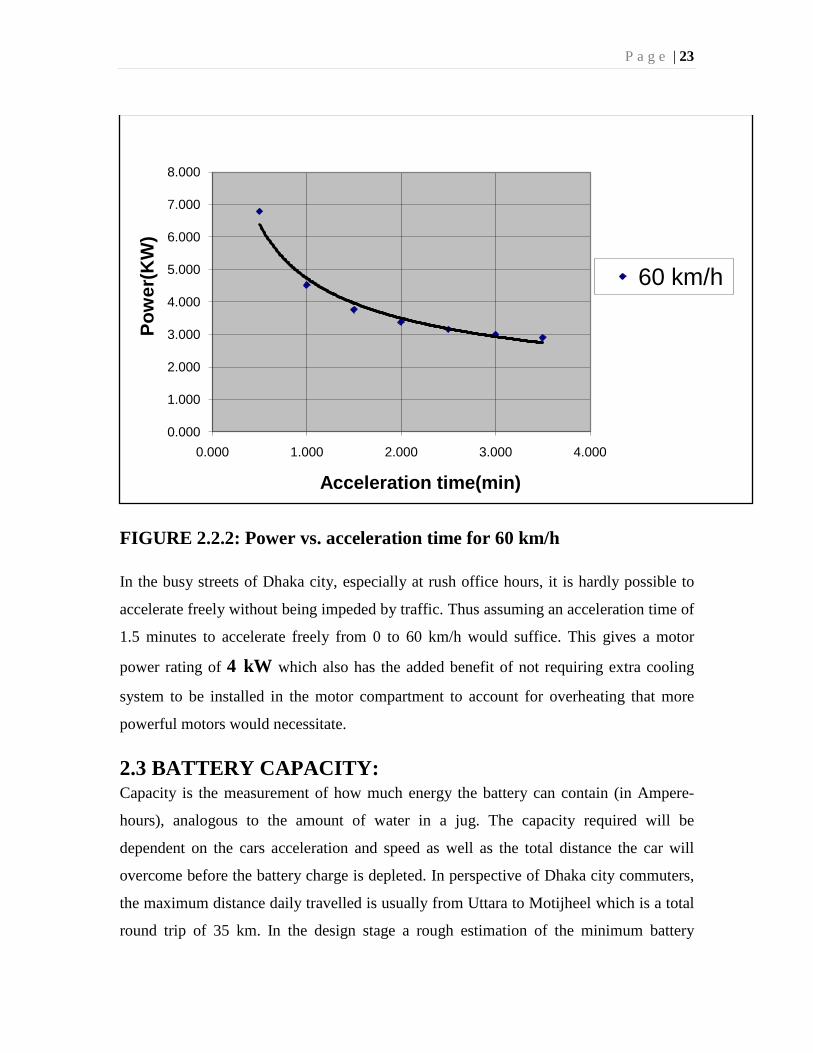
FIGURE 2.2.2: Power vs. acceleration time for 60 km/h
In the busy streets of Dhaka city, especially at rush office hours, it is hardly possible to
accelerate freely without being impeded by traffic. Thus assuming an acceleration time of
1.5 minutes to accelerate freely from 0 to 60 km/h would suffice. This gives a motor
power rating of 4 kW which also has the added benefit of not requiring extra cooling
system to be installed in the motor compartment to account for overheating that more
powerful motors would necessitate.
2.3 BATTERY CAPACITY: Capacity is the measurement of how much energy the battery can contain (in Ampere-
hours), analogous to the amount of water in a jug. The capacity required will be
dependent on the cars acceleration and speed as well as the total distance the car will
overcome before the battery charge is depleted. In perspective of Dhaka city commuters,
the maximum distance daily travelled is usually from Uttara to Motijheel which is a total
round trip of 35 km. In the design stage a rough estimation of the minimum battery
0.000
1.000
2.000
3.000
4.000
5.000
6.000
7.000
8.000
0.000 1.000 2.000 3.000 4.000
Pow
er(K
W)
Acceleration time(min)
60 km/h
P a g e | 24
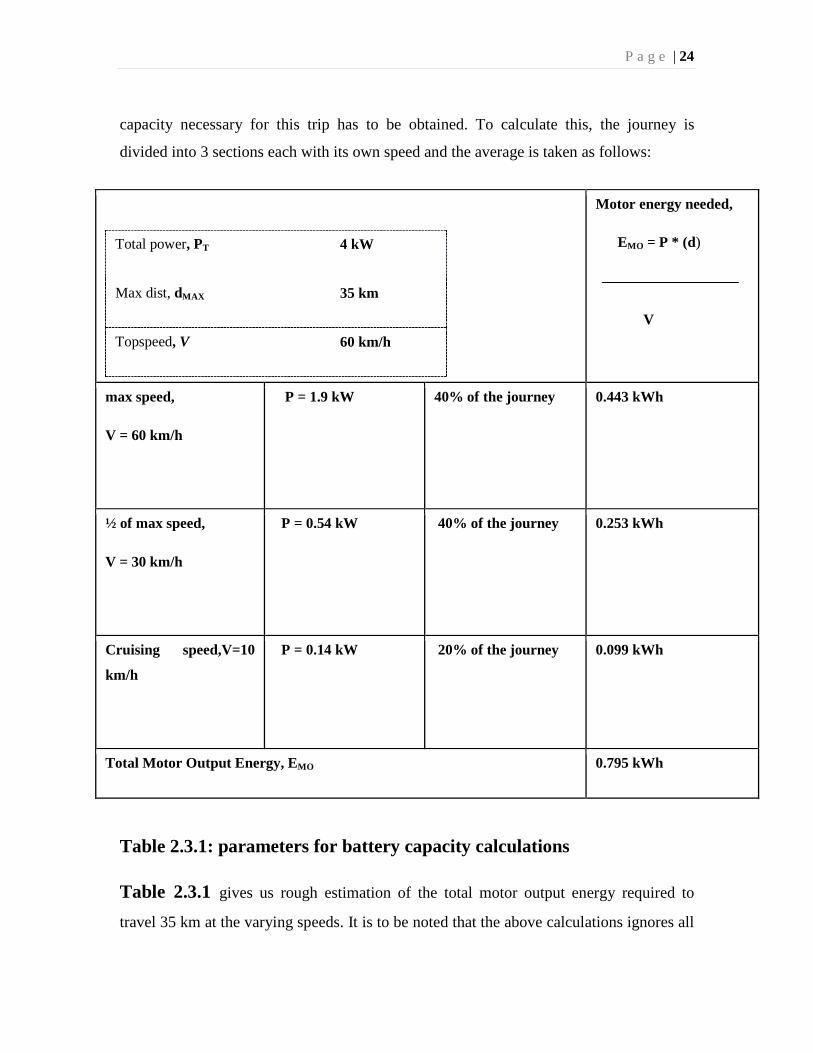
capacity necessary for this trip has to be obtained. To calculate this, the journey is
divided into 3 sections each with its own speed and the average is taken as follows:
Table 2.3.1: parameters for battery capacity calculations
Table 2.3.1 gives us rough estimation of the total motor output energy required to
travel 35 km at the varying speeds. It is to be noted that the above calculations ignores all
Total power, PT 4 kW
Max dist, dMAX 35 km
Topspeed, V 60 km/h
Motor energy needed,
EMO = P * (d)
V
max speed,
V = 60 km/h
P = 1.9 kW 40% of the journey 0.443 kWh
½ of max speed,
V = 30 km/h
P = 0.54 kW 40% of the journey 0.253 kWh
Cruising speed,V=10
km/h
P = 0.14 kW 20% of the journey 0.099 kWh
Total Motor Output Energy, EMO 0.795 kWh
P a g e | 25
of the cars acceleration which if taken into account would certainly increase the
minimum output motor energy required.
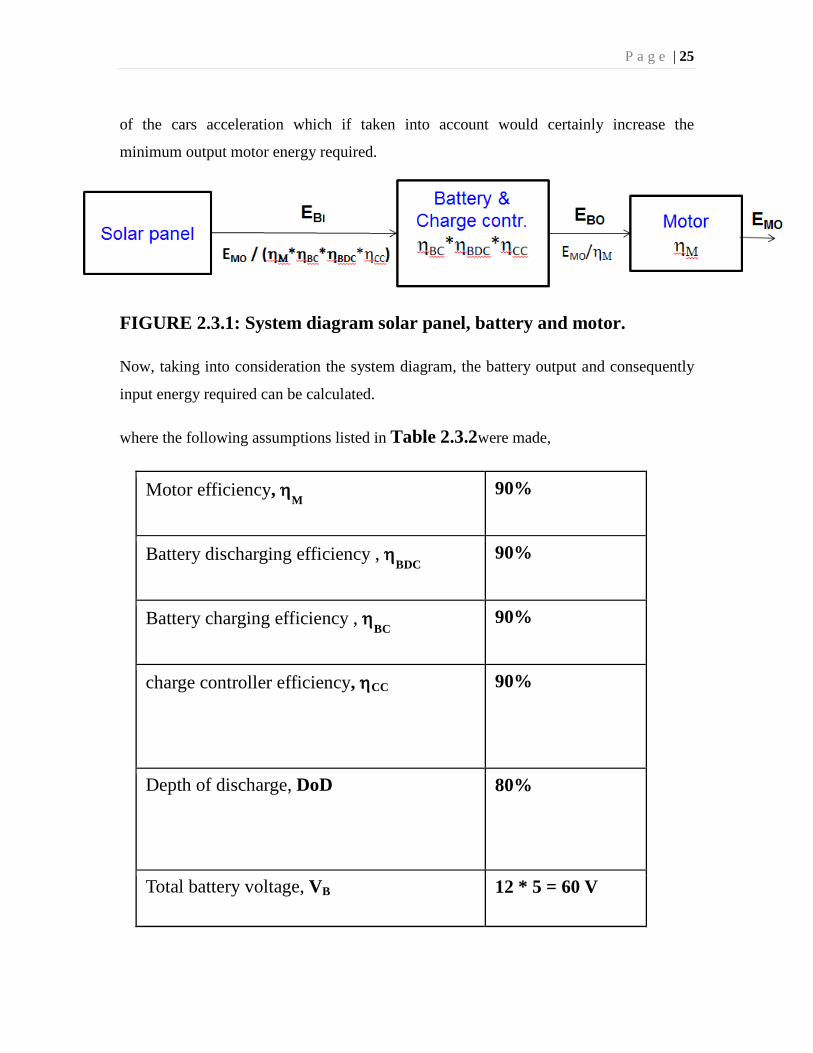
FIGURE 2.3.1: System diagram solar panel, battery and motor.
Now, taking into consideration the system diagram, the battery output and consequently
input energy required can be calculated.
where the following assumptions listed in Table 2.3.2were made,
Motor efficiency, ηM
90%
Battery discharging efficiency , ηBDC
90%
Battery charging efficiency , ηBC
90%
charge controller efficiency, ηCC
90%
Depth of discharge, DoD
80%
Total battery voltage, VB 12 * 5 = 60 V
P a g e | 26
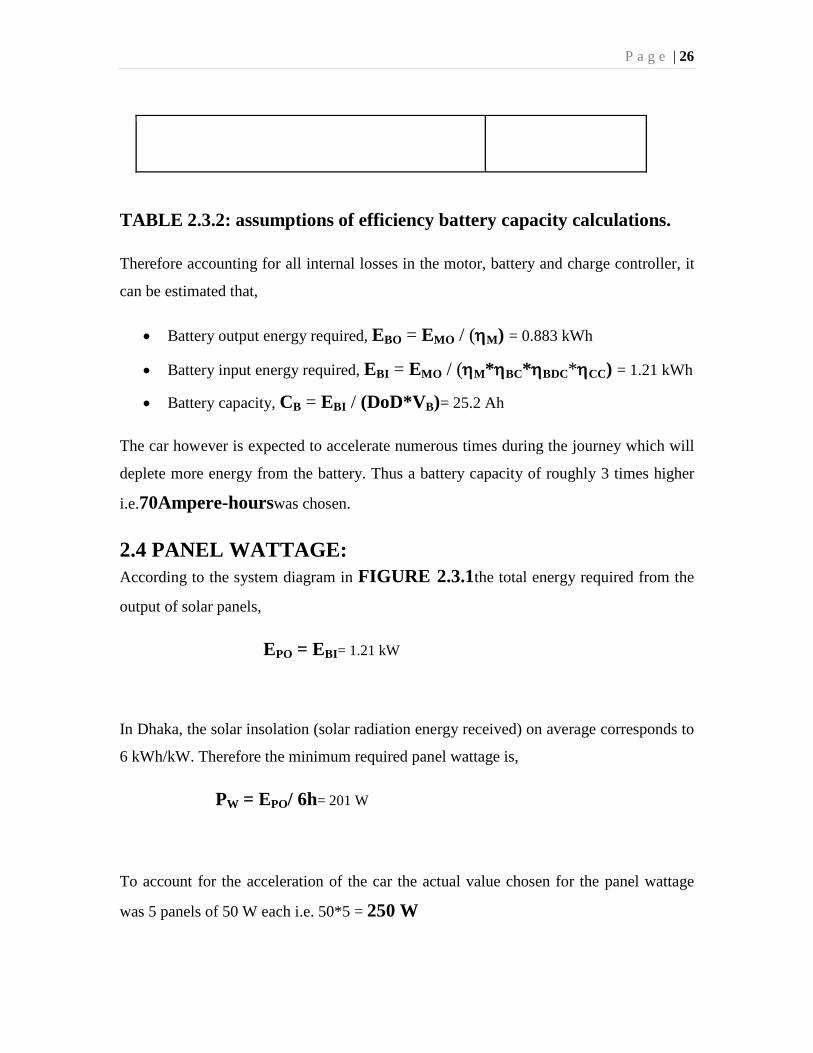
TABLE 2.3.2: assumptions of efficiency battery capacity calculations.
Therefore accounting for all internal losses in the motor, battery and charge controller, it
can be estimated that,
• Battery output energy required, EBO = EMO / (ηM) = 0.883 kWh
• Battery input energy required, EBI = EMO / (ηM*ηBC*ηBDC*ηCC) = 1.21 kWh
• Battery capacity, CB = EBI / (DoD*VB)= 25.2 Ah
The car however is expected to accelerate numerous times during the journey which will
deplete more energy from the battery. Thus a battery capacity of roughly 3 times higher
i.e.70Ampere-hourswas chosen.
2.4 PANEL WATTAGE: According to the system diagram in FIGURE 2.3.1the total energy required from the
output of solar panels,
EPO = EBI= 1.21 kW
In Dhaka, the solar insolation (solar radiation energy received) on average corresponds to
6 kWh/kW. Therefore the minimum required panel wattage is,
PW = EPO/ 6h= 201 W
To account for the acceleration of the car the actual value chosen for the panel wattage
was 5 panels of 50 W each i.e. 50*5 = 250 W
P a g e | 27
2.5 CONCLUSION
In conclusion, the round trip journey can be visualized in the following manner –
• With battery fully charged start the journey and arrive to the destination. The
battery is at the same time being discharged by the motor and charge by the solar
exposure while driving. Battery should now be at max 40% depleted.
• The car is now left subjected to solar exposure for about 6 hours while the user
commits to his/her business. This will bring the batteries back to full charge.
• The return trip is made with batteries still having sufficient charge to overcome
the distance.
It is to be noted that the battery charge will only be depleted when the motor is driving
the car. Thus during the time when the car is halted at traffic (unlike an internal
combustion engine which will waste fuel) the batteries of the car will actually get charged
by the solar exposure thus increasing the cars mileage.
P a g e | 28
3. SOLAR PANEL TEST
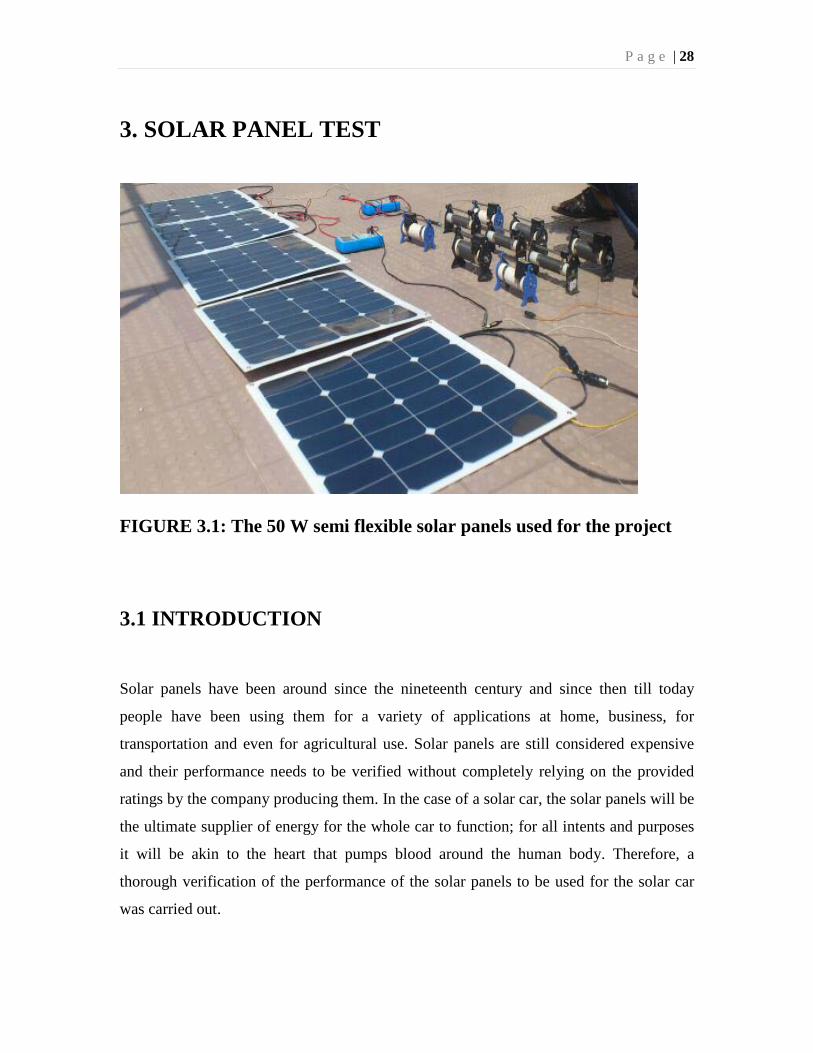
FIGURE 3.1: The 50 W semi flexible solar panels used for the project
3.1 INTRODUCTION
Solar panels have been around since the nineteenth century and since then till today
people have been using them for a variety of applications at home, business, for
transportation and even for agricultural use. Solar panels are still considered expensive
and their performance needs to be verified without completely relying on the provided
ratings by the company producing them. In the case of a solar car, the solar panels will be
the ultimate supplier of energy for the whole car to function; for all intents and purposes
it will be akin to the heart that pumps blood around the human body. Therefore, a
thorough verification of the performance of the solar panels to be used for the solar car
was carried out.
P a g e | 29
3.2 HOW SOLAR PANELS WORK
The sun gives off radiated energy in the form of light photons which is converted into
electrical energy by the solar panels. Solar panels are composed of silicon based
semiconductors and when the radiation comes in contact with the silicon atoms, the
photons are absorbed and the electrons are separated from the rest of the atoms. These
free electrons are responsible for carrying and creating an electrical current. The
electricity generated is most usually stored in batteries to be used later.
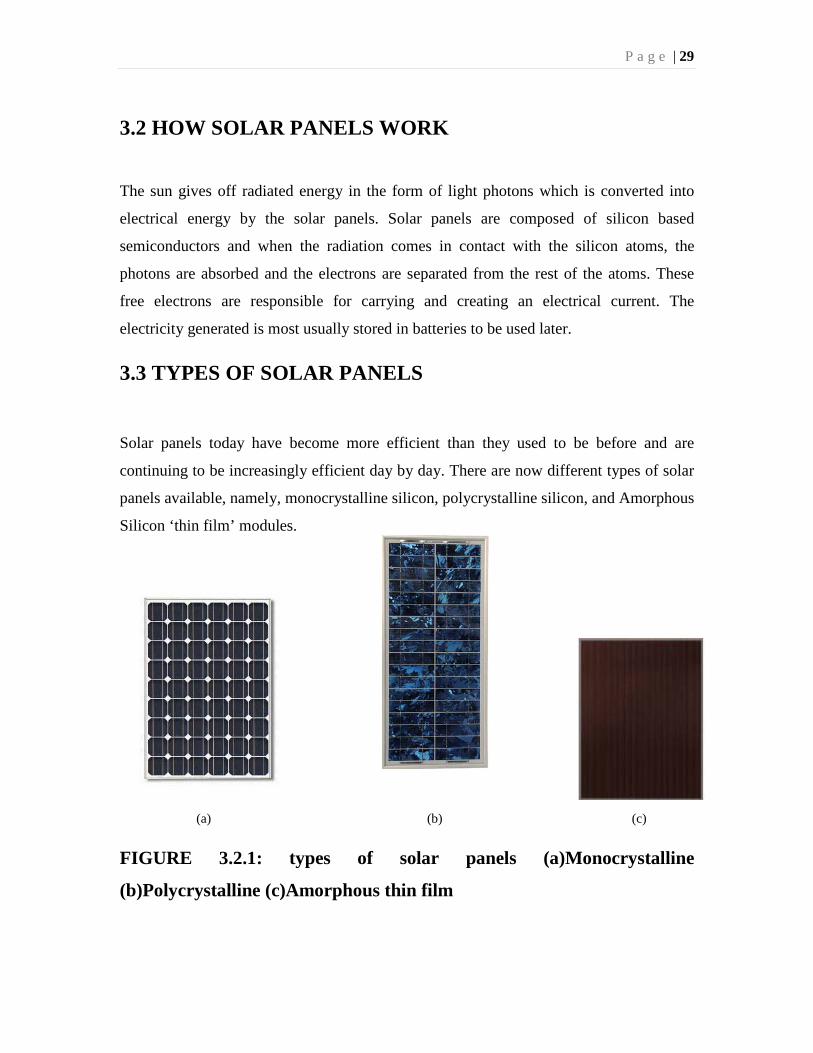
3.3 TYPES OF SOLAR PANELS
Solar panels today have become more efficient than they used to be before and are
continuing to be increasingly efficient day by day. There are now different types of solar
panels available, namely, monocrystalline silicon, polycrystalline silicon, and Amorphous
Silicon ‘thin film’ modules.
(a) (b) (c)
FIGURE 3.2.1: types of solar panels (a)Monocrystalline
(b)Polycrystalline (c)Amorphous thin film
P a g e | 30
3.3.1 MONOCRYSTALLINE SILICON
Monocrystalline silicon solar panels have square-shaped cells and are one of the most
efficient types of solar panels. These devices have the most silicon content out of all the
different panel types, which makes them more expensive to make but conversely takes up
quite less relative space. These solar panels are typically used in high reliability
applications like telecommunications.
3.3.2 POLYCRYSTALLINE SILICON
Polycrystalline silicon solar panels use less silicon, which makes them somewhat less
efficient. However, the unique design, which features strips of silicon wrapped around
rectangular conduit wires, allows them to function more efficiently. Certain
circumstantial use of polycrystalline silicon solar panels such as when used on rooftops
can yield efficiency as close to as those of monocrystalline silicon solar panels
3.3.3 THIN FILM AMORPHOUS MODULES
Thin film solar panels are one of the cheapest types of panels, but are also the least
efficient. The efficiency of amorphous modules to convert sunlight to electricity is half of
polycrystalline or mono crystalline panels. These are not suitable for reliable home or
commercial use. However when the focus is on quantity rather than quality i.e. where
large numbers of solar panels are required to produce a large amount of energy (e.g. in
large array solar farms), due to their cheap mass production cost they become important.
Since solar cars have much less energy to work with to drive the car compared to say
energy provided by internal combustion engines, it is important that this small energy is
as efficiently utilized as possible. Also the lesser the space the solar panels take up over
the body of the car the better it is. Therefore judging from the characteristics of the 3
P a g e | 31
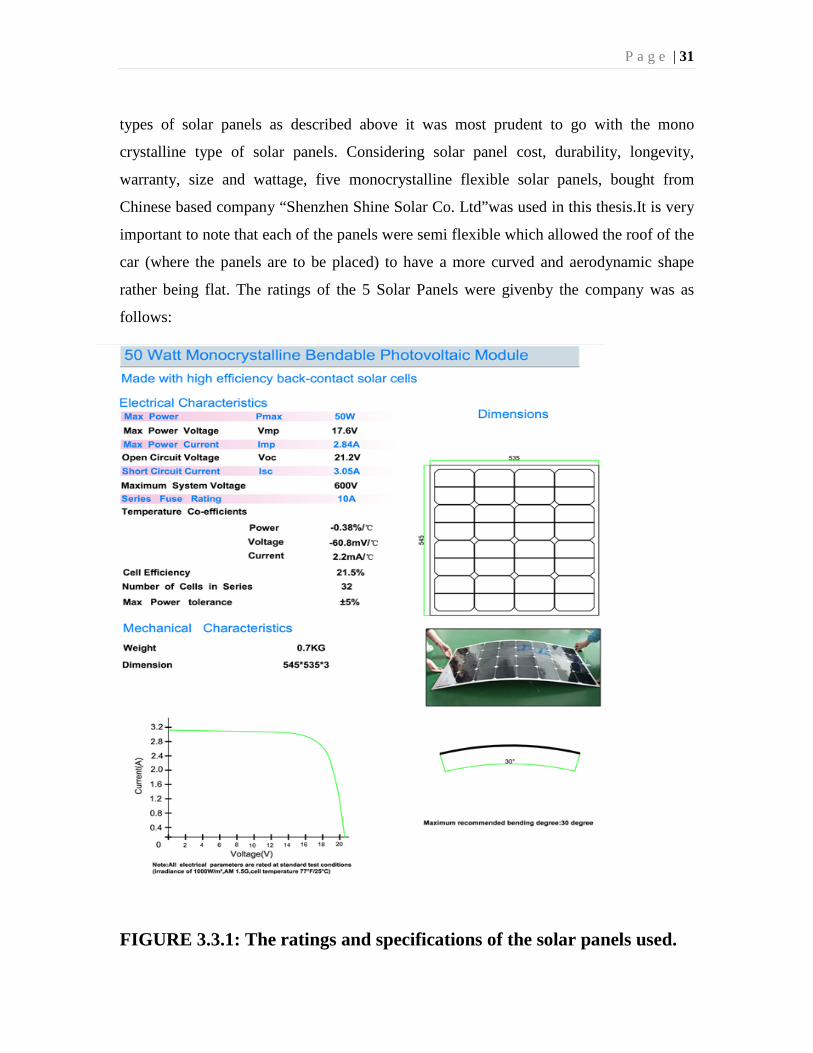
types of solar panels as described above it was most prudent to go with the mono
crystalline type of solar panels. Considering solar panel cost, durability, longevity,
warranty, size and wattage, five monocrystalline flexible solar panels, bought from
Chinese based company “Shenzhen Shine Solar Co. Ltd”was used in this thesis.It is very
important to note that each of the panels were semi flexible which allowed the roof of the
car (where the panels are to be placed) to have a more curved and aerodynamic shape
rather being flat. The ratings of the 5 Solar Panels were givenby the company was as
follows:
FIGURE 3.3.1: The ratings and specifications of the solar panels used.
P a g e | 32
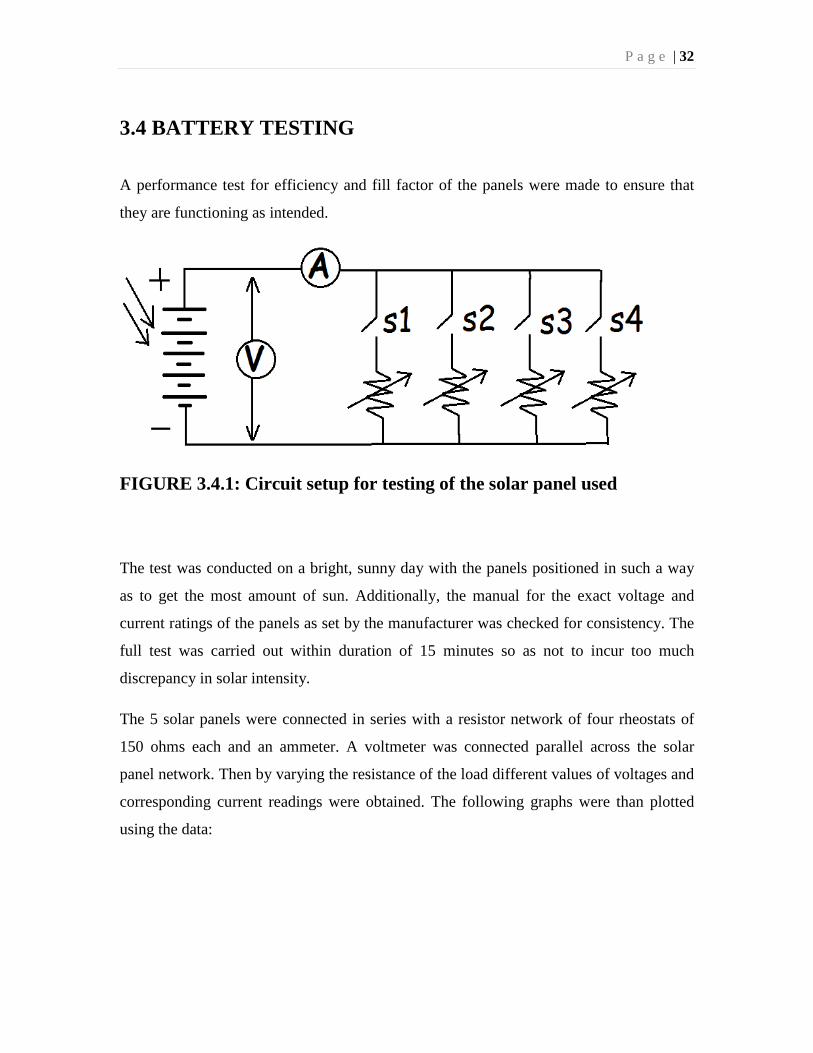
3.4 BATTERY TESTING
A performance test for efficiency and fill factor of the panels were made to ensure that
they are functioning as intended.
FIGURE 3.4.1: Circuit setup for testing of the solar panel used
The test was conducted on a bright, sunny day with the panels positioned in such a way
as to get the most amount of sun. Additionally, the manual for the exact voltage and
current ratings of the panels as set by the manufacturer was checked for consistency. The
full test was carried out within duration of 15 minutes so as not to incur too much
discrepancy in solar intensity.
The 5 solar panels were connected in series with a resistor network of four rheostats of
150 ohms each and an ammeter. A voltmeter was connected parallel across the solar
panel network. Then by varying the resistance of the load different values of voltages and
corresponding current readings were obtained. The following graphs were than plotted
using the data:

P a g e | 33
(a) (b)
FIGURE 3.4.2: Graphs of (a) Power vs. terminal voltage, (b) Current
vs. terminal voltage for the solar panel.
From the graphs in FIGURE3.4.2 the following measurement were obtained:
Maximum power point current, IM
1.85 A
Maximum power point voltage, VM
78 V
Open Circuit Voltage, VOC
89.5 V
Short Circuit Current, ISC
2.12 A
TABLE 3.4.1: parameters of solar panel

P a g e | 34
Also the area of the 5 panels was found to be, AS=1.2 m2.
The value of Irradiance, IRR= 640 W/m2 from a SWERA data survey of irradiance in
Dhaka. Thus the solar panel efficiency was calculated as,
ɳ = PM / (AS* IRR) = 18.8%
Meaning we get an energy of EM= 0.188*(1kW/m2)*(1.2m2)*6h = 1.35 kWh of energy
within 6 hours. This is sufficient energy for 35 km distance as the energy needed to make
the journeyshould be around 1.21 kW as shown in the calculation in SECTION 2.3
The fill factor of the solar panels was found as,
FF = PM / (VOC * ISC) = 0.76
Typically, the fill factor for solar panels with excellent performance is around 0.8
FIGURE 3.4.3: configuration of the setup of the solar panels on the car.
P a g e | 35
3.5 CONCLUSION
Although the solar panels bought were easily the most expensive element of the car, the
most part, good quality solar panels will last for 20 years without needing to be replaced.
However, there are also some factors that can affect solar panels and cause them to have
a lower output even when the hardware is 100% functional. These factors include sky
condition, positioning, temperature, shade etc.
P a g e | 36
4. BATTERY:
The battery to be used is a 12 V unsealed lead-acid re-chargeable battery.Lead–acid
batteries, invented in 1859 by French physicist Gaston Planté, are the oldest type of
rechargeable battery. Despite having a very low energy-to-weight ratio and a low energy-
to-volume ratio, their ability to supply high surge currents means that the cells maintain a
relatively large power-to-weight ratio. These features, along with their low cost, make
them attractive for use in motor vehicles to provide the high current required by
automobile motors
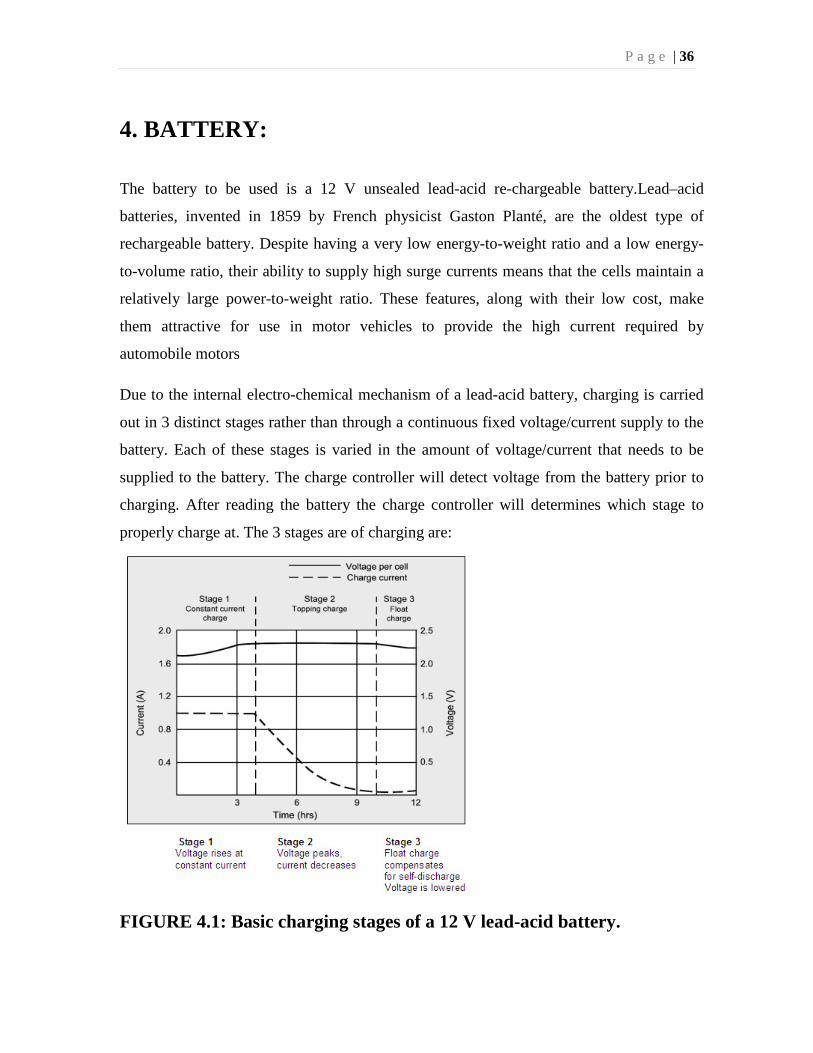
Due to the internal electro-chemical mechanism of a lead-acid battery, charging is carried
out in 3 distinct stages rather than through a continuous fixed voltage/current supply to the
battery. Each of these stages is varied in the amount of voltage/current that needs to be
supplied to the battery. The charge controller will detect voltage from the battery prior to
charging. After reading the battery the charge controller will determines which stage to
properly charge at. The 3 stages are of charging are:
FIGURE 4.1: Basic charging stages of a 12 V lead-acid battery.

P a g e | 37
4.1 STAGES OF THE BATTERY
4.1.1 STAGE 1: BULK CHARGE:
The BULK stage involves about 80% of the recharge, wherein the charger current is held
and voltage increases. Current is sent to batteries at the maximum safe rate (determined by
the battery’s the battery's natural absorption rate i.e. the level of charge that can be applied
without overheating the battery) they will accept until voltage rises to near full charge
level. Usually a charger current of 40 percent of the total Ah (amp-hour) capacity of the
battery is safe to be applied. The charging at this stage is the fastest and there is no risk of
overcharging in this stage because the battery hasn't even reached full yet. This stage thus
recharges a battery that has been severely drained.
4.1.2 STAGE 2: ABSORPTION CHARGE:
Once the battery has reached approximately 80% state of charge, the charger will enter the
absorption stage. The ABSORPTION stage is where the charger holds the voltage at the
charger's absorption voltage while the current gradually decreases as internal resistance
increases during charging. It is during this stage that the charger puts out the maximum
voltage. This stage takes more time. For instance, the last remaining 20% of the battery
takes much longer when compared to the first 20% during the bulk stage. The current
continuously declines until the battery almost reaches full capacity.
4.1.3 STAGE 3: FLOAT CHARGE:
After batteries reach full charge, charging voltage is reduced to a lower level to reduce
gassing and prolong battery life. This is often referred to as a maintenance or trickle
charge, since its main purpose is to keep an already charged battery from discharging. It’s
essentially the float stage where there is charge going into the battery at all times, but only
at a safe rate to ensure a full state of charge and nothing more.
P a g e | 38
4.2 BATTERY STATE OF CHARGE AND SET POINTS:
State of charge (SOC) is the equivalent of a fuel gauge for the battery pack in a battery
electric vehicle. The SOC is defined as the currently available capacity expressed as a
percentage of its rated capacity. The units of SOC are percentage points (0% = empty;
100% = full). An alternate form of the same measure is the depth of discharge (DoD), the
inverse of SOC (100% = empty; 0% = full).
The SOC level must be controlled to prevent overcharging the battery when the SOC level
approaches 100%, and to prevent over-discharge of the battery when the SOC level
approaches 20%. Otherwise the life of the battery is severely penalized. The Battery
Management System (BMS) implemented by the microcontroller therefore must control
the SOC level to be within this range between 50% and 80%.
4.2.1 VOLTAGE AND BATTERY:
One indication of the SOC of the battery is its open circuit terminal voltage (OCV). In
lead-acid cells, during the discharging process the sulphate ions bond to the plates while
the sulphuric acid leaves the electrolyte. The opposite occurs during the charging process.
Therefore in a fully charged cell the electrolyte is 25% sulphuric acid in water and in a
fully discharged cell the electrolyte is almost pure water. The variation in the percentage of
sulphuric acid in the cell’s electrolyte causes a change in the electrolyte’s electrical
resistance, thereby causing the internal resistance of the entire cell to vary accordingly. In
other words, the internal resistance of the battery serves as an indication of the battery
SOC. Since the voltage across the terminal voltage of the battery, at a steady rate of
charging/discharging current, will be proportional to the battery’s internal resistance, it
therefore can be used to approximately infer the battery’s state of charge.
P a g e | 39
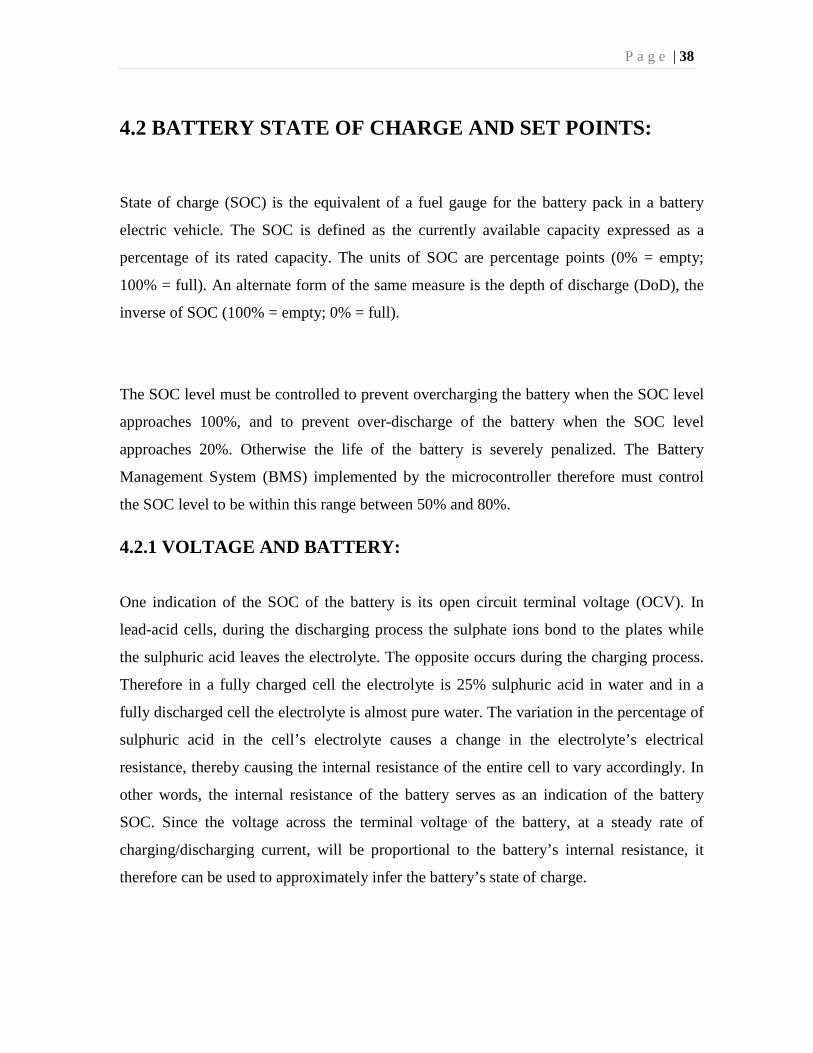
FIGURE 4.2.1: SOC vs. no-load terminal
voltages of a typical 12 V lead-acid battery.
In a 12 V battery system the voltages vary between 10.5 volts and 12.7 volts. These
voltages are for batteries that have been at rest for 3 hours or more. Ideally the charge
controller should keep the battery operating within the green zone as shown in FIGURE
4.2.1
However, the actual SOC vs. voltage characteristics of a lead-acid battery is unique like a
signature. So, the actual charge/discharge characteristic graph pertaining to the lead-acid
battery to be used in this project had to be obtained by testing the batteries for at least one
charge/discharge cycle.
P a g e | 40
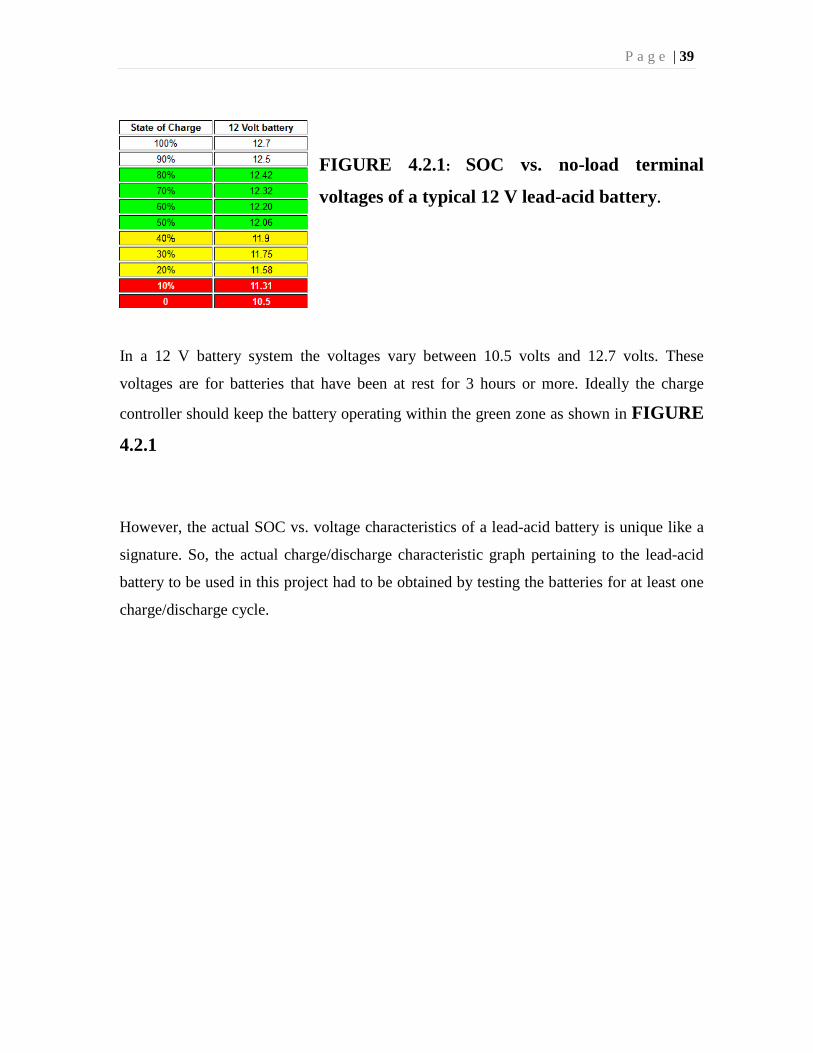
The battery test was carried out by first charged by connecting it in series with a
controllable DC power supply and an ammeter, with a voltmeter across to measure the
voltage. While charging data of current and voltages were recorded. For the discharging
part, the battery was connected in series with a rheostat and ammeter with a voltmeter
across to measure the voltage. Again, data of current and voltages were recorded. The
arrangements are shown in FIGURE 4.2.2
FIGURE 4.2.2: Setup of
the battery for testing
(a)chargin (b)Discharging
(a)
(b)

P a g e | 41
Using these data in MATLAB graph were as shown inFIGURE 4.2.3
(a)
(b)
P a g e | 42
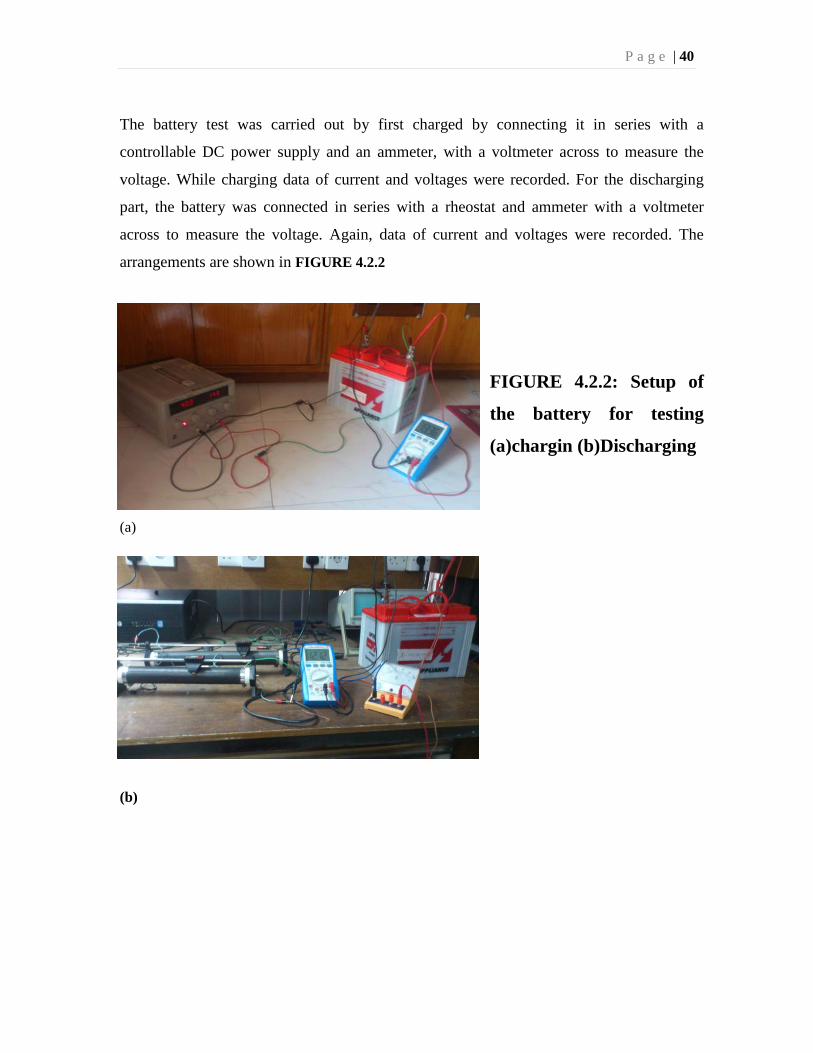
FIGURE 4.2.3: Graph of battery testing in MATLAB (a) plotted of
terminal voltage and charging current vs. SOC at charging (b) Graph of
terminal voltage vs. DoD at discharging was also plotted.
Once the cut off voltages has been determined, the information is usable to allow the
microcontroller to set points for the charge controller. The microcontroller would then take
decisions to determine the %PWM for the battery pack to be charged at according to its set
points.
Now, ideally the charge controller should regulate the charging current so as to produce the
charging characteristics shown in FIGURE 4.1 According to FIGURE 4.1 for the
absorption stage i.e. at Stage 2 the current needs to be continuously decreased in relation to
the terminal voltage so that the terminal voltage remains constant. A simpler approach was
opted for where the current would be decreased in steps of 2 and 3 for charging from solar
panel and the AC line respectively. This would result in a characteristic charging graph
shown in FIGURE 4.2.4 the boundaries for the stages were obtained from the battery
test charging graph in FIGURE 4.2.3 (a) and are given as follows:
P a g e | 43
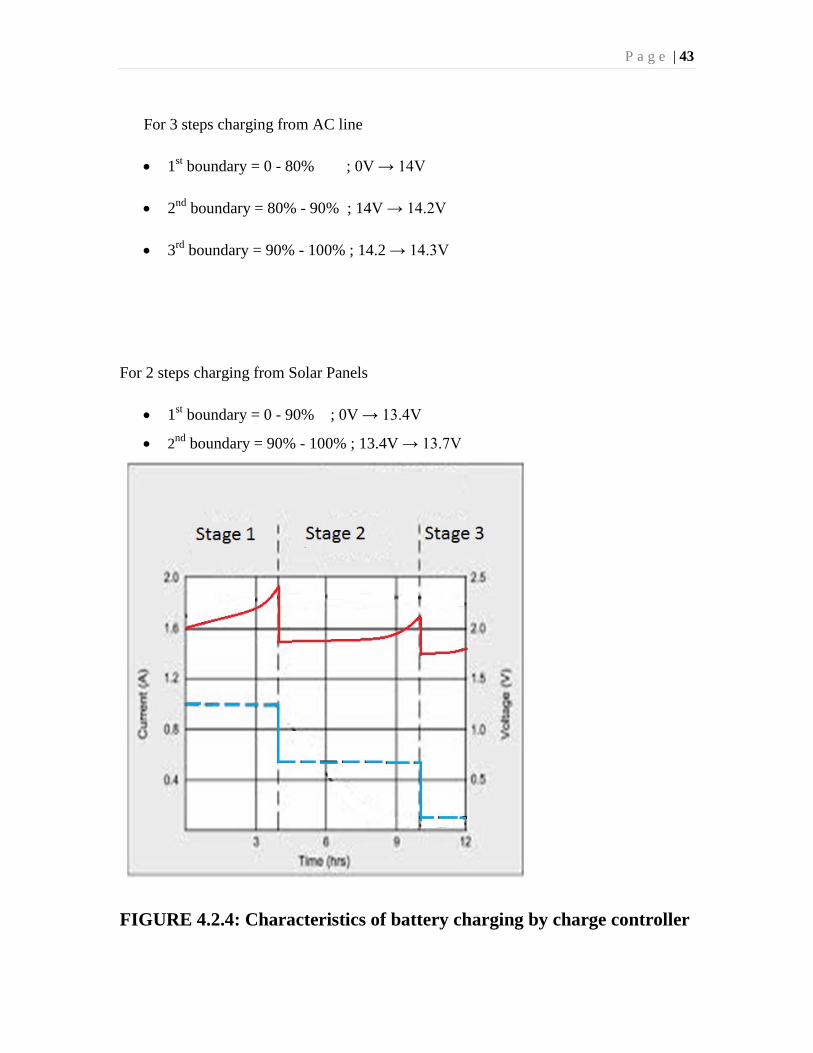
For 3 steps charging from AC line
• 1st boundary = 0 - 80% ; 0V → 14V
• 2nd boundary = 80% - 90% ; 14V → 14.2V
• 3rd boundary = 90% - 100% ; 14.2 → 14.3V
For 2 steps charging from Solar Panels
• 1st boundary = 0 - 90% ; 0V → 13.4V
• 2nd boundary = 90% - 100% ; 13.4V → 13.7V
FIGURE 4.2.4: Characteristics of battery charging by charge controller
P a g e | 44
Although, the terminal voltage is a good representation of the SOC of the battery, the
voltage is also influenced affected by two additional factors – the rate of
charging/discharging current and the temperature. Therefore a major limitation to this
technique of measurement is the influence of current and temperature on the voltage.
4.2.2 CURRENT AND BATTERY:
As current moves through the cell, the cell’s voltage changes because of its internal cell
resistance. When the cell is being recharged, current flow causes the cell’s voltage to rise.
The higher the recharging current the higher the voltage rises. As the cell is discharged, the
discharging current causes the cell’s voltage to drop. The higher the discharging current,
the greater is the battery’s depression. However, if the extent and characteristic of the
dependency of the voltage on the current is known then compensation could be made to
correct the error in the voltage measurement of SOC caused by the charging/discharging
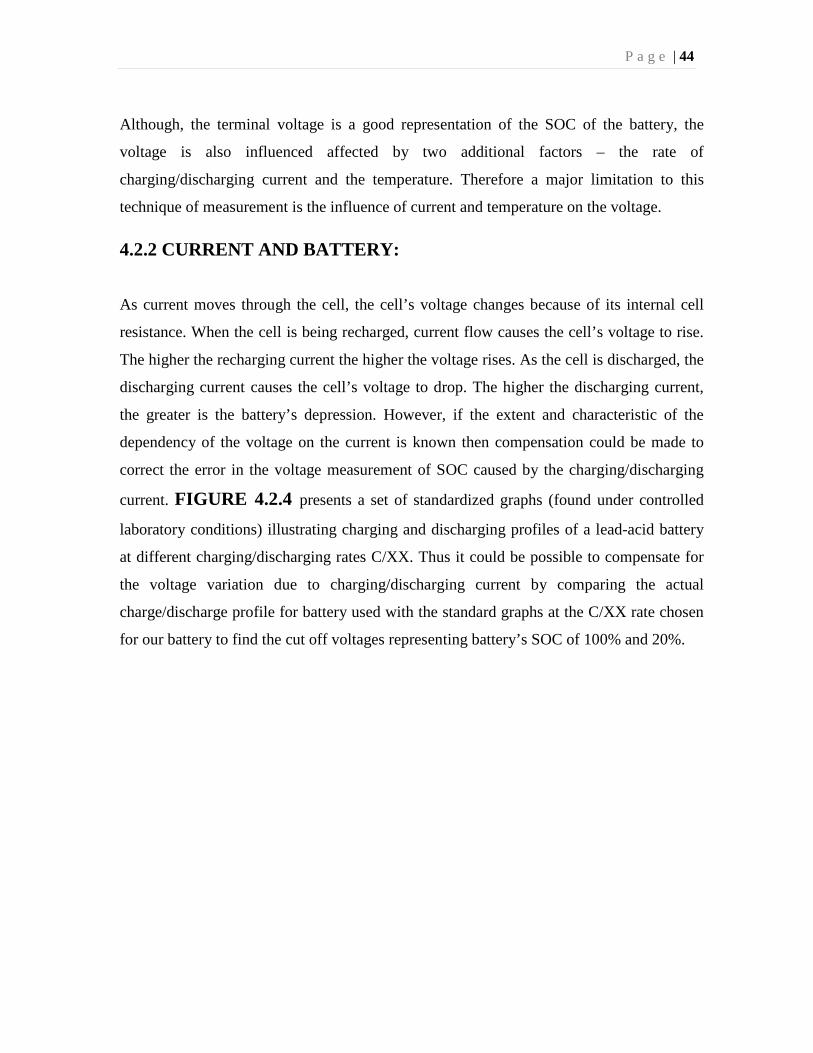
current. FIGURE 4.2.4 presents a set of standardized graphs (found under controlled
laboratory conditions) illustrating charging and discharging profiles of a lead-acid battery
at different charging/discharging rates C/XX. Thus it could be possible to compensate for
the voltage variation due to charging/discharging current by comparing the actual
charge/discharge profile for battery used with the standard graphs at the C/XX rate chosen
for our battery to find the cut off voltages representing battery’s SOC of 100% and 20%.
P a g e | 45
(a)
(b)
FIGURE 4.2.4: Standardized [(a) Charging & (b) Discharging] voltage
vs. SOC graphs of a typical 12 Volt lead-acid battery displaying
P a g e | 46
characteristic changes with different charging/discharging rates C/XX
(where C= battery capacity)
4.2.3 TEMPARATURE AND BATTERY:
The lead-acid cell reaction is sensitive to temperature as well. Cooling the cell changes its
voltage vs. SOC profile. This is due to its decrease in internal resistance with temperature.
This means that voltage elevation under recharging is increased in cold cells. Similarly, an
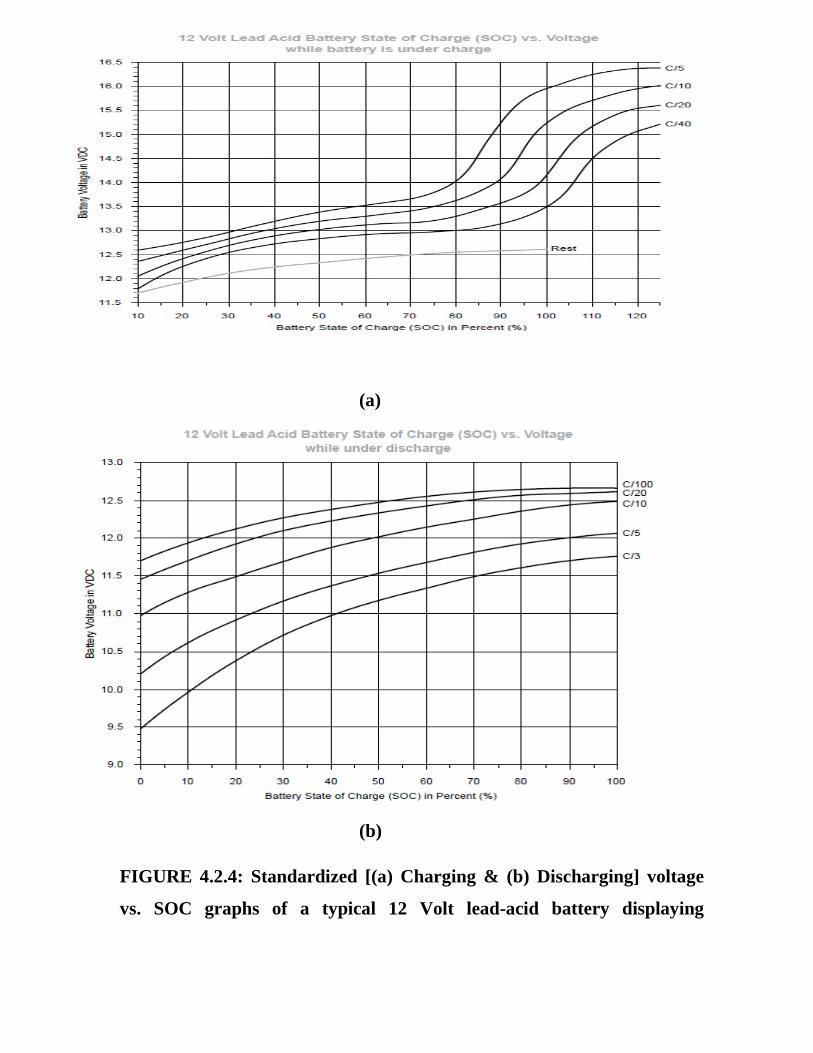
increased voltage depression in cold cells when discharged is also observed. FIGURE
4.4.5 illustrates a table depicting the dependency of standard 12 V lead-acid batteries on
temperature. Knowing the standard characteristic would allow for compensation in voltage
measurement of SOC.
FIGURE 4.4.5:
Temperature vs. voltage
characteristics of a
standard 12 V lead-acid
battery.
NB: Although compensation to the errors in voltage measurement of SOC can be
theoretically made as described above, this technique is still prone to significant error in a
solar car system. The above solution to compensating for current error demands that a
P a g e | 47
fixed charging/discharging current and the above solution to compensating for the
temperature error demands that the temperature variations is constantly sensed and fed as
input to the charge controller. However, in a motor vehicle, the charging/discharging
current drawn from the battery can vary and it could be difficult to sense the battery
temperature.
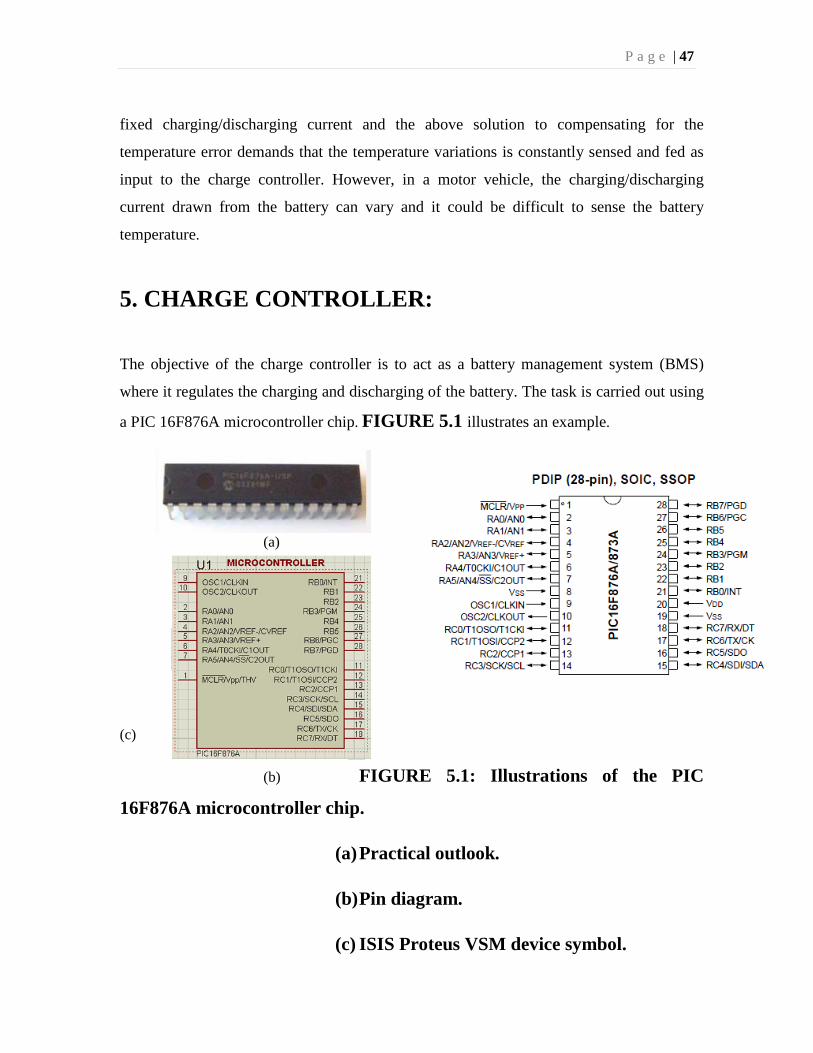
5. CHARGE CONTROLLER:
The objective of the charge controller is to act as a battery management system (BMS)
where it regulates the charging and discharging of the battery. The task is carried out using
a PIC 16F876A microcontroller chip. FIGURE 5.1 illustrates an example.
(a)
(c)
(b) FIGURE 5.1: Illustrations of the PIC
16F876A microcontroller chip.
(a) Practical outlook.
(b) Pin diagram.
(c) ISIS Proteus VSM device symbol.

P a g e | 48
Description: This powerful (200 nanosecond instruction execution) yet easy-to-program
(only 35 single word instructions) CMOS FLASH-based 8-bit microcontroller packs
Microchip's powerful PIC architecture into a 28-pin package and is upwards compatible
with the PIC16C5X, PIC12CXXX and PIC16C7X devices. The PIC16F876A features 256
bytes of EEPROM data memory, self-programming, an ICD, 2 Comparators, 5 channels of
10-bit Analog-to-Digital (A/D) converter, 2 capture/compare/PWM functions, the
synchronous serial port which can be configured as either 3-wire Serial Peripheral
Interface (SPI) or the 2-wire Inter-Integrated Circuit (I2C) bus and a Universal
Asynchronous Receiver Transmitter (USART). All of these features make it ideal for more
advanced level A/D applications in automotive, industrial, appliances and consumer
applications.
NB: The power up voltage of the PIC16F876A is rated at 5 V. In the circuit design the
microcontroller is to be powered by the battery itself. Since the battery voltage will most
likely be over the voltage specification of 5 V, a voltage regulator (LM 7805) would be
used to convert the battery’s voltage into a 5 V constant DC supply at the microcontrollers
power pin.
P a g e | 49
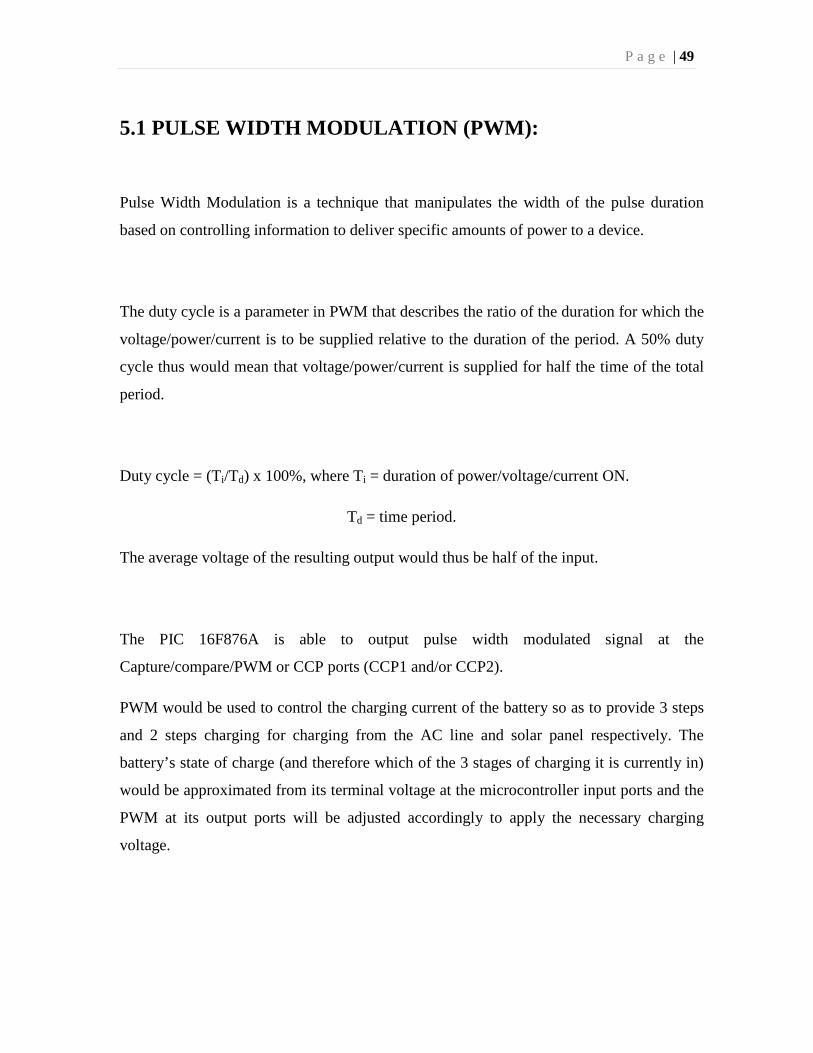
5.1 PULSE WIDTH MODULATION (PWM):
Pulse Width Modulation is a technique that manipulates the width of the pulse duration
based on controlling information to deliver specific amounts of power to a device.
The duty cycle is a parameter in PWM that describes the ratio of the duration for which the
voltage/power/current is to be supplied relative to the duration of the period. A 50% duty
cycle thus would mean that voltage/power/current is supplied for half the time of the total
period.
Duty cycle = (Ti/Td) x 100%, where Ti = duration of power/voltage/current ON.
Td = time period.
The average voltage of the resulting output would thus be half of the input.
The PIC 16F876A is able to output pulse width modulated signal at the
Capture/compare/PWM or CCP ports (CCP1 and/or CCP2).
PWM would be used to control the charging current of the battery so as to provide 3 steps
and 2 steps charging for charging from the AC line and solar panel respectively. The
battery’s state of charge (and therefore which of the 3 stages of charging it is currently in)
would be approximated from its terminal voltage at the microcontroller input ports and the
PWM at its output ports will be adjusted accordingly to apply the necessary charging
voltage.

P a g e | 50
5.2 CHARGE CONTROLLER SET POINTS:
Whenever the battery is going to be charged above 100% state of charge it is said to be
over charged. Whenever the battery is discharged below 20% it is said to be over-
discharged. To prolong battery life the charge controller must ensure the battery remains
within the range of 100% to 20% of state of charge. A set of terminal voltage is found that
corresponds to the 100% and 20% state of charge at a particular charging/discharging
current from the graphs in FIGURE 4.2.3 (a) then based on this a corresponding set of
controller set points can be determined.
The charge controller would then protect the battery from over-charge if the battery
voltage goes beyond its upper set point by disconnecting the solar panel charger from the
battery. It would protect the battery from over-discharge if the battery voltage goes beyond
its lower set point by disconnecting the load from the battery.
P a g e | 51
4 basic controller set points need to establish as follows:
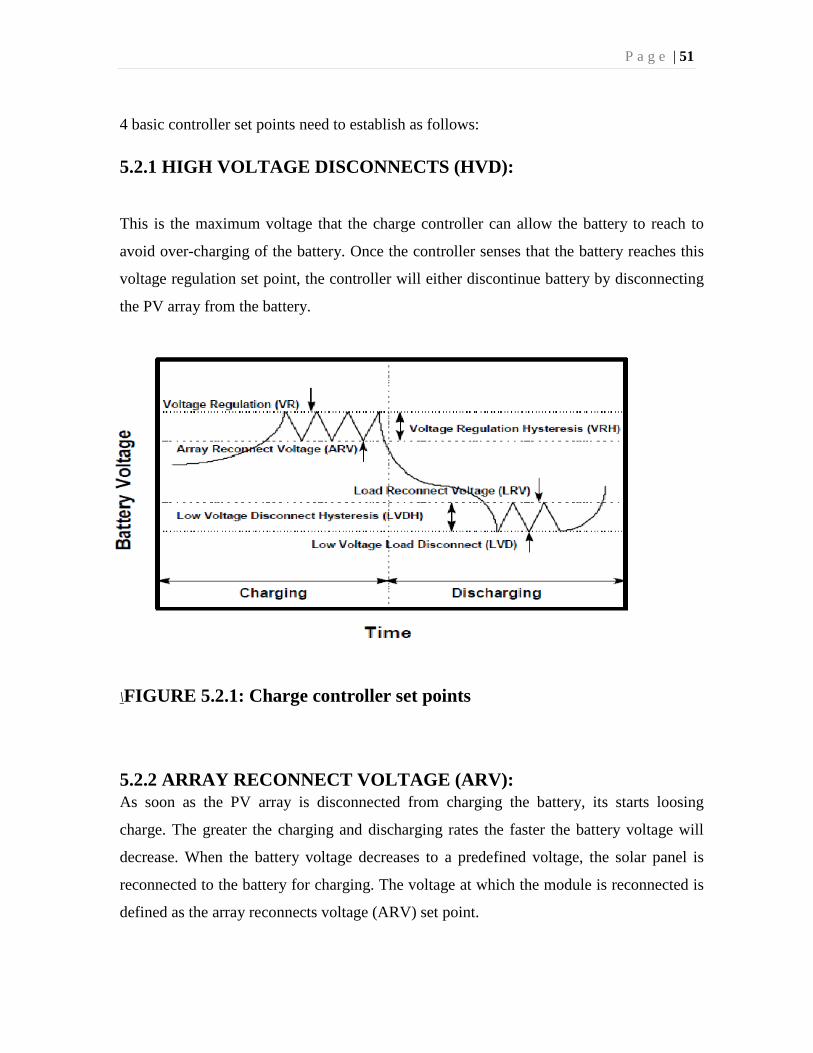
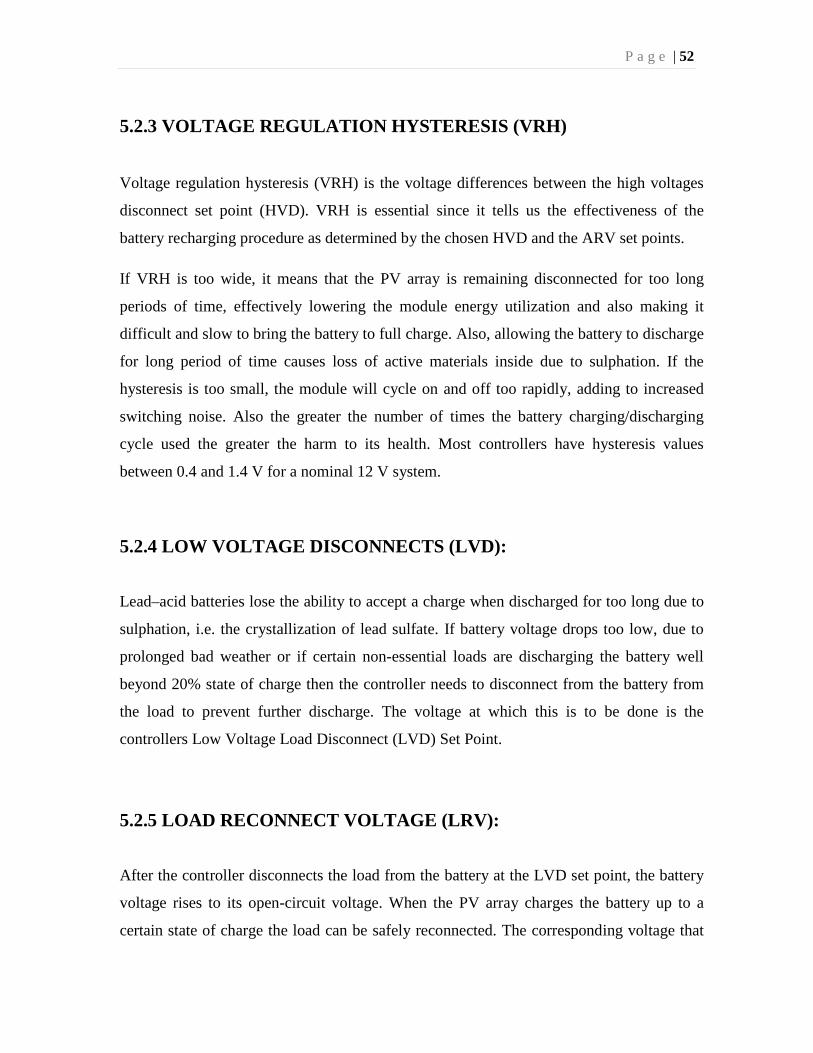
5.2.1 HIGH VOLTAGE DISCONNECTS (HVD):
This is the maximum voltage that the charge controller can allow the battery to reach to
avoid over-charging of the battery. Once the controller senses that the battery reaches this
voltage regulation set point, the controller will either discontinue battery by disconnecting
the PV array from the battery.
\FIGURE 5.2.1: Charge controller set points
5.2.2 ARRAY RECONNECT VOLTAGE (ARV): As soon as the PV array is disconnected from charging the battery, its starts loosing
charge. The greater the charging and discharging rates the faster the battery voltage will
decrease. When the battery voltage decreases to a predefined voltage, the solar panel is
reconnected to the battery for charging. The voltage at which the module is reconnected is
defined as the array reconnects voltage (ARV) set point.
P a g e | 52
5.2.3 VOLTAGE REGULATION HYSTERESIS (VRH)
Voltage regulation hysteresis (VRH) is the voltage differences between the high voltages
disconnect set point (HVD). VRH is essential since it tells us the effectiveness of the
battery recharging procedure as determined by the chosen HVD and the ARV set points.
If VRH is too wide, it means that the PV array is remaining disconnected for too long
periods of time, effectively lowering the module energy utilization and also making it
difficult and slow to bring the battery to full charge. Also, allowing the battery to discharge
for long period of time causes loss of active materials inside due to sulphation. If the
hysteresis is too small, the module will cycle on and off too rapidly, adding to increased
switching noise. Also the greater the number of times the battery charging/discharging
cycle used the greater the harm to its health. Most controllers have hysteresis values
between 0.4 and 1.4 V for a nominal 12 V system.
5.2.4 LOW VOLTAGE DISCONNECTS (LVD):
Lead–acid batteries lose the ability to accept a charge when discharged for too long due to
sulphation, i.e. the crystallization of lead sulfate. If battery voltage drops too low, due to
prolonged bad weather or if certain non-essential loads are discharging the battery well
beyond 20% state of charge then the controller needs to disconnect from the battery from
the load to prevent further discharge. The voltage at which this is to be done is the
controllers Low Voltage Load Disconnect (LVD) Set Point.
5.2.5 LOAD RECONNECT VOLTAGE (LRV):
After the controller disconnects the load from the battery at the LVD set point, the battery
voltage rises to its open-circuit voltage. When the PV array charges the battery up to a
certain state of charge the load can be safely reconnected. The corresponding voltage that
P a g e | 53
defines this safe point is the load reconnects voltage set point. LRV should be 0.5 V higher
than the load-disconnect set point. Typically LVD set points used in small PV systems are
between 12.5 volts and 13.0 V for most nominal 12 V lead-acid batteries. If the LRV set
point is selected too low, the load may be reconnected before the battery has been charged.
5.2.6 LOW VOLTAGE LOAD DISCONNECTS HYSTERESIS (LVLH):
The voltage difference between the low voltage disconnect set point and the load reconnect
voltage is called the low voltage disconnect hysteresis (LVLH). This also works as an
indication of the effectiveness of our Low voltage set points, LVD and LRV. If the low
voltage disconnect hysteresis is too small, the load may cycle on and off rapidly at low
battery state of charge possibly damaging the load or controller, and extending the time it
required to charge the battery fully. If the low voltage disconnect hysteresis is too large the
load may remain off for extended periods until the array fully recharges the battery.
P a g e | 54
5.3 CHARGE CONTROLLER PARAMETERS
Finally the following parameters and set points were decided upon for the charge controller
as inferred from the battery test:
AC (3 steps, due to high charging current):
• Stage 1: 0-14V : 90% PWM charging
• Stage 2: 14-14.2V : 50% PWM charging
• Stage 3: 14.2-14.3V : 10% PWM charging
0% PWM above 14.3V
Solar panel (2 steps, due to high charging current):
• Stage 1: 0-13.4V : 90% PWM charging
• Stage 2: 13.4-13.7V : 10% PWM charging
0% PWM above 13.7V
Low voltage disconnect at 10.8V and reconnect at 12.4V.
Max charging currents:
• 4A for charging via solar panel
• 8A for charging via AC.
Charge controller input voltage and current range for
• AC line charging are 90V and 10 A respectively
• Solar panel charging are 75V and 10 A respectively
This would therefore give us the charging characteristics shown in FIGURE 4.2.4
P a g e | 55
5.4 PROTEUS ISIS IMPLEMENTATION:
5.4.1 VOLTAGE INPUT TO MICROCONTROLLER:
The microcontroller is expected to take decisions based on the terminal voltage of the
battery and the solar panel/AC line. As a result it needs a mechanism to sense the voltage
at the battery terminals precisely. After sensing the voltage the internal Analog to Digital
converter (ADC) module of the PIC 16F876A then digitizes the analog terminal voltage at
its input ports by dividing it into a proportion of 1024 quantized levels to increase the
resolution of the voltage sensed.
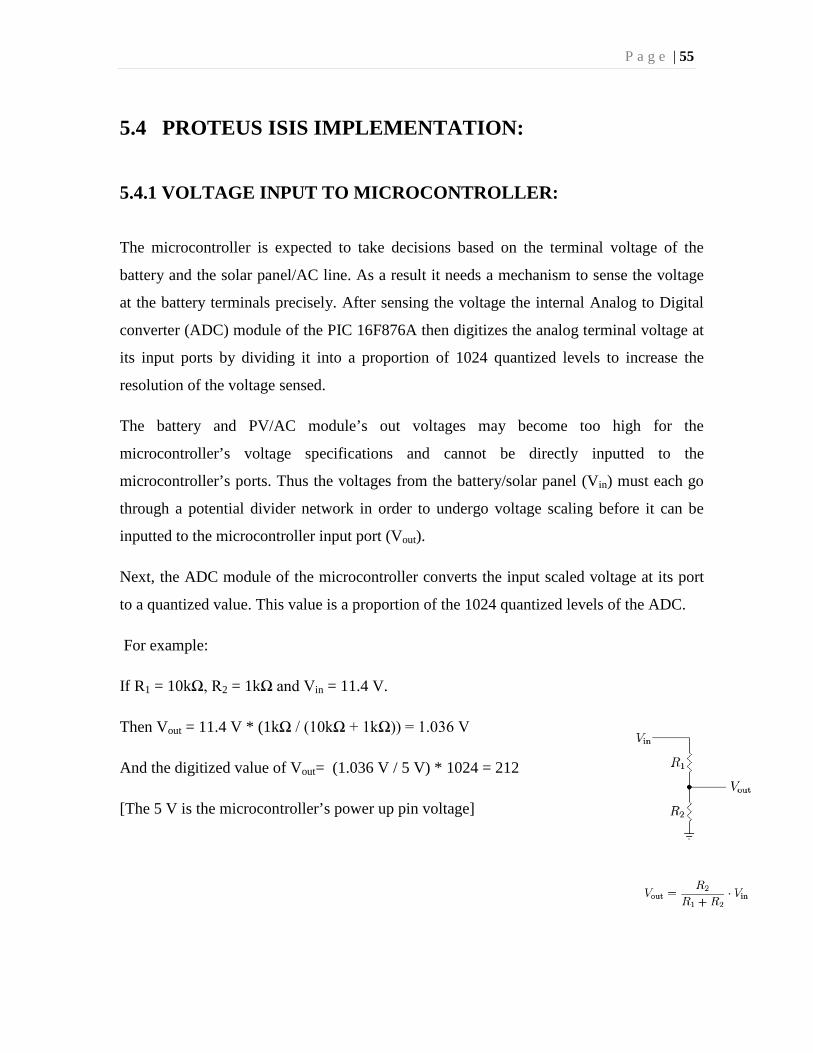
The battery and PV/AC module’s out voltages may become too high for the
microcontroller’s voltage specifications and cannot be directly inputted to the
microcontroller’s ports. Thus the voltages from the battery/solar panel (Vin) must each go
through a potential divider network in order to undergo voltage scaling before it can be
inputted to the microcontroller input port (Vout).
Next, the ADC module of the microcontroller converts the input scaled voltage at its port
to a quantized value. This value is a proportion of the 1024 quantized levels of the ADC.
For example:
If R1 = 10kΩ, R2 = 1kΩ and Vin = 11.4 V.
Then Vout = 11.4 V * (1kΩ / (10kΩ + 1kΩ)) = 1.036 V
And the digitized value of Vout= (1.036 V / 5 V) * 1024 = 212
[The 5 V is the microcontroller’s power up pin voltage]
P a g e | 56
If R1 = 10kΩ, R2 = 1kΩ and Vin = 11.4 V.
Then Vout = 11 V * (1kΩ / (10kΩ + 1kΩ)) = 1.0 V
And the digitized value of Vout= (1.0 V / 5 V) * 1024 = 204
[The 5 V is the microcontroller’s power up pin voltage]
It is observed that using the ADC module allows us to break down even a small difference
of (11.4 – 11) = 0.4 V into a larger difference of (212-204) = 8 quantized levels. Thus
an increase in operating resolution is obtained.
NB: The resistor network’s job is to scale the voltage of the solar panels and battery down
to levels acceptable by the microcontroller. Therefore the values R1 & R2 are not in fact
arbitrarily chosen. They have to be calculated according to the max value outputted by the
solar panel and the battery as well as the max value acceptable by the microcontroller.
If Vimax = max voltage that can be outputted by the solar panel or battery.
&Vomax = max voltage that can be input to the microcontroller port.
Then, Vomax = (R2 / (R1 + R2)) * Vimax
Therefore conversely, R2 = R1 * (Vomax / (Vimax –Vomax))
So if R1 is chosen arbitrarily (within acceptable limits of course) then R2 must be chosen
according to the above equation.
For the circuit it was assumed that R1 = 1500k, which produced R2 = 100k according to the
above calculations for the solar panel where maximum voltage is expected to be 80 V. For
the battery, the maximum voltage being expected to be 75V, R1 = 1400k, which produced
R2 = 100k
P a g e | 57
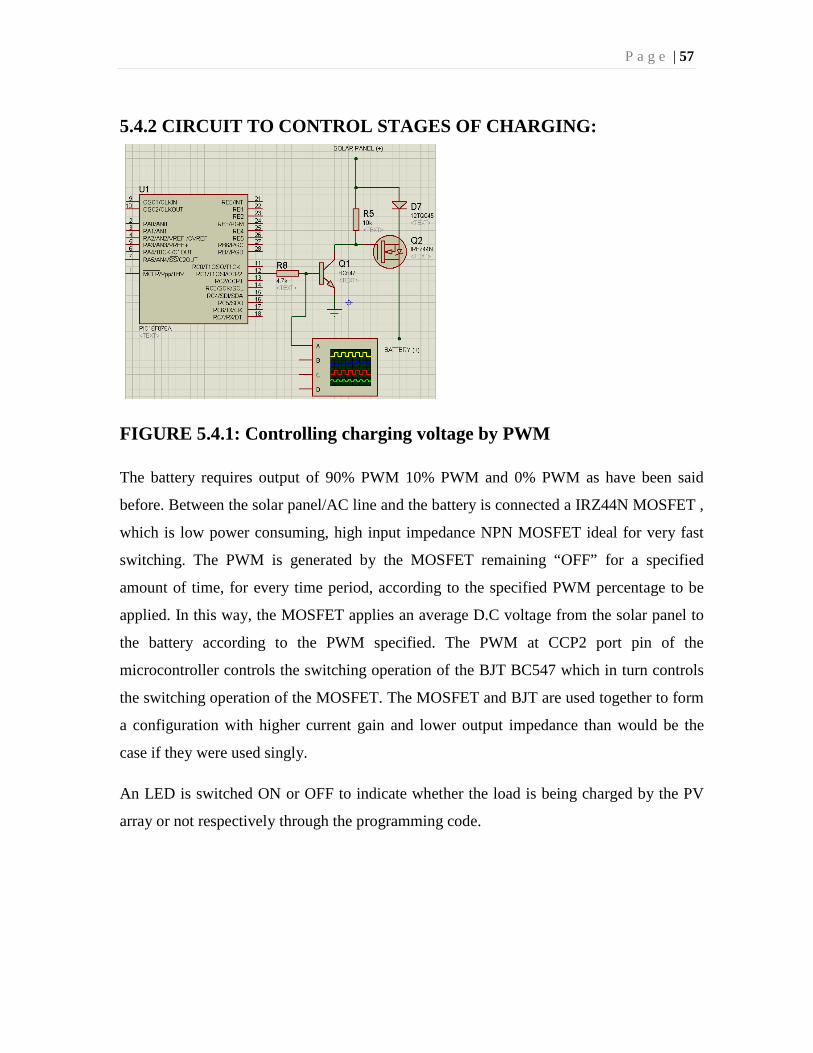
5.4.2 CIRCUIT TO CONTROL STAGES OF CHARGING:
FIGURE 5.4.1: Controlling charging voltage by PWM
The battery requires output of 90% PWM 10% PWM and 0% PWM as have been said
before. Between the solar panel/AC line and the battery is connected a IRZ44N MOSFET ,
which is low power consuming, high input impedance NPN MOSFET ideal for very fast
switching. The PWM is generated by the MOSFET remaining “OFF” for a specified
amount of time, for every time period, according to the specified PWM percentage to be
applied. In this way, the MOSFET applies an average D.C voltage from the solar panel to
the battery according to the PWM specified. The PWM at CCP2 port pin of the
microcontroller controls the switching operation of the BJT BC547 which in turn controls
the switching operation of the MOSFET. The MOSFET and BJT are used together to form
a configuration with higher current gain and lower output impedance than would be the
case if they were used singly.
An LED is switched ON or OFF to indicate whether the load is being charged by the PV
array or not respectively through the programming code.
P a g e | 58
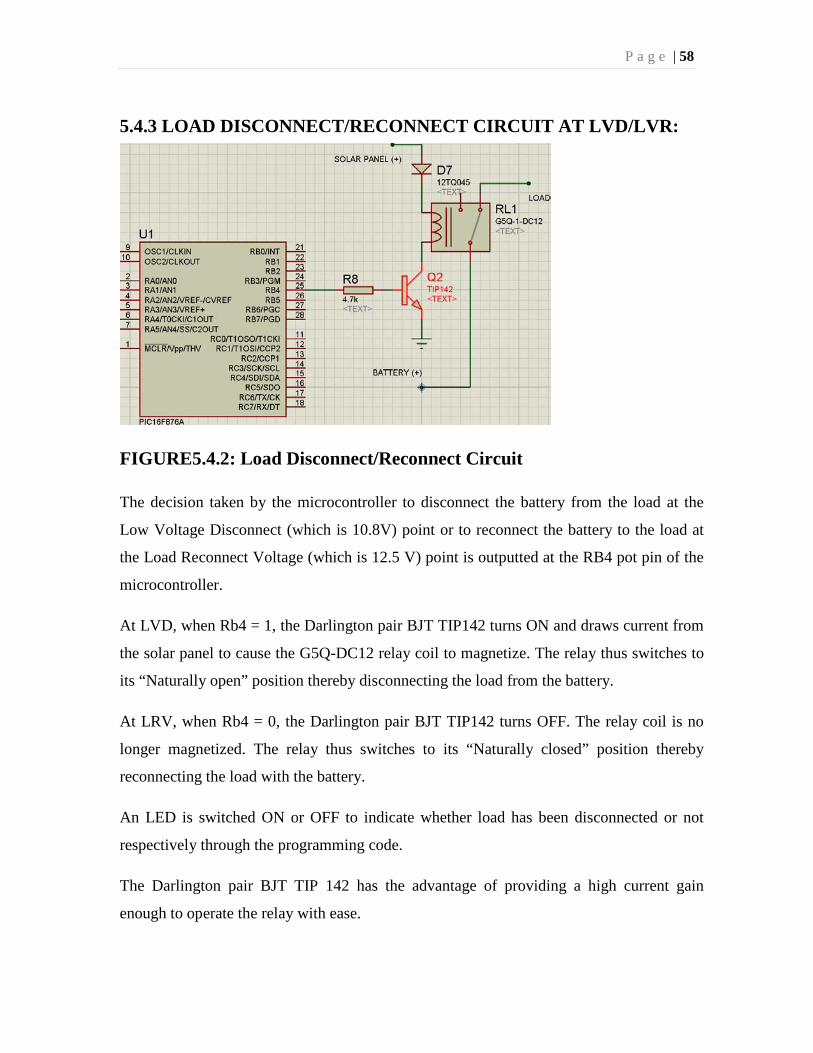
5.4.3 LOAD DISCONNECT/RECONNECT CIRCUIT AT LVD/LVR:
FIGURE5.4.2: Load Disconnect/Reconnect Circuit
The decision taken by the microcontroller to disconnect the battery from the load at the
Low Voltage Disconnect (which is 10.8V) point or to reconnect the battery to the load at
the Load Reconnect Voltage (which is 12.5 V) point is outputted at the RB4 pot pin of the
microcontroller.
At LVD, when Rb4 = 1, the Darlington pair BJT TIP142 turns ON and draws current from
the solar panel to cause the G5Q-DC12 relay coil to magnetize. The relay thus switches to
its “Naturally open” position thereby disconnecting the load from the battery.
At LRV, when Rb4 = 0, the Darlington pair BJT TIP142 turns OFF. The relay coil is no
longer magnetized. The relay thus switches to its “Naturally closed” position thereby
reconnecting the load with the battery.
An LED is switched ON or OFF to indicate whether load has been disconnected or not
respectively through the programming code.
The Darlington pair BJT TIP 142 has the advantage of providing a high current gain
enough to operate the relay with ease.

P a g e | 59
The G5Q-DC12 is a 10A 12 V relay and is ideal for our purpose.
The Schottky diode 12TQ045 is used here and at their positions throughout the circuit,
especially between solar panel (+) and battery (+) (in a forward based orientation from
panel to battery). This is to make sure that at times when the PV module is generating
lower voltage than the terminal voltage of the battery (at night for example), current would
not flow from the battery to the solar panel.
The LVD and LRV sequence of programming along with their circuitry remains
independent of whether the charging is being done by the utility line or the PV array.
It is to be noted that although the relay G5Q-DC12 was used on proteus, in practice this
cannot handle the maximum current of 30 A or more that could be flowing between the
battery and solar pane/AC line. Thus a magnetic contactor was used in its place which has
the same basic principle as that of a relay but can handle much higher current and voltages.
5.4.4 OVER-VOLTAGE PROTECTION:
FIGURE 5.4.3: Over-voltage protection network
The PV panel might generate extreme levels of voltages which can harm the circuitry. As a
result a network of zener diodes BZX79C24 (24V) are connected in parallel across the PV
panel terminals in a reverse biased configuration. This clips the voltage of the solar
panel/AC line at 80 V.
P a g e | 60
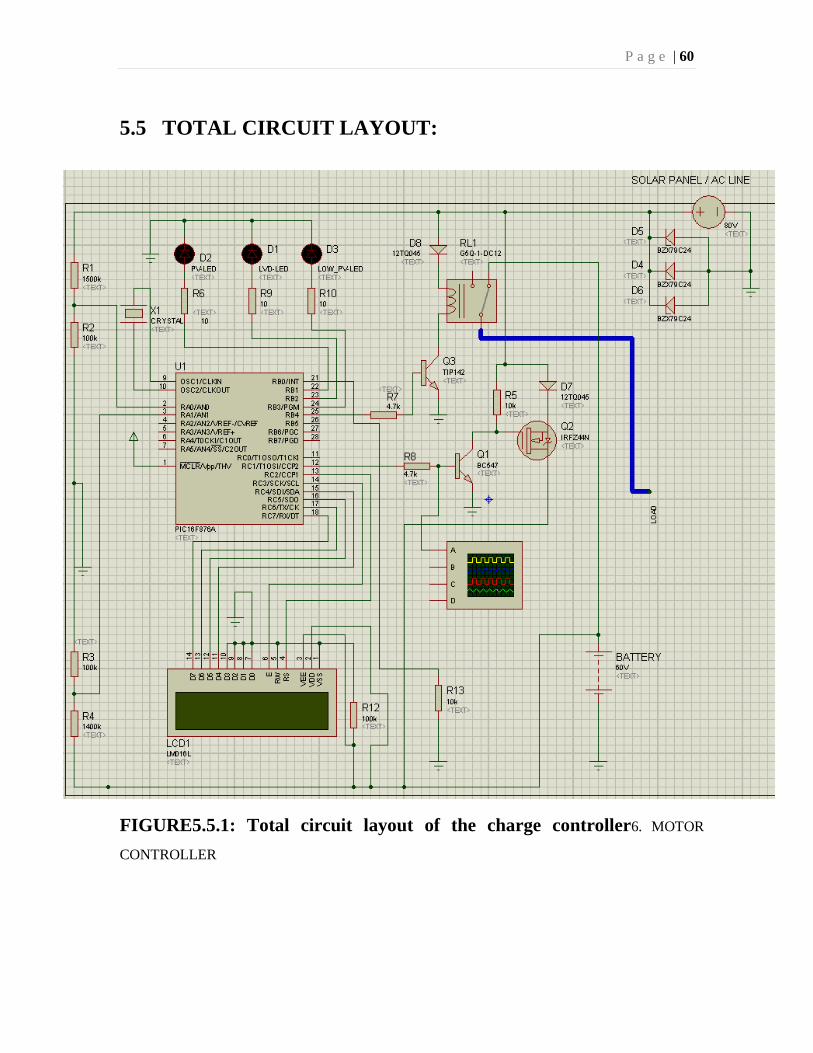
5.5 TOTAL CIRCUIT LAYOUT:
FIGURE5.5.1: Total circuit layout of the charge controller6. MOTOR
CONTROLLER
P a g e | 61
6. MOTOR
6.1 MOTOR SPECIFICATIONS
• Type: DC series excitation motor (brushed) • Company: Changzhou Danye Motor Factory • Rated Power: 1 kW • Rated Current: 23 A • Rated Voltage: 60 V • Insulation class: E
Note to be made here is that although the calculations in SECTION 2.2 showed we need a higher power motor, but due to lack of availability this motor was chosen instead.
P a g e | 62
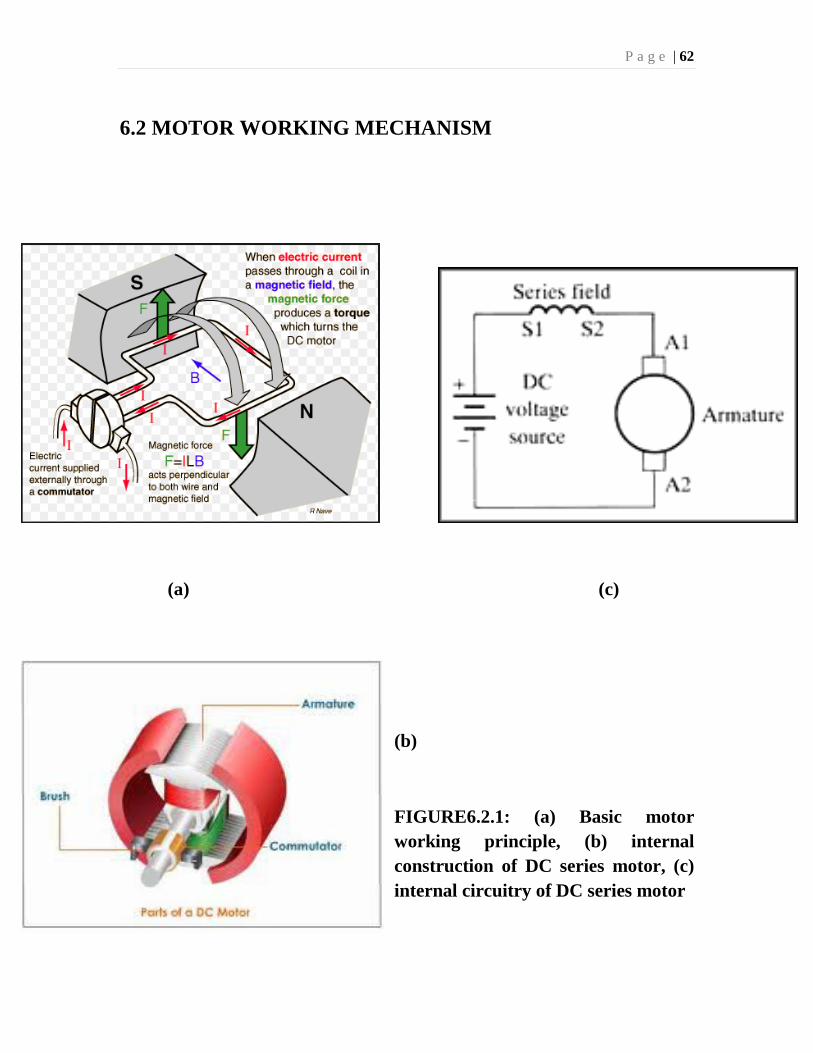
6.2 MOTOR WORKING MECHANISM
(a) (c)
(b)
FIGURE6.2.1: (a) Basic motor working principle, (b) internal construction of DC series motor, (c) internal circuitry of DC series motor

P a g e | 63
The DC series excitation motor is one of the simplest types. The brushed type was chosen
for its simplicity and it generates torque directly from DC power supplied to the motor.
This makes it easier to control its speed and direction of rotation.
The basic working principle of electric motors is shown in FIGURE 6.2.1(a). The
magnetic flux generated when current passes through the rotor coils interact with the
magnetic flux of the magnet causes rotational motion of the coil. In other words the
electrical energy in the rotor and armature is converted to mechanical energy at the motor
shaft.
For the DC series motor, the permanent magnet is replaced by another coil winding
called the armature winding which generates a magnetic field when current flows through
it. This is shown in FIGURE 6.2.1(b)
The internal circuitry of the DC series motor is shown in FIGURE6.2.1(c). The
armature and field windings are in series with DC voltage to be applied. The greater the
DC applied voltage the greater the rotational speed.
P a g e | 64
6.3 SPEED CONTROL:
As mentioned before the rotational speed of a DC motor is proportional to the EMF in its
coil and the torque is proportional to the current. Speed control can be achieved by
variable battery tapings, variable supply voltage, resistors or electronic controls.
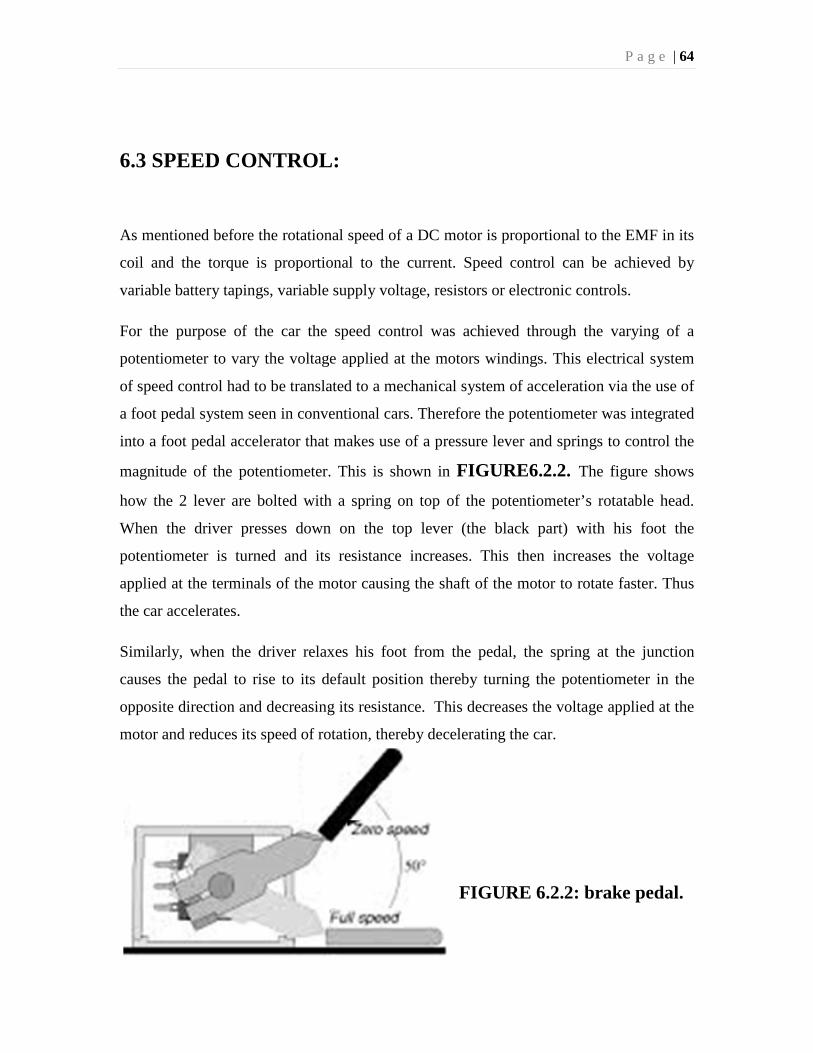
For the purpose of the car the speed control was achieved through the varying of a
potentiometer to vary the voltage applied at the motors windings. This electrical system
of speed control had to be translated to a mechanical system of acceleration via the use of
a foot pedal system seen in conventional cars. Therefore the potentiometer was integrated
into a foot pedal accelerator that makes use of a pressure lever and springs to control the
magnitude of the potentiometer. This is shown in FIGURE6.2.2. The figure shows
how the 2 lever are bolted with a spring on top of the potentiometer’s rotatable head.
When the driver presses down on the top lever (the black part) with his foot the
potentiometer is turned and its resistance increases. This then increases the voltage
applied at the terminals of the motor causing the shaft of the motor to rotate faster. Thus
the car accelerates.
Similarly, when the driver relaxes his foot from the pedal, the spring at the junction
causes the pedal to rise to its default position thereby turning the potentiometer in the
opposite direction and decreasing its resistance. This decreases the voltage applied at the
motor and reduces its speed of rotation, thereby decelerating the car.
FIGURE 6.2.2: brake pedal.
P a g e | 65
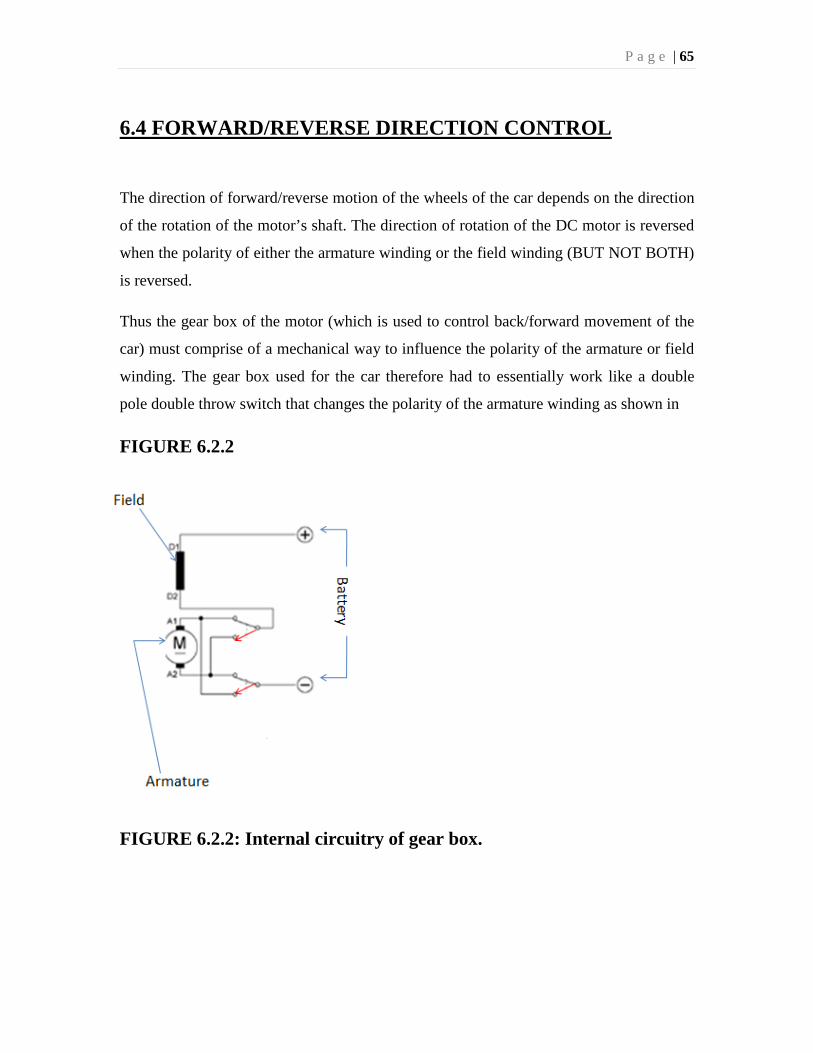
6.4 FORWARD/REVERSE DIRECTION CONTROL
The direction of forward/reverse motion of the wheels of the car depends on the direction
of the rotation of the motor’s shaft. The direction of rotation of the DC motor is reversed
when the polarity of either the armature winding or the field winding (BUT NOT BOTH)
is reversed.
Thus the gear box of the motor (which is used to control back/forward movement of the
car) must comprise of a mechanical way to influence the polarity of the armature or field
winding. The gear box used for the car therefore had to essentially work like a double
pole double throw switch that changes the polarity of the armature winding as shown in
FIGURE 6.2.2
FIGURE 6.2.2: Internal circuitry of gear box.
P a g e | 66
The polarity of the applied voltage from the battery over the entire motor is kept constant
- the +ve polarity at top and –ve polarity at the bottom.
When the switches of the DPDT are in their default position (BLACK LINES) the
polarity of :
• The field windings is +ve at top and –ve at bottom
• The armature winding is +ve at top and –ve at bottom.
When the switches of the DPDT are in their new position (RED LINES) the polarity of:
• The field windings is +ve at top and –ve at bottom
• The armature winding is -ve at top and +ve at bottom.
Thus changing the positions of the switches of the DPDT (which is done by moving the
gear in the gear box forward/backward) the polarity of only the armature winding is
reversed. Thus the direction of the rotation of the shaft of the motor reverses and so does
the direction of rotation of the wheels of the car.

P a g e | 67
7. POWER SUPPLY AND VARIAC:
7.1 INTRODUCTION:
At the intermediate stage of development, there was a need to test the DC motor’s
performance. As a result a means of providing controllable high DC voltage and current
supply was necessary. Therefore a combination of a variac and a AC to DC power
supply was constructe for motor testing purposes.
7.2 AC TO DC RECTIFICATION
An AC-DC power supply was designed to charge the battery and drive the motor. Two
Full bridge rectifier is connected to transformer and one 10000uF capacitor is connected
in parallel with the rectifier. KBPC3510 full bridge rectifier is used to rectify the AC
voltage. The current rating of the rectifier is 30A.
FIGURE 7.2: AC – DC rectification circuit
P a g e | 68
7.2.1 TRANSFORMER SELECTION:
To charge the battery and test the motor the desired output of power supply had to be at
least 75V, while the input voltage would be 220V. Hence the design of the transformer
would depend on the ratio of the primary to secondary winding. If the primary voltage
from utility source is Vp and secondary voltage of transformer is Vs.
∴Vp/Vs = a (turn ratio)
or, Vp/a =Vs
or, Vs = 220/4 V (where a=4, Vp = 220 V)
= 55 V
∴ Vs (peak) = √2 × 55 V
= 77.9 V
So, secondary current of the transformer will be 4 times of primary current.
Is = 4 × Ip
7.2.2 VARIAC SELECTION:
To control the output voltage we will be using a variac, vairac’s constant current rating is
subject to output current drawn by motor.
The highest current motor will draw is 27 A (Iexc). Variac constant current rating (primary
current Ip) should be 4 × Ip ≥27 A (at or less than 120% of input voltage).
∴ Ip≥ 27/4
P a g e | 69
∴ Ip ≥ 6.25 A
∴ Ip (Peak) = √2 × 6.25
= 8.84 A
∴ Is (Peak) = 4 × 8.84 A
= 35.36 A
Average DC current is following,
Iavg = 0.62 × Is (Peak of AC current)
= 21.92 A
7.2.3 AVAILABLE VARIACS IN THE MARKET:
*1000 VA
Input Voltage : 0 ~ 220 𝑉𝑉
Output Voltage : 0 ~ 240 𝑉𝑉
Constant Current rating = 1000 ÷ 240
= 4.17 A
*2000 VA
Input Voltage : 0 ~ 220 𝑉𝑉
Output Voltage : 0 ~ 250 𝑉𝑉
Constant Current rating = 2000 ÷ 250
= 8 A
Therefore according to motor specification and current rating calculation a 2000 VA
variac was used
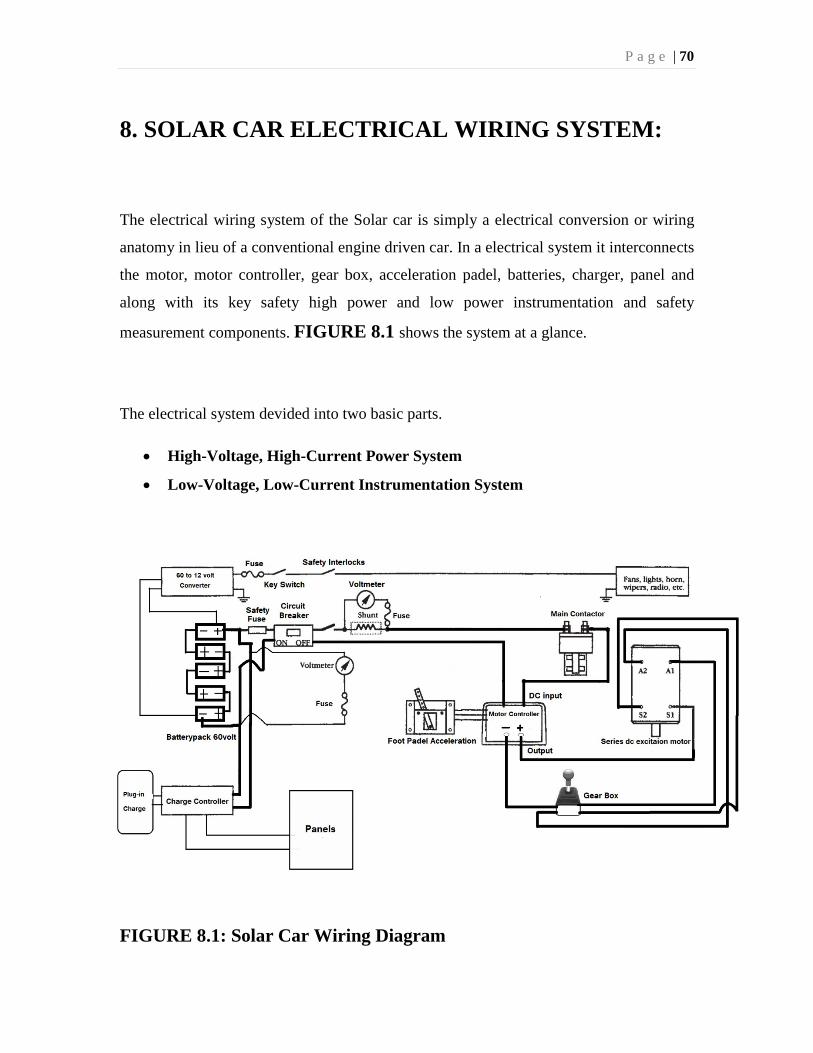
P a g e | 70
8. SOLAR CAR ELECTRICAL WIRING SYSTEM:
The electrical wiring system of the Solar car is simply a electrical conversion or wiring
anatomy in lieu of a conventional engine driven car. In a electrical system it interconnects
the motor, motor controller, gear box, acceleration padel, batteries, charger, panel and
along with its key safety high power and low power instrumentation and safety
measurement components. FIGURE 8.1 shows the system at a glance.
The electrical system devided into two basic parts.
• High-Voltage, High-Current Power System
• Low-Voltage, Low-Current Instrumentation System
FIGURE 8.1: Solar Car Wiring Diagram
P a g e | 71
8.1HIGH-VOLTAGE, HIGH-CURRENT POWER SYSTEM: The bold and thick lines in FIGURE 8.1denote the high-current connections. In this
part motor controller, motor, battery and gear box are the main components to be put
together in solar car. Other than these some safety instruments and voltage-current
reading circuitry is also connected.
In the following section the high-current components are discussed in detail.
8.2 MOTOR CONTROLLER: The motor controller allows the motor to rotate at different speed; it takes the input from
the battery and gives output for motor. The controller used in the solar car has an input
and output rating of 48 to 60 volt and has a current rating of max 30 ampere. There are
two outputs from the motor controller, one for the acceleration pedal and other for the
motor. The internal circuitry for acceleration control further converts the input voltage
into low current system.
8.3 MAIN CONTACTER: A DC or main contactor works just like relay. Its heavy duty contacts (typically rated at
30 to 60 ampere) allow us to control heavy currents with a low-voltage. A single-pole,
normally open main contractor is placed in the high-current circuit between the battery
and motor controller. When it is energized typically by turning the ignition switch on-
high current power is made available to the motor controller which then follows to the
motor. It is also put for an emergency shutdown option, for example when the battery
reaches its minimum depth of discharge the motor has to be disconnected; in this case the
contactor is disconnected to make sure no more current is drawn from the battery by
motor provided that the electrical system is active by any means.
P a g e | 72
8.4 MAIN CIRCUIT BREAKER AND SAFETY FUSE:
A DC circuit breaker is like a switch and resetting fuse. The purpose of this heavy-duty
circuit breaker (typically rated at 50 to 150 A) is to instantly interrupt main battery power
in the event of a drive system malfunction and to routinely interrupt battery power when
servicing and recharging. For convenience, this circuit breaker is normally located near
the battery pack. The purpose of the safety fuse is to interrupt current flow in the event of
an inadvertent short-circuit across the battery pack.
8.5 GEAR BOX:
It is a mechanical based system with three gear position to change the motor direction.
The two end of motor armature windings and one end of the field winding is connected to
gear the box, the other end of the field winding takes output from the motor controller,
for certain orientation of gear box connection the gear shaft changes the polarity of the
motor by positioning a metal contact in between the armature and field windings
connections. The mechanism has been described in detail in the “Motor Controller”
section in 6.4.
8.6 SHUNTS:
Shunts are precisely calibrated resistors that enable current flow in a circuit to be
determined by measuring the voltage drop across them. A voltmeter is placed over the
shunt. The voltage drop in the shunt is divided by the shunt value to obtain the current
drawn by motor.

P a g e | 73
8.7 Low voltage low current instrumentation system:
The instrumentation system includes a key switch, throttle control, monitoring wiring and
60 to 12 volt converter. The low voltage power source will simply be provided from the
car’s battery pack by using 60 to 12 converter. This will help us to avoid an extra charge
controller installation for using an auxiliary battery. Using a converter will thus require
only one charge controller for the entire system.
P a g e | 74
9. DESIGNING THE CHASSIS AND MECHANICAL SYSTEM INSTALLAION
9.1 INTRODUCTION:
In general, when to design, it is good to keep the different parts in mind. Keeping the
weight of a Solar Powered car’s bodywork down is almost as important as making sure it
slides through the air gracefully where the mass of the vehicle determines the rolling
resistance, and the rate of acceleration. The shape of the bodywork determines the
aerodynamic drag, which above 25 mph can rise significantly.
In the project we are working by a fixed solar panel. Therefore our design on the
dimension of the panel
Length-545 cm
Width-535 cm
Thickness- 3 cm
Weight- 0.7 KG
Another consideration is weight and stiffness. To make the car light in weight the body
material should be as light as possible. On the other hand the material should be enough
stiffer to carry the load.
P a g e | 75
9.2 MATERIALS: MS box (mild steel box) was used for building the body of the car.
9.2.1 DESCRIPTION OF THE MS BOX:
Mild steel is sometimes referred to as carbon steel or plain steel. Typically, it is stiff and
strong. Carbon steels do rust easily, but they can be easily painted or primed. They are
cheap so they are the normal choice for most fabrications. Mild Steel can be easily cut or
drilled to meet our requests.
Mild Steel Box Section is also known as Mild Steel Hollow Section or ERW Tube, and
can either be Square Box or Rectangular Box, depending on which we require. They are
frequently used for general fabrication and construction. Box sections are stocked in are
stocked in either 1.5m lengths, 3m lengths or 6m lengths – all of which can be cut exactly
to your measurements!
9.2.2 DIMENSION OF THE MATERIAL: Length-25 mm
Width-25 mm
Thickness-3 mm
The body is made stiffer by adding strips of material by side ways. This method makes
the body stiffer without using more amount of material.
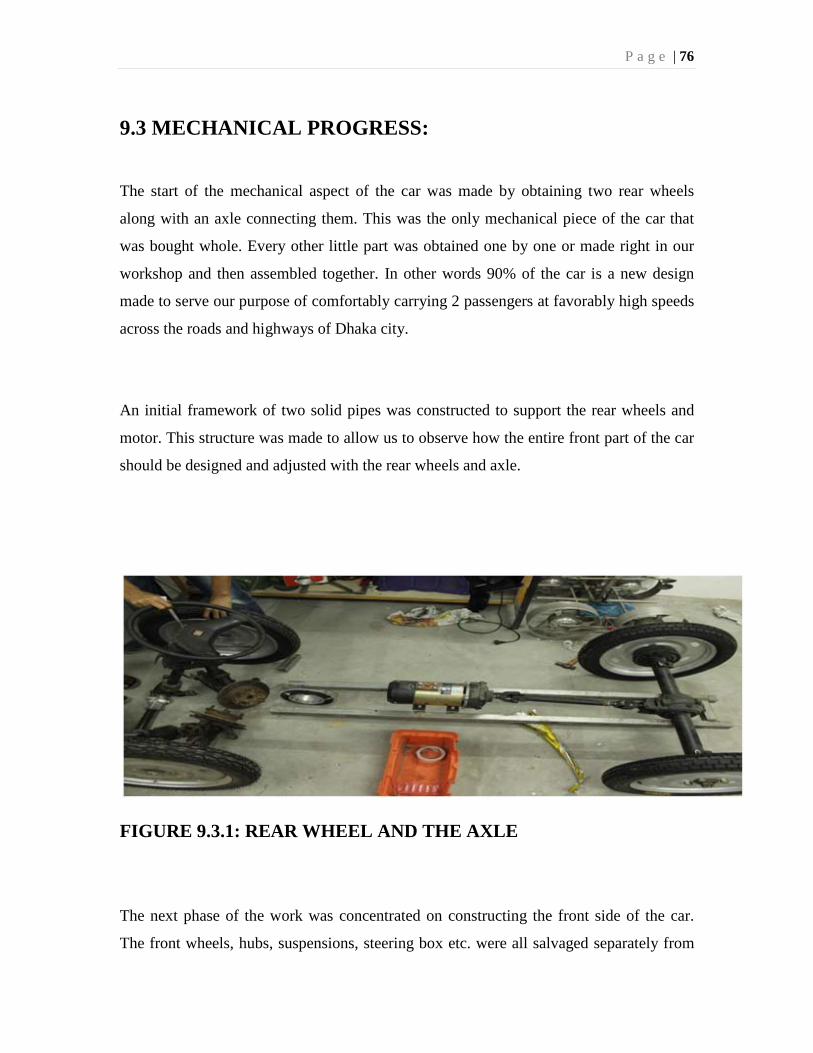
P a g e | 76
9.3 MECHANICAL PROGRESS:
The start of the mechanical aspect of the car was made by obtaining two rear wheels
along with an axle connecting them. This was the only mechanical piece of the car that
was bought whole. Every other little part was obtained one by one or made right in our
workshop and then assembled together. In other words 90% of the car is a new design
made to serve our purpose of comfortably carrying 2 passengers at favorably high speeds
across the roads and highways of Dhaka city.
An initial framework of two solid pipes was constructed to support the rear wheels and
motor. This structure was made to allow us to observe how the entire front part of the car
should be designed and adjusted with the rear wheels and axle.
FIGURE 9.3.1: REAR WHEEL AND THE AXLE
The next phase of the work was concentrated on constructing the front side of the car.
The front wheels, hubs, suspensions, steering box etc. were all salvaged separately from
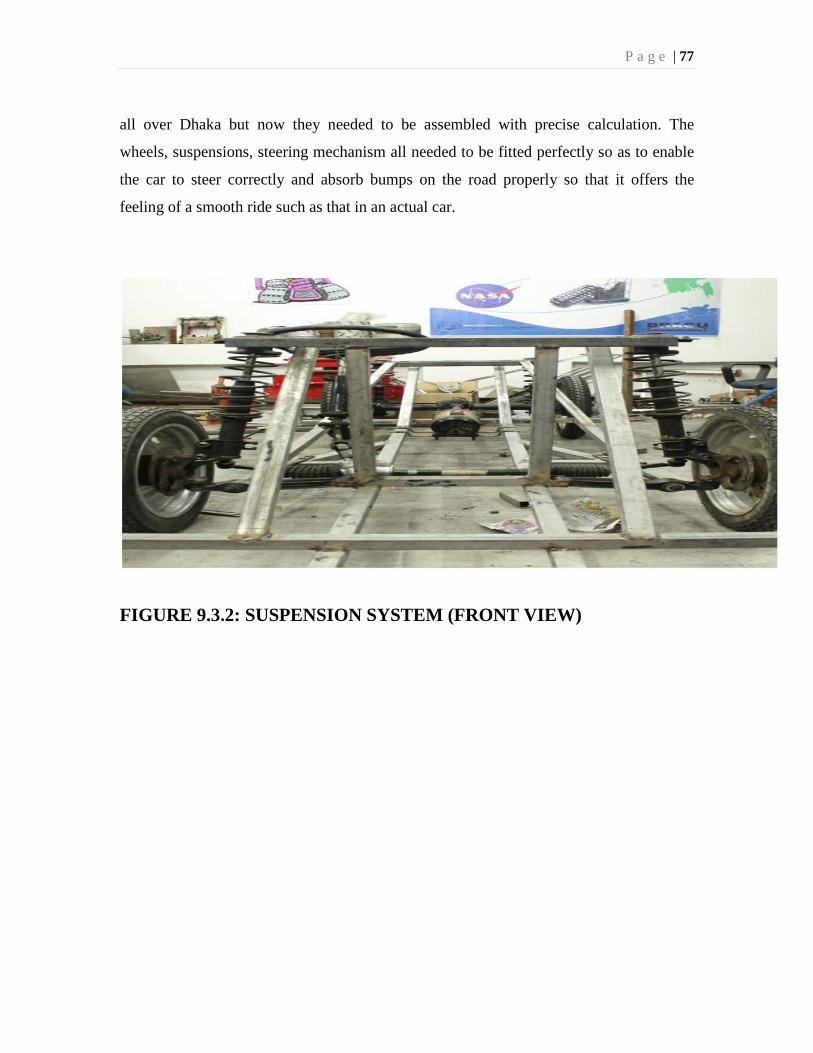
P a g e | 77
all over Dhaka but now they needed to be assembled with precise calculation. The
wheels, suspensions, steering mechanism all needed to be fitted perfectly so as to enable
the car to steer correctly and absorb bumps on the road properly so that it offers the
feeling of a smooth ride such as that in an actual car.
FIGURE 9.3.2: SUSPENSION SYSTEM (FRONT VIEW)
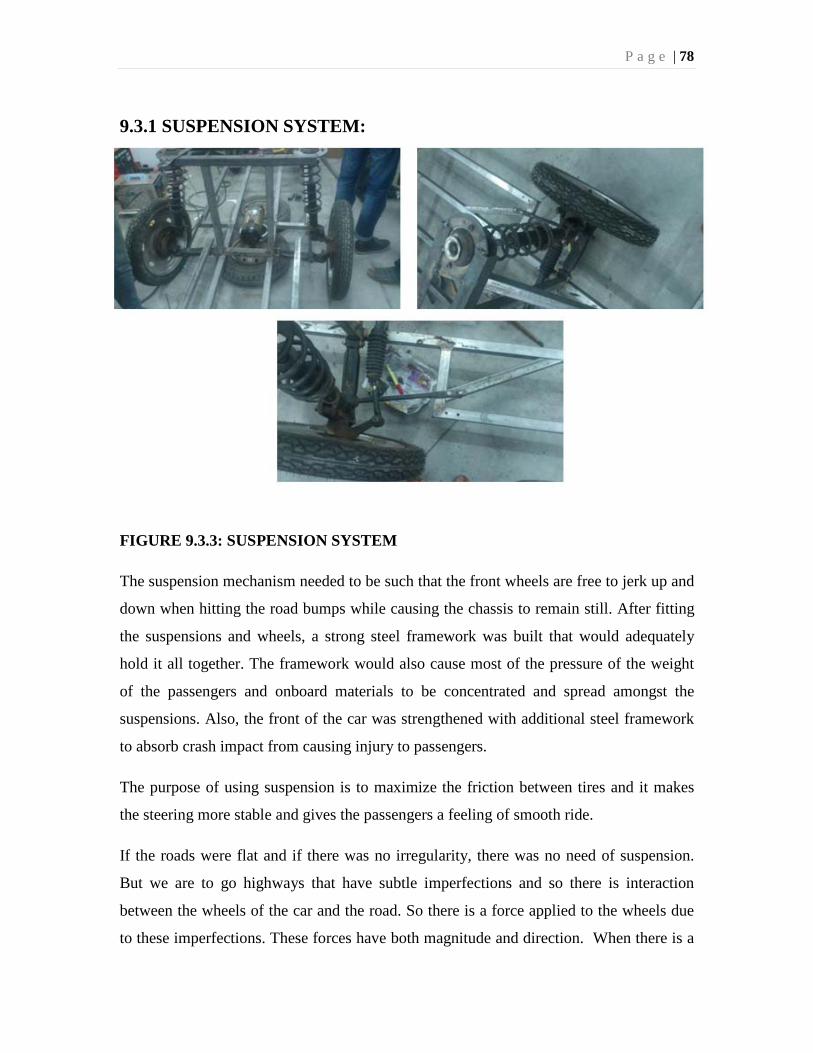
P a g e | 78
9.3.1 SUSPENSION SYSTEM:
FIGURE 9.3.3: SUSPENSION SYSTEM
The suspension mechanism needed to be such that the front wheels are free to jerk up and
down when hitting the road bumps while causing the chassis to remain still. After fitting
the suspensions and wheels, a strong steel framework was built that would adequately
hold it all together. The framework would also cause most of the pressure of the weight
of the passengers and onboard materials to be concentrated and spread amongst the
suspensions. Also, the front of the car was strengthened with additional steel framework
to absorb crash impact from causing injury to passengers.
The purpose of using suspension is to maximize the friction between tires and it makes
the steering more stable and gives the passengers a feeling of smooth ride.
If the roads were flat and if there was no irregularity, there was no need of suspension.
But we are to go highways that have subtle imperfections and so there is interaction
between the wheels of the car and the road. So there is a force applied to the wheels due
to these imperfections. These forces have both magnitude and direction. When there is a
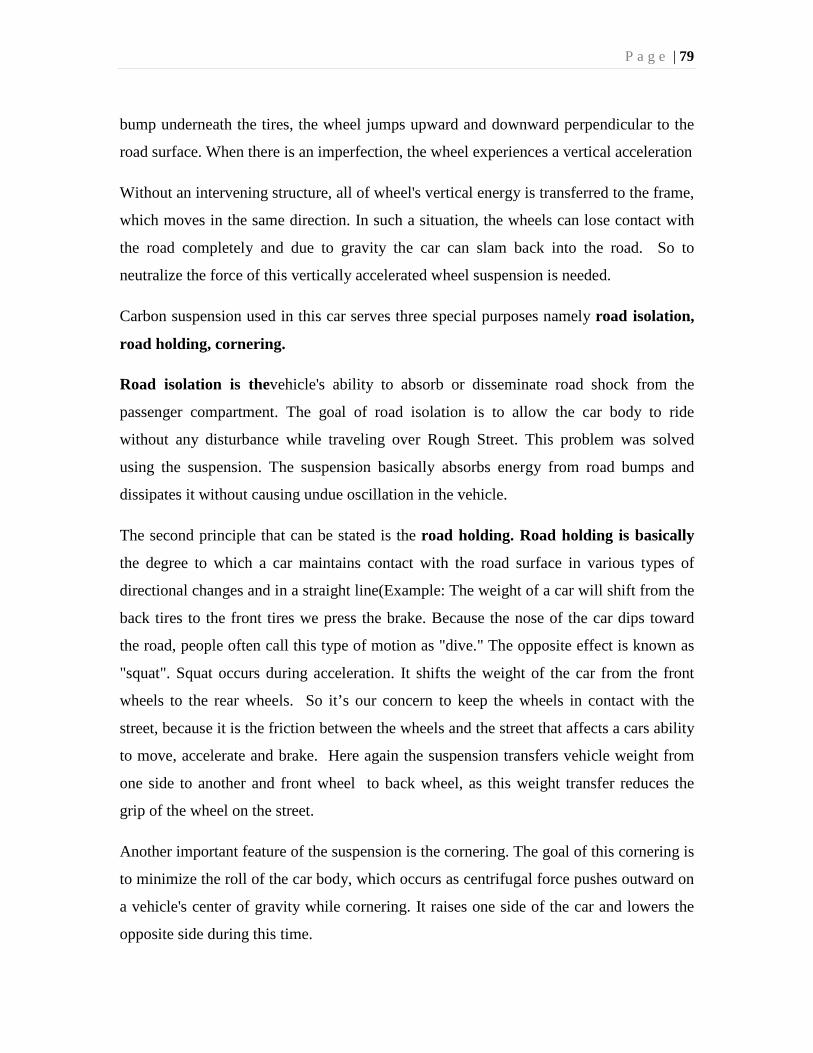
P a g e | 79
bump underneath the tires, the wheel jumps upward and downward perpendicular to the
road surface. When there is an imperfection, the wheel experiences a vertical acceleration
Without an intervening structure, all of wheel's vertical energy is transferred to the frame,
which moves in the same direction. In such a situation, the wheels can lose contact with
the road completely and due to gravity the car can slam back into the road. So to
neutralize the force of this vertically accelerated wheel suspension is needed.
Carbon suspension used in this car serves three special purposes namely road isolation,
road holding, cornering.
Road isolation is thevehicle's ability to absorb or disseminate road shock from the
passenger compartment. The goal of road isolation is to allow the car body to ride
without any disturbance while traveling over Rough Street. This problem was solved
using the suspension. The suspension basically absorbs energy from road bumps and
dissipates it without causing undue oscillation in the vehicle.
The second principle that can be stated is the road holding. Road holding is basically
the degree to which a car maintains contact with the road surface in various types of
directional changes and in a straight line(Example: The weight of a car will shift from the
back tires to the front tires we press the brake. Because the nose of the car dips toward
the road, people often call this type of motion as "dive." The opposite effect is known as
"squat". Squat occurs during acceleration. It shifts the weight of the car from the front
wheels to the rear wheels. So it’s our concern to keep the wheels in contact with the
street, because it is the friction between the wheels and the street that affects a cars ability
to move, accelerate and brake. Here again the suspension transfers vehicle weight from
one side to another and front wheel to back wheel, as this weight transfer reduces the
grip of the wheel on the street.
Another important feature of the suspension is the cornering. The goal of this cornering is
to minimize the roll of the car body, which occurs as centrifugal force pushes outward on
a vehicle's center of gravity while cornering. It raises one side of the car and lowers the
opposite side during this time.
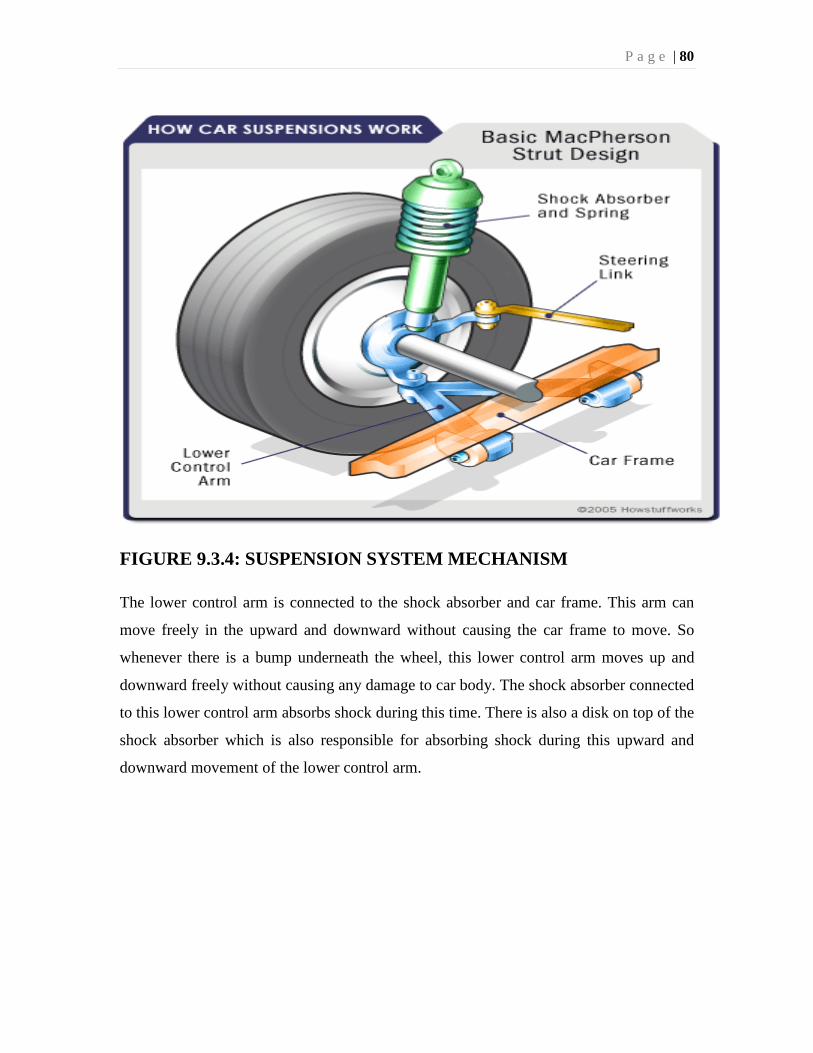
P a g e | 80
FIGURE 9.3.4: SUSPENSION SYSTEM MECHANISM
The lower control arm is connected to the shock absorber and car frame. This arm can
move freely in the upward and downward without causing the car frame to move. So
whenever there is a bump underneath the wheel, this lower control arm moves up and
downward freely without causing any damage to car body. The shock absorber connected
to this lower control arm absorbs shock during this time. There is also a disk on top of the
shock absorber which is also responsible for absorbing shock during this upward and
downward movement of the lower control arm.
P a g e | 81
9.3.2 SUSPENSION SYSTEM INSTALLATION:
Tools used for this installation:
Vice-grips - To hold the shock absorber piston while changing the old nut off the
previous shock.
Ratchet - To remove the lower nuts off shock mount on the lower control arm.
Jack stand –It was used for safety purpose. It was used when using jack on
suspension lower control arm.
Jack - To lift up the wheel and suspension couple of inches and to help compress the
shock absorber.
Hammer - To tap on lower mounting to loosen the shock free.
Allen Key –It was used on new shock. It was used when we installed top shock
mounting and hardware.
Screwdriver - To pop off the brake line clip off shock absorber.
Wrench - To take off upper shock absorber nut
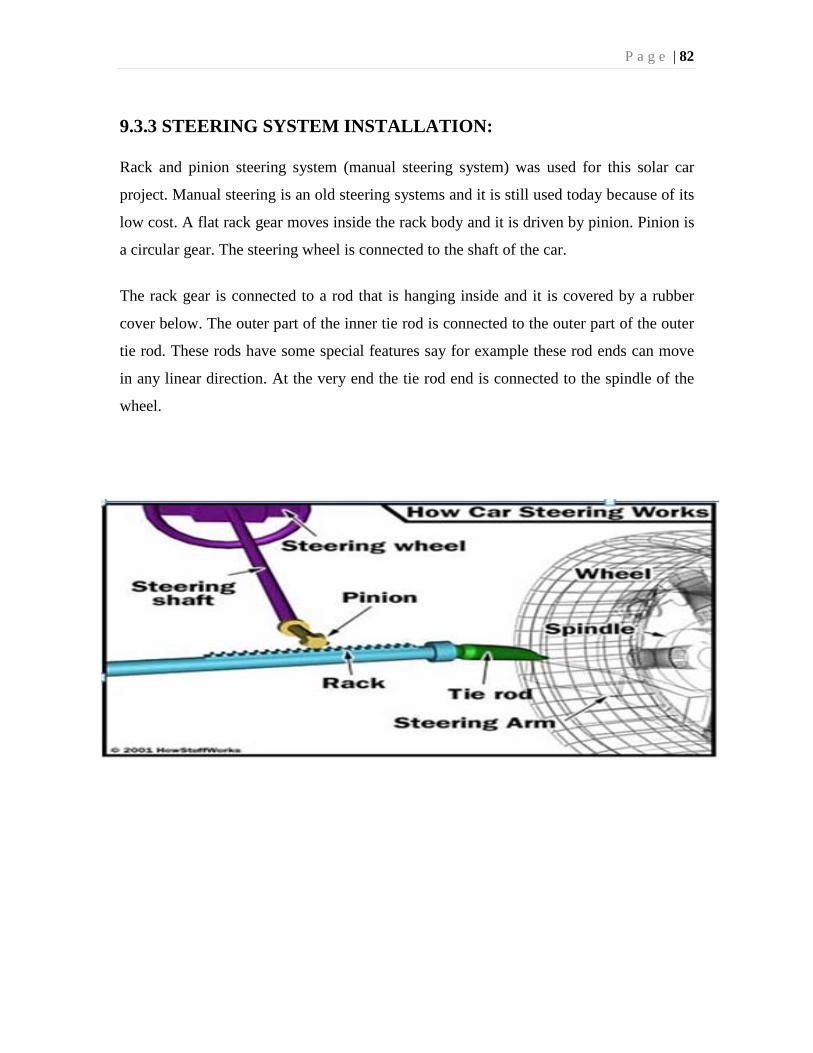
P a g e | 82
9.3.3 STEERING SYSTEM INSTALLATION:
Rack and pinion steering system (manual steering system) was used for this solar car
project. Manual steering is an old steering systems and it is still used today because of its
low cost. A flat rack gear moves inside the rack body and it is driven by pinion. Pinion is
a circular gear. The steering wheel is connected to the shaft of the car.
The rack gear is connected to a rod that is hanging inside and it is covered by a rubber
cover below. The outer part of the inner tie rod is connected to the outer part of the outer
tie rod. These rods have some special features say for example these rod ends can move
in any linear direction. At the very end the tie rod end is connected to the spindle of the
wheel.
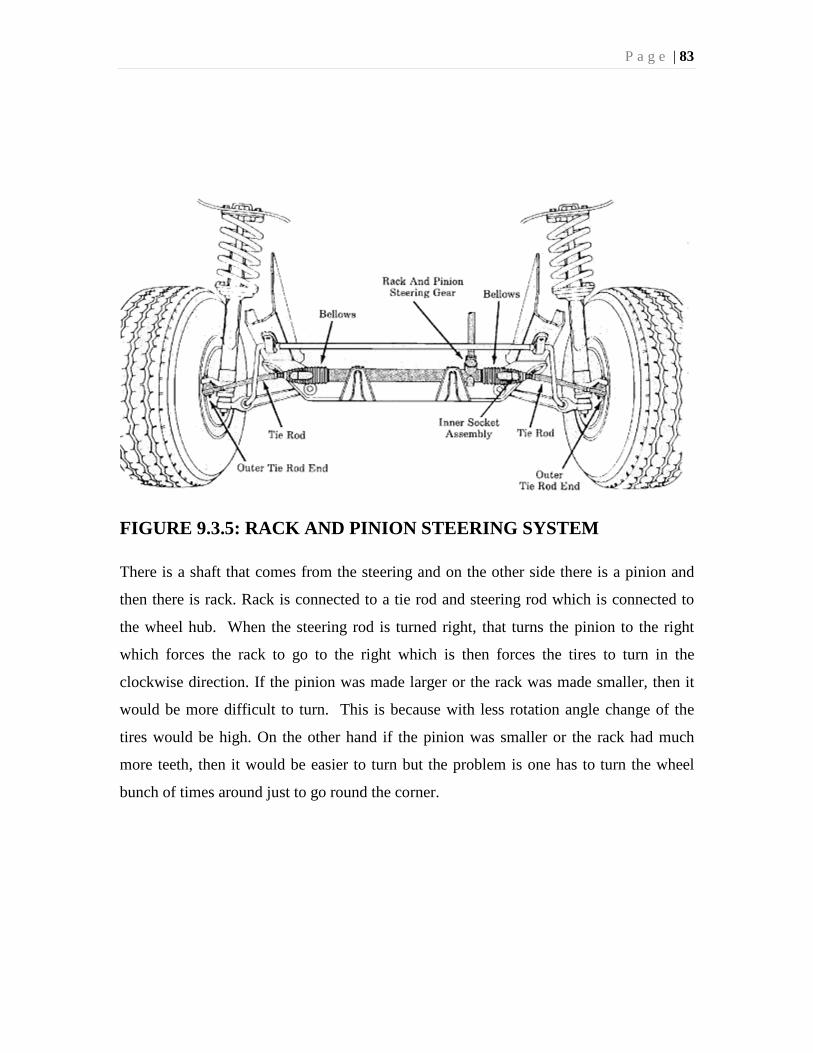
P a g e | 83
FIGURE 9.3.5: RACK AND PINION STEERING SYSTEM
There is a shaft that comes from the steering and on the other side there is a pinion and
then there is rack. Rack is connected to a tie rod and steering rod which is connected to
the wheel hub. When the steering rod is turned right, that turns the pinion to the right
which forces the rack to go to the right which is then forces the tires to turn in the
clockwise direction. If the pinion was made larger or the rack was made smaller, then it
would be more difficult to turn. This is because with less rotation angle change of the
tires would be high. On the other hand if the pinion was smaller or the rack had much
more teeth, then it would be easier to turn but the problem is one has to turn the wheel
bunch of times around just to go round the corner.
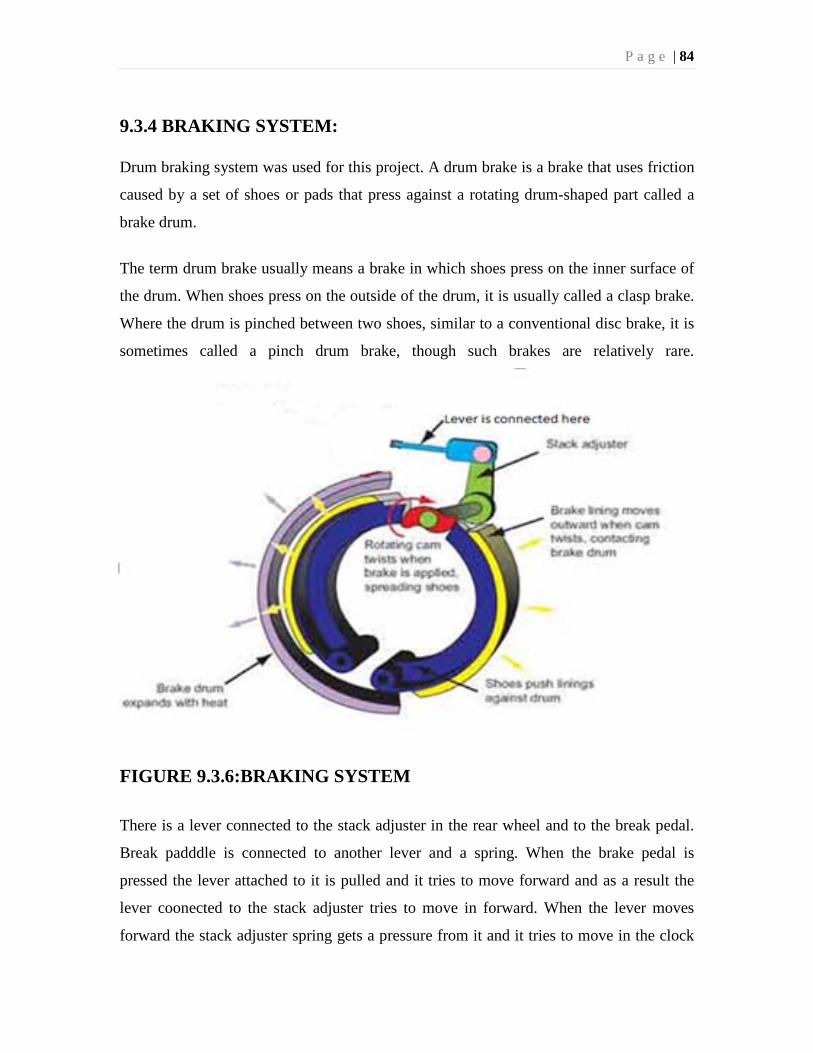
P a g e | 84
9.3.4 BRAKING SYSTEM:
Drum braking system was used for this project. A drum brake is a brake that uses friction
caused by a set of shoes or pads that press against a rotating drum-shaped part called a
brake drum.
The term drum brake usually means a brake in which shoes press on the inner surface of
the drum. When shoes press on the outside of the drum, it is usually called a clasp brake.
Where the drum is pinched between two shoes, similar to a conventional disc brake, it is
sometimes called a pinch drum brake, though such brakes are relatively rare.
FIGURE 9.3.6:BRAKING SYSTEM
There is a lever connected to the stack adjuster in the rear wheel and to the break pedal.
Break padddle is connected to another lever and a spring. When the brake pedal is
pressed the lever attached to it is pulled and it tries to move forward and as a result the
lever coonected to the stack adjuster tries to move in forward. When the lever moves
forward the stack adjuster spring gets a pressure from it and it tries to move in the clock

P a g e | 85
wise direction. As a result it puts pressure on the break shoe. Due to this pressure break
shoe tries to exapnd in the outward direction and as it is connected to the rear wheel hub,
the car eventually stops. This is basically how the braking system works.
9.3.5 INSTALLATION OF BRAKING SYSTEM:
At first it was needed to loosen up the lug nut it was ensured that it doesn’t move more
than one full turn. Then the car was raised. Floor jack was used for this lifting. Jack
stands were used to support the vehicle. Precautionary measures were taken like not
lifting the axle solely at the differential end. Then the chocks block was checked and
repositioned. It was done to ensure that the vehicle doesn’t move. Then we removed the
lug nuts and placed the hub caps. Then the tire was removed with the help of jack screw.
Then the bleeder screw was opened with a wrench. As these are made of soft element it
was important to be careful while removing it. Caliper was removed from the steering
knuckle using wrenches. Then it was needed to unscrew the caliper from brake hose. This
was done by turning the caliper to the left. It was important to select the collect caliper.
Caliper selection is very much important because failure in selecting proper caliper will
result in brake failure. Then the pistons were compressed fully and then the new brake
pads that were bought previously were installed into the caliper. Then the brake hose was
joined to the caliper. Then the caliper was attached to the steering knuckle with the help
of nut and screw driver. Unlike the removal steps the screw driver was turned in the
clockwise direction this time.
Then the hose was tightened to the caliper. It was ensured that it doesn’t become too
tight. We pumped the brake paddle with the engine off to find out whether it gives a
solid feel or not. Then it was time to reinstall the wheel and the tire. Lug nuts were
tightened in a star pattern. Finally a test drive was done to have an idea about the brake
performance.
P a g e | 86
The next phase of the work required a sturdy mid-section of the car. The middle part of
the chassis could be considered its weakest point since the weight of the passenger, seats,
motor and all other equipment will act through this point. That is why the tactic here was
to use flexible but strong material in a design which would spread the force out to the
front and rear part of the car. Therefore the jerking force of the passengers when the car
hits a bump will be absorbed by the flexible steel and also dissipate this force along the
chassis.
Finally, it was time to come back to the rear part of the car. After stripping away the
temporary steel framework employed initially, A steel framework was devised that will
not only hold together the rear suspensions to absorb the jerking of the rear wheels, but
also serve to pull up the middle part of the chassis on to the rear suspension. This would
further strengthen the mid-section of the car by diverting a lot of the weight in the middle
on to the rear wheels. As shown in the picture the 4 long finger like steel pipes does the
job of holding up the mid part of the chassis and supporting it using the rear suspension
and wheels.
The entire chassis was in this way built from the ground up in a month. We started with
only a rear wheel and axle and finished with a complete car chassis that was technically
made to resemble a real cars chassis assembling every bit by us.
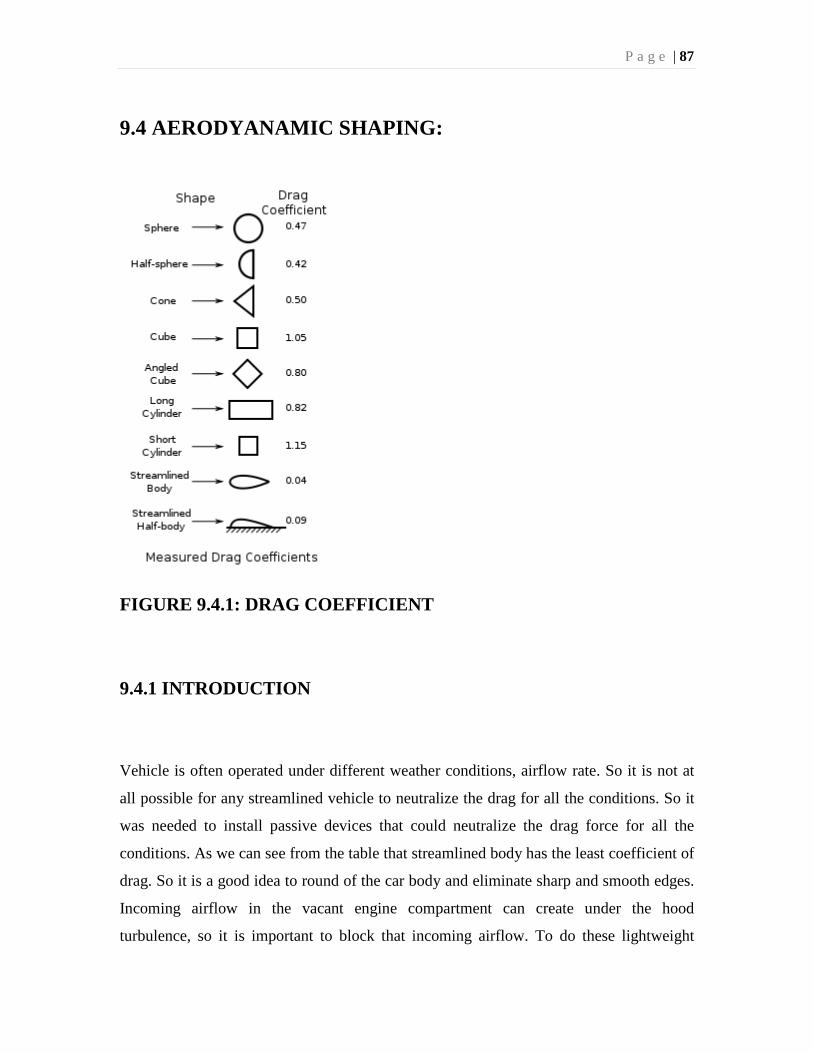
P a g e | 87
9.4 AERODYANAMIC SHAPING:
FIGURE 9.4.1: DRAG COEFFICIENT
9.4.1 INTRODUCTION
Vehicle is often operated under different weather conditions, airflow rate. So it is not at
all possible for any streamlined vehicle to neutralize the drag for all the conditions. So it
was needed to install passive devices that could neutralize the drag force for all the
conditions. As we can see from the table that streamlined body has the least coefficient of
drag. So it is a good idea to round of the car body and eliminate sharp and smooth edges.
Incoming airflow in the vacant engine compartment can create under the hood
turbulence, so it is important to block that incoming airflow. To do these lightweight
P a g e | 88
materials such as aluminum can be placed behind the grills. It should be ensured that the
material is heavy enough and during installation it should also be ensured that it is tied
securely with other body part of the car. At the very end a small opening for motor’s
cooling air duct was left.
The improve the aerodynamic following measures can be taken;
9.4.2 USING FRONT SPLITTER/AIR DRUM:
Using an air dam in the front side of the car optimizes the air flow to all the other parts of
the car. Aim of using this air dam is to get minimum drag and maximum downward
force. It gives the front tires more grip and reduce the tendency of under steer turbulence.
The front splitter should be attached to the bottom of the air dam. It increases the down
force at the front of the car. Air flow is brought to stagnation above the splitter by an air
dam; it causes an area of high pressure. Below, the front splitter redirects air away from
this stagnation point and accelerates air underneath the car body, which in turn causes a
low pressure. High pressure over the splitter that is caused by the air dam, and low
pressure by the airflow under the car creates down force by ways of Bernoulli's effect.
Bernoulli’s principle says that for an in viscid flow, an increase in the speed of the fluid
occurs simultaneously with a decrease in pressure or a decrease the fluids potential
energy.
9.4.3 USING DRAG REDUCTION SYSTEM:
In Drag reduction system often known as DRS, a rear moveable wing is used to reduce
the rear wings angle of attack. If the down force can be reduced by minimizing this angle
of attack, it will increase the top speed of the car.

P a g e | 89
9.4.4 ADDING REAR SPOILERS: Adding rear spoilers create gentle slope that will help delay flow separation of the air that
is moving very fast. It will also increase the flow dynamics of the rear airflow. This in
turn will reduce the drag on the car.
FIGURE 9.4.2: A very aerodynamically shaped car body

P a g e | 90
9.5 CONCLUSION:
FIGRUE 9.5.1: REAR AXLE OF THE CAR (initial state of chassis)
FIGURE 9.5.2: FUNCTIONAL PROTOTYPE (Final state of chassis)
P a g e | 91
Mechanical aspect of this car started with just two rear wheels and an axle connected to it
which is shown in FIGURE 9.5.1. In about three months the whole chassis and the
prototype was built (shown in FIGURE 9.5.2.) From the figure it can be seen that the
mid-section is not as sturdy as a conventional car due to limitation of resources. It was
tough to make a nice outer body due because bending machine and other related tools
were not available. The intension of this mechanical work was to convert a conventional
car into an electric one. As the battery packs and the solar panels were giving required
output during the test drive of the prototype car, it is expected that it is going to work
when these devices will be installed on a fully functional car. To give passengers a
feeling of a smooth ride one just need to ensure that appropriate solar panels are used,
voltage current power rating should be taken accurately and connections are given
properly.
Demand of fuel is increasing day by day. To cope up with the demand of this increasing
fuel demand it’s time to look for alternate sources. Solar energy is by far the best choice
because it is cheap, environment friendly and most importantly it is supplied by an
endless source of energy. So finally we hope that the day is not so far when a large
percentage of world population will use this technology and convert their car into a solar
powered light weight one.
P a g e | 92
10. CONCLUSION AND FUTURE DIRECTIONS
In order to cope with the increasing demands for fuel and the disastrous environment
pollution due to driving carbon-based vehicles, it is quite necessary to switch to a new
source of energy, i.e. the solar power which would be a cheap, efficient, limitless and of
course an eco-friendly alternative.
Solar-powered electric vehicles are safe with no volatile fuel or hot exhaust systems.
They are zero emission vehicles, odorless, smokeless and noiseless. They require
minimal maintenance, are more reliable with little or no moving parts and can be
efficiently charged nearly anywhere. Needless to say it is very much cost efficient.
Since solar cars can easily incorporate future technology, we hope that it would not be
long before the majority of the worlds’ people would switch to driving this modern
vehicle and thereby bring about a positive change in their lives and the environment. This
is just the beginning of a new technology and it is guaranteed that future developments
will make solar cars the predominant mode of transportation over vehicles with internal
combustion engines.

P a g e | 93
REFERENCES:
• http://www.energymatters.com.au/renewable-energy/batteries/battery-voltage-discharge.php
• http://www.scubaengineer.com/documents/lead_acid_battery_charging_graphs.pdf
• http://batteryuniversity.com/learn/article/charging_the_lead_acid_battery
• http://www.chargingchargers.com/manuals/sec1260-1280-2440.pdf
• http://publications.lib.chalmers.se/records/fulltext/167306.pdf
• http://www.mpoweruk.com/soc.htm
• http://www.chargingchargers.com/tutorials/charging.html
• http://www.batterystuff.com/blog/3-stages-of-smart-chargers.html
• http://www.electrovehicles.co.za/understanding-battery-charging
• http://www.google.com/patents/US20070139015
• http://liionbms.com/php/wp_soc_estimate.php
• http://books.google.com.bd/books?id=Qwxrq8tQRSAC&pg=PA20&lpg=PA20&dq=ocv+method+soc&source=bl&ots=03ymlz1op5&sig=fE-MULnq3h3DLSWH2J1SxZ8HgrQ&hl=en&sa=X&ei=UueIUfTvGojkrAfarIHoDA&redir_esc=y#v=onepage&q=ocv%20method%20soc&f=false
• http://www.solar-electric.com/deep-cycle-battery-faq.html#Battery%20Voltages
• http://www.wseas.us/e-library/transactions/systems/2008/28-217.pdf
• http://www.morningstarcorp.com/en/support/library/8.%20Why%20PWM1.pdf
• http://www.edaboard.com/thread123648.html
• http://www.microcontrollerboard.com/pic_interrupt.html
• http://en.wikipedia.org/wiki/Wikipedia
• “Build your own Electric Vehicle”, Seth Lehman and Bob Brant, 2nd Edition. • Solar and Wind Energy Resource Assessment, (SWERA) – Bangladesh, Project,
February 2007, Prof. (retd) MuhtashamHussain
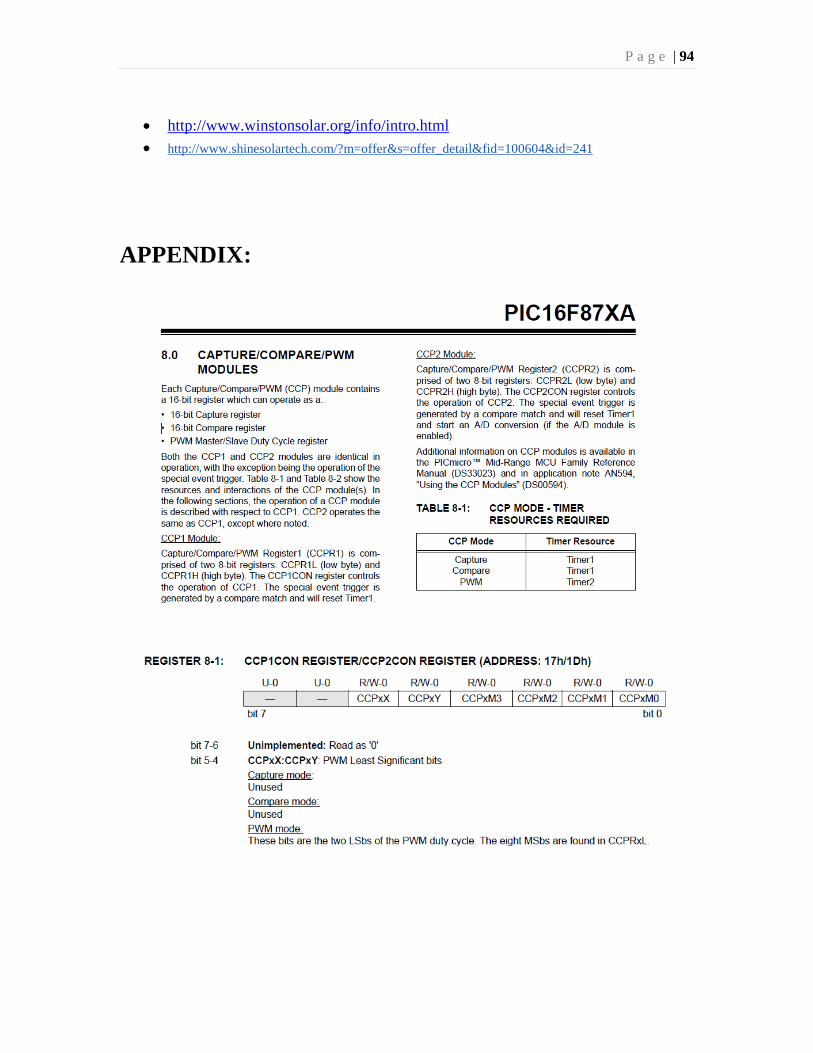
P a g e | 94
• http://www.winstonsolar.org/info/intro.html • http://www.shinesolartech.com/?m=offer&s=offer_detail&fid=100604&id=241
APPENDIX:
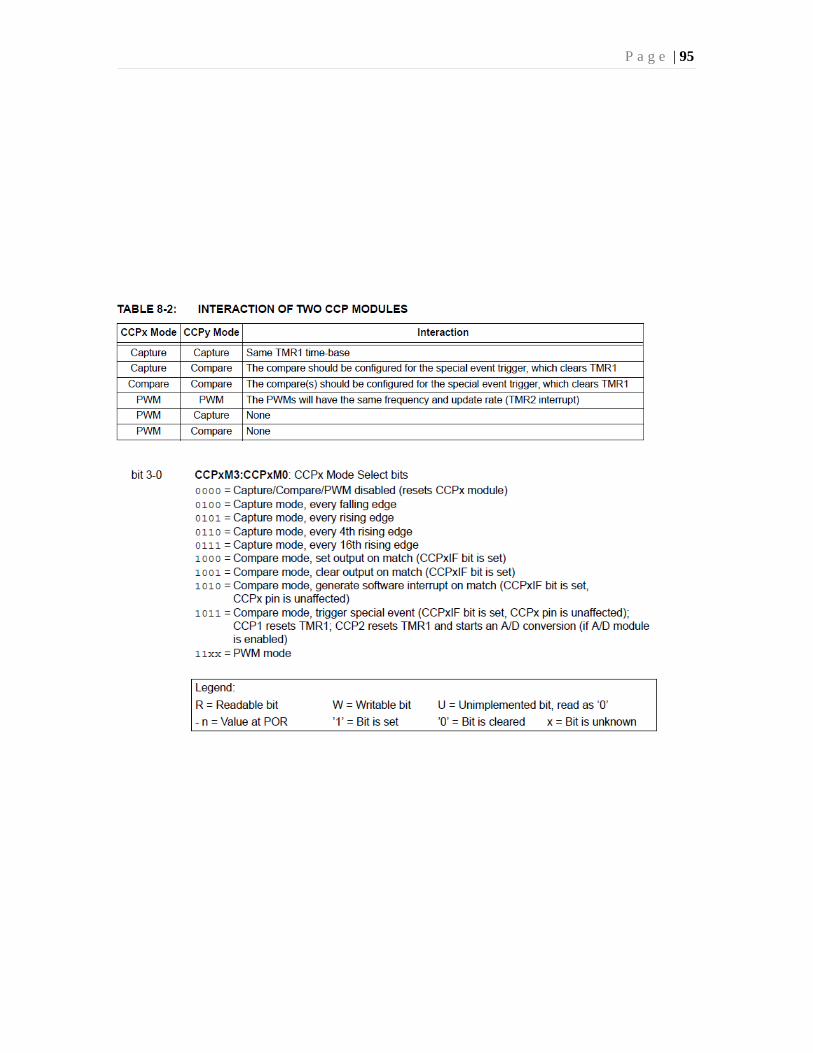
P a g e | 95
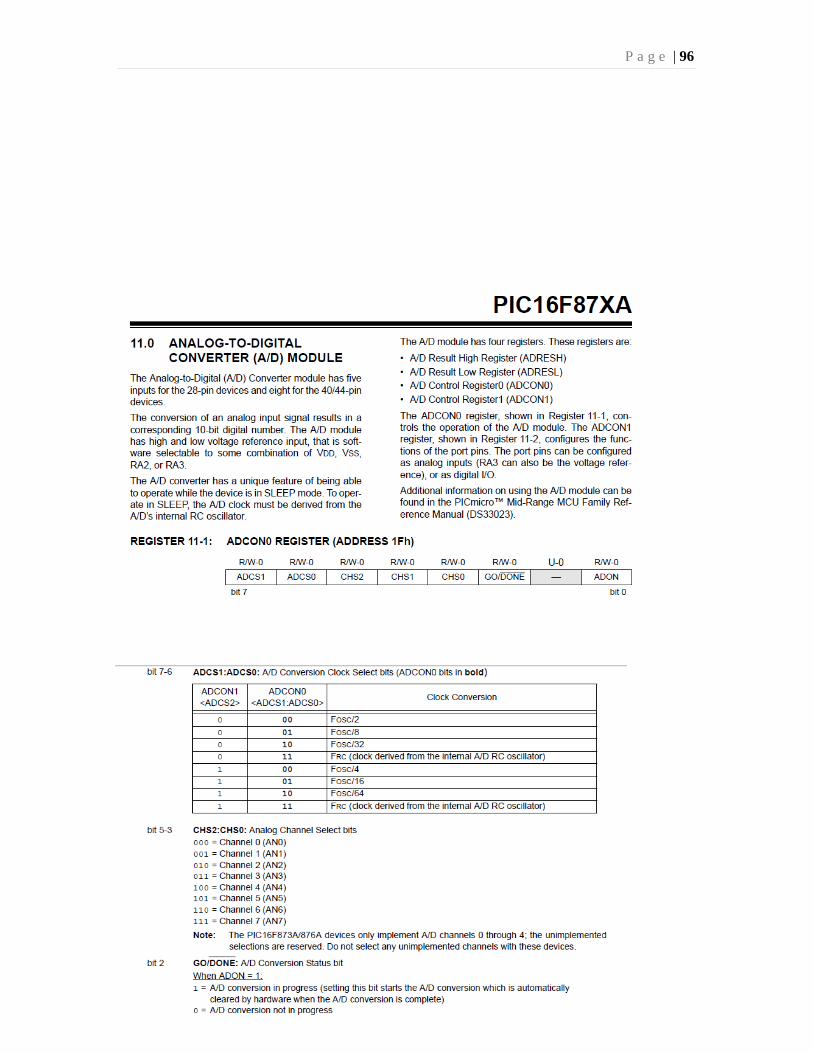
P a g e | 96

P a g e | 97