page title 8.80 lower content limit 7.03 bottom margin 7.86 content start 6.08 © kantar retail 2015...
TRANSCRIPT

© Kantar Retail 2015
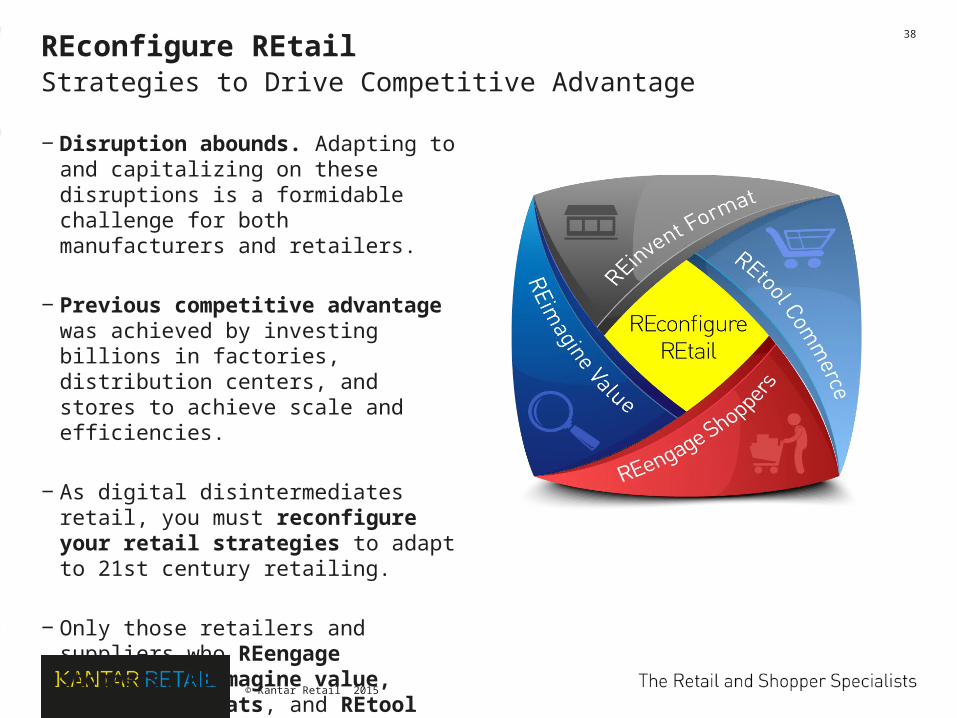
REconfigure REtailStrategies to Drive Competitive Advantage

© Kantar Retail 2015
2
‒ Disruption abounds. Adapting to and capitalizing on these disruptions is a formidable challenge for both manufacturers and retailers.
‒ Previous competitive advantage was achieved by investing billions in factories, distribution centers, and stores to achieve scale and efficiencies.
‒ As digital disintermediates retail, you must reconfigure your retail strategies to adapt to 21st century retailing.
‒ Only those retailers and suppliers who REengage shoppers, REimagine value, REinvent formats, and REtool commerce will thrive.
REconfigure REtailStrategies to Drive Competitive Advantage

© Kantar Retail 2015
3
‒ Disruptive technologies are fragmenting shoppers’ relationships with retailers and brands.
‒ Competition for shopper mindshare is chaotic and intensifying— messaging and content must cut through the clutter of communication driven by constant connectivity.
‒ REengaging shoppers means driving personalization without sacrificing scalable operations.
‒ Retailers and suppliers must develop a robust understanding of their targeted shoppers across all touch points to drive distinctive offers, curated shopper experiences, and contextual engagement.
Pillar I: REengage Shoppers
© Kantar Retail 2015
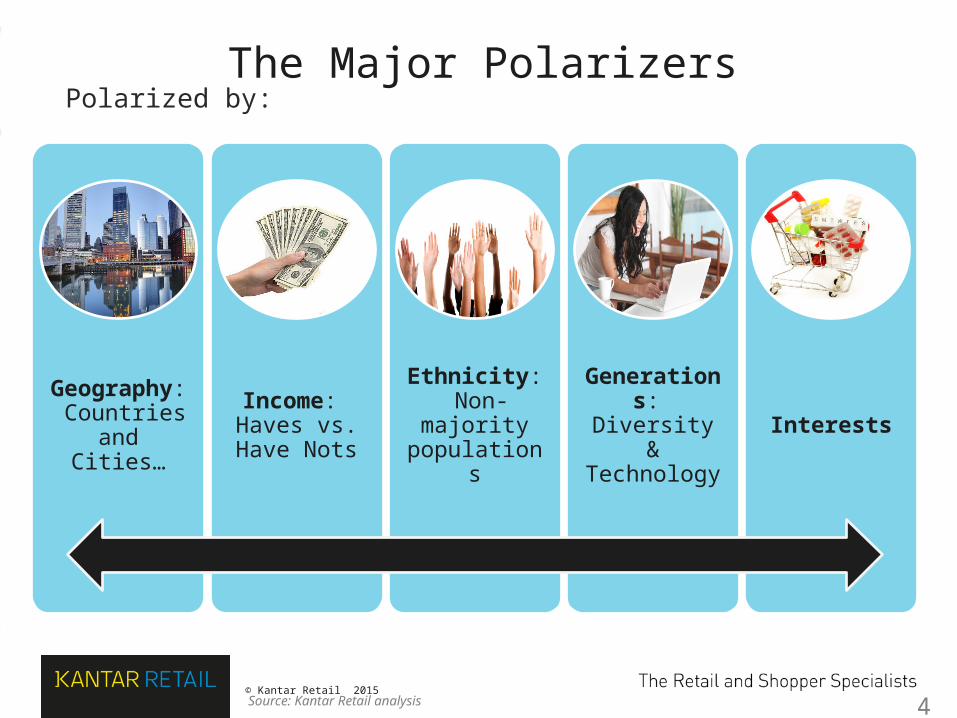
The Major Polarizers
Geography: Countries and
Cities…
Income: Haves vs. Have Nots
Ethnicity: Non-majority populations
Generations: Diversity & Technology
Interests
4
Polarized by:
Source: Kantar Retail analysis
© Kantar Retail 2015
5
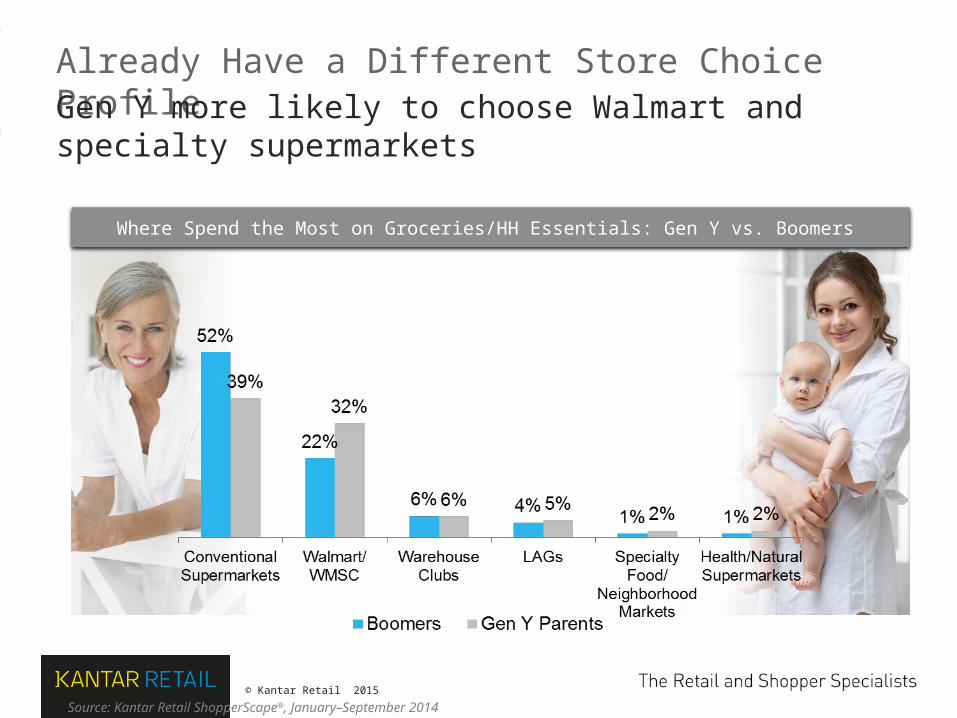
Where Spend the Most on Groceries/HH Essentials: Gen Y vs. Boomers
Source: Kantar Retail ShopperScape®, January–September 2014
Already Have a Different Store Choice ProfileGen Y more likely to choose Walmart and specialty supermarkets

© Kantar Retail 2015
6
36% Growth
17% Growth
• Gen Y cohort had historically lagged all shoppers—especially Boomers, who have been most active buyers—in terms of conversion
• Seniors also increasingly converting to buyers
Source: Kantar Retail ShopperScape®, July 2013 and July 2014
Average Conversion Rate*(across 30 categories)
* Conversion calculated as % have purchased category online/% have shopped for category online
Gen Y Getting Serious about Buying Online
© Kantar Retail 2015
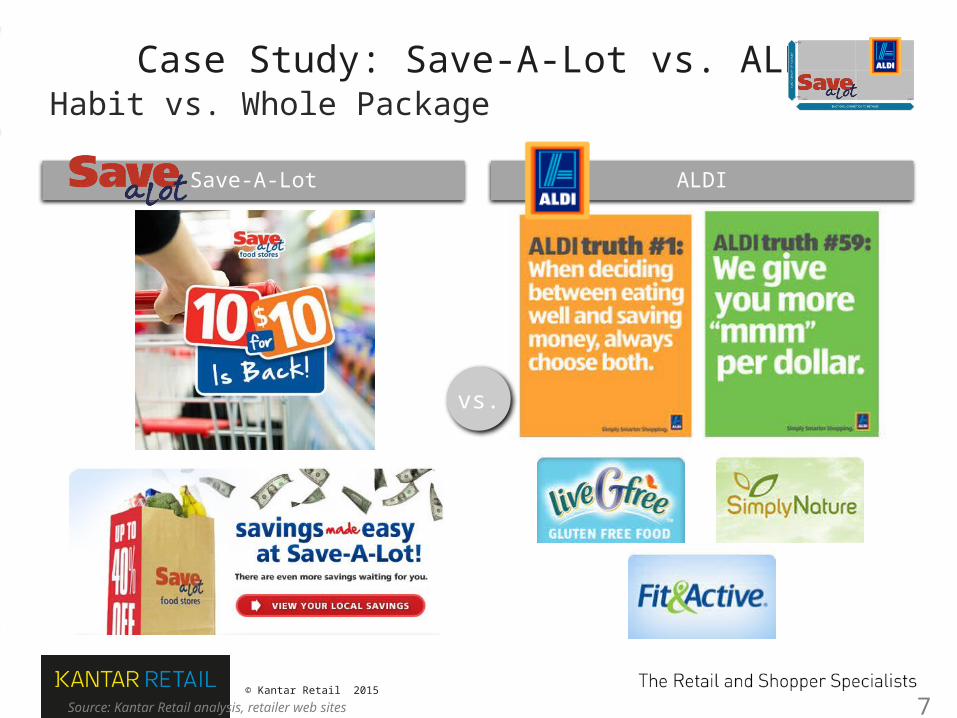
Case Study: Save-A-Lot vs. ALDIHabit vs. Whole Package
Source: Kantar Retail analysis, retailer web sites 7
Save-A-Lot ALDI
vs.

© Kantar Retail 2015
Source: U.S. Census Bureau, Current Population Survey, 2013 and Population Projections report NP2012-T4
8
Projections of the U.S. Population by Hispanic Origin: 2015 to 2030
Age of U.S. Population by Hispanic Origin: 2013
Hispanic Shopper Population Set to GrowNearly half of Hispanic population currently younger than 25

© Kantar Retail 2015
Source: Kantar Retail ShopperScape®, May 2013–July 2014 9
Arrows indicate that Hispanic shoppers are significantly more likely to shop retailers than the average shopper (95% confidence level)
51% of Hispanic shoppers shop Amazon—about on-par with the
average U.S. primary HH shopper
Where Do Hispanics Shop?
63%
42%
35%
34%
29%
Mass/Dollar/Club/Drug
22%
17%
14%
13%
12%
Supermarket
Hispanics More Likely to Shop Many Top Consumables Retailers
51%

© Kantar Retail 2015
Engagement Can Mean Partners…
10

© Kantar Retail 2015
Sometimes You Just Gotta Dance…Lowe’s Foods
11

© Kantar Retail 2015
Defining The Elusive Notion of Omnichannel RetailingA consumer experience of perfect retailing execution
TRADITIONAL MULTI
ADDRESSABLE
Low
High
MultiBricks & Mortar
OMINICHANNEL RETAILING
HO
W W
E M
AR
KE
T
HOW WE SELL
12
Source: Kantar Retail analysis

© Kantar Retail 2015
RE-ENGAGE SHOPPERS: 3 KEY POINTS
• More Specific – “Addressable Marketing”– The facilities should be the heart of the base, and a “mirror” of the
culture of that environment – use the “Address” you’ve got
• More Personal– Digital communication platforms allow a more personal
relationship in terms of shopping aids and value
• More Fun!– Millennial Shoppers don’t view it as a chore yet
13
© Kantar Retail 2015
14
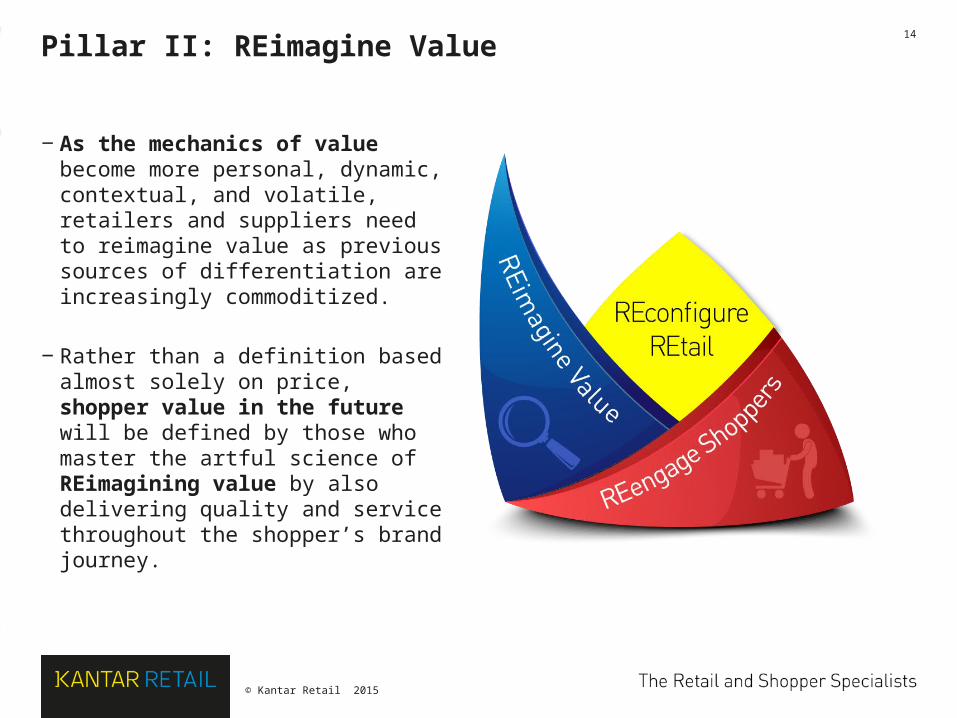
‒ As the mechanics of value become more personal, dynamic, contextual, and volatile, retailers and suppliers need to reimagine value as previous sources of differentiation are increasingly commoditized.
‒ Rather than a definition based almost solely on price, shopper value in the future will be defined by those who master the artful science of REimagining value by also delivering quality and service throughout the shopper’s brand journey.
Pillar II: REimagine Value

© Kantar Retail 2015
Generally Positive, Generally Improving Spending Intentions
Fewer than three in 10 shoppers consciously planning to spend less
Spend about the Same
Spend Somewhat/Much Less
Spend Somewhat/Much More
Spending Intentions in Coming Month Compared with Same Period Last Year(three-month moving average among all primary household shoppers)
Source: Kantar Retail ShopperScape®, December 2009–December 2014
15

© Kantar Retail 2015
More Shoppers Considering More than PriceGen Y, Seniors lead the shift; True for both Haves and Have Nots
All Shop-pers
Gen Y Gen X Boomers Seniors Have Nots Haves Hispanic
59%
70%65%
55%
46%
56%
64% 64%63%
75%
67%
57%55%
60%
67% 70%
Oct-13 Oct-14
Now More Willing to Consider Factors Other than Price When Deciding Where to Shop(share of shoppers who say this statement describes them “perfectly”/”quiet well” or “somewhat”)
Arrows indicate significant difference vs. 2013 (95% confidence level)
Source: Kantar Retail ShopperScape®, October 2013 and 2014
16

© Kantar Retail 2015
Shopper Buzzword for 2015: “Stress Free”Motivation likely differs by cohort, but all increasingly interested
All Shoppers Gen Y Gen X Boomers Seniors
53% 55%52% 54% 53%
58% 57% 56%59%
63%
Jan-14 Jan-15
Share of Shoppers Who Rate “Having a Stress-Free Shopping Experience” Among Top Four Most Important Aspects of Shopping
Arrows indicate significant difference vs. 2014 (95% confidence level)
Source: Kantar Retail ShopperScape®, January 2014 and January 2015
17

© Kantar Retail 2015
The Adaption of Pricing Strategies has Created an New Industry View: “The Hourglass”
Source: Kantar Retail analysis; company reports 18
Of the top 69 supermarket retailers in the KR database, there are roughly as many characterized as:
• Value (22)
• Premium (21)
• Mainstream (26)*
“Hav
e-N
ots
”“H
aves
”
26.8% (CAGR 4.2%)
12.0% (CAGR 1.9%)
60.7% (CAGR 5.6%)
Projected dollar growth 2014E-2019E is:
*Data as of 12/01/2014
© Kantar Retail 2015
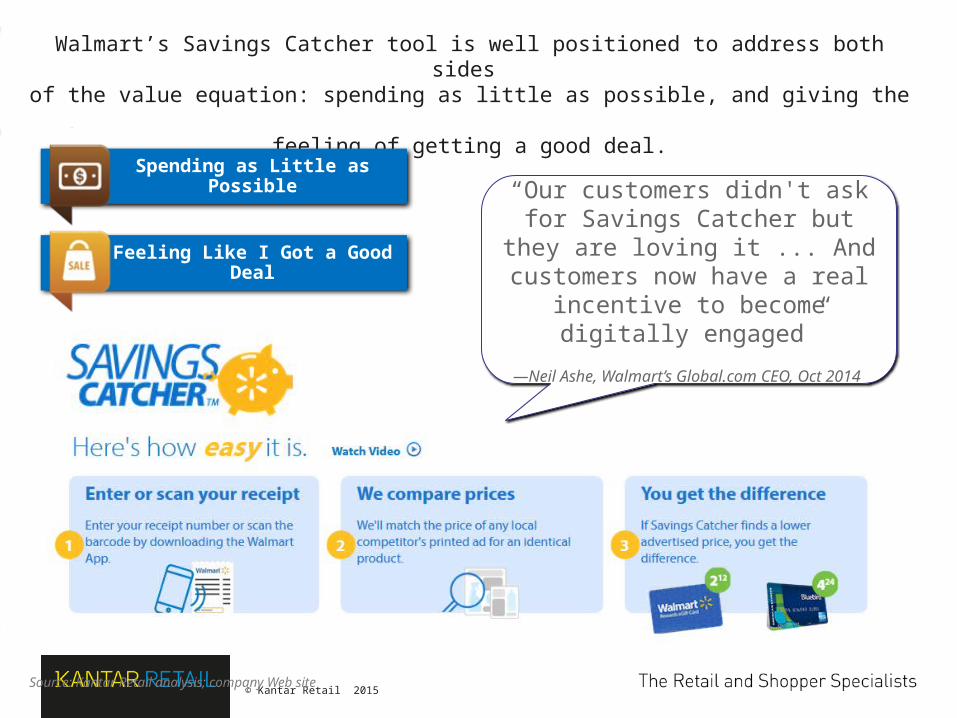
Walmart’s Savings Catcher tool is well positioned to address both sides of the value equation: spending as little as possible, and giving the
feeling of getting a good deal.
Source: Kantar Retail analysis; company Web site
19
Feeling Like I Got a Good Deal
Spending as Little as Possible
“Our customers didn't ask for Savings Catcher but they are
loving it ... And customers now have a real incentive to become
digitally engaged”
—Neil Ashe, Walmart’s Global.com CEO, Oct 2014

© Kantar Retail 2015
REIMAGINE VALUE: 3 KEY POINTS
• More Specific– Mid-tier positioning confuses shoppers more than helps them –
make ic clear what we stand for
• More Personal– More and more retailers will be delivering more and more
promotions and price to individuals out of the public domain
• More Fun– Shoppers willing to consider other factors than price, in particular
things that make shopping more stress-free!
20
© Kantar Retail 2015
21
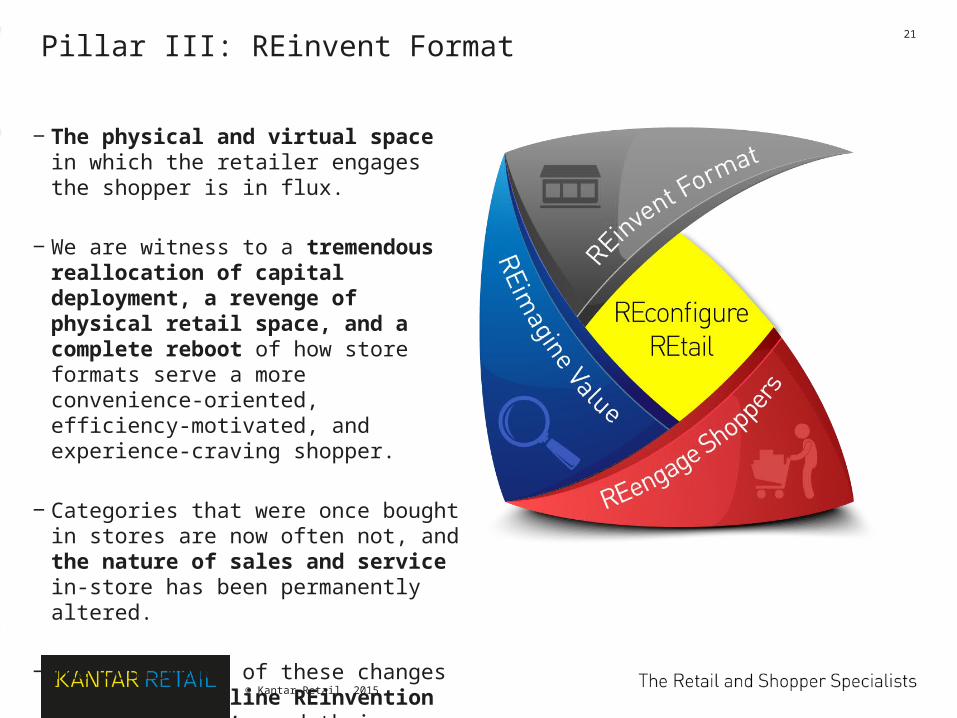
‒ The physical and virtual space in which the retailer engages the shopper is in flux.
‒ We are witness to a tremendous reallocation of capital deployment, a revenge of physical retail space, and a complete reboot of how store formats serve a more convenience-oriented, efficiency-motivated, and experience-craving shopper.
‒ Categories that were once bought in stores are now often not, and the nature of sales and service in-store has been permanently altered.
‒ The confluence of these changes demands a baseline REinvention of store formats and their purpose.
Pillar III: REinvent Format
© Kantar Retail 2015
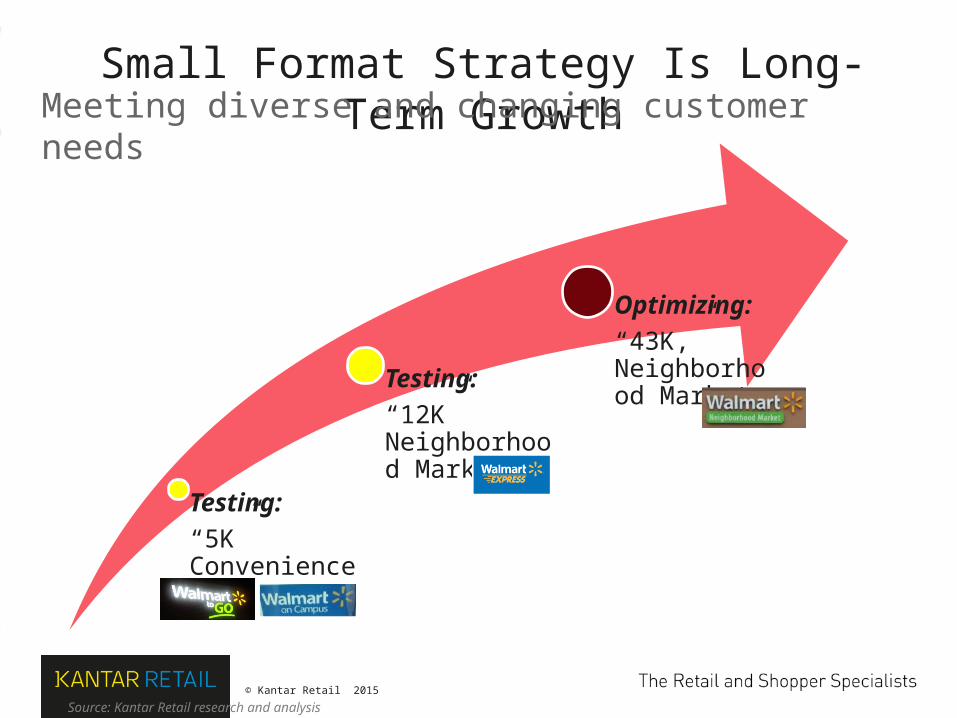
Small Format Strategy Is Long-Term Growth
Testing:
“5K” Convenience
Testing:
“12K” Neighborhood Market
Optimizing:
“43K,” Neighborhood Market
Source: Kantar Retail research and analysis 22
Meeting diverse and changing customer needs

© Kantar Retail 2015
Neighborhood Market Growth Holds Steady
Source: Company reports, KRIQ, Kantar Retail analysis 23
“I want us to be judicious about how many we grow next year because I’d like to give this team a chance to put their fingerprints on it.”
–Doug McMillon, October 2014
Sales (USD Millions)Store Count
Half of Walmart’s sales added in 2015 will be from small format

© Kantar Retail 2015
(Ranked by 2014E Edible Grocery Sales)
2009 2014E 2019E
1 1 Walmart $ 118,334 $ 148,784 $ 183,504 23.5% 4.7% 4.3%
2 2 Kroger $ 56,292 $ 76,446 $ 91,702 12.1% 6.3% 3.7%
3 3 Costco $ 22,424 $ 32,434 $ 45,510 5.1% 7.7% 7.0%
5 4 Down Safeway $ 27,848 $ 27,015 $ 27,541 4.3% -0.6% 0.4%
4 5 Up Publix $ 20,069 $ 24,944 $ 31,648 3.9% 4.4% 4.9%
6 6 Ahold $ 18,450 $ 21,673 $ 24,142 3.4% 3.3% 2.2%
11 7 Down Albertsons Market (LLC) $ 3,643 $ 15,865 $ 15,009 2.5% 34.2% -1.1%
7 8 Up H-E-B $ 10,679 $ 15,049 $ 20,080 2.4% 7.1% 5.9%
10 9 Down Target $ 15,523 $ 14,507 $ 15,542 2.3% -1.3% 1.4%
9 10 Up Delhaize USA $ 7,977 $ 14,429 $ 16,150 2.3% 12.6% 2.3%
Top 10 (Edible Grocery Only) 301,240 391,146 470,827 61.9% 5.4% 3.8%
12 11 Down Wakefern $ 10,040 $ 12,725 $ 14,905 2.0% 4.9% 3.2%
8 12 Up Whole Foods $ 6,323 $ 11,158 $ 16,880 1.8% 12.0% 8.6%
Rank 2019E
Rank 2014E
Expected Movement
RetailerEdible Grocery Sales (USD Millions) CAGR
'09-'14ECAGR
'14E-'19E% of US Total
('14E)
The Top 10 “Grocers”Top 3 all have fundamentally different business models
Source: Kantar Retail analysis; company reports 24
Edible Grocery Sales (ranked by 2013E edible grocery sales)
club
mass
mass
How long until Amazon falls on this list? *Data as of 12/01/2014

© Copyright 2014 Kantar Retail
Food Service Trend Has Limits:Expect meal planning initiatives to increase
Source: Kantar Retail ShopperScape®, November 2013 25

© Copyright 2014 Kantar Retail
Quality & Fresh Come After Price
Source: Kantar Retail ShopperScape®, February/May/August 2014 26
Perimeter: Fresh
Spend Most on Food/Groceries at Retailer
All
shoppersAhold
(all banners)Delhaize
(all banners)HEB Publix Wegmans Meijer
Sample size 11617 327 224 259 449 116 288
Price 74% 66% 77% 75% 68% 60% 72%
High-quality fresh foods 45% 50% 36% 54% 55% 61% 47%
Items I need are in-stock 38% 35% 42% 38% 38% 40% 37%
Convenience 28% 34% 29% 27% 31% 26% 27%
Broad selection of foods I like to cook/eat 27% 27% 24% 31% 31% 37% 23%
Top 5 Important Factors When Shopping for Food/Groceries
Shading indicates significantly greater percentage vs. all shoppers; border indicates significantly lower percentage (95% confidence level)
Bet
ter
Mer
chan
dis
ing
Food Lion’s “Garden Cooler”
Bet
ter
Mar
keti
ng
Winn-Dixie Produce Hunt

© Copyright 2014 Kantar Retail
How Conventional Retailers Play in This Space
Source: Kantar Retail analysis; store visits 27
Execution in this category
Designated refrigeration unit for nat/org frozen foods.
Bulk Items: Typically natural/organic snack items (serve yourself).
Curved shelves and signage to call out organic/natural products.
SWAS

© Copyright 2014 Kantar Retail
Space Evolving to Drive More Experiences
Source: Kantar Retail research and analysis (Costco organic images courtesy of a client); Costco.com (Sept. 2013) 28
Costco’s Organic “Event” Roll-Out
Extends to online…
…And Coupons
© Copyright 2014 Kantar Retail
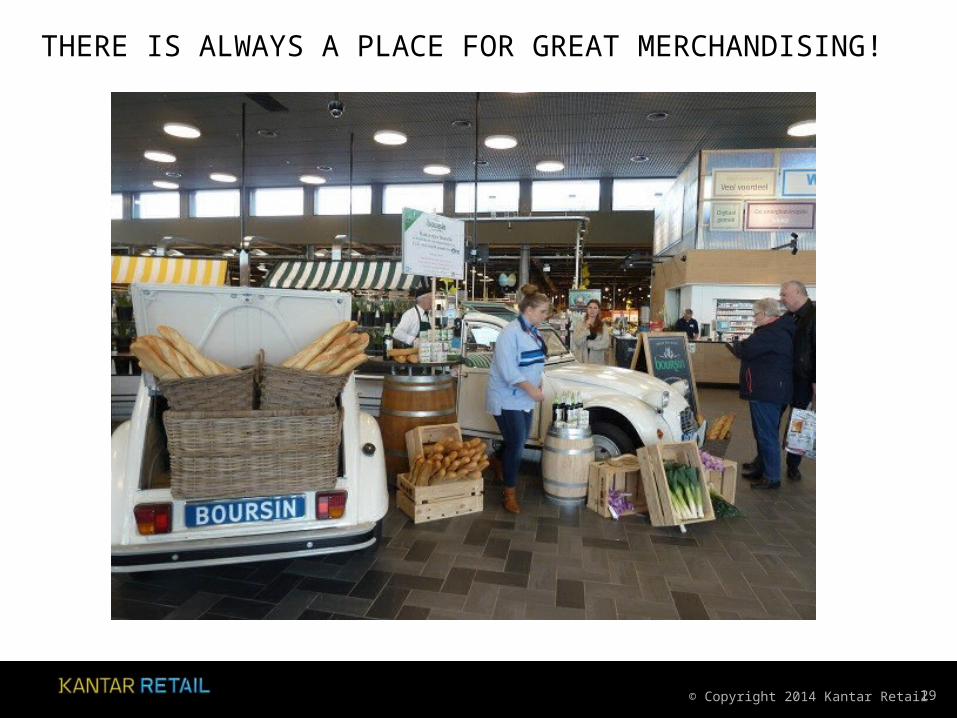
THERE IS ALWAYS A PLACE FOR GREAT MERCHANDISING!
29

© Kantar Retail 2015
Two Key Types of Online Grocery Shoppers
Source: Millward Brown Digital Online Intelligence Survey, Spring 2012 and Summer 2013 30
Dedicated Online Grocery Shopper
• Shops “true” online grocers (Amazon Fresh, Fresh Direct, and/or Peapod)
• Favors online for “core” grocery trips (stock-up, fill-in)
• Overall, grocery shops more often
• Shops online b/c it’s convenient
Casual Online Grocery Shopper
• Shops Amazon (and often only Amazon)
• Favors online for “long tail” purchases and browsing
• Spends less on online orders
• Shops online to save money

© Kantar Retail 2015
© MWG 2014. CONFIDENTIAL
For Brick and Mortar Retailers, Online Grocery Baskets are Big and the Ring is High
The Average Online Basket Value is
$147.25
55 Items on Average
Source: MWG ecommerce sales Jan to August 2014

© Kantar Retail 2015
OUR EXPECTATION IS THAT RETAIL WILL BE A COMPONENT OF WHEREVER “GATHERING”
TAKES PLACE
• Entertainment
• Education
• Healthcare
• Travel
• Worship
• Work
32
© Kantar Retail 2015
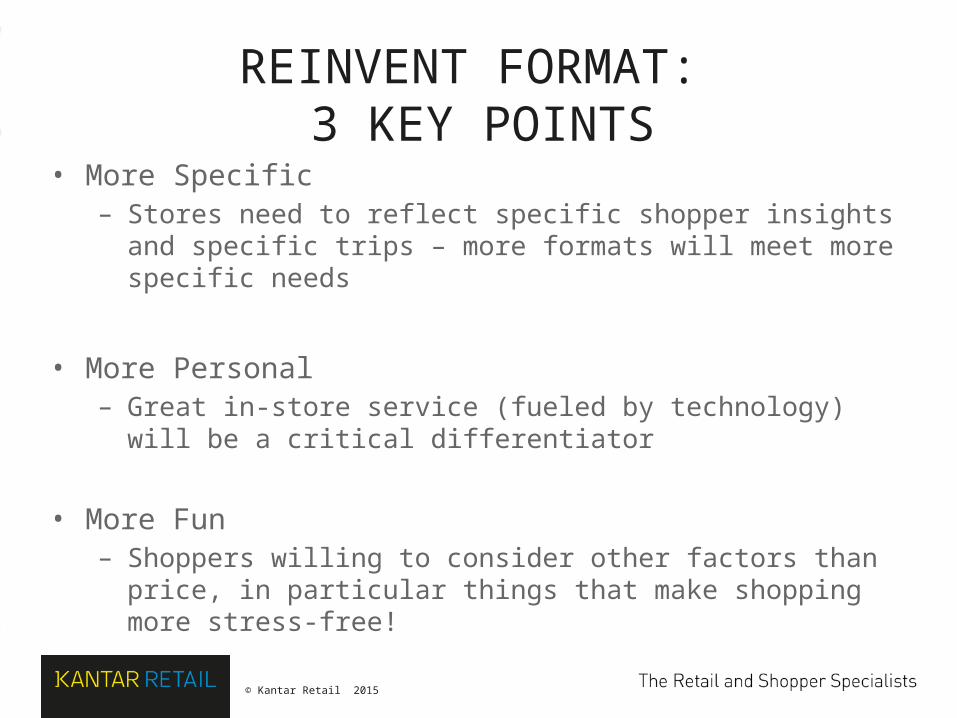
REINVENT FORMAT: 3 KEY POINTS
• More Specific– Stores need to reflect specific shopper insights and specific trips –
more formats will meet more specific needs
• More Personal– Great in-store service (fueled by technology) will be a critical
differentiator
• More Fun– Shoppers willing to consider other factors than price, in particular
things that make shopping more stress-free!
33

© Kantar Retail 2015
34
‒ Shoppers demand a seamless omni-channel experience, and most retailers and suppliers are underprepared to deliver truly multichannel commerce.
‒ There is enormous pressure at the intersection of retailer and supplier commerce models that is based on item at a price margins.
‒ Suppliers must fight to maintain mindshare in this more holistic profit equation.
‒ Only those retailers and suppliers who REtool their commerce models will thrive
Pillar IV: REtool Commerce

© Kantar Retail 2015
Penetration of Amazon Prime Membership(among all U.S, primary household shoppers)
Prime Penetration Now Nearly One in Four HouseholdsMore than 26 million households
21.5M
15.6M
11.2M
Estimated number of
households26.2M
35
Source: Kantar Retail ShopperScape®, December 2011–2014, Kantar Retail estimates

© Kantar Retail 2015
‒ If the plan is to gain store distribution need clear visibility on how this product will change the economics of the shelf
‒ Primarily brick and mortar retailers desperately need help with two things
• Avoiding the speed to price compression of frequently comped items
• Building better definitions of omni-channel profitability
‒ GMROI seems like a good place to start! But physical assortments will need “return on capital” style measures in order for complex asset bases to survive
TODAY, ASSESSING “SHELF LEVEL” INNOVATION REQUIRES UNDERSTANDING THAT INNOVATION’S ECONOMIC ROLE AT RETAIL
36
© Kantar Retail 2015
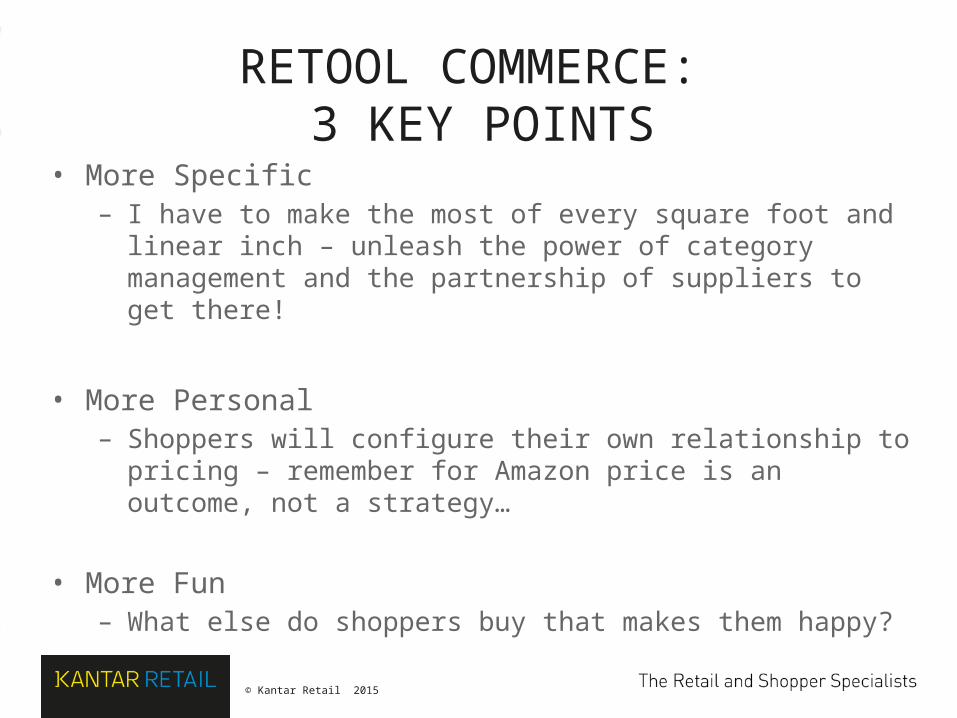
RETOOL COMMERCE: 3 KEY POINTS
• More Specific– I have to make the most of every square foot and linear inch –
unleash the power of category management and the partnership of suppliers to get there!
• More Personal– Shoppers will configure their own relationship to pricing –
remember for Amazon price is an outcome, not a strategy…
• More Fun– What else do shoppers buy that makes them happy?
37
© Kantar Retail 2015
38
‒ Disruption abounds. Adapting to and capitalizing on these disruptions is a formidable challenge for both manufacturers and retailers.
‒ Previous competitive advantage was achieved by investing billions in factories, distribution centers, and stores to achieve scale and efficiencies.
‒ As digital disintermediates retail, you must reconfigure your retail strategies to adapt to 21st century retailing.
‒ Only those retailers and suppliers who REengage shoppers, REimagine value, REinvent formats, and REtool commerce will thrive.
REconfigure REtailStrategies to Drive Competitive Advantage