pairwise & multiple sequence alignments urmila kulkarni-kale bioinformatics centre university of...
TRANSCRIPT
Pairwise & Multiple sequence alignments
Urmila Kulkarni-Kale
Bioinformatics Centre
University of Pune, Pune 411 007
Jan 18, 2010 © UKK, Bioinformatics Centre, University of Pune, Pune
2
Basis for Sequence comparison
• Theory of evolution: – gene sequences have evolved/derived from a
common ancestor– trace history of mutations/evolutionary changes
• Proteins that are similar in sequence are likely to have similar structure and function

Jan 18, 2010 © UKK, Bioinformatics Centre, University of Pune, Pune
3
WHAT IS ALIGNMENT?
Alignments are useful organizing tools because they provide pictorial representation of similarity / homology in the protein or nucleic acid sequences.
Jan 18, 2010 © UKK, Bioinformatics Centre, University of Pune, Pune
4
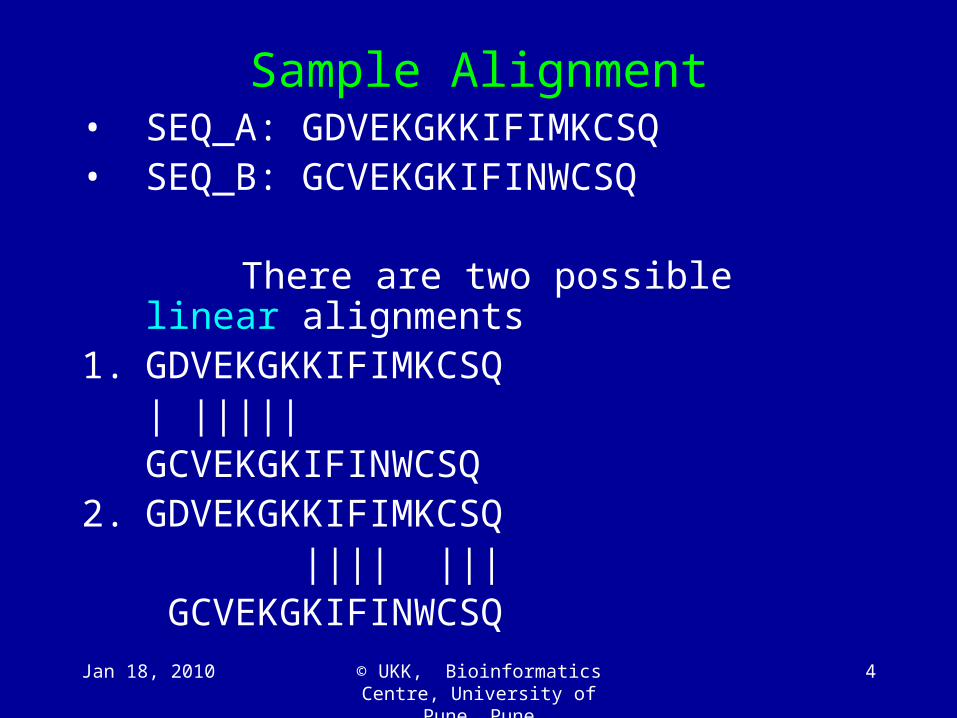
Sample Alignment• SEQ_A: GDVEKGKKIFIMKCSQ• SEQ_B: GCVEKGKIFINWCSQ
There are two possible linear alignments1. GDVEKGKKIFIMKCSQ
| ||||| GCVEKGKIFINWCSQ
2. GDVEKGKKIFIMKCSQ |||| ||| GCVEKGKIFINWCSQ

Jan 18, 2010 © UKK, Bioinformatics Centre, University of Pune, Pune
5
The optimal alignment
GDVEKGKKIFIMKCSQ
| ||||| ||| |||
GCVEKGK-IFINWCSQ
Insertion of one break maximizes the identities.
Jan 18, 2010 © UKK, Bioinformatics Centre, University of Pune, Pune
6
Theoretical background
• Alignment is the method based on the theoretical view that the two sequences are derived from each other by a number of elementary transformations –– Mutations (residue substitution)– Insertion/deletion– Slide function
Jan 18, 2010 © UKK, Bioinformatics Centre, University of Pune, Pune
7
TransformationsSubstitution, Addition/deletion, Slide function
• The most homologous sequences are those which can be derived from one another by the smallest number of such transformations.
• How to decide “the smallest number of transformation?”
• Therefore alignments are an optimization problem.
Jan 18, 2010 © UKK, Bioinformatics Centre, University of Pune, Pune
8
Terminology
• Identity
• Similarity
• Homology
Jan 18, 2010 © UKK, Bioinformatics Centre, University of Pune, Pune
9
Identity
• Objective and well defined
• Can be quantified
– Percent
– The number of identical matches divided
by the length of the aligned region
Jan 18, 2010 © UKK, Bioinformatics Centre, University of Pune, Pune
10
What is Similarity?Protein similarity could be due to –• Evolutionary relationship• Similar two or three dimensional structure • Common Function
• Can be quantified– Percent– The number of identical + similar matches
divided by the length of the aligned region
Jan 18, 2010 © UKK, Bioinformatics Centre, University of Pune, Pune
11
What is Homology?
Homologous proteins may be encoded by-
• Same genes in different species
• Genes that have transferred between the species
• Genes that have originated from duplication of ancestral genes.
Jan 18, 2010 © UKK, Bioinformatics Centre, University of Pune, Pune
12
Difference between Homology & Similarity
• Similarity does not necessarily imply Homology.
• Homology has a precise definition: having a common evolutionary origin.
• Since homology is a qualitative description of the relationship, the term “% homology” has no meaning.
• Supporting data for a homologous relationship may include sequence or structural similarities, which can be described in quantitative terms.– % identities, rmsd
Jan 18, 2010 © UKK, Bioinformatics Centre, University of Pune, Pune
13
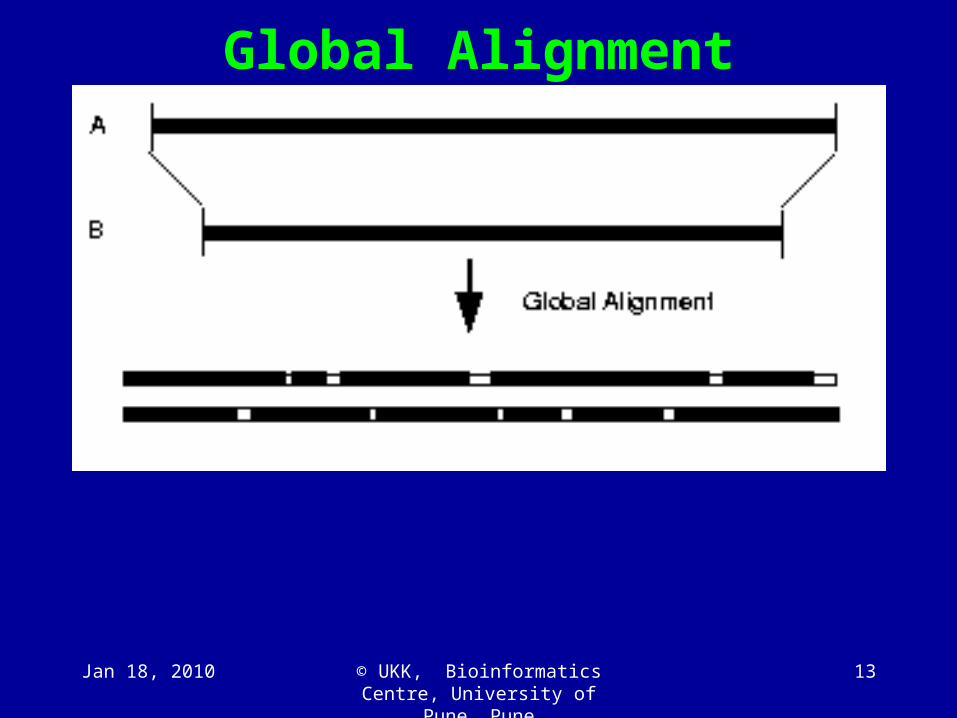
Global Alignment
Jan 18, 2010 © UKK, Bioinformatics Centre, University of Pune, Pune
14
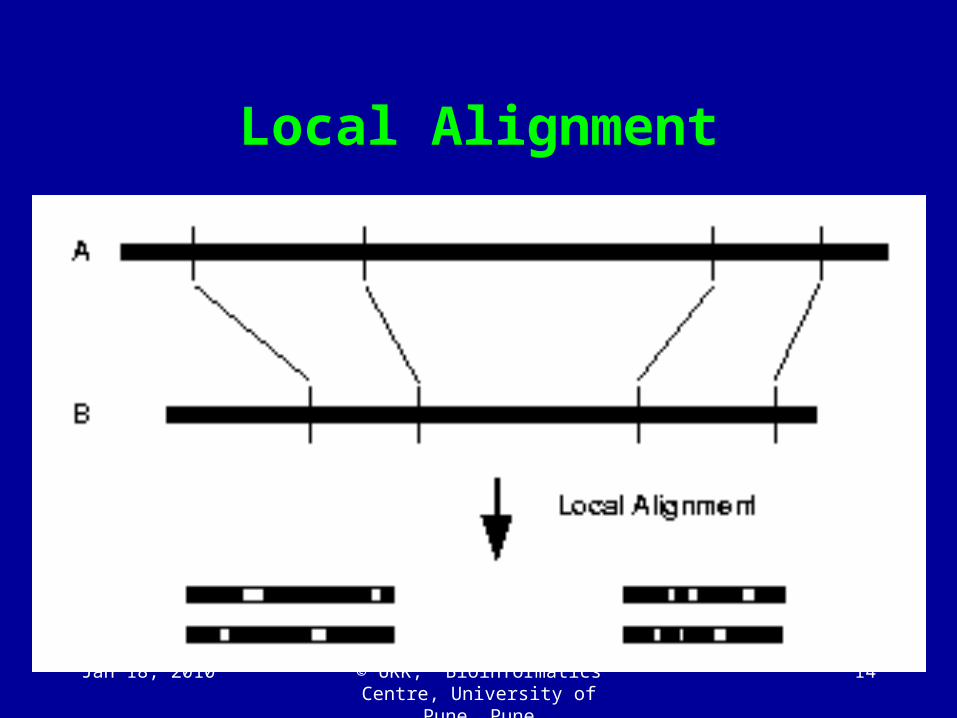
Local Alignment

Jan 18, 2010 © UKK, Bioinformatics Centre, University of Pune, Pune
15
An optimal alignment
AALIM
AAL-M
A sub-optimal alignment
AALIM
AA-LM
Jan 18, 2010 © UKK, Bioinformatics Centre, University of Pune, Pune
16
Needleman & Wunsch algorithm
• JMB (1970). 48:443-453.
• Maximizes the number of amino acids of one
protein that can be matched with the amino acids
of other protein while allowing for optimum
deletions/insertions.
• Based on theory of random walk in two
dimensions

Jan 18, 2010 © UKK, Bioinformatics Centre, University of Pune, Pune
17
Random walk in two dimensions
• 3 possible paths – Diagonal
– Horizontal
– Vertical
• Optimum path– Diagonal
Jan 18, 2010 © UKK, Bioinformatics Centre, University of Pune, Pune
18
N & W Algorithm• The optimal alignment is obtained by maximizing the
similarities and minimizing the gaps.
GLOSSARY
1. PROTEINS The words composed of 20 letters
2. LETTER is an element other than NULL
3. NULL is an symbol “-” i.e. the GAP
4. GAPS Run of nulls which indicates the deletion(s) in one sequence and
insertion(s) in other sequence
Jan 18, 2010 © UKK, Bioinformatics Centre, University of Pune, Pune
19
Contd../
5. SCORING Assigns a value to each possible MATRIX pair of Amino acids. Examples of matrices are UN, MD, GCM, CSW, UP.
6. PENALTY There are two types of penalties.
• Matrix Bias: is added to every cell of the scoring matrix and decides the size of the break. Also called Gap continuation penalty.
• Break Penalty: Applied every time a gap is inserted in either sequence.
Jan 18, 2010 © UKK, Bioinformatics Centre, University of Pune, Pune
20
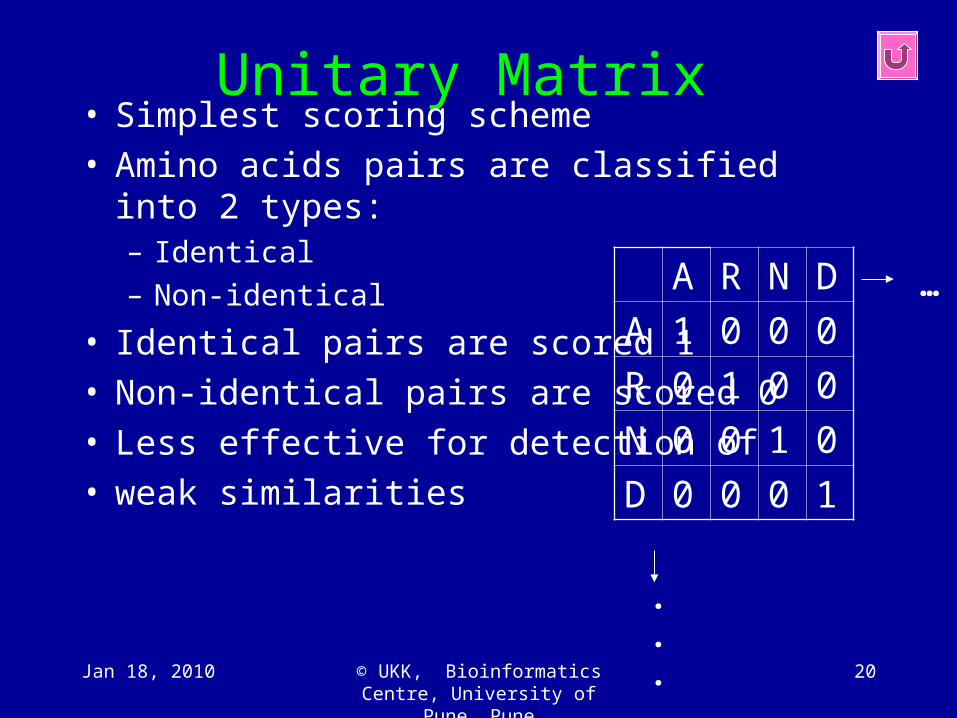
Unitary Matrix • Simplest scoring scheme• Amino acids pairs are classified into 2 types:
– Identical
– Non-identical
• Identical pairs are scored 1• Non-identical pairs are scored 0• Less effective for detection of • weak similarities
A R N D
A 1 0 0 0
R 0 1 0 0
N 0 0 1 0
D 0 0 0 1
…
.
.
.
Jan 18, 2010 © UKK, Bioinformatics Centre, University of Pune, Pune
21
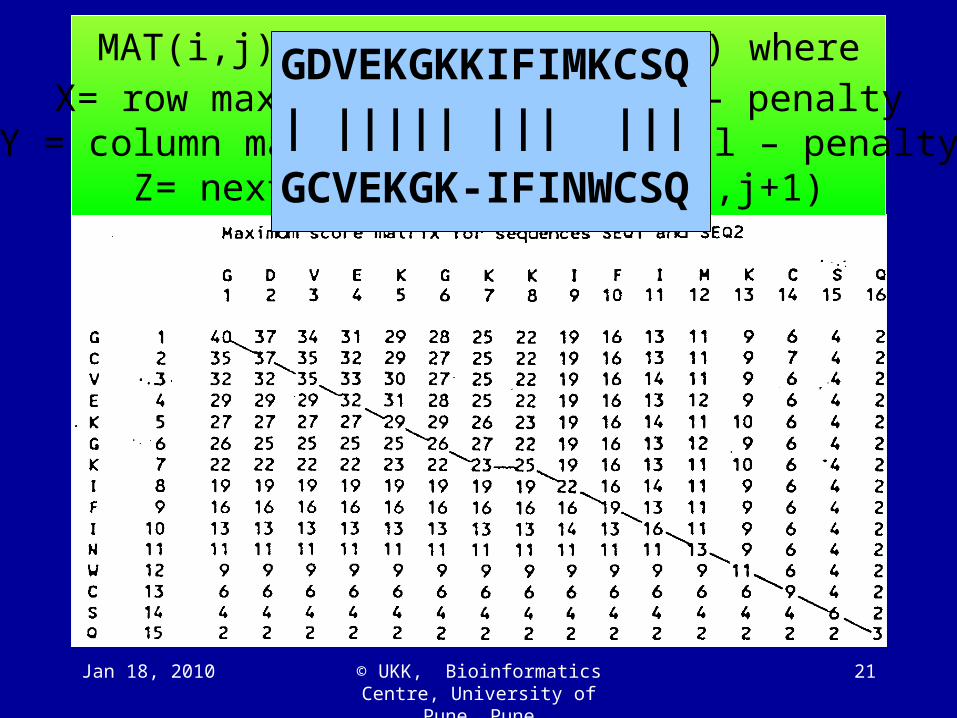
MAT(i,j)=SM(Ai,Bj)+max(x,y,z) whereX= row max along the diagonal– penalty
Y = column max along the diagonal – penaltyZ= next diagonal: MAT (i+1,j+1)
GDVEKGKKIFIMKCSQ
| ||||| ||| |||
GCVEKGK-IFINWCSQ
Jan 18, 2010 © UKK, Bioinformatics Centre, University of Pune, Pune
22
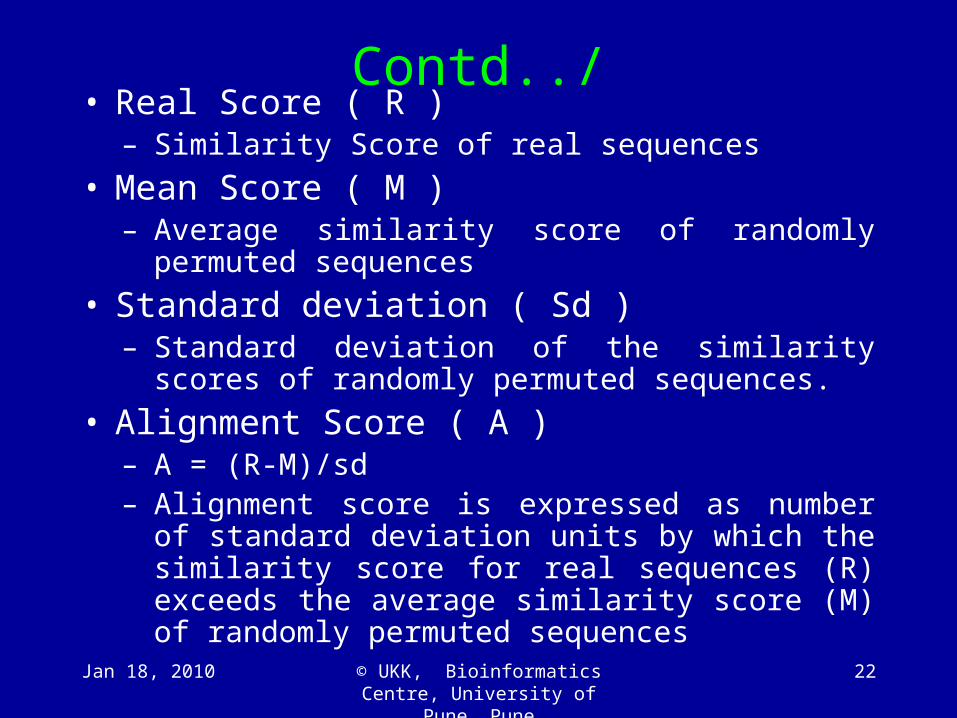
Contd../• Real Score ( R )
– Similarity Score of real sequences
• Mean Score ( M )– Average similarity score of randomly permuted
sequences
• Standard deviation ( Sd )– Standard deviation of the similarity scores of randomly
permuted sequences.
• Alignment Score ( A )– A = (R-M)/sd– Alignment score is expressed as number of standard
deviation units by which the similarity score for real sequences (R) exceeds the average similarity score (M) of randomly permuted sequences
Jan 18, 2010 © UKK, Bioinformatics Centre, University of Pune, Pune
23
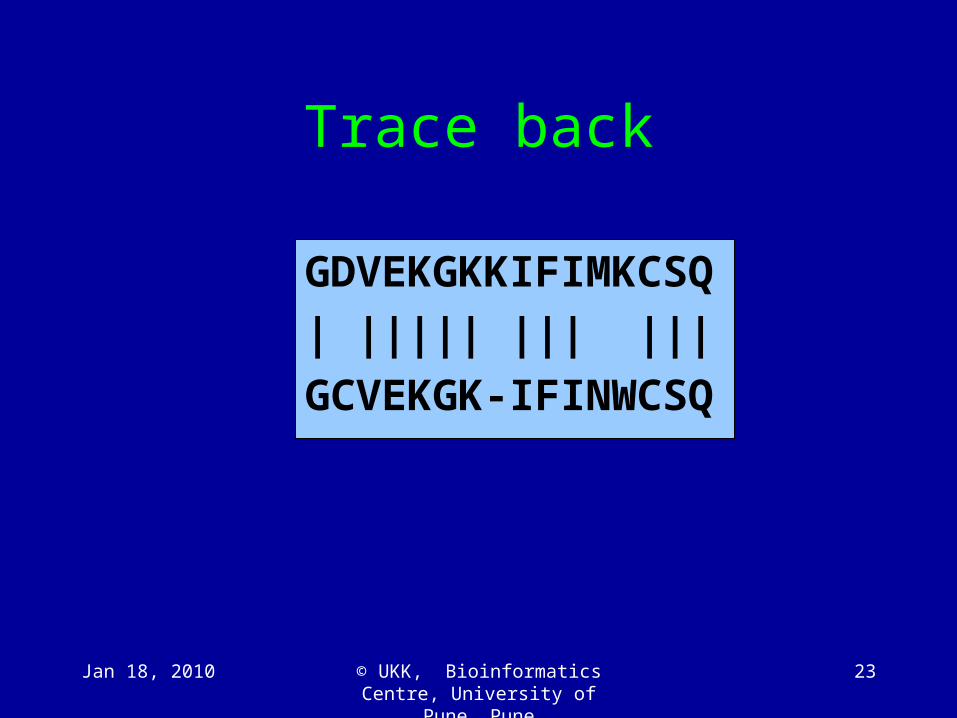
Trace back
GDVEKGKKIFIMKCSQ
| ||||| ||| |||
GCVEKGK-IFINWCSQ

Jan 18, 2010 © UKK, Bioinformatics Centre, University of Pune, Pune
24
Sample output
Jan 18, 2010 © UKK, Bioinformatics Centre, University of Pune, Pune
25
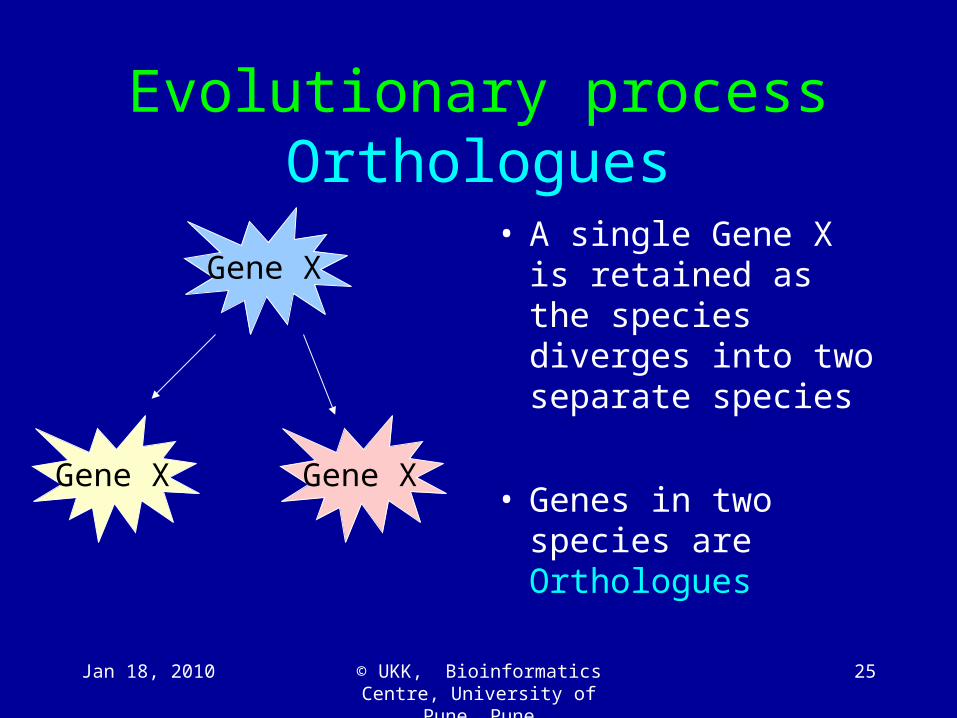
Evolutionary processOrthologues
Gene X• A single Gene X is
retained as the species diverges into two separate species
• Genes in two species are Orthologues
Gene X Gene X

Jan 18, 2010 © UKK, Bioinformatics Centre, University of Pune, Pune
26
Evolutionary processParalogues: genes that arise due to duplication
• Single gene X in one species is duplicated
• As each gene gathers mutations, it may begin to perform new function or may specialize in carrying out functions of ancestral genes
• These genes in a single species are paralogues
• If the species diverges, the daughter species may maintain the duplicated genes, therefore each species contain an Orthologue and a Paralogue to each gene in other species
Gene X
Gene X Gene X
Gene A Gene B
Jan 18, 2010 © UKK, Bioinformatics Centre, University of Pune, Pune
27
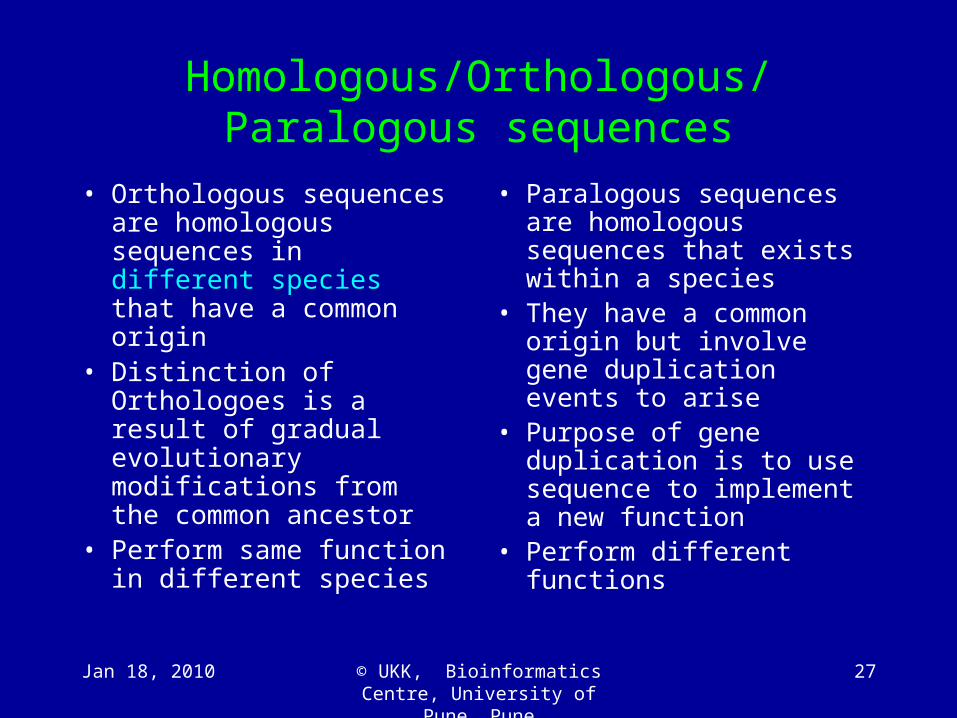
Homologous/Orthologous/Paralogous sequences
• Orthologous sequences are homologous sequences in different species that have a common origin
• Distinction of Orthologoes is a result of gradual evolutionary modifications from the common ancestor
• Perform same function in different species
• Paralogous sequences are homologous sequences that exists within a species
• They have a common origin but involve gene duplication events to arise
• Purpose of gene duplication is to use sequence to implement a new function
• Perform different functions
Local Sequence Alignment Using Smith-Waterman Dynamic Programming
Algorithm
Jan 18, 2010 28© UKK, Bioinformatics Centre, University of Pune, Pune

Significance of local sequence alignment•In global alignment, an attempt is made to align the entire sequences, as many characters as possible.
• In local alignment, stretches of sequence with the highest density of matches are given the highest priority,
•generating one or more islands of matches in the aligned sequences.
Applications: locating common domains in proteins
Example: transmembrane proteins, which might have different ends sticking out of the cell membrane, but have common 'middleparts'
For comparing long DNA sequences with a short one Comparing a gene with a complete genome
For detecting similarities between highly diverged sequences which still share common subsequences (that have little or no mutations).Jan 18, 2010 29© UKK, Bioinformatics Centre,
University of Pune, Pune

Local sequence alignment
• Performs an exhaustive search for optimal local alignment
• Modification of Needleman-Wunsch algorithm:
• Negative weighting of mismatches
• Matrix entries non-negative
• Optimal path may start anywhere (not just first / last row/column)
• After the whole path matrix is filled, the optimal local alignment is simply given by a path starting at the highest score overall in the path matrix, containing all the contributing cells until the path score has dropped to zero.
Jan 18, 2010 30© UKK, Bioinformatics Centre,
University of Pune, Pune
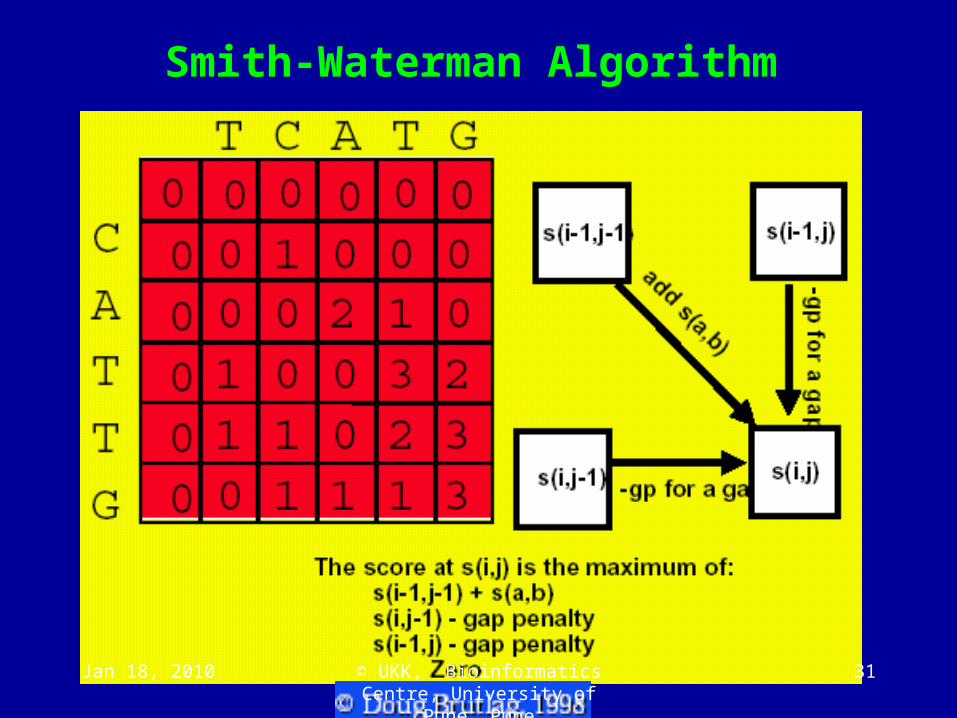
Smith-Waterman Algorithm
Jan 18, 2010 31© UKK, Bioinformatics Centre, University of Pune, Pune
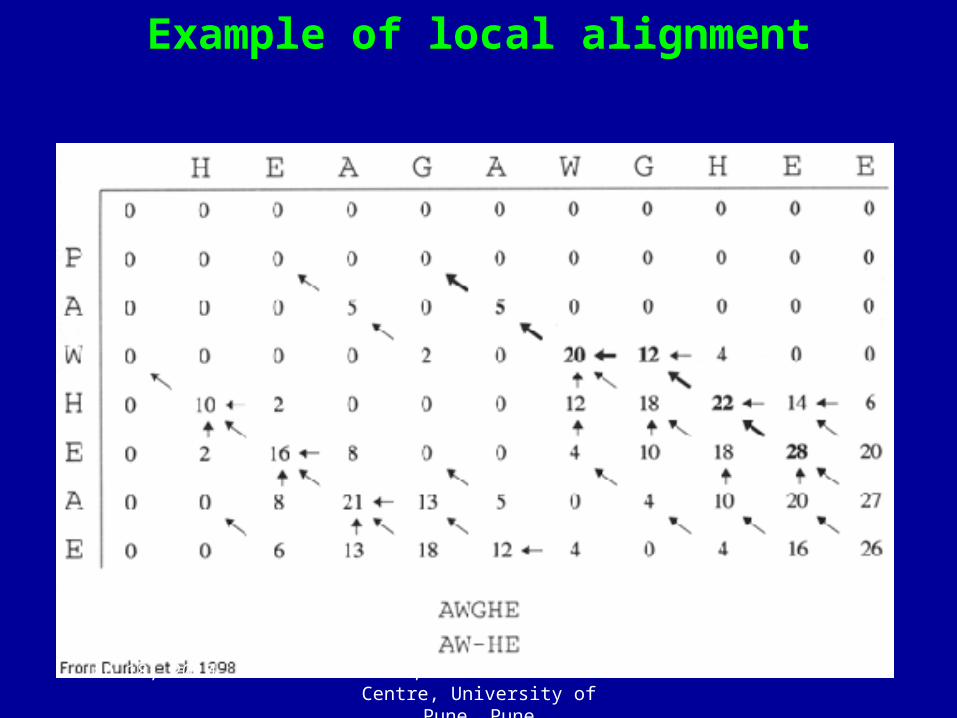
Example of local alignment
Jan 18, 2010 32© UKK, Bioinformatics Centre, University of Pune, Pune
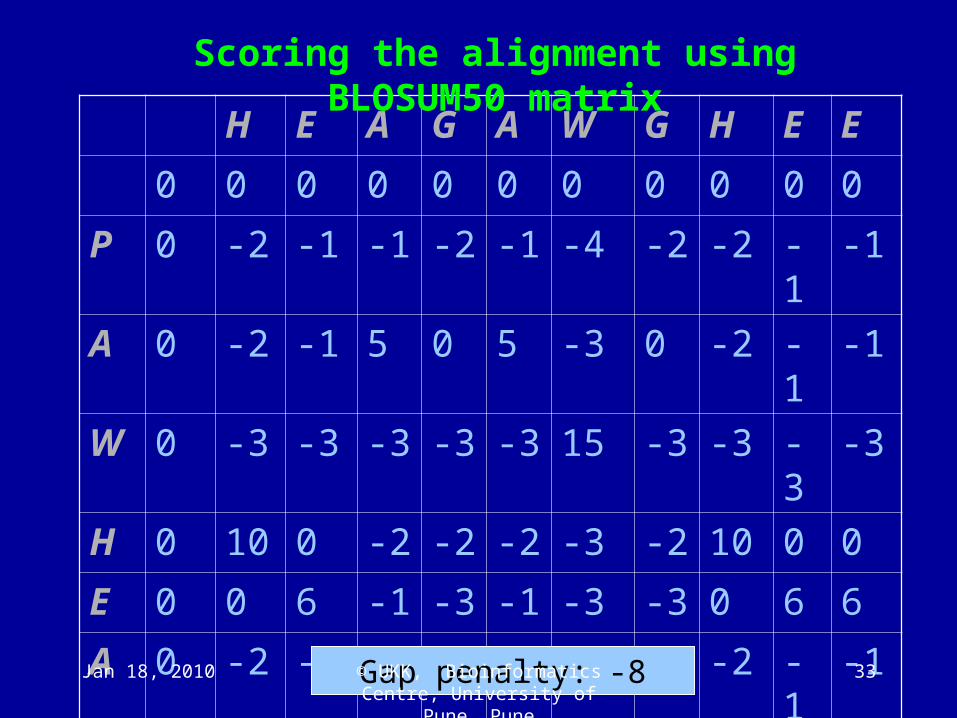
H E A G A W G H E E
0 0 0 0 0 0 0 0 0 0 0
P 0 -2 -1 -1 -2 -1 -4 -2 -2 -1 -1
A 0 -2 -1 5 0 5 -3 0 -2 -1 -1
W 0 -3 -3 -3 -3 -3 15 -3 -3 -3 -3
H 0 10 0 -2 -2 -2 -3 -2 10 0 0
E 0 0 6 -1 -3 -1 -3 -3 0 6 6
A 0 -2 -1 5 0 5 -3 0 -2 -1 -1
E 0 0 6 -1 -3 -1 -3 -3 0 6 6
Scoring the alignment using BLOSUM50 matrix
Gap penalty: -8Jan 18, 2010 33© UKK, Bioinformatics Centre, University of Pune, Pune