pakistan crop information portal - fao.org · analyse historical statistics on crop area, yield and...
TRANSCRIPT
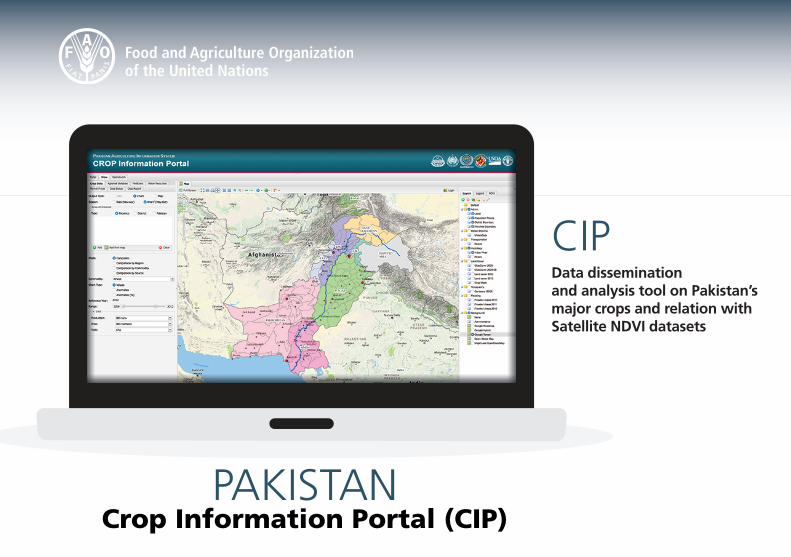
PAKISTANCrop Information Portal (CIP)
Data dissemination and analysis tool on Pakistan’s major crops and relation with Satellite NDVI datasets
CIP
Manage, display and analyse historical statistics on crop area, yield and Production and provide support for crop forecast.
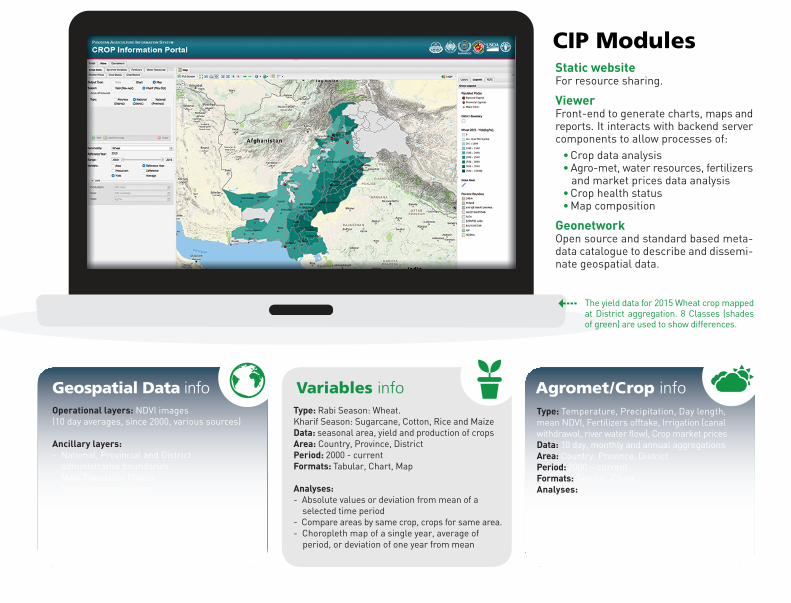
Variables infoType: Rabi Season: Wheat. Kharif Season: Sugarcane, Cotton, Rice and MaizeData: seasonal area, yield and production of crops Area: Country, Province, DistrictPeriod: 2000 - currentFormats: Tabular, Chart, Map
Analyses: - Absolute values or deviation from mean of a selected time period - Compare areas by same crop, crops for same area.- Choropleth map of a single year, average of period, or deviation of one year from mean
Geospatial Data infoOperational layers: NDVI images (10 day averages, since 2000, various sources)
Ancillary layers: - National, Provincial and District administrative boundaries - Main Populated Places- Meteorological stations - Roads network, Rivers, Contours - Land cover (various sources)- Crop masks, Flooded areas - Google, Open Street Map and MapQuest background layers
Agromet/Crop infoType: Temperature, Precipitation, Day length, mean NDVI, Fertilizers offtake, Irrigation (canal withdrawal, river water flow), Crop market pricesData: 10 day, monthly and annual aggregationsArea: Country, Province, DistrictPeriod: 2000 – currentFormats: Tabular, ChartAnalyses: - Seasonal trend for a single variable of: specified year / averages of period / deviation from average - Comparison seasonal trend of multiple variables for the same area
BackgroundTimely system updation and information dis-semination plays a significant role in policy formulations and management regarding food security and environmental sustainability. The project “Agriculture Information System, Bu-ilding Provincial Capacity in Pakistan for Crop Estimation, Forecasting, and Reporting based on the integral use of Remotely Sensed Data” of which the Crop Information Portal is a com-ponent, specifically focuses on the improve-ment of the capacity of provincial governments to produce timely report on agricultural infor-mation and crops statistics and on the deve-lopment of complementary geospatial systems to aid in the timely information dissemination.
The PortalThe Crop Information Portal is a WEB, knowledge base and data dissemination plat-
form for crop statistics and crop conditions in Pakistan. It has the role of managing and disseminating spatial (satellite images and thematic layers) and non-spatial (crop, clima-tic, agronomic, hydrologic and economic) data that the provincial Crop Reporting Services and other national or provincial institutions generate or collect on crop monitoring. The Portal provides users with an easy-to-use system that allows timely access to the lar-ge amount of crop information, agro-meteo-rological data and satellite images, perform analysis, and generate statistics in various formats.
The Portal will help monitor crops, vegetation and agro-meteorology during the growing period by comparing current with historical data and detect deviations from the ”normal” growing conditions that might influence crop production.
Benefits• Ability to generate customized reports based
on subsets of data stored in primary database.
• One-point of access to data that are currently collected and published by various institu-tions with diverse formats: spreadsheet, text or hard copy.
• Increased standardization, harmonization, minor effort in data merging and reduction of errors.
• Target those users who simply need access to data quickly and efficiently, to generate simple statistics or produce standardized ou-tputs for their analysis or reporting.
• Support impact studies of extreme climatic events such as drought and flooding on crops.
• SUPARCO (National), CRS Punjab and CRS Sindh (Provincial) have implemented and made operational a customized copy of the Portal.
Adopt technologies, tools and formats based on international standards and open source projects.
MAIN OBJECTIVES OF THE CROP PORTAL:
Monitor crop conditions during the growing stages, using historical Satellite NDVI data and current agronomic, agro-meteorologicalhydrological farm inputs and economic time series.
Provide users with a WEB GIS component to manage geospa-tial data from local or remote sources, including satellite images and derived products (NDVI), and other thematic datasets complementing crop information.
CIP ModulesStatic websiteFor resource sharing.
ViewerFront-end to generate charts, maps and reports. It interacts with backend server components to allow processes of:
• Crop data analysis • Agro-met, water resources, fertilizers and market prices data analysis• Crop health status• Map composition
GeonetworkOpen source and standard based meta-data catalogue to describe and dissemi-nate geospatial data.
The yield data for 2015 Wheat crop mapped at District aggregation. 8 Classes (shades of green) are used to show differences.
3 421
Manage, display and analyse historical statistics on crop area, yield and Production and provide support for crop forecast.
Variables infoType: Rabi Season: Wheat. Kharif Season: Sugarcane, Cotton, Rice and MaizeData: seasonal area, yield and production of crops Area: Country, Province, DistrictPeriod: 2000 - currentFormats: Tabular, Chart, Map
Analyses: - Absolute values or deviation from mean of a selected time period - Compare areas by same crop, crops for same area.- Choropleth map of a single year, average of period, or deviation of one year from mean
Geospatial Data infoOperational layers: NDVI images (10 day averages, since 2000, various sources)
Ancillary layers: - National, Provincial and District administrative boundaries - Main Populated Places- Meteorological stations - Roads network, Rivers, Contours - Land cover (various sources)- Crop masks, Flooded areas - Google, Open Street Map and MapQuest background layers
Agromet/Crop infoType: Temperature, Precipitation, Day length, mean NDVI, Fertilizers offtake, Irrigation (canal withdrawal, river water flow), Crop market pricesData: 10 day, monthly and annual aggregationsArea: Country, Province, DistrictPeriod: 2000 – currentFormats: Tabular, ChartAnalyses: - Seasonal trend for a single variable of: specified year / averages of period / deviation from average - Comparison seasonal trend of multiple variables for the same area
BackgroundTimely system updation and information dis-semination plays a significant role in policy formulations and management regarding food security and environmental sustainability. The project “Agriculture Information System, Bu-ilding Provincial Capacity in Pakistan for Crop Estimation, Forecasting, and Reporting based on the integral use of Remotely Sensed Data” of which the Crop Information Portal is a com-ponent, specifically focuses on the improve-ment of the capacity of provincial governments to produce timely report on agricultural infor-mation and crops statistics and on the deve-lopment of complementary geospatial systems to aid in the timely information dissemination.
The PortalThe Crop Information Portal is a WEB, knowledge base and data dissemination plat-
form for crop statistics and crop conditions in Pakistan. It has the role of managing and disseminating spatial (satellite images and thematic layers) and non-spatial (crop, clima-tic, agronomic, hydrologic and economic) data that the provincial Crop Reporting Services and other national or provincial institutions generate or collect on crop monitoring. The Portal provides users with an easy-to-use system that allows timely access to the lar-ge amount of crop information, agro-meteo-rological data and satellite images, perform analysis, and generate statistics in various formats.
The Portal will help monitor crops, vegetation and agro-meteorology during the growing period by comparing current with historical data and detect deviations from the ”normal” growing conditions that might influence crop production.
Benefits• Ability to generate customized reports based
on subsets of data stored in primary database.
• One-point of access to data that are currently collected and published by various institu-tions with diverse formats: spreadsheet, text or hard copy.
• Increased standardization, harmonization, minor effort in data merging and reduction of errors.
• Target those users who simply need access to data quickly and efficiently, to generate simple statistics or produce standardized ou-tputs for their analysis or reporting.
• Support impact studies of extreme climatic events such as drought and flooding on crops.
• SUPARCO (National), CRS Punjab and CRS Sindh (Provincial) have implemented and made operational a customized copy of the Portal.
Adopt technologies, tools and formats based on international standards and open source projects.
MAIN OBJECTIVES OF THE CROP PORTAL:
Monitor crop conditions during the growing stages, using historical Satellite NDVI data and current agronomic, agro-meteorologicalhydrological farm inputs and economic time series.
Provide users with a WEB GIS component to manage geospa-tial data from local or remote sources, including satellite images and derived products (NDVI), and other thematic datasets complementing crop information.
CIP ModulesStatic websiteFor resource sharing.
ViewerFront-end to generate charts, maps and reports. It interacts with backend server components to allow processes of:
• Crop data analysis • Agro-met, water resources, fertilizers and market prices data analysis• Crop health status• Map composition
GeonetworkOpen source and standard based meta-data catalogue to describe and dissemi-nate geospatial data.
The yield data for 2015 Wheat crop mapped at District aggregation. 8 Classes (shades of green) are used to show differences.
3 421
PAKISTANCrop Information Portal (CIP)
Data dissemination and analysis tool on Pakistan’s major crops and relation with Satellite NDVI dataset
CIP
cip.sgs-suparco.gov.pk/MapStore
©FA
O 2
016
I615
0E/0
1/09
.16