pakistan microfinance review 2017 · paistan microfinance review 2017 inancial services for all the...
TRANSCRIPT

PAKISTANMICROFINANCE REVIEW 2017
A N N UA L A SS E SS M E N T O F T H E M I C R O F I N A N C E I N D U ST RY
F I N A N C I A L S E R V I C E S F O R A L L


Produced by Pakistan Microfinance NetworkDesign and Layout by O3 Interfaceswww.o3interfaces.com

ANNUAL ASSESSMENTOF THE MICROFINANCE INDUSTRY
PakistanMicrofinanceReview2017

Annual Assessment of the Microfinance Industry
i
Pakistan Microfinance Review 2017
Financial services for all
EditorialBoard
Mr. Ghalib NishtarChairperson, Editorial BoardPresident, Khushhali Bank Limited (KBL)
Syed Samar HusnainExecutive Director, Development Finance Group, State Bank of Pakistan (SBP)
Mr. Blaine StephensCOO and Director of Analysis,Microfinance Information eXchange, Inc. (MIX)
Mr. Alex ReadEconomic Adviser,Department for International Development (UK)
Mr. Yasir AshfaqChief Executive Officer, Pakistan Microfinance Investment Company (PMIC)
Mr. Masood Safdar GillDirector Programme, Urban Poverty Alleviation Programme, National Rural Support Programme (NRSP)

Annual Assessment of the Microfinance Industry
ii
Pakistan Microfinance Review 2017Financial services for all
PMNTeam
Mr. Ali BasharatAuthor and Managing Editor
Mr. Zeenoor Sohail SheikhCo-Author and Data Collection
Ms. Maida ZafarCo-Author and Data Collection
Ms. Maham LiaqatData Collection

Annual Assessment of the Microfinance Industry
iii
Pakistan Microfinance Review 2017
Financial services for all
Acronyms and Abbreviations
AC&MFD Agriculture and Microfinance Division
ADB Asian Development Bank
AMRDO Al-Mehran Rural Development Organization
AML Anti-Money Laundering
BPS Basis Points
CAR Capital Adequacy Ratio
CIB Credit Information Bureau
CDD Customer Due Diligence
CGAP Consultative Group to Assist the Poor
CGL Credit Guarantee Limits
CNIC Computerized National Identity Card
CPP Client Protection Principles
CPI Consumer Price Index
CPI Client Protection Initiative
CPC Consumer Protection Code
DFI Development Financial institute
DFID Department for International Development, UK
DPC Deposit Protection Corporation
DPF Depositor’s Protection Fund
ECA Eastern and Central Europe
ESM Environment and Social Management
EUR Euro
FATF Financial Action Task Force
FIP Financial Inclusion Program
FINCA FINCA Microfinance Bank Ltd.
FMFB The First Microfinance Bank Ltd.
FSS Financial Self Sufficiency
FY Financial Year

Annual Assessment of the Microfinance Industry
iv
Pakistan Microfinance Review 2017Financial services for all
G2P Government to Person
GBP Great Britain Pound
GDP Gross Domestic Product
GLP Gross Loan Portfolio
GNI Gross National Income
GoP Government of Pakistan
IAFSF Improving Access to Financial Services Support Fund
IFAD International Fund for Agricultural Development
IFC International Finance Corporation
JWS Jinnah Welfare Society
KBL Khushhali Bank Ltd.
KF Kashf Foundation
KIBOR Karachi Inter-Bank Offering Rate
KP Khyber Pakhtunkhwa
KYC Know Your Customer
LCPS Low Cost Private Schools
MIV Microfinance Investment Vehicle
MIX Microfinance Information Exchange
MCGF Microfinance Credit Guarantee Facility
MCR Minimum Capital Requirement
MENA Middle East and North Africa
MFB Microfinance Bank
MFCG Microfinance Consultative Group
MF-CIB Microfinance Credit Information Bureau
MFP Microfinance Providers
MFI Microfinance Institution
MFT Microfinance Transparency
MIS Management Information System
MMFB Mobilink Microfinance Bank Ltd
MSME Micro, Small and Medium Enterprises
MIV Microfinance Investment Vehicle
MO Micro-Options
NADRA National Database and Registration Authority
NBMFI Non-Bank Microfinance Institutes
NGO Non-Governmental Organization
NFLP National Financial Literacy Program
NFIS National Financial Inclusion Strategy
NMFB Network Microfinance Bank Limited
NPLs Non-Performing Loans

Annual Assessment of the Microfinance Industry
v
Pakistan Microfinance Review 2017
Financial services for all
NRDP National Rural Development Program
NRSP National Rural Support Programme
OPD Organization for Participatory Development
OSS Operational Self Sufficiency
OTC Over-The-Counter
P2P Person to Person
P2G Person to Government
PAR Portfolio at Risk
PBA Pakistan Banks Association
PBS Pakistan Bureau of Statistics
PKR Pakistan Rupee
PMN Pakistan Microfinance Network
PO Partner Organization
PPAF Pakistan Poverty Alleviation Fund
PPI Grameen Progress out of Poverty Index
PRISM Programme for Increasing Sustainable Microfinance
PRSP Punjab Rural Support Programme
PTA Pakistan Telecommunication Authority
ROA Return on Assets
ROE Return on Equity
RSP Rural Support Programme
SBP State Bank of Pakistan
SC The Smart Campaign
SDS SAATH Development Society
SECP Securities and Exchange Commission of Pakistan
SPTF Social Performance Task Force
SME Small and Medium Enterprise
SRSO Sindh Rural Support Organization
SRDO Shadab Rural Development Organization
SVDP Soon Valley Development Program
TMFB Telenor Microfinance Bank Ltd
UBL United Bank Limited
USD United States Dollar
USSPM Universal Standards for Social Performance Management
VDO Village Development Organization
WPI Wholesale Price Index

Annual Assessment of the Microfinance Industry
vi
Pakistan Microfinance Review 2017Financial services for all
Highlights
Year 2013 2014 2015 2016 2017
Active Borrowers(in millions)
2.4 2.8 3.6 4.2 5.5
Gross Loan Portfolio(PKR billions)
2.4 2.8 3.6 4.2 5.5
Active Women Borrowers(in millions)
1.4 1.6 2 2.3 2.7
Branches 1,606 1,747 2,754 2,367 3,533
Total Staff 17,456 19,881 25,560 29,413 36,053
Total Assets(PKR billions)
81.5 100.7 145.1 225.3 330.4
Deposits(PKR billions)
32.9 42.7 60 118.1 185.9
Total Debt(PKR billions)
26.9 31.1 44.5 54.7 74.1
Total Revenue(PKR billions)
17.3 24.3 32.8 41.8 65.7
Operational Self Sufficiency(percentage)
118.1 120.6 124.1 127 124.7
Financial Self Sufficiency(percentage)
116.5 119.6 121 123.9 122.4
PAR > 30(percentage)
2.5 1.1 1.5 1.2 0.5
Return on Assets (ROA) 3.3 3.5 3.6 3.4 3.2
Return on Equity (ROE) 16.1 16 15 18.9 19.5

Annual Assessment of the Microfinance Industry
vii
Pakistan Microfinance Review 2017
Financial services for all
Table ofContents
The Year in Review
Macroeconomy and Microfinance Industry 04
Policy and Regulatory Environment 05
Industry Initiatives 08
Conclusion 14
Financial Performance Review
Scale and Outreach 19
Financial Structure 29
Profitability and Sustainability 32
Productivity 35
Risk 37
Conclusion 38

Annual Assessment of the Microfinance Industry
viii
Pakistan Microfinance Review 2017Financial services for all
Social Performance Review
Annexures
Analysis of the Sector’s SP Indicators 42
Social Goals 42
Conclusion 54
The Way Forward
Impact of CPEC on MicrofinanceOutreach
57
Funding Landscape 59
Digital Services Platform – a pathtowards digitizing Microfinance
60
E-Commerce 62
Insurtech 63
The Credit Bureau Impasse 64
Cost of Compliance 65
Data Privacy 66
AI - Performance indicators of industry 2017
69

Pakistan Microfinance Review 2017
Financial services for all
1 Annual Assessment of the Microfinance Industry

Section 01The Year in Review
2
Pakistan Microfinance Review 2017Financial services for all
Annual Assessment of the Microfinance Industry
Section 01THE YEAR IN REVIEW

Annual Assessment of the Microfinance Industry
Section 01
3
The Year in ReviewPakistan Microfinance Review 2017
Financial services for all
The Year in Review
The year 2017 saw the industry experience another successful year of continued growth across credit, savings and insurance, backed by a conducive macroeconomic and regulatory environment.
Microfinance has come into its own as a crucial player in furthering the financial inclusion agenda in Pakistan. The State Bank of Pakistan (SBP) has kept this in view in the recently launched SME policy that revises the lending limits of Microfinance Banks (MFBs) to cater to the needs of the lower end of Small and Medium Enterprise (SME) spectrum. With the growth of the industry, players have been increasingly leveraging technology to
expand outreach and lower operating costs through automating loan origination, using branchless banking for repayments, use of mobile wallets (m-wallets) and digital credits amongst other innovations.
As the number of microfinance clients continues to increase, it is imperative that clients be made aware of their rights and transparency be improved. As part of efforts to strengthen client protection, a three-tiered client grievance mechanism is being set up for the industry. Additionally, a pricing transparency campaign has been launched by the Pakistan Microfinance Network (PMN) using a standardized

Annual Assessment of the Microfinance Industry
Section 01
4
The Year in ReviewPakistan Microfinance Review 2017Financial services for all
tool for calculating the Annual Percentage Rate (APR) across microfinance providers (MFPs). Moreover, several players are signing up for social
audits and Smart Certifications to demonstrate their commitment to client protection.
The country continued to experience a growth in the economy during Fiscal Year 2017. With the growth in the real Gross Domestic Product (GDP) at an all-time high in the last decade, having risen from 4.5% in 2016 to 5.3% in 2017, the major components contributing to the surge were the developments in agriculture (2017: 3.5, 2016: 0.3) and the services sector (2017: 6.0, 2016: 5.5)1. Other factors that contributed to the rise in GDP include complementary macroeconomic policies such as a fitting monetary policy and improved private sector credit, infrastructure and energy projects in the China-Pakistan Economic Corridor (CPEC) and improved tax incentives provided by the government to support exports, agriculture and private investments.
2017 also saw improvements in the security situation and the energy shortages of the country. A 16% decline in terrorist attacks within the country was experienced with the number of fatalities due to terrorism witnessing a 10% decline from 20162. With the National Security Policy and the Counter-Extremism Policy to be unveiled in 2018, and the upcoming national election, it is highly likely that the reform momentum and the macroeconomic policy may be affected in the months to come. Towards the end of the year, it was noted that losses due to load-shedding still ate up a sizable share of the GDP as the average power shortfall remains 4,000 megawatts while the average gas shortfall is at 2,000 cubic feet translating into losses of PKR 15 billion per annum3. It was also identified that 11 out of the 17 priority
energy projects were under construction while other energy projects for production of thousands of megawatts are in the pipeline. These could be the solution to the energy crisis faced by the nation provided internal or external factors do not delay their completion.
The microfinance industry performed remarkably well, experiencing a 27% growth in credit outreach based on the number of Active Borrowers (2017: 5.80 million, 2016: 4.57 million) with a total gross loan portfolio (GLP) of over PKR 200 Billion, as compared to almost 137 Billion in 2016, at year end4.
While the Consumer Price Index remained lower than the annual target, the general trend indicated an increase in the year to come (2017: 4.2%, 2016: 2.9%)5. Factors contributing to this increase included disrupted supplies of perishable and imported products, stabilized prices of other heavyweight food items and consumables, a rise in oil and fuel prices and finally the gradual increase in education and health related components. With the increase in the volatility of global commodity prices, a significant impact was observed on the balance of payments as well as inflation. Inflation, after remaining moderate during Fiscal Year 2017, is expected to rise in 2018 and 2019 due to higher domestic demand pressures and a slight increase in international oil prices.
The Monetary Policy looked to benefit from favorable interest rates that prevailed during the year (2017:
Macro-economy and Microfinance Industry
1 Annual Report 2016-17 (State of the Economy), SBP2 Pakistan Security Report 2017, Pak Institute of Peace Studies (PIPS)3 The Nation, Energy Shortfall still a threat to the economy: PEW4 MicroWatch, A quarterly outreach publication, PMN, Issue 46, Quarter 4, 20175 Annual Report 2016-17 (State of the Economy), SBP

Annual Assessment of the Microfinance Industry
Section 01
5
The Year in ReviewPakistan Microfinance Review 2017
Financial services for all
5.75%) which continue to be at a historic low due to low inflation. A decline in the weighted average lending rate (incremental) by 57 basis points (bps) on average during the year brought it to 7.2%. The low interest rates and gradual developments in energy and infrastructure projects under CPEC triggered improvements, which were felt at both macro and micro levels, and resulted in an unprecedented expansion of PKR 746 Billion in private sector credit. Despite this, lending to the microfinance industry remained limited to only Tier 1 institutions whereas mid-tier institutions have struggled to borrow from commercial lenders.
Fiscal policy experienced the largest deficit in four years at 1.6% of GDP, which indicates a rise in non-interest expenditures. This deficit led to a need for financing, which was largely met through bank borrowing. Finances available from external sources remained significant, most of which came into action towards the end of the fiscal year. The suppressed interest payments during the last three years, in the existing low interest rate conditions, led
to increased development spending. For this trend to continue, development spending would require generation of revenue at a considerably faster rate than the one prevailing during 2017. Fiscal slippages are expected to continue through the election year, which will result in a wider fiscal deficit during 2018. Improvement hinges upon a revival in exports, a decline in imports, and steady remittance flows while failure to reduce the fiscal deficit is bound to put further pressure on already waning reserves.
The outlook for the forthcoming fiscal year is for modestly higher growth, subject to continued macro-economic and political stability, as well as steady progress in implementing the primary policies of the Government’s medium-term reform program, which tackles obstacles to growth. The major assumption behind this projection is that oil prices will increase moderately but remain low. However, this will likely push up interest rates from the current historical low resulting in an increase in financial expenses for MFPs.
Pakistan’s policy and regulatory environment continues to remain among the best in the world particularly as the regulatory umbrella has been extended to the entire microfinance industry with the SECP taking on the role of regulating non-bank MFIs. The transition of non-bank MFIs into regulated entities has been largely completed with 25 entities having been granted licenses and one entity in the process of converting into a Microfinance Bank. However, small entities having less than 5 thousand borrowers or a gross loan portfolio (GLP) below PKR 50 million have been made exempt under the regulations. Fresh players especially the FinTechs dealing in digital credit and offering nano loans, that is small value loans delivered through mobile phones, are likely to use the Non-Bank Microfinance Companies (NBMFC) legal platform to extend the
loans.
On the policy front, the launch of the Policy for Promotion of SME Finance by State Bank of Pakistan (SBP) is a significant development. In addition, industry infrastructure was strengthened by the establishment of the Deposit Protection Company (DPC) and the Pakistan Mortgage Refinance Company (PMRC).
Policy and Regulatory Environment

Annual Assessment of the Microfinance Industry
Section 01
6
The Year in ReviewPakistan Microfinance Review 2017Financial services for all
Policy for Promotion of SME Finance in Pakistan6
The Policy for Promotion of SME Finance in Pakistan was launched in December 2017 by the State Bank with the objective to develop and promote SME sectors in the country through SME Finance.
SMEs play a crucial role in the social and economic uplift of any economy as they are an engine for job creation and income generation. In a country like Pakistan, where unemployment and the youth bulge are key issues, SMEs can play a key role in promoting growth and social stability. SMEs account for 90 percent of the 3.2 million enterprises in the country and contribute to 30 percent of the GDP7.
The SME sector is also one of the main areas of focus under the National Financial Inclusion Strategy (NFIS). Key targets set by SBP for 2020 include increasing the share of SME finance in private sector credit from the prevailing 8 percent to 17 percent in the next three years and increasing the number of SME borrowers from 177,000 to 500,000 during
the same period. SBP has outlined 9 key pillars to meet these objectives, (see Box 1.1). Key initiatives covered under these pillars include setting up a credit guarantee company for offering a risk sharing facility for SMEs, setting up a collateral registry and assigning SME financing targets to banks and Development Finance Institutions (DFIs).
Under this policy, the lending limit of the MFBs has been revised upwards to PKR 1 million. In addition, SBP is looking into developing regulatory and legal frameworks for transforming MFBs into MSE banks. MFBs shall also be eligible to access credit guarantee schemes for SME financing. Keeping in view the small loan size of the lower end of the SME spectrum and the high degree of financial exclusion among them, the regulator is of the view that MFBs are better positioned to meet the financing needs of these entities.
MFBs have been allowed to lend up to a loan size of PKR 500,000 since 2012, however, disbursement of loans of this magnitude has not gained traction. Nevertheless, despite the smaller loan sizes, the loan book of microenterprises touched PKR 12 billion by the end of the year 2017, which is slightly more than 5 percent of the total industry portfolio8.
At first glance, the market segments for loan sizes between 150,000 to 500,000 and 500,000 to 1 million seem to be similar; however, as we upscale in terms of loan size, MFBs will have to target a new segment
Box 1.1Pillars of Policy of Promotion of SME Finance in Pakistan
1. Improving Regulatory Framework2. Upscaling through Microfinance Banks3. Risk Mitigation Strategy 4. Simplified Procedures for SME Financing5. Program Based Lending and Value Chain Financing 6. Capacity Building and Awareness Campaign 7. Handholding of SMEs – Non-Financial Advisory Service (NFAS)8. Leveraging Technology to Promote SME Financing 9. Simplifying Taxation Regime for SMEs
6 http://www.sbp.org.pk/smefd/PolicyPromotionSME-Finance.pdf7 http://www.sbp.org.pk/smefd/PolicyPromotionSME-Finance.pdf8 MicroWATCH, A quarterly outreach publication, Issue 47, PMN, March 2018

Annual Assessment of the Microfinance Industry
Section 01
7
The Year in ReviewPakistan Microfinance Review 2017
Financial services for all
of the market which they did not previously cater to. With these amendments coming into effect, MFBs will now be operating in two independent markets segments, the microenterprise and the SME segments. As a result, MFBs have to set up separate windows to deal with the new segment, developing a new strategy, appraisal tools and products. As this segment is upmarket compared to the traditional microfinance market, this may lead to MFBs deviating from their original mission of proving financial services to the clientele at the base of pyramid.
NBMFC TransitionOverall, 25 entities have been granted licenses for Non-Bank Microfinance Companies by the SECP. These entities include both MFIs and RSPs. To ensure a smooth transition of non-bank entities into regulated entities, SECP has worked closely with PMN and PMIC to ensure a smooth transition.
To facilitate organizations with a very small base of operations, it has been recommended that they may be exempted from obtaining a license provided that their portfolio remains below PKR 50 million and number of active borrowers are below 5 thousand. In addition, permission has been sought to allow NBMFCs to set up non-financial subsidiaries. Orientation sessions have been held for regulatory reporting for NBMFCs by SECP.
In view of the governance issues faced by the newly formed NBMFCs due to shortage of qualified pool of directors, directors with development sector experience have been allowed to become part of the board of NBMFCs. Also, extension has been provided to NBMFCs to end cross directorship. In addition, to assist in the transition process, a consultative group has been set up which includes NBMFCs, PMN and PMIC to assist in future growth of the sector.
Deposit Protection Corporation (DPC)Deposit protection is a methodology used to safeguard the clients of a depository institution. In the event of insolvency or failure of an institution, a
fund or pool is created to compensate a depositor of the institution. Another salient feature of this mechanism is that a fixed maximum amount per depositor is covered.
In 2016, the Government of Pakistan authorized the State Bank of Pakistan (SBP) to establish a Deposit Protection Corporation (DPC) as a subsidiary in accordance with the Deposit Protection Act, 2016. In 2018, the DPC is expected to commence business with all scheduled banks under section 37 (2) of the SBP Act, 1956 mandated to be members of the corporation. The authorized Share Capital was set at PKR 1 Billion with the Board of the corporation to be headed by the Deputy Governor of the SBP who shall act as the Chairman of the Board along with six other directors nominated under the oversight of the SBP and the Ministry of Finance (MoF). The members are also subject to a premium as per regulation of the SBP and the corporation will guarantee full payment of the amount held by a member depository irrespective of the number or size of deposits. In case of foreign currency accounts, the compensation would be the rupee equivalent of the protected amount at the exchange rate declared by the SBP.
Deposit protection is a new initiative towards client protection and promoting financial inclusion in Pakistan. Such an initiative would increase the confidence of depositors with the banks and consequently deposits shall rise. Importantly this initiative will greatly assist MFBs in mobilizing deposits from retail level clients.
Pakistan Mortgage Refinance Company (PMRC)The Pakistan Mortgage Refinance Company (PMRC) was established in early 2018, to cater to the housing shortfall of 10 million units across the country. The ownership structure of the company is such that 49% is owned by the Government of Pakistan, while the remaining 51% is held by private institutions, including banks. The paid-up capital of PMRC is set at PKR 6 billion. The aim of the institute is to mitigate credit risk for financial institutions by providing fixed-rate funding.

Annual Assessment of the Microfinance Industry
Section 01
8
The Year in ReviewPakistan Microfinance Review 2017Financial services for all
The creation of PMRC is expected to mitigate the 10 million housing shortage which is due to limited financing, approximately 0.5 percent of the Gross Domestic Product (GDP) of the country, available to consumers. With demand for housing growing at 400,000 – 700,000 units per annum, the initiative is in line with the National Financial Inclusion Strategy (NFIS) set by the government. There is a need for low and middle-income borrowers to access housing finance which is not subject to interest rate fluctuations. Not only will the company provide
funds at a fixed rate but also help in controlling non-performing loans. The portfolio of outstanding housing finance was PKR 80 billion as of 2017 and there is a need for sustainable, new and innovative products in the sector.
MFPs which are expanding their footprint in the country and intend to enter the low-cost housing market can benefit from PMRC. It will provide them access to the long-term liability required for housing finance.
The year 2017 saw several new initiatives being launched by the industry especially in the context of responsible finance. Some of these initiatives are discussed in this section.
Branchless Banking Branchless banking is the delivery of financial services using non-conventional means, for instance an agent network and the use of Information and Communications Technology (ICT) such as Point of Sales terminals or cell phones amongst others. Branchless banking is vital for economic growth as it is an effective means to reach out to the unbanked population thereby improving the economic conditions of the financially marginalized bracket of society. Pakistan is one of the fastest developing markets for branchless banking in the world. Clear regulations and a regulator that is eager to accommodate the private sector while deploying means to promote innovation have nurtured a dynamic branchless banking sector.
The fiscal year 2017 saw healthy growth in BB accounts compared to last year. By the end of the year, the number of BB accounts had risen by 86.6% compared to 2016, reaching 37.2 million of which 51% or 19.3 million accounts were reported
to be active. 19.6% or over 7.3 million of the total BB accounts were accounts attributable to female clients. Similarly, the value of branchless banking transactions increased by 35.5% during the same period, reaching the reported figure of PKR 647.6 million9. It was also recorded that by December 2017, over 1.9 million transactions were being conducted per day using branchless banking channels. The number of Social Welfare Disbursements for the Benazir Income Support Programme, Employees Old-Age Benefits Institution, Internally Displaced Persons, World Food Programme and others during the year under review accounted for over 25 million transactions with a cumulative value of PKR 132.8 billion. Moreover, of the 170.3 million customer-oriented transactions that were conducted during the year, the volume of Mobile Wallets (M-Wallets) was over 120 million with a value of PKR 321.60 billion as compared to a volume of 49.9 million with a value of PKR 171 billion for over-the-counter (OTC) transactions.
The indicators above highlight the potential of growth in the Branchless Banking sector. The State Bank’s encouraging policies and the vigorous initiatives by market players have resulted in people becoming more aware of opening accounts via biometric verification systems placed at various agents and mobile locations. With NADRA actively pursuing cost reduction techniques, banks have also been
Industry Initiative
9 Branchless Banking Newsletter, Multiple Issues, SBP

Annual Assessment of the Microfinance Industry
Section 01
9
The Year in ReviewPakistan Microfinance Review 2017
Financial services for all
persuaded to perform customer verifications when opening new customer accounts.
While competition in the sector is beneficial for the consumers, the market needs to identify the segments that remain inactive and introduce improved product offerings for this segment to further encourage the use of Branchless Banking services. Consequently, with only 3 major players in the market (UBL Omni, JazzCash, and EasyPaisa), the regulator needs to encourage smaller and emerging players in the market to develop their businesses so that new and improved products/services are introduced while keeping prices affordable. Launch of Assan Accounts by SBP later in the 2018 can be catalyst for growth in mobile money accounts.
Pakistan Microfinance Investment Company (PMIC) The national-level apex institution for microfinance providers in the country - Pakistan Microfinance Investment Company Limited (PMIC) which was established in 2016 by Pakistan Poverty Alleviation Fund (PPAF), Karandaaz Pakistan and KfW, started its operation in 2017. The sponsors have adequately capitalized PMIC with an equity of PKR 6 billion in addition to which long term sub-ordinated loans have also been provided to the institution. PMIC has adopted an integrated intervention approach, whereby, in addition to its wholesale lending operations, PMIC recognizes the importance of developing the sector, both in terms of institutional capacity and need based financial products and services for the end clients, to create meaningful socio-economic impact.
The entity initiated lending operations in 2017 and in its first year of operations, PMIC built a loan book of PKR 11.5 billion by entering into partnership with
16 borrowing institutions. During the first year of operations, PMIC has already impacted the lives of 413,000 households of which 86% are women and 55% of the portfolio is deployed in rural areas. As the apex institution in the sector, PMIC is focused on lending in segments that generate jobs, increase revenues of small and micro enterprises, stimulate digital finance and expand access to formal finance for the underserved and marginalized but enterprising segments, especially women.
Going forward, in line with the funding needs of the sector, PMIC will be providing innovative financial solutions tailored to the specific needs of its valued microfinance providers which include syndicated loans, Tier II financing, capital market instruments, securitization, transactional advisory services and complementary products /services such as partial or first loss credit guarantees, etc. that may be bundled with other investment banking products.
PMIC, in collaboration with key players in the eco-system launched various innovative and beneficiary centric microfinance plus initiatives. These include agriculture value chain for smallholder farmers, crop and livestock micro-insurance products, graduating clients towards SME through enterprise development, graduating clients out of poverty, and digitization of microfinance operations.
Advancement in Responsible FinanceGrievance Redressal Mechanism FrameworkProvision of formal channels of Grievance Redressal to microfinance clients is one of the cardinal principles of client protection set forth by the Smart Campaign (SC)10. The principle necessitates that providers have timely and responsive mechanisms in place for complaints and problem resolution for their clients and use these mechanisms both to resolve individual problems and to improve their
10 The Smart Campaign has developed a universal set of minimum client protection standards for the global microfinance industry. This set of standards is known as the Client Protection Principles (CPPs) and Smart Assessments are designed to assess institutions around these principles for ethical and responsible microfinance. These CPPs have been established through global industry consensus, including MFPs, international networks and national associations. The principles include: (i) appropriate product design and delivery, (ii) prevention of over-indebtedness, (iii) transparency, (iv) responsible pricing, (v) fair and respectful treatment of clients, (vi) privacy of client data, and (vii) mechanisms for complaint resolution.

Annual Assessment of the Microfinance Industry
Section 01
10
The Year in ReviewPakistan Microfinance Review 2017Financial services for all
products and services. Since Microfinance Providers (MFPs) exist to serve their clients, it is necessary for them to create avenues for clients to air their suggestions, concerns and grievances. This is not only important for better operational flow, but also to raise any red flags before problems become systemic or crises become unavoidable, such as delinquency crises, or loss in revenue due to inferior product design. Such problems can be gauged in advance and averted with a well-functioning client complaints handling system that clients are aware of and know how to use.
The Pakistan Microfinance Network is committed to advancing the adoption of client protection principles at the individual MFP as well as at the sector levels. Between 2013 and 2015, PMN in collaboration with the Smart Campaign, the State Bank of Pakistan and Department for International Development (DFID), carried out a client protection monitoring project, under which 19 Smart assessments of MFPs in Pakistan were carried out. These assessments provided a unique opportunity to gauge the compliance levels vis-à-vis client protection principles in Pakistan.
Consolidated findings of the said assessments yielded significant weaknesses in the domain of grievance handling mechanisms. Out of 19 MFPs, 39 percent were not meeting the international standards of client protection on the Smart Campaign’s principle of Complaint Resolution Mechanism, another 25 percent met the standards partially and only about 36 percent of institutions were able to demonstrate compliance to all the standards.
Although in the last couple of years, substantial changes have been made in the Grievance Redressal Mechanism (GRM) domain and many MFPs have put in place formal processes for complaint handling, there are still variations in the standards that are followed. Since PMN’s membership encompasses a wide variety of players from very small institutions to large banks, PMN is keen to support the microfinance industry in improving practices around Grievance Redressal.
In 2017, PMN in collaboration with the Smart Campaign, has developed a three-tiered GRM framework for its member MFPs to establish minimum standards of good practice, depending upon their size. Based on the framework, over the next two years, PMN will extend technical
assistance to its members to bring their practices at par with the standards outlined. The framework gauges an organization’s performance in the GRM domain along eight parameters, putting forth the minimum standards that an MFP should meet under each parameter. These parameters include: (i) Commitment to provision of GR channels to its clients, (ii) Communication to clients about their right to lodge a complaint, (iii) Visibility and Access of the channels to the clients, (iv) Active and Effective processes are in place for resolution of grievances once it is lodged, (v) Continual Improvement of the GRM system based on client reception and response, (vi) Personnel and Training – MFP staff is well trained on how to operate the GRM in place, (vii) Remedies that an MFP has introduced in their products/services/systems based on systematic analysis of the complaints and viii) External Review of the complaints by auditors.
The framework chalks out three levels of compliance with Level III being the highest and most advanced level, required of the large MFPs (LFPs). Level II of the framework is the intermediate level, designed for medium sized organizations while Level I detail the minimum standards of practice that an organization should maintain irrespective of their size, small MFPs included.
Simultaneously, PMN is involved in advocacy at various levels for the establishment of a sector-level third party grievance redressal platform for microfinance clients. While the clients of microfinance banks can contact the complaint cell housed within the consumer protection department at the SBP, no such avenue was available for the clients of Non-Bank Microfinance Institutions (NBMFIs). Considering the delinquency pockets that have been witnessed in the past decade, there is a need for independent mechanisms of grievance redressal and therefore, the Securities and Exchange Commission of Pakistan (SECP) launched a complaint cell in June 2017 to address complaints of the clients of NBMFIs in case satisfactory complaint resolution is not provided to the client by the relevant NBMFI. PMN is also supporting stakeholders in development of GRM guidelines for implementation by NBMFIs.
Pricing TransparencyPMN has promoted the use of a standardized tool for calculation of Annual Percentage Rate (APR) for MFPs. The pricing tool has been developed by

Annual Assessment of the Microfinance Industry
Section 01
11
The Year in ReviewPakistan Microfinance Review 2017
Financial services for all
MicroFinanza Rating (MFR), which is a private and independent international rating agency specializing in microfinance.
The APR calculation simply indicates the cost to borrow a unit of currency for one year. The need for a standardized tool that calculates the APR for an MFP stems from need for pricing transparency and client protection. A standardized pricing tool to calculate the APR is beneficial for the clients of MFPs as they can compare the cost of borrowing from one institution as compared to the other based on a standardized benchmark. Moreover, the pricing formula includes same price components for all MFPs i.e. interest, fees, mandatory insurance, tax and mandatory saving to arrive at the effective price charged to the customer.
To attain transparency, MFPs can calculate the APR using the standardized pricing tool and attain a seal of transparency (Gold or Silver based on their chosen level of transparency) by publishing it on MFR’s pricing data platform. MFR has developed and manages a secure data platform for disclosure of APR data to data providers and subscribers (mostly investors).
By using the standardized pricing tool, MFPs get access to the APR being charged by MFPs within their country, region and around the globe. This allows the MFPs to benchmark their APR and evaluate it with respect to the MFPs strategic direction. Moreover, MFPs can improve their international visibility and improve reputation with investors, network and regulator by demonstrating transparency.
Client Awareness CampaignOver the past few years, microfinance outreach in Pakistan has grown rapidly with a current outreach of approximately 5.8 million micro-borrowers (a 39% year-on-year increase) and a gross loan portfolio of PKR 202 Billion (86% increase on YoY basis). Increase in borrowers and intensification of competition amongst microfinance providers warrants increased consumer protection, therefore, it is the right time to put in place best practices around consumer protection to not only protect clients from undesirable practices but to also protect the reputation of the microfinance sector.
The Pakistan Microfinance Network is promoting best practices and transparency in the sector and has taken on an active role in consumer protection
as well. Given the industry momentum coupled with growth rate indicators, PMN is taking the initiative of promoting consumer protection by making the clients of microfinance aware of their rights and responsibilities.
The need to promote consumer protection and basic financial literacy amongst clients of Microfinance Providers (MFPs) stems from a needs assessment study conducted by PMN in 2017. As part of the needs assessment study PMN carried out field research with clients of MFPs throughout Pakistan and conducted In-Depth Interviews (IDIs) with industry stakeholders. The needs assessment study has formed the basis for a nationwide campaign on raising client awareness and financial literacy amongst the existing and potential clients of MFPs. Based on the results of the study, PMN proposed a methodology to target the most pressing training needs vis-à-vis financial literacy to conduct a robust client awareness campaign at national level.
The campaign is built around 4 main objectives which are i) Promotion of responsible behavior by clients through effective and consistent communication ii) Raise awareness among clients about range of products and modalities available iii) Introduce various grievance redressal mechanisms to clients iv) Promotion of an image of microfinance as a consumer centric industry.
Social Audit and Smart AssessmentTo promote Social Performance by MFPs, PMN conducted seven (7) social audits in 2017 with i) Kashf Foundation, ii) Farmers Friend Organization (FFO), iii) Rural Community Development Program (RCDP), iv) Association of Gender Awareness and Human Empowerment (AGAHE), v) Akhuwat, vi) SAFCO support foundation vii) DAMEN Support Programme. These MFPs went through the process of an external social audit conducted by PMN to manage their social performance and to examine their level of adherence to Universal Standards for Social Performance Management (USSPM) developed by the Social Performance Task Force (SPTF).
Moreover, PMN facilitated the process for carrying out the Smart Certification assessment of NRSP Microfinance Bank Limited and First Microfinance Bank Limited (FMFB) in 2017. By undergoing the Smart Certification process, the organizations

Annual Assessment of the Microfinance Industry
Section 01
12
The Year in ReviewPakistan Microfinance Review 2017Financial services for all
have demonstrated their strong commitment to a high standard of client protection. The Smart Certification allows the investors, donors, and regulators distinguish financial institutions that put clients first. By undergoing the Smart Certification process, NRSP Microfinance Bank and FMFB join the ranks of FINCA Microfinance Bank Limited, Khushhali Microfinance Bank Limited (KBL) and Kashf Foundation that have demonstrated their commitment to client protection and obtained Smart Certification.
Micro-Enterprise LendingThere is a growing trend of encouraging development of micro-enterprises. Micro, Small and Medium Enterprises (MSMEs) typically account for significant share of employment in a developing country, as their growth is directly related to the capacity of job creation. Micro-enterprise lending can enable and empower micro-enterprises which may not otherwise receive funding via traditional credit sources but can manage and sustain their enterprises independently. It is necessary to distinguish between the demand-side and the supply-side of access to finance, as both need to be adequate to ensure a sustainable financing of the SME sector.
Currently, there are 8 MFBs catering to this market. With a cumulative portfolio of over PKR 12 billion, a total of 90,500 SME borrowers (2016: 50,600) were reported by the end of 201711, mostly represented by MFBs. This indicates a growth of 78% in the clientele of these MFBs. Although the number of borrowers of this segment account for about 1.5% of the total borrowers of the industry, the loan portfolio of the segment accounts for about 6% of the total Gross Loan Portfolio of the industry. The credit growth trends are strong, and the opportunities for further growth are still significant. This indicates a need for increased lending to this segment which would lead to improved growth within the sector and encourage NBMFIs to compete for the market segment.
There is no standard pattern of entering the SME market segment which may be an indication that the
market is still underdeveloped. To further promote the development of SMEs, there is a need for a variety of supportive policies by the government/regulators to set targets for enterprise lending which promote year on year growth. The targets could be based on the growth rate of enterprise loans which should rise at the same rate as other loan categories. Moreover, policies that lead to improved security and guarantee scheme of enterprises should be set up. The establishment of a credit risk compensation fund should also be investigated to reduce enterprise credit risk. Most importantly, an effective credit management system should be put in place in order to deal with the challenges of enterprise lending. To build the capacity of this segment PMIC is currently running a pilot for microenterprise lending with 5 NBMFIs under which cashflow based appraisal tool training was conducted for credit officers and branch managers. In the pilot phase 2000 loans would be provided for expansion of small enterprises.
Digital CreditDigital Finance, where services are offered through digital infrastructure such as mobile phones of the internet, as opposed to traditional banks, has changed the financial services landscape entirely. The use of mobile money has dramatically reduced the cost of transferring money while making it easier for the users of the service. Hence, by leveraging digital infrastructure, people are now able to make payments, save or avail credit facilities, all with the use of just their mobile phones.
The offering of small loans quickly and remotely using digital technology is the new trend in developing economies. This is because lending is considered the most encouraging methodology to include large populations financially. The major concern with lending money is the likelihood of repayment. With the financially excluded barely interacting with institutions, generating the sort of data required for traditional credit scoring was challenging. An alternative way was established to determine the behavior patterns of borrowers based on digital traces. The use of smartphones and social media has enabled users to induce large data streams through the usage of mobile money which is very limited, but also comprising of calling
11 MicroWatch, A quarterly outreach publication, PMN, Multiple Issues

Annual Assessment of the Microfinance Industry
Section 01
13
The Year in ReviewPakistan Microfinance Review 2017
Financial services for all
history, mobile top ups, utility bills payments and mobility. By using this behavioral data, effective predictive models or scoring tools are developed that reduce the risk associated with digital credit. Upon availing the initial loan, the borrowers start developing a credit history which complements the initial scoring model and incentivizes repayment. However, this mode of lending is not without risks and complexities. Issues like data privacy, accuracy of algorithms and access to technology can cut out the poor and women particularly.
Pakistan is considered to have an excellent enabling ecosystem for such services. With the launch of the National Financial Inclusion Strategy and the Pakistan Financial Inclusion and Infrastructure Project, the aim is to promote financial inclusion by increasing access to digital payments among businesses and households, as well as advancing access to credit for micro, small and medium-sized enterprises. With early developments going as far back as 2009 in the form of EasyPaisa, it has been witnessed that most of these digital offerings involve strategic partnerships between Mobile Network Operators (MNOs) and Microfinance Banks/Financial Institutions. However, in most recent times, it is evident that new alliances that include third-party FinTechs are also beginning to emerge. An example of a Fintech that has the potential to disrupt the dynamics of the industry is Tez Financial Services, a mobile application that provides instant access to financial services by linking a client’s mobile wallet with the app. Another example of an emerging player is CreditFix, also a mobile app that draws on alternative credit data to assess creditworthiness of unbanked consumers. By leveraging the unique competencies of each other, these strategic partnerships between FinTechs and financial institutions are mutually beneficial as they strive to scale up business and reach a wider customer base by offering scaled and innovative solutions that are analytics driven. Not only does this improve the efficiency of the product, but also leads to enhanced risk mitigation.
However, there is lack of knowledge regarding digital credit products and their ability to include the poor in the financial system. What is missing are the consumer protection measures that need to be adopted in policy and regulation as well as industry for this field. With this field growing at a rapid pace, there is very limited comprehensive, quantitative, evidence-based research which would allow for the impact of digital credit products to be assessed or deal with consumer protection systems.
Therefore, with the emergence of fresh players and developments happening at a fast pace, what is most important is that providers understand how clients (households and MSMEs) interact and avail these facilities. There is a lot to learn in this emerging field.
International LendingLike the previous year, 2017 also witnessed continued investor interest in the sector. Several international funds continued to explore the market for placement of funds particularly debt. Among the prominent players were Symbiotics, Blue Orchard, Microvest, Triodos and Triple Jump. These organizations have been attracted by the healthy returns of the MFPs and the regulatory environment.
Funds were placed largely with mid-sized entities which find it hard to borrow locally in the absence of tangible collateral and are ready to a pay a premium to obtain funding lines.

Annual Assessment of the Microfinance Industry
Section 01
14
The Year in ReviewPakistan Microfinance Review 2017Financial services for all
Overall 2017 was year of positives for the sector. The industry continued to experience double digit growth. The overall policy and regulatory environment, coupled with the industry infrastructure in place, proved to be a catalyst for continued growth in the industry. The sector is fast becoming a key player in the expansion of access to finance in the country based on its ability to deliver and work with the low-income strata of society. Client protection and awareness remains a key area of focus for all stakeholders. Due to this, a client grievance mechanism is being set up, a pricing transparency campaign being launched,
and financial literacy being promoted. In addition, the industry is successfully leveraging technology to automate loan origination and digital credit.
The favorable macro-economic environment and improving security situation in the country have also helped the sector to expand outreach the low interest regime has been helpful in keeping the funding costs low for the sector. However, it is unlikely that the low interest regime would continue over the next year. Finally, as 2018 is an election year, there are likely to be impacts on the industry.
Conclusion


Section 02FINANCIAL PERFORMANCE REVIEW

Annual Assessment of the Microfinance Industry
Section 02
17
Financial Performance ReviewPakistan Microfinance Review 2017
Financial services for all
Financial Performance Review
This section provides a detailed analysis of the financial performance of Pakistan’s microfinance industry in 2017. Performance has been assessed on three levels: industry wise, across peer groups and institution wise. The analysis is backed by 88 financial indicators, calculated from the audited financial statements of the reporting organizations. These indicators have been compared across time and regions to develop a reliable and fair assessment of sector. Detailed financial information
is provided in the Annex A-I and A-II of the Pakistan Microfinance Review (PMR). Aggregate data has been reproduced for five years, whereas, the peer group and institution specific data has been made available only for the year under consideration.
A total of 40 Microfinance Providers (MFPs) including 11 Microfinance Banks (MFBs) submitted their audited financial statements for PMR 2017. Industry players are categorized into three groups

Annual Assessment of the Microfinance Industry
Section 02
18
Financial Performance ReviewPakistan Microfinance Review 2017Financial services for all
for benchmarking and comparison purposes: Microfinance Banks (MFBs), Microfinance Institutions (MFIs) and Rural Support Programmes (RSPs). See Box 2.1 for detailed definitions.
The distribution of respondents (number of reporting organizations) by peer group is given in Exhibit 2.1. The MFI peer group comprises of the largest number of respondents followed by MFBs and then RSPs.
Box 2.1Peer Groups
Microfinance InstitutionA non-bank microfinance institution (NBMFI) providing microfinance services. With the introduction of non-bank microfinance regulatory framework by SECP in 2016, institutions carrying out microfinance services are required to be registered with SECP as NBMFIs. Presently, 20 MFIs have obtained NBMFI license.
Microfinance BankA commercial bank licensed and prudentially regulated by the SBP to exclusively service the microfinance market. The first MFB was established in 2000 under a presidential decree. Since then, 11 MFBs have been licensed under the Microfinance Institutions Ordinance, 2001. MFBs are legally empowered to accept and intermediate deposits from the public. Currently there are 11 MFBs operating in the country.
Rural Support ProgrammeA non-bank microfinance institution (NBMFI) providing microfinance services. An RSP is differentiated from the MFI peer group based on the purely rural focus of its credit operations. As of now, these organizations are in the process of registering with SECP under the new regulatory framework for NBMFI. At present, 5 organizations have obtained the license.
MFI 24
RSP 5
MFB 11
Exhibit 2.1: Distribution of Respondents by Peer Groups

Annual Assessment of the Microfinance Industry
Section 02
19
Financial Performance ReviewPakistan Microfinance Review 2017
Financial services for all
This section focuses on outreach indicators to provide performance analysis of the industry in terms of credit growth and composition, deposit mobilization, depth of outreach and gender.
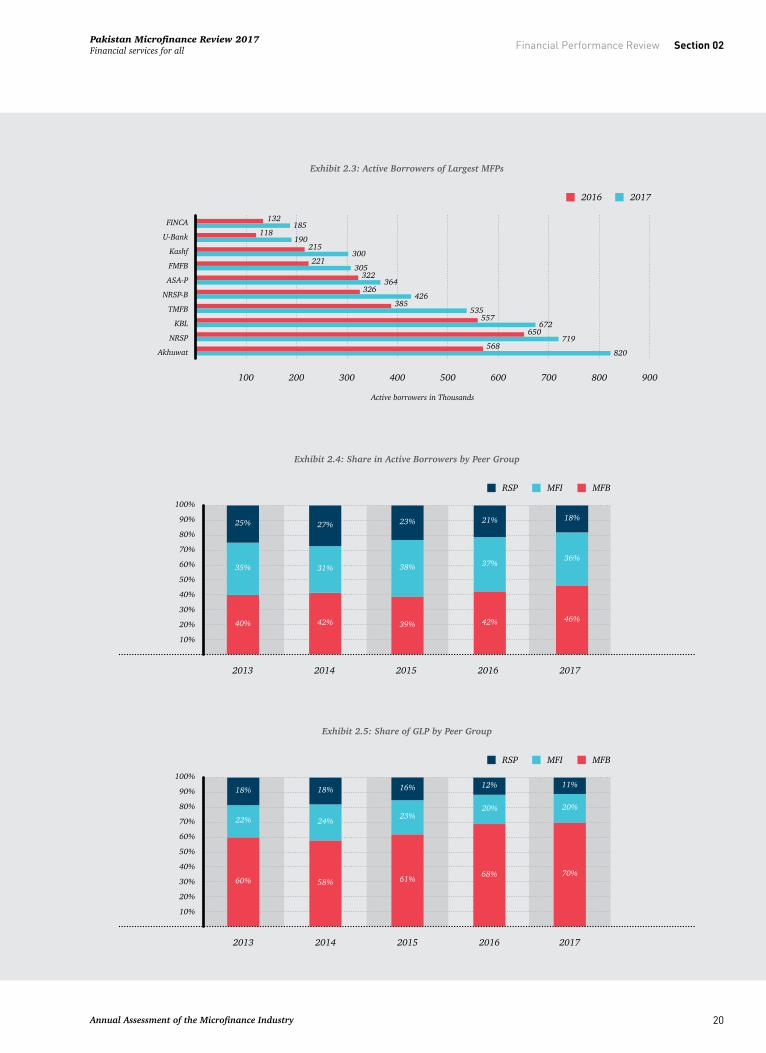
Scale & Outreach: Breadth2017 exhibited a positive surge in outreach as Active Borrowers witnessed a 31 percent growth from 4.2 million in 2016 to 5.5 million in 2017. Similarly, the Gross Loan Portfolio witnessed an impressive 49 percent growth from PKR 132 billion to PKR 196 billion. By their respective year ends, Akhuwat (820,000), NRSP (719,000) and KBL (672,000) maintained the top spots in terms of Active Borrowers with their combined outreach comprising of 40 percent of the total sector outreach. KBL (with PKR 32.5 Billion), TMFB (with PKR 25 Billion) and NRSP Bank (with PKR 21 Billion) held the spots for the top 3 MFPs in terms of GLP with their combined portfolio making up 40 percent of total industry portfolio.
The top ten MFPs in the industry make up 82 percent of the total outreach of the sector. Exhibit 2.3 depicts the respective standings of the MFPs in the industry.
During the reporting year, the market share in active borrowers of MFBs increased from 42 percent in 2016 to 46 percent by 2017. This was followed by MFIs and RSPs which held a share of 36 percent and 18 percent respectively with RSPs experiencing a gradual decline in their market share.
MFBs also maintain the largest share of Gross Loan Portfolio (GLP) of the industry, which grew from 68 percent in 2016 to 70 percent in 2017. The MFIs maintained their share of 20 percent as in 2016, while the RSPs experienced a slight decline from 12 percent in 2016 to 11 percent in 2017. This change is due to the increase in portfolios of MFBs – particularly KBL, TMFB and NRSP-B – and the rise in average loan size of MFBs to PKR 53,681 contributing to their higher market share.
The GLP of the industry in 2017 stood at PKR 196 Billion compared to PKR 132 Billion in the previous year (see Exhibit 2.6). The growth observed in GLP was approximately PKR 64 Billion, out of which PKR 47 Billion was due to the increase in the GLP of MFBs. The remaining portfolios of MFIs and RSPs grew by PKR 12 Billion and PKR 5 Billion, respectively.
84 percent of the total Gross Loan Portfolio is attributable to the top 10 Microfinance Providers in the industry led by KBL and TMFB (see Exhibit 2.7). During the year KBL’s portfolio increased by 39 percent and TMFB’s by 57 percent as each added
Scale & Outreach
Exhibit 2.2: Growth in Number of Active Borrowers and GLP
2013 2014 2015 2016 2017
Active BorrowersGLP
50
100
150
200
250
GLP
in P
KR B
illio
ns
1.00
2.00
3.00
4.00
5.00
6.00
Activ
e Bo
rrow
ers i
n M
illio
ns
Annual Assessment of the Microfinance Industry
Section 02
20
Financial Performance ReviewPakistan Microfinance Review 2017Financial services for all
Akhuwat
NRSP
KBL
TMFB
NRSP-B
ASA-P
FMFB
Kashf
U-Bank
FINCA
2016 2017
100 200 300 400 500 600 700 800 900
Active borrowers in Thousands
132
118
215
221
322
326
385
557
650
568
190
185
300
305
364
426
535
672
719
820
Exhibit 2.3: Active Borrowers of Largest MFPs
MFBMFIRSP
2013 2014 2015 2016 2017
10%
20%
30%
40%
50%
60%
70%
80%
90%
100%
40%
35%
25%
42%
31%
27%
39%
38%
23%
42%
37%
21%
46%
36%
18%
Exhibit 2.4: Share in Active Borrowers by Peer Group
MFBMFIRSP
2013 2014 2015 2016 2017
10%
20%
30%
40%
50%
60%
70%
80%
90%
100%
60%
22%
18%
58%
24%
18%
61%
23%
16%
68%
20%
12%
70%
20%
11%
Exhibit 2.5: Share of GLP by Peer Group

Annual Assessment of the Microfinance Industry
Section 02
21
Financial Performance ReviewPakistan Microfinance Review 2017
Financial services for all
approximately PKR 9 Billion to their portfolios and NRSP-B accumulated an additional PKR 7.6 Billion reflective of an impressive growth of 58 percent. Among the MFIs within the top 10, Akhuwat experienced a growth of 63 percent with an increase of PKR 5 Billion, Kashf grew by 58 percent with PKR 2.6 Billion and ASA-P grew by 30 percent with an increase of PKR 1.7 Billion. NRSP was the only RSP in the top ten with a portfolio of PKR 15.7 Billion with an increase of 32 percent.
During 2017, the total number of depositors experienced an impressive growth of 74 percent rising from approximately 16 Million to 27.7 Million (see Exhibit 2.8). Correspondingly, the total deposits jumped from PKR 118 Billion in 2016 to PKR 186 Billion in 2017, an increase of 57 percent. The largest contribution to the number of depositors was made by
Mobilink Microfinance Bank (MMFB) which added 6.9 Million depositors during the year and maintained its status as the industry leader in terms of depositors with a total depositor base of over 15 Million. MMFB was followed by Telenor Microfinance Bank (TMFB) with 8.1 Million depositors, and KBL with 1.7 Million depositors, which added 3.4 Million and 328,000 depositors respectively to their portfolios. The rise in the number of depositors can be ascribed to the substantial number of M-Wallet accounts mobilized by the telco-owned banks MMFB and TMFB. Moreover, the Government in collaboration with the State Bank of Pakistan launched a scheme for the promotion of home remittances through M-Wallets which further channeled home remittances through Branchless Banking (BB) channels. This not only facilitated the public in terms of convenience and cost-effectiveness, but also promoted the usage of
MFBMFIRSP
50
100
150
200
250
2013 2014 2015 2016 2017
PKR
in B
illio
ns
28.1 36.815.311.4
55.4
21.013.7
89.1
27.016.0
136.3
39.1
20.6
10.28.4
Exhibit 2.6: GLP by Peer Group
KBL
TMFB
NRSP Bank
NRSP
FINCA
FMFB
Akhuwat
U-Bank
MMFB
ASA-P
2016 2017
600 700 800 900
PKR in Billions
5.77.4
5.910.0
5.610.6
8.113.1
8.314.6
10.215.1
12.015.7
13.320.9
15.925.0
23.332.4
Exhibit 2.7: GLP by 10 Largest MFPs

Annual Assessment of the Microfinance Industry
Section 02
22
Financial Performance ReviewPakistan Microfinance Review 2017Financial services for all
M-Wallets and the creation of digital accounts.
The total deposits grew by 57 percent from PKR 118 Billion in 2016 to PKR 186 Billion in 2017. During the year, KBL led the way in terms of additions in the value of deposits by adding PKR 24.5 Billion to their portfolio (see Exhibit2.9). KBL was followed by TMFB, FMFB and FINCA MFB with additions of PKR 8.8, 8.6 and 8.1 Billion to their respective portfolios. The top 3 largest MFBs in terms of value of deposits for the year were KBL at PKR 45.7 Billion, TMFB at PKR 36.6 Billion and NRSP-B at PKR 23.6 Billion.
A slight change of 3 percent was observed in the Deposit-to-GLP ratio of MFBs from the last year (2017: 136 percent, 2016: 133 percent) as shown in Exhibit 2.10. A 57 percent increase in Deposits was largely offset by the 53 percent growth in the Gross Loan Portfolio of MFBs. This indicates the reliance
of these MFBs on deposits as the main source to drive cost of financing to lower levels and maintain adequate liquidity levels. The cost of funds of MFBs witnessed a marginal growth as it settled at 5.6 percent in the year under review as compared to 5.1 percent in 2016.
Micro-insurance indicators – Number of Policy Holders and Sum Insured – witnessed significant growth in 2017. The number of policy holders grew by 25 percent, rising from 5.8 Million in 2016 to 7.3 Million in 2017. Consequently, the sum insured witnessed an associated growth of 32 percent, from PKR 150.5 Billion in 2016 to PKR 198.6 Billion in 2017 (see Exhibit 2.11). MFIs contributed the most to the increase in micro-Insurance by adding 845,000 new policy holders. In terms of the number of policy holders, MFIs also held the largest market share of 47 percent (2016: 43 percent) followed by MFBs at 36
Exhibit 2.8: Growth in Deposits and Number of Depositors
2013 2014 2015 2016 2017
DepositorsDeposits Outstanding
50
100
150
200
Depo
sits o
utst
andi
ng in
Bill
ions
5,000
10,000
15,000
20,000
25,000
30,000
Depo
sitor
s in
Thou
sand
s
TMFB KBL
FMFB NRSP-B FINCA AMFB MMFB
U-Bank Advans POMFB
SMFB
2016 2017
5 10 15 20 25 30 35
PKR in Billions
0.00.00.1
0.00.00.3 8.1
12.010.3
14.910.4
12.511.1
19.216.9
23.712.2
20.921.2
27.8
Exhibit 2.9: Deposit Growth by MFB

Annual Assessment of the Microfinance Industry
Section 02
23
Financial Performance ReviewPakistan Microfinance Review 2017
Financial services for all
percent (2016: 37 percent) and RSPs with 17 percent (2016: 18 percent). Of the total sum insured, MFBs contributed the most with PKR 22.6 Billion. The largest market share of the total sum insured was also held by MFBs at 50 percent (2016: 50 percent), MFIs held 36 percent (2016: 34 percent) and RSPs held 14 percent (2016: 15 percent). The largest providers of micro-insurance in terms of policy holders were Kashf Foundation (2.09 Million), NRSP
(1.04 Million) and Akhuwat (878,000). Accordingly, the largest providers of micro-insurance in terms of sum insured were Kashf Foundation (PKR 52 Billion), KBL (PKR 36 Billion) and NRSP (PKR 26.7 Billion). The sector is predominantly divided between Credit Life (40 percent) and Health Insurance (58 percent).
Exhibit 2.10: Deposit-To-GLP Relation for MFBs
2013 2014 2015 2016 2017
20%
40%
60%
80%
100%
120%
140%
160%
Depo
sit-to
-GLP
Rat
io
20
40
60
80
100
120
140
160
180
200
In P
KR B
illio
ns
DepositsDeposit-to-GLP GLP
Exhibit 2.11: Growth in Number of Policy Holders & Sum Insured
2013 2014 2015 2016 2017
Policy HoldersSum Insured
50
100
150
200
250
PKR
in B
illio
ns1
2
3
4
5
6
7
8
Polic
y H
olde
rs in
Mill
ions

Annual Assessment of the Microfinance Industry
Section 02
24
Financial Performance ReviewPakistan Microfinance Review 2017Financial services for all
Scale & Outreach: DepthThe depth of outreach is associated with quality of outreach measuring the most underprivileged in a society that have been served. This indicator in microcredit operations is measured by a proxy indicator: average loan balance per borrower in proportion to per capita Gross National Income (GNI). A value below 20 percent is assumed to mean that the MFP is poverty focused. Based on the observations of the data accumulated from previous years (see Exhibit 2.12), it can be deduced that the ratio is exhibiting an ascending trend. Once
dissected based on peer group level, it is evident that this is due to the high value of the ratio for MFBs. In the year under review, the ratio for MFBs was 31 percent as compared to MFIs and RSPs 12 percent each which drove the industry ratio above the 20 percent cut-off point. MFBs tend to attract the high end of the market via larger loan sizes which causes the ratio to be higher. In terms of the clients this mean that MFBs target the ones at the higher end of lower income segment.
While the ratio for MFBs saw a decrease of 2 percent from last year, this was balanced out by a rise in the ratio of MFIs by 1 percent, whereas the ratio for RSPs remained relatively stable. While the sector continues to target the underprivileged, there are implications for appropriate loan sizes. The devaluation of the currency and the deflation in
the value of money indicates that the same amount of loan this year would be worth less the following year.
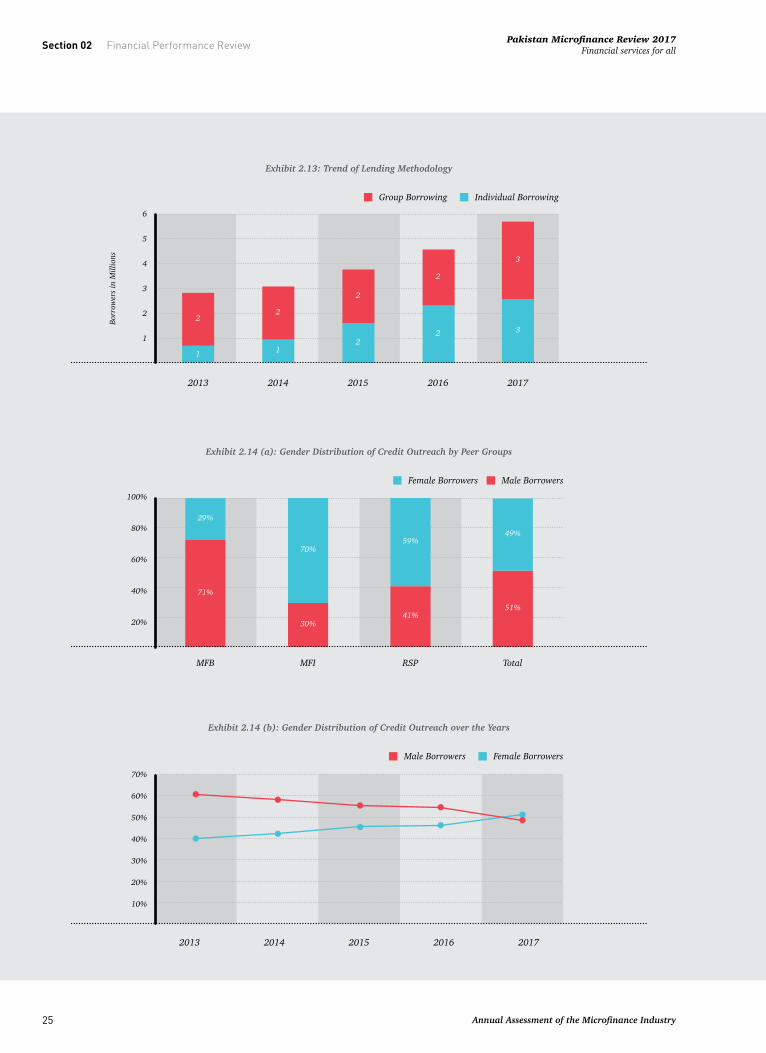
Lending MethodologyIn the sector, most MFPs have followed the group lending methodology except in 2016 when individual borrowing had prevailed (see Exhibit 2.13). However, it is evident that there is a rising trend in the individual borrowing methodology with a corresponding decrease in the group lending methodology. In 2017, while individual borrowing decreased by 7 percent down to 44 percent, the trend suggests that it will continue to increase in the years to come.
Gender DistributionMicrofinance programs continue to target women belonging to lower income strata in Pakistan with the expectation that, besides poverty reduction, having access to microcredit would lead to advances in female empowerment. However, over the years, it has become increasingly visible that the industry is gradually moving towards gender balance, with male borrowers increasing as compared to women borrowers (see Exhibit 2.14(b)). In the year under review, women borrowers stood at 49 percent (see Exhibit 2.14(a)) as compared to 54 percent in 2016. The MFBs increased their number of women borrowers by 4 percent from 2016 to reach 29 percent in 2017, whereas MFIs experienced a dip in outreach to women by 3 percent from 2016 to
Exhibit 2.12: Depth of Outreach by Peer Groups
IndustryCut-offRSPMFIMFB
2013 2014 2015 2016 2017
5%
10%
15%
20%
25%
30%
35%
Annual Assessment of the Microfinance Industry
Section 02
25
Financial Performance ReviewPakistan Microfinance Review 2017
Financial services for all
Exhibit 2.13: Trend of Lending Methodology
Individual BorrowingGroup Borrowing
2013 2014 2015 2016 2017
1
2
3
4
5
6
Borr
ower
s in
Mill
ions
1 1
2
2
2
2
2
3
3
2
Exhibit 2.14 (a): Gender Distribution of Credit Outreach by Peer Groups
Male BorrowersFemale Borrowers
MFB MFI RSP Total
20%
40%
60%
80%
100%
71%
29%
30%
70%
41%
59%
51%
49%
Exhibit 2.14 (b): Gender Distribution of Credit Outreach over the Years
Female BorrowersMale Borrowers
2013 2014 2015 2016 2017
10%
20%
30%
40%
50%
60%
70%
Annual Assessment of the Microfinance Industry
Section 02
26
Financial Performance ReviewPakistan Microfinance Review 2017Financial services for all
reach 70 percent this year. Significant change was observed in the RSP peer group which indicated that female borrowers reduced from 78 percent in 2016 to 59 percent in 2017, a decrease of 19 percent.
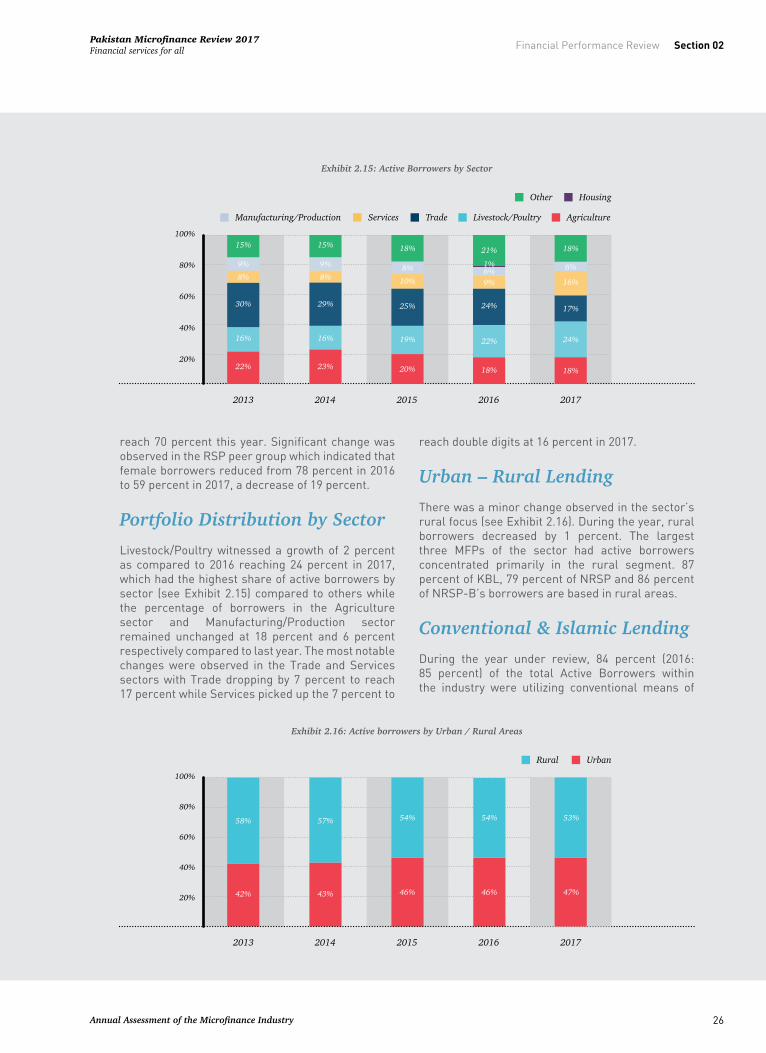
Portfolio Distribution by SectorLivestock/Poultry witnessed a growth of 2 percent as compared to 2016 reaching 24 percent in 2017, which had the highest share of active borrowers by sector (see Exhibit 2.15) compared to others while the percentage of borrowers in the Agriculture sector and Manufacturing/Production sector remained unchanged at 18 percent and 6 percent respectively compared to last year. The most notable changes were observed in the Trade and Services sectors with Trade dropping by 7 percent to reach 17 percent while Services picked up the 7 percent to
reach double digits at 16 percent in 2017.
Urban – Rural LendingThere was a minor change observed in the sector’s rural focus (see Exhibit 2.16). During the year, rural borrowers decreased by 1 percent. The largest three MFPs of the sector had active borrowers concentrated primarily in the rural segment. 87 percent of KBL, 79 percent of NRSP and 86 percent of NRSP-B’s borrowers are based in rural areas.
Conventional & Islamic LendingDuring the year under review, 84 percent (2016: 85 percent) of the total Active Borrowers within the industry were utilizing conventional means of
Exhibit 2.15: Active Borrowers by Sector
Other
Manufacturing/Production
Housing
TradeServices AgricultureLivestock/Poultry
2013 2014 2015 20172016
20%
40%
60%
80%
100%
22%
16%
30%
8%9%
15%
23%
16%
29%
8%9%
15%
20%
19%
25%
10%8%
18%
18%
22%
24%
9%6%1%
21%
18%
24%
17%
16%
6%
18%
Exhibit 2.16: Active borrowers by Urban / Rural Areas
UrbanRural
2013 2014 2015 20172016
20%
40%
60%
80%
100%
42%
58%
43%
57%
46%
54%
46%
54%
47%
53%

Annual Assessment of the Microfinance Industry
Section 02
27
Financial Performance ReviewPakistan Microfinance Review 2017
Financial services for all
lending as compared to the 16 percent (2016: 15 percent) attributable to Islamic Lending (see Exhibit 2.17 (a)). While there exists demand for Islamic microfinance products among the microfinance clientele, the players have yet to rollout the full spectrum of Shariah compliant products which will lead to increase in share of Islamic mode of lending as compared to conventional one. Of the total Islamic Lending portfolio, 98 percent of the market share is being controlled by the MFI peer group. 39 percent of the total MFI peer group portfolio was utilizing Islamic means of lending whereas, 61 percent of
all MFI lending was via conventional means (see Exhibit 2.17 (b)). The largest contributions in terms of Active Borrowers to Islamic Lending in 2017 were by Akhuwat and Kashf Foundation. MFBs held a negligible amount of market share of the total Islamic lending portfolio, with the only bank contributing to this lending methodology being NRSP – Bank.
Exhibit 2.17 (a): Total Active Borrowers by Conventional & Islamic Lending
Conventional 84%
Islamic 16%
Exhibit 2.17 (b): Active Borrowers by Conventional & Islamic Lending based on Peer Group
IslamicConventional
MFB MFI RSP
20%
40%
60%
80%
100%
99%
1%
61%
39%
100%

Annual Assessment of the Microfinance Industry
Section 02
28
Financial Performance ReviewPakistan Microfinance Review 2017Financial services for all
Unsecured – Secured LendingThe microfinance sector has primarily been dominated by unsecured financing. During 2017, unsecured financing made up about 82 percent (2016: 88 percent) of the total Active Borrowers of the sector as compared to 18 percent secured financing (2016: 12 percent) (see Exhibit 2.18 (a)). Of the total Active Borrowers as per unsecured financing, 49 percent was attributable to MFBs, 46 percent to MFIs and 5 percent to RSPs. Whereas, MFBs make up 25 percent of the total secured
financing in the sector, MFIs make up 9 percent and RSPs 66 percent. A more detailed break up by Peer group (see Exhibit 2.18 (b)) indicates that only 10 percent of MFBs total Active Borrowers were attributable to secured financing which were led by TMFB, KBL and NRSP – Bank. Comparatively, 4 percent of the total borrowers of MFIs were opting for secured financing whereas a considerable 74 percent of the total Active Borrowers of RSPs were utilizing secured financing. NRSP led its peer group with the most secured loans.
Exhibit 2.18 (a): Total Active Borrowers by Unsecured / Secured Financing
Unsecured 82%
Secured 18%
Exhibit 2.18 (b): Active Borrowers by Unsecured / Secured Financing by Peer Group
SecuredUnsecured
MFB MFI RSP
20%
40%
60%
80%
100%
90%
10%
96%
4%
74%
26%

Annual Assessment of the Microfinance Industry
Section 02
29
Financial Performance ReviewPakistan Microfinance Review 2017
Financial services for all
Asset BaseThe asset base for the sector by the end of 2017 was positioned at over PKR 330.4 Billion, an increase from PKR 225.3 Billion last year. This indicates a year on year growth of 47 percent. By the year end it was evident that MFBs accounted for 75 percent of the total asset base of the sector followed by MFIs at 16 percent and RSPs by 9 percent of the total assets.
Based on the observations in Exhibit 2.19, which depicts the yearly Total Asset Base by Peer Group, MFBs witnessed a significant growth of 47 percent in their total assets, rising to PKR 247 Billion in 2017 from PKR 168 Billion in 2016. Similarly, MFIs recorded the highest growth in the year with an increase of 50 percent in their total reported assets which rose from PKR 35.5 Billion in 2016 to PKR 53.2 Billion in 2017. The total assets of RSPs also grew from PKR 21.6 Billion to PKR 30 Billion by the end of 2017, indicating a growth of 39 percent.
The 10 Largest MFPs based on Total Assets made up 84 percent of the total Industry Assets. KBL is the largest MFP by asset size with a total asset base of PKR 58.9 Billion with TMFB and NRSP – Bank at second and third positions with PKR 47.1 Billion and
PKR 33.6 Billion respectively. MFIs and RSPs had one organization each, Akhuwat and NRSP, which continued to be the only 2 non-banks in the top 10 (see Exhibit 2.20). Among the largest MFIs by asset base, Akhuwat led the way with PKR 16.6 Billion, followed by Kashf Foundation and ASA Pakistan with PKR 10.9 Billion and PKR 9.9 Billion each. The leading RSP by asset base in 2017 was NRSP with PKR 19.3 Billion, while PRSP reported PKR 4 Billion.
Funding Profile Overall the industry capital structure has shifted towards deposits as the main source of funds as shown in Exhibit 2.21. The share of deposits grew from 56 percent in 2016 to 60 percent in 2017 whereas the share of debt declined from 26 percent to 24 percent in the same time. Here it must be kept in mind that only MFBs can mobilize deposits whereas MFIs and RSPs are reliant on debt as the main source of funds. In addition, the share of equity has also shown a decreasing trend over the last few years and now accounts for 16 percent of the capital structure. The decrease in share of equity, despite the increasing profitability of the players, is due to the double-digit growth witnessed over the last few years. To sustain this growth, players are likely
Financial Structure
Exhibit 2.19: Total Asset Base by Peer Group
2013 2014 2015 2016 2017
MFBMFIRSP
50
100
150
200
250
300
PKR
in B
illio
ns

Annual Assessment of the Microfinance Industry
Section 02
30
Financial Performance ReviewPakistan Microfinance Review 2017Financial services for all
to delay giving dividends or resorting to issuing subordinated debt in the near future. Already several bigger players like KBL, FINCA MFB and U Bank are touching their capital adequacy ratios.
Among the peer groups, debt remains the key source of funds for the RSPs and MFIs whereas in case of MFBs, deposit is the primary source of funds (see Exhibit 2.22). While MFBs are still borrowing from financial institutions and tapping capital markets for debt, they are reducing their reliance on debt as a source of fund. As far as equity is concerned both RSPs and MFIs are adequately capitalized, however, MFBs despite being profitable have seen the percentage of equity in their capital structure
decrease. Short term options include issuing Tier 2 capital whereas in the medium to long term MFBs have the option to “go public” to strengthen their capital base.
Asset composition remained varied across the three peer groups (see Exhibit 2.23). Advances accounted for more than 60 percent of the total asset base of the MFPs. However, proportion of cash continues to remain high among all the players mainly due to requirements of debt servicing. In addition, MFBs have a higher percentage of investments as compared to other peer groups arising as a result of liquidity management needs.
Exhibit 2.20: Asset Base of Larger MFPs
KBL
TMFB
NRSP-B
FMFB
FINCA
MMFB
NRSP
U-Bank
Akhuwat
AMFB
2016 2017
20 40 60 80
1414
1017
1118
1519
1421
1625
172626
34
34
3647
59
Exhibit 2.21: Industry Capital Structure
EquityDebtDeposits
2013 2014 2015 2016 2017
10%
20%
30%
40%
50%
60%
70%
80%
90%
100%
22%
35%
43%
23%
33%
44%
22%
33%
45%
17%
26%
56%
16%
24%
60%

Annual Assessment of the Microfinance Industry
Section 02
31
Financial Performance ReviewPakistan Microfinance Review 2017
Financial services for all
Exhibit 2.22: Capital Structure by Peer Group
10%
20%
30%
40%
50%
60%
70%
80%
90%
2017
MFBs
2016 2017 2016 20162017
MFIs RSPs
EquityDebtDeposits
Exhibit 2.23: Asset Composition by Peer Group
Fixed Assets
Fixed Assets
Cash and Bank Balance
Cash andBank Balance
Advances
Advances
Investments
Investments
2017
MFB MFI RSP
2016 2017 2017 20162016
20%
40%
60%
80%
100%
60%
17% 21% 24% 20% 19% 21%
03% 03% 04% 05% 02% 02%
20% 19% 08% 11% 11% 15%
60% 57% 63% 64% 69% 62%
20%
3%
17%
57%
19%
3%
21%
63%
8%4%
24%
64%
11%5%
20%
69%
11%2%
19%
62%
15%2%
21%
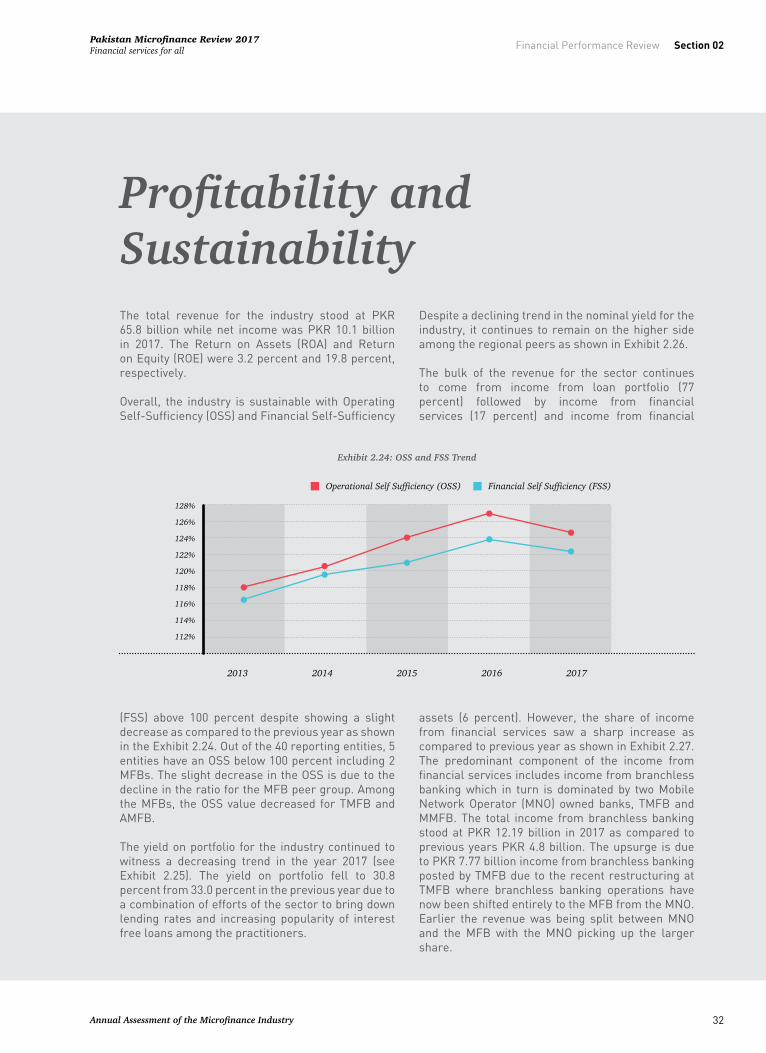
Annual Assessment of the Microfinance Industry
Section 02
32
Financial Performance ReviewPakistan Microfinance Review 2017Financial services for all
The total revenue for the industry stood at PKR 65.8 billion while net income was PKR 10.1 billion in 2017. The Return on Assets (ROA) and Return on Equity (ROE) were 3.2 percent and 19.8 percent, respectively.
Overall, the industry is sustainable with Operating Self-Sufficiency (OSS) and Financial Self-Sufficiency
(FSS) above 100 percent despite showing a slight decrease as compared to the previous year as shown in the Exhibit 2.24. Out of the 40 reporting entities, 5 entities have an OSS below 100 percent including 2 MFBs. The slight decrease in the OSS is due to the decline in the ratio for the MFB peer group. Among the MFBs, the OSS value decreased for TMFB and AMFB.
The yield on portfolio for the industry continued to witness a decreasing trend in the year 2017 (see Exhibit 2.25). The yield on portfolio fell to 30.8 percent from 33.0 percent in the previous year due to a combination of efforts of the sector to bring down lending rates and increasing popularity of interest free loans among the practitioners.
Despite a declining trend in the nominal yield for the industry, it continues to remain on the higher side among the regional peers as shown in Exhibit 2.26.
The bulk of the revenue for the sector continues to come from income from loan portfolio (77 percent) followed by income from financial services (17 percent) and income from financial
assets (6 percent). However, the share of income from financial services saw a sharp increase as compared to previous year as shown in Exhibit 2.27. The predominant component of the income from financial services includes income from branchless banking which in turn is dominated by two Mobile Network Operator (MNO) owned banks, TMFB and MMFB. The total income from branchless banking stood at PKR 12.19 billion in 2017 as compared to previous years PKR 4.8 billion. The upsurge is due to PKR 7.77 billion income from branchless banking posted by TMFB due to the recent restructuring at TMFB where branchless banking operations have now been shifted entirely to the MFB from the MNO. Earlier the revenue was being split between MNO and the MFB with the MNO picking up the larger share.
Profitability and Sustainability
Exhibit 2.24: OSS and FSS Trend
Financial Self Sufficiency (FSS)Operational Self Sufficiency (OSS)
2013 2014 2015 2016 2017
112%
114%
116%
118%
120%
122%
124%
126%
128%

Annual Assessment of the Microfinance Industry
Section 02
33
Financial Performance ReviewPakistan Microfinance Review 2017
Financial services for all
Exhibit 2.25: Yield on Portfolio Trend
Yield on Gross Portfolio (Real)Yield on Gross Portfolio (Nominal)
2013 2014 2015 2016 2017
5%
10%
15%
20%
25%
30%
35%
40%
Exhibit 2.26: Regional Comparison of Nominal Yield
Africa
East
Asia an
d
the Pa
cific
Easte
rn Eu
rope
and C
entra
l Asia
Latin
America
and
The C
aribb
ean
Middle
East
and
North A
frica
South
Asia
Pakis
tan
Yield on Gross Portfolio (Nominal)
5.00%
10.00%
15.00%
20.00%
25.00%
30.00%
35.00%
Exhibit 2.27: Revenue Streams
10
20
30
40
50
60
70
Loan PortfolioFinancial ServicesFinancial Assets
2013 2014 2015 2016 2017

Annual Assessment of the Microfinance Industry
Section 02
34
Financial Performance ReviewPakistan Microfinance Review 2017Financial services for all
Overall expense ratios remained stable in 2017 for the industry (see Exhibit 2.28). Though operating expense ratio remained showed a small gain going on to close at 12.6 percent as compared to 12 percent in 2016, the financial expense ratio and loan loss provision expense witnessed a slight decrease. As the industry grows and matures, we expect the expense ratio especially operating expense to improve further due to increasing competition, adoption of branchless banking and increasing loan sizes.
The Operating Efficiency Ratio saw an increase from 18.6 percent to 20.8 percent in 2017 (see Exhibit 2.29),
on the back of the increase in the administrative expense of the MFB peer group. Among the MFBs, the administrative expense of TMFB nearly tripled as compared to the previous year, largely due to the transition of Telenor MFB from Tameer MFB and absorption of “Easypaisa” branchless banking operations in the MFB.
The operating expense ratio for the Pakistani microfinance industry is on the higher side as compared to its regional peers and there remains sufficient room for improvement as show in the Exhibit 2.30.
Exhibit 2.28: Expense Ratio Trends
Adjusted Loan Loss Provision Expense/Total AssetsAdjusted Financial Expense/Total Assets
Adjusted Operating Expense/Total AssetsAdjusted Total Expense/Total Assets
2013 2014 2015 2016 2017
5%
10%
15%
20%
25%
Exhibit 2.29: Operating Expense to GLP Trend
Admin Expense/Gross Loan PortfolioPersonnel Expense/Gross Loan Portfolio
Operating Expense/Gross Loan Portfolio
2013 2014 2015 2016 2017
5%
10%
15%
20%
25%
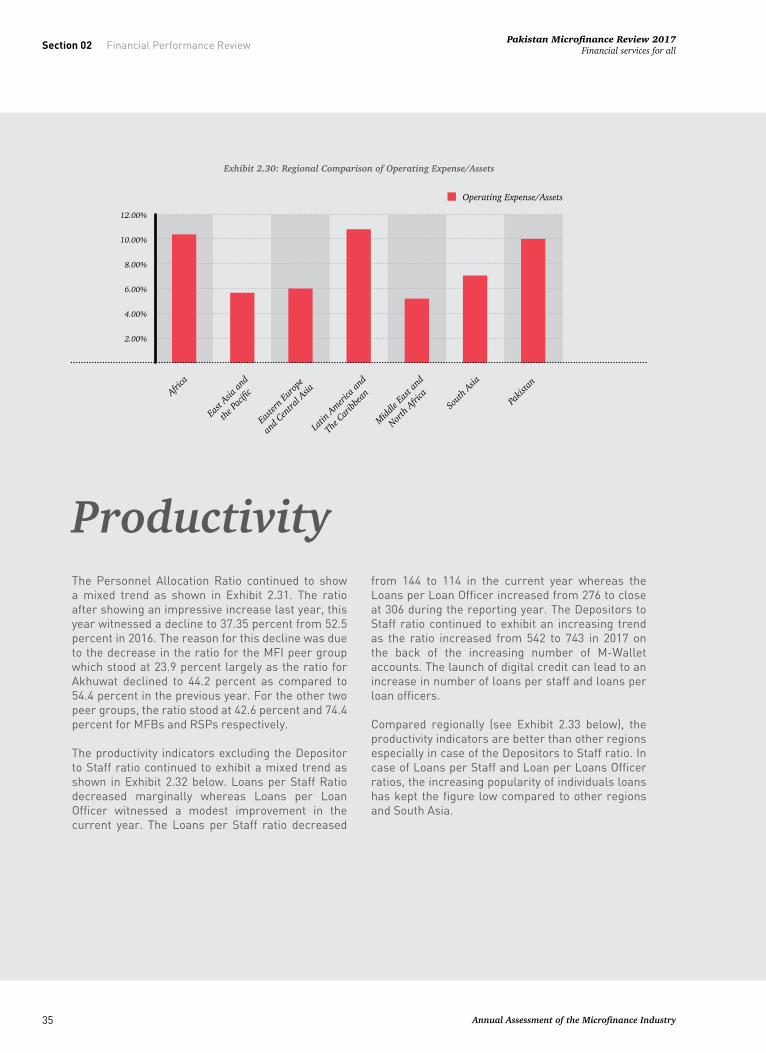
Annual Assessment of the Microfinance Industry
Section 02
35
Financial Performance ReviewPakistan Microfinance Review 2017
Financial services for all
Exhibit 2.30: Regional Comparison of Operating Expense/Assets
Africa
East
Asia an
d
the Pa
cific
Easte
rn Eu
rope
and C
entra
l Asia
Latin
America
and
The C
aribb
ean
Middle
East
and
North A
frica
South
Asia
Pakis
tan
Operating Expense/Assets
2.00%
4.00%
6.00%
8.00%
10.00%
12.00%
The Personnel Allocation Ratio continued to show a mixed trend as shown in Exhibit 2.31. The ratio after showing an impressive increase last year, this year witnessed a decline to 37.35 percent from 52.5 percent in 2016. The reason for this decline was due to the decrease in the ratio for the MFI peer group which stood at 23.9 percent largely as the ratio for Akhuwat declined to 44.2 percent as compared to 54.4 percent in the previous year. For the other two peer groups, the ratio stood at 42.6 percent and 74.4 percent for MFBs and RSPs respectively.
The productivity indicators excluding the Depositor to Staff ratio continued to exhibit a mixed trend as shown in Exhibit 2.32 below. Loans per Staff Ratio decreased marginally whereas Loans per Loan Officer witnessed a modest improvement in the current year. The Loans per Staff ratio decreased
from 144 to 114 in the current year whereas the Loans per Loan Officer increased from 276 to close at 306 during the reporting year. The Depositors to Staff ratio continued to exhibit an increasing trend as the ratio increased from 542 to 743 in 2017 on the back of the increasing number of M-Wallet accounts. The launch of digital credit can lead to an increase in number of loans per staff and loans per loan officers.
Compared regionally (see Exhibit 2.33 below), the productivity indicators are better than other regions especially in case of the Depositors to Staff ratio. In case of Loans per Staff and Loan per Loans Officer ratios, the increasing popularity of individuals loans has kept the figure low compared to other regions and South Asia.
Productivity

Annual Assessment of the Microfinance Industry
Section 02
36
Financial Performance ReviewPakistan Microfinance Review 2017Financial services for all
Exhibit 2.31: Personnel Allocation Ratio Trend
Personnel Allocation Ratio
10.0%
20.0%
30.0%
40.0%
50.0%
60.0%
2013 2014 2015 2016 2017
Exhibit 2.32: Productivity of MFPs
Loan per StaffDepositors per StaffLoans per Loan Officer
2013 2014 2015 2016 2017
100
200
300
400
500
600
700
800
Exhibit 2.33: Regional comparison of productivity
Loans per StaffLoans per Loan Officers Depositors per Staff
100
200
300
400
500
600
700
800
Africa
East
Asia an
d
the Pa
cific
Easte
rn Eu
rope
and C
entra
l Asia
Latin
America
and
The C
aribb
ean
Middle
East
and
North A
frica
South
Asia
Pakis
tan

Annual Assessment of the Microfinance Industry
Section 02
37
Financial Performance ReviewPakistan Microfinance Review 2017
Financial services for all
Exhibit 2.34: PAR > 30 Days and Write Off Trend
2013 2014 2015 2016 2017
Portfolio at Risk > 30 daysCut off Write Off
1.0%
2.0%
3.0%
4.0%
5.0%
6.0%
Credit Risk Overall, the PAR > 30 Days for the industry continued to show a decreasing trend over the last five years as shown in Exhibit 2.34. The PAR decreased from 1.20 percent in 2016 to 0.51 percent in 2017. However, the
write off showed a mixed trend over the same period with the ratio remaining stable over the last three years around 1 percent. Among the peer groups, PAR > 30 days for MFB peer group stood near the industry average at 0.5 percent while for MFIs it was below the industry average at 0.3 percent. However, for RSPs the industry average stood at 0.9 percent mainly due to a higher PAR for NRSP (1.2 percent).
Risk

Annual Assessment of the Microfinance Industry
Section 02
38
Financial Performance ReviewPakistan Microfinance Review 2017Financial services for all
The Year 2017 saw the microfinance industry in the country continue to grow and expand. Growth was witnessed across credit, savings and insurance. The industry continued to maintain its focus on provision of financial services to under-served segments of the population including women and people residing in rural areas. Crop and livestock with trade and services remain the main sectors being targeted by the MFPs.
The total asset base for the industry stood at PKR 330 billion with MFBs making up 75 percent of the assets. While MFIs and RSPs continue to rely on debt to meet their funding needs, deposits remain
the primary source of funds for the MFBs. Overall the industry continues to be sustainable with OSS over 100 percent. The total income for the sector crossed the PKR 10 billion threshold this year. Operating ratios continued to remain stable over the last few years, although yield on portfolio continued to exhibit a declining trend. Productivity ratios exhibited a mixed trend over the year. The PAR > 30 days remained below 1 percent which reflects positively on the portfolio quality of the sector.
Overall, the industry closed another successful year of operations.
Conclusion


Section 03SOCIAL PERFORMANCE REVIEW

Annual Assessment of the Microfinance Industry
Section 03
41
Social Performance ReviewPakistan Microfinance Review 2017
Financial services for all
Social Performance Review
The microfinance sector in Pakistan is making significant contribution towards economic growth in Pakistan. The number of microfinance borrowers has grown by 39% while the gross loan portfolio has grown by 86% compared to 2016. This sector is committed to increasing the financial inclusion in Pakistan and is taking big strides forward. With the growing number of borrowers, there is also a growing focus on aligning the social goals of microfinance practitioners with the financial goals
so that the impact of microfinance at the borrower level can be maximized.
Microfinance Providers (MFPs) in Pakistan are engaged in a range of development goals which include increased contribution towards achieving access to financial services, development of start-up and existing enterprises, poverty alleviation, employment generation, promoting gender equality and empowerment. These development goals are

Annual Assessment of the Microfinance Industry
Section 03
42
Social Performance ReviewPakistan Microfinance Review 2017Financial services for all
the anchors of the microfinance sector and are being regularly tracked by the MFPs to determine their alignment and level of commitment to the development goals.
The following section will analyze the performance of
the MFPs vis-à-vis the social performance indicators which encompass social goals, governance and HR practices, products and services offered to clients, client protection and environmental safeguard.
The annual social performance reporting framework developed by the Microfinance Information eXchange (MIX) in collaboration with the Social Performance Task Force (SPTF), categorizes the social performance into five main categories i.e. social goals, governance and HR practices, products and services offered to clients, client protection and environment safeguard. The data is self-reported by the MFPs and allows them to easily and efficiently report data to investors, benchmark performance,
and improve business planning.
At the time of this publication, 36 PMN members have reported their organizational data using the new MIX social performance framework. The PMN members that have reported the data include 10 Microfinance Banks (MFBs), 21 Microfinance Institutes (MFIs) and 5 Rural Support Programmes (RSPs).
Target MarketAmongst the social performance indicators, the target market defines the type of clientele being served by the MFPs. The target market in the social performance reporting framework is comprised of four main categories i.e. clients living in rural areas, clients living in urban areas, women, and adolescent and youth.
As of 2017, all 10 reporting MFBs cited serving different segments of the target market as shown in Exhibit 3.1. 8 MFBs reported serving the clients living in rural areas, 9 MFBs reported serving clients living in urban areas and 9 MFBs reported serving women clients whereas, none of the MFBs are serving the adolescent and youth market. Amongst the MFI peer group, 20 MFIs reported serving the clients in rural areas and urban areas respectively. A total of 19 MFIs reported serving women clients and only 1 MFI is serving the adolescent and youth market.
Analysis of the sector’s social performance indicators
Social Goals

Annual Assessment of the Microfinance Industry
Section 03
43
Social Performance ReviewPakistan Microfinance Review 2017
Financial services for all
Amongst the 5 RSPs that have reported on their target market data, all of them served the clients living in the rural area. 4 RSPs reported serving the clients in the urban area and 4 reported serving women clients. As of 2017, the adolescent and youth market were not being served by the RSPs.
Development Goals As of 2017, all of the 10 reporting MFBs were found to be contributing towards various development goals. Exhibit 3.2 shows the detailed comparison of contribution to development goals by all three peer groups i.e. MFBs, MFIs and RSPs. The top development goal emerging from 2017 within the MFB peer group is increased access to financial
Exhibit 3.1: Target Markets by Peer Group
MFBsMFIsRSPs
Women Clients living inrural areas
Clients living inurban areas
Adolescents andyouth
10
20
30
40
9
19
4
8
20
5
91
20
4
Exhibit 3.2: Development Goals
Increa
sed ac
cess
to fin
ancia
l servi
ces
Pover
ty red
uction
Emplo
ymen
t gen
eratio
n
Develop
ment o
f
start-
up en
terpri
ses
Growth
of exi
sting
busin
esses
Youth
oppo
rtunit
ies
Health
impro
vemen
t
Gender
equa
lity an
d
women
's empo
wermen
t
Water a
nd sa
nitati
on
Housin
g
Childre
n's sc
hooli
ng
Impro
vemen
t of a
dult e
ducat
ion
MFBsMFIsRSPs
5
10
15
20
25
30
35
40
10 9
20
5
7
17
3
5 91
82
4
1 12
17
4
2
2
20
3
41
18
4
3
2
31

Annual Assessment of the Microfinance Industry
Section 03
44
Social Performance ReviewPakistan Microfinance Review 2017Financial services for all
services. 10 MFBs reported working towards provision of increased access to financial services while 9 reported working towards poverty reduction. Another 8 MFBs reported contributing towards the goal of gender equality and women empowerment. 7 MFBs reported working on generating employment. 2 MFBs reported investing in new start-ups to boost development as opposed to 9 MFBs that were promoting the growth of existing businesses. Some new development goals have also emerged in 2017 within the MFB peer group which includes improvement in health, children’s schooling and housing.
Out of the 21 reporting MFIs, 17 reported working towards increased access to financial services. The top goal emerging from 2017 within the MFI peer group is poverty alleviation as a total of 20 MFIs reported working towards this goal in their organizational capacity in 2017. Another 20 MFIs reported promoting growth of existing enterprises. 18 MFIs reported contributing towards the goal of gender equality and women empowerment, 17 MFIs reported contributing towards employment generation and 5 MFIs reported promoting the development of new start-ups. Other goals being promoted by the MFIs include providing youth opportunities, housing and improving health.
Amongst the RSP peer group, all 5 RSPs reported working towards poverty alleviation. 4 RSPs reported on providing increased access to financial services. RSPs also contributed towards other development goals which include employment generation, growth of start-ups and existing enterprises along with gender equality and women empowerment. As of 2017, RSPs were also involved in improvement of
adult education, children schooling, housing and water and sanitation.
Poverty Targeting All the reporting institutions are targeting more than one segment of the poor. MFBs are focused on catering the low-income clients and poor clients with an exception of 1 MFB serving very poor clients. Both MFIs and RSPs are also focused on serving the needs of the low-income clients and poor clients. However, serving the very poor clients is more common amongst the MFIs and RSPs as compared to the MFBs.
Poverty Measurement Poverty measurement tools measure the intensity of poverty within a defined area. Three ingredients are required in computing a poverty measure. First, one must choose the relevant dimension and indicator of well-being. Second, is the selection of a poverty line, that is, a threshold below which a given household or individual will be classified as poor. Finally, one must select a poverty measure to be used for reporting for the population or for a population subgroup only. To measure the impact of poverty, various tools are employed by MFPs. To this effect, 8 out of 10 MFBs reported using poverty measurement
Exhibit 3.3: Poverty Targets
MFBsMFIsRSPs
Very poor clients Poor clients Low income clients
5
10
15
20
25
30
35
40
6 7
16
5
10
19
5
1
3

Annual Assessment of the Microfinance Industry
Section 03
45
Social Performance ReviewPakistan Microfinance Review 2017
Financial services for all
tools whereas, all 21 MFIs that have reported on this indicator have stated measuring poverty levels to evaluate the impact of their intervention in their targeted segments and 4 out 5 RSPs also reported using poverty measurement tools. Most of the MFPs are either using their own proxy poverty index, or ‘per capita household income’ to measure poverty while ‘per capita household expenditure and ‘Grameen Progress out of Poverty Index (PPI)’ were the next most frequently used poverty assessment tools. A total of 8 MFPs reported to not having used any poverty assessment tools.
Governance and HR It is imperative for microfinance practitioners to develop such Governance and HR practices that complement their overall social mission. The Universal Standards for Social Performance Management (USSPM) also outlines the standards for Governance and HR practices and how the microfinance practitioner should design policies for achievement of the social goals.
Organizations that are committed to achieving their social goals take measures in their governance structure that include conducting orientation of the
Exhibit 3.4: Poverty Assessment Tools used by MFPs
Grameen
Prog
ress o
ut
of Po
verty
Index
(PPI)
Per c
apita
house
hold
expen
ditur
e
Per c
apita
house
hold
incom
e
Parti
cipato
ry wea
lth ra
nking
Hou
sing i
ndex
Food
secur
ity in
dex
Own p
roxy p
overt
y ind
ex
USAID
Pover
ty Asse
ssmen
t
Tool
(PAT)
Non
e of th
e abo
ve
MFBsMFIsRSPs
2
4
6
8
10
12
14
16
4
12
5
1
4
9
1
1 1 1
5
8
1
2 2
4
2
Exhibit 3.5: Social Performance Management of all MFPs at the Board
Board experiencein SPM
SPM champion/committee at Board
Board orientationof social mission
5 10 15 20 25 30 35
31
19
33

Annual Assessment of the Microfinance Industry
Section 03
46
Social Performance ReviewPakistan Microfinance Review 2017Financial services for all
board members with respect to the organization’s social mission, nominating a Social Performance Management (SPM) champion or a committee at board level and ensuring that the board members are experienced in the domain of SPM. To this end, the majority of the reporting institutions have reported to conducting board orientation on their respective social missions. All 10 reporting MFBs have reported that their board members are oriented on the organization’s social mission while 19 out of 21 MFIs reported that an orientation session is carried out for their board members. 4 out of 5 RSPs also reported conducting orientation session of their board members.
Similarly, 4 out of 10 MFBs reported that they have an SPM champion or a committee at board level whereas 12 out of 21 MFIs and 3 out of 5 RSPs have a SPM champion or a committee at board level. As far as the experience of the board in SPM is concerned, 8 out 10 MFBs, 18 out of 21 MFIs and all 5 RSPs reported compliance to the indicator.
With respect to the HR practices for achieving social goals, the assessment of social indicators required determining if the staff incentives were related to Social Performance (SP), how number of clients was incentivized, and whether the HR policies were related to Social Performance.
Amongst the MFB peer group, 7 out 10 MFBs reported that their staff incentive was linked to the number of clients and 8 MFBs reported that their incentive structure was linked to portfolio quality. Only 2 MFBs reported that the quality of interaction of their staff with the clients was also linked to the staff incentive.
Amongst the MFI peer group, 12 out of 21 MFIs reported that their incentive structure was linked to the number of clients while 16 MFIs reported that the incentive structure was linked to the portfolio quality. Few MFIs have also linked their incentive structure to the quality of interaction of their staff with the clients (5 out of 21 MFIs) and the quality of the social data collected (3 out of 21 MFIs).
Amongst the RSP peer group, all of them reported that their incentive structure was linked to the portfolio quality while 3 RSPs have also deployed the indicator of number of clients to incentivize their staff.
As Exhibit 3.6 shows, the most common factor for determining the staff incentives throughout the microfinance sector in Pakistan is portfolio quality i.e. collection of loan payments on time. The second most common factor cited by all MFPs for determining staff incentive was number of clients in the field office loan portfolio. Of those MFPs that incentivize their staff based on number of clients, Exhibit 3.7 shows that such MFPs factor both indicators i.e. new clients as well as client retention.
Moreover, on HR policies related to Social Performance, it was found that 33 out of 36 MFPs have policies in place for Social Protection (medical insurance and/or pension contribution), anti-harassment, and grievance resolution policy while 28 reported to have a non-discrimination policy and only 20 had a safety policy. Exhibit 3.8 indicates the compliance of the MFPs to the HR policy related indicators.
Exhibit 3.6: Staff Incentives of all MFPs related to SPM
Number of clients Quality of interaction with clients based on
client feedback mechanism
Quality of socialdata collected
Portfolio quality
5
10
15
20
25
30
35
22
84
29

Annual Assessment of the Microfinance Industry
Section 03
47
Social Performance ReviewPakistan Microfinance Review 2017
Financial services for all
Products and Services: FinancialMFPs in Pakistan offer a range of products and services to their client base which includes credit products, savings products, insurance products and various other financial services. This section describes the further sub-division of these products to examine the level to which the financial products and services are adapted to serve the client needs.
Credit MFPs offer credit products to their clients for income generation purposes as well as non-income generation purposes (consumption based). As Exhibit 3.9 shows, all MFPs offer income-generating loans, while 10 MFPs offer some sort of consumption loans in addition to the income-generating loan.
The income generating loans extended by MFPs include microenterprise loans, MSME loans, agriculture/livestock loans and express loans. Within the non-income generating loans offered by MFPs, the main categories include education loans, emergency loans, housing loans and loans for other household consumption.
Exhibit 3.7: Method for Incentivizing Number of Clients by all MFPs
Incentive on ‘totalnumber of clients’
Incentive on ‘numberof new clients’
Incentive on ‘clientretention’
2
4
6
8
10
12
14
16
18
20
19
1512
Exhibit 3.8: HR Policies of all MFPs related to Social Performance
Social protection (medical
insurance and/or pension
contribution)
Safety policy Anti-harassment policy
Non-discrimination policy
Grievance resolution
policy
5
10
15
20
25
30
35
33
20
3328
33

Annual Assessment of the Microfinance Industry
Section 03
48
Social Performance ReviewPakistan Microfinance Review 2017Financial services for all
All reporting MFPs offer microenterprise loans whereas the majority of them also extend credit for agriculture/livestock loans. Exhibit 3.10 shows the comparison of MFBs, MFIs and RSPs with respect to the category of income generating loans offered to their clientele.
DepositsGiven the regulatory structure in Pakistan for savings products/deposits, only MFBs can intermediate deposits and hence offer voluntary deposit accounts (both demand deposit accounts and time deposit accounts). Exhibit 3.11 shows that 9 MFBs out of the 10 reporting MFBs offer deposits.
InsuranceInsurance products are gaining traction within the microfinance sector and are increasingly being offered by MFPs. Various micro-insurance products are being developed and offered to serve the base of the pyramid. In Pakistan, the insurance penetration is less than 1 % which is very low as compared to other countries in the region like India and Bangladesh. Yet there is a remarkable opportunity for the whole sector as there is a huge untapped market.
The majority of MFBs offer compulsory insurance, while a few also offer voluntary insurance products. Compulsory insurance products are bundled with the credit facility extended to the clients whereas voluntary insurance products allow any customer to
Exhibit 3.9: Type of Credit Products offered by MFPs
Income generatingloans
Non-income generatingloans
10
20
30
40
36
10
Exhibit 3.10: Credit Offerings by Peer Group
MFBsMFIsRSPs
Microenterpriseloans
SME loans Agriculture/livestockloans
Express loans
5
10
15
20
25
30
35
40
10 9
2
1
9
20
4
2
21
5

Annual Assessment of the Microfinance Industry
Section 03
49
Social Performance ReviewPakistan Microfinance Review 2017
Financial services for all
purchase an insurance product best suited to their needs. As Exhibit 3.12 shows that the most common compulsory insurance product offered by MFBs to its clients is credit life insurance. Other compulsory insurance products include life/accident insurance and agriculture insurance.
Insurance products offered by MFIs include both compulsory and voluntary insurance products, however, the majority of FIs offer compulsory insurance products. The most common category within the compulsory insurance products remains credit life insurance.
Exhibit 3.13 shows that voluntary insurance products include credit life insurance, life/accident insurance, agriculture insurance and health insurance. Amongst all peer groups, agriculture insurance is offered on a voluntary basis by MFIs only.
Other Financial ServicesOther financial services offered by MFPs include provision of debit/credit card, mobile/branchless banking services, savings facilitations services, remittance/money transfer services, payment services, micro-leasing and scholarship/educational grants. Exhibit 3.14 shows that amongst the MFPs, the main provider of these financial services is the MFB peer group with the most common financial services of debit/credit card, branchless banking and money transfer service being extended to the clients.
A few MFIs have also started offering other financial services to some degree which include services such as loan repayment through branchless banking, payment services, micro-leasing and scholarship/educational grants. Provision of micro-leasing and
Exhibit 3.11: Savings product offerings by MFBs
Demand depositaccounts
Time depositaccounts
None of theabove
2
4
6
8
10
89
1
Exhibit 3.12: Types of Compulsory Insurance by Peer Group
MFBsMFIsRSPs
Credit life insurance Life/accident insurance Agriculture insurance
5
10
15
20
25
75
6
62
2
13
3

Annual Assessment of the Microfinance Industry
Section 03
50
Social Performance ReviewPakistan Microfinance Review 2017Financial services for all
scholarship/education grants to the clients is unique to the MFI peer group.
Products and Services: Non-financial
MFPs offer non-financial services in addition to financial products and services. These non-financial services are offered by MFPs to build the capacity of their clients to fight poverty and strengthen their livelihoods. The range of the services offered vary based on the vision and mission of the MFP and is delivered to the clients in partnership with specialized public or private agencies. These services fall into four main categories specifically enterprise services, women empowerment services, education services and health care services.
Exhibit 3.13: Types of Voluntary Insurance by Peer Group
MFBsMFIsRSPs
Credit Lifeinsurance
Life/accidentinsurance
Agricultureinsurance
Healthinsurance
2
4
6
8
10
12
1
5
1
2
2
35
4
1
Exhibit 3.14: Provision of Other Financial Services
Debi
t/cred
it card
Mob
ile/b
ranchl
ess
bank
ing se
rvices
Savin
gs fac
ilitati
on se
rvices
Remitt
ance/
money
transf
er ser
vices
Paym
ent s
ervice
s
Scho
larshi
p/edu
cation
al
grants
Micr
oleasi
ng
MFBsMFIsRSPs
2
4
6
8
10
12
14
16
6 6
7
1
3
1 6
1
5
1
2 1
1

Annual Assessment of the Microfinance Industry
Section 03
51
Social Performance ReviewPakistan Microfinance Review 2017
Financial services for all
The MFB peer group has primarily concentrated its efforts in provision of education services with a focus on financial literacy education as can be seen in Exhibit 3.15. Capacity building of clients in other domains of non-financial services is not a focus of the MFB peer group as of 2017.
MFIs and RSPs are providing non-financial services. The majority of MFIs reported that they offer enterprise, women empowerment and education services. The most common services within the broad categorization of enterprise services offered by MFIs are provision of enterprise skills development and business development services whereas within the category of women empowerment services the MFIs reported that they provide training to women on leadership as well their rights. The most common education service provided by MFIs includes financial literacy education, however, 7 MFIs reported that they provide basic health/nutrition education and 6 MFIs reported providing child and youth education to their clients. RSPs are actively providing enterprise, women empowerment and education services. 2 RSPs also reported that they provide health services to their clients.
Transparency of Cost Ensuring transparency in cost is a prime responsibility of the service provider. The microfinance sector at large is making efforts to disclose this information
to the borrowers in a standardized way which allows comparison and simplifies the process of decision making. As of 2017, 18 MFPs reported using the declining balance method for calculating interest rates while 20 reported using the flat methodology for interest rate calculation.
All MFBs in Pakistan are required by the State Bank of Pakistan (SBP) to disclose the interest cost to the borrower. The assessment revealed that 5 MFBs offer products whose interest rate calculation is based on the declining balance methodology, 3 MFBs offer products whose interest rate calculation is based on the flat balance interest rate methodology while 2 MFBs offer different products with interest cost being calculated through flat and declining balance method.
Exhibit 3.16 shows that 14 MFIs reported that their interest rate calculations are based on declining balance while 7 MFIs reported that interest rate charged to the customer is determined by using flat balance methodology. Also, 3 RSPs reported using the declining balance method while 2 reported using the flat balance method for calculation of interest rates.
Client ProtectionThe SMART Campaign which is an international consortium of microfinance stakeholders, has laid out seven principles for client protections. These seven principles include:
Exhibit 3.15: Non-Financial Services
MFBsMFIsRSPs
Enterprise services Womenempowerment
Education services Health services
5
10
15
20
25
30
14 14
8 5
2
14
4
1
44

Annual Assessment of the Microfinance Industry
Section 03
52
Social Performance ReviewPakistan Microfinance Review 2017Financial services for all
• Appropriate product design and delivery• Prevention of over-indebtedness• Transparency• Responsible pricing• Fair and respectful treatment of clients • Privacy of client data• Mechanisms for complaint resolution
These principles help protect clients and help institutions practice good ethics. For analysis of the sector with respect to client protection, the parameters included presence of policies supporting good repayment capacity analysis, internal audit
compliance, full pricing terms disclosure, APR disclosure, CP code of conduct violations, clear reporting systems and data privacy clauses. Exhibit 3.17 shows the level of compliance to the key parameters of client protection by each peer group.
Exhibit 3.16: Method to State Service Cost by Peer Group
MFBsMFIsRSPs
Declining balance Flat interest
5
10
15
20
25
8
7
3
4
14
2
Exhibit 3.17: Client Protection Indicators - All MFPs
Polic
ies su
pport
good
repay
ment c
apaci
ty an
alysis
Intern
al au
dit ve
rify c
ompli
ance
with po
licies
Prices
, insta
llmen
ts, te
rms a
nd
condit
ions fu
lly di
sclose
d to c
lients
Annua
l perc
entag
e rate
s (APR
)
of loa
n prod
ucts d
isclos
ed
Code o
f con
duct
clearl
y defi
ned
Violat
ions o
f cod
e of
condu
ct san
ction
ed
Clear r
eporti
ng sy
stem in
place
for
compla
ints fr
om cli
ents
at bra
nche
s
Contra
cts in
clude
a
data
priva
cy cla
use
5
10
15
20
25
30
35
40
34 34 3529
34 34 34 34

Annual Assessment of the Microfinance Industry
Section 03
53
Social Performance ReviewPakistan Microfinance Review 2017
Financial services for all
Environmental PoliciesIn recent years, the objective of achieving a triple bottom-line by incorporating environmental and social performance management in addition to the financial goals has gained traction. To gauge the commitment of the MFPs in the environmental domain, the assessment looked at various indicators which include awareness raising on environmental impacts, clauses in loan contracts requiring clients to improve environmental practices, tools to evaluate environmental risk, specific loans linked to environmentally friendly products and products related to renewable energy, energy efficiency and environmentally friendly practices. These indicators can be broadly classified into two main categories i.e. presence of environmental policies and types of environmentally friendly products and/or practices offered.
The MFI peer group out-performed both MFBs and RSPs in promoting environmental protection due to efforts carried out by the Pakistan Poverty Alleviation Fund (PPAF), to ensure compliance of all its partner organizations to the Environmental and Social Management (ESM) Framework. Exhibit 3.18 shows that a majority of the MFIs have policies in place to promote environmental protection. The most common area within the domain of environment
being addressed by MFIs is ‘awareness raising on environmental impacts’ as a total of 16 MFIs out of 21 MFIs are working on this.
At the sector level, as evident from Exhibit 3.18, there is a need to put more efforts on developing tools to evaluate environmental risks of clients as well as provision of specific loans linked to environmentally friendly products and/or practices.
Exhibit 3.19 depicts that within the category of providing environmentally friendly loans, the most common loan product being offered relates to renewable energy. Similarly, loan products for adapting environmentally friendly practices are also being offered to clients.
Exhibit 3.18: Environmental Policies in Place
MFBsMFIsRSPs
Awareness raising onenvironmental impacts
Clauses in loan contracts requiring clients to imrove environmental
practices/mitigate environmental risks
Tools to evaluate environmental risks of clients' activities
Specific loans linked to environmentally friendly products and/or practices
5
10
15
20
25
2
16
4
3
14
2
4
9
2
2
11
1

Annual Assessment of the Microfinance Industry
Section 03
54
Social Performance ReviewPakistan Microfinance Review 2017Financial services for all
Exhibit 3.19: Environmentally Friendly Products/Services Offered
MFBsMFIsRSPs
Products related to renewable energy (e.g.
solar panels, biogas digesters etc)
Products related to energy efficiency (e.g. insulation, improved
cooking stove, etc)
Products related to environmentally friendly
practices (e.g. organic farming, recycling,
waste management, etc)
5
10
15
20
4 31
7
211
2
The analysis of the microfinance providers with respect to their social performance indicators shows that the industry is collectively making efforts to address the needs of various segments of the society. However, a few segments still need greater focus especially the adolescent and youth segment in Pakistan which is largely underserved.
With respect to the availability of insurance products in Pakistan, the microfinance sector can be instrumental in solving pressing issues such as healthcare, by developing innovative insurance products that target the base of pyramid. Similarly,
the industry also needs to focus on provision of financial products to promote businesses that are providing environmentally friendly and energy efficient products and services.
The microfinance sector has successfully put in the governance structure needed to complement their social goals by ensuring board experience in social performance management and conducting orientation of the board members with respect to their social mission as part of the on-boarding process of the board members.
Conclusion


Section 04THE WAY FORWARD

Annual Assessment of the Microfinance Industry
Section 04
57
The Way ForwardPakistan Microfinance Review 2017
Financial services for all
The Way Forward
China’s Belt and Road Initiative (BRI) is an extensive international development program that envisions 900 smaller projects estimated at USD 890 Billion13.
With 6 Economic Corridors (spanning Asia, Europe and Africa) and a Maritime route, the aim of the initiative is that to China to other major economic
Impact of CPEC on Microfinance Outreach
13 The Benefits of the Modern Silk Road: The China-Pakistan Economic Corridor (CPEC), ACCA.

Annual Assessment of the Microfinance Industry
Section 04
58
The Way ForwardPakistan Microfinance Review 2017Financial services for all
centers involving 65 countries. Each linkage created will develop the economy surrounding it. The China-Pakistan Economic Corridor (CPEC) is a lead venture in the BRI, with its development ahead of all other associated projects under the initiative. The development projects under CPEC are valued at USD 46 Billion as of 2015 and extend over a period of 15 years (2015 – 2030). Estimates suggest that this unparalleled initiative will generate more Foreign Direct Investment (FDI) than the cumulative FDI Pakistan has received since 1970, which is equivalent to 17% of Pakistan’s GDP14.
The issues faced by Pakistan’s economy involve constant losses within the industrial sector because of the continuous energy shortfall, insufficient foreign direct investment (FDI), losses because of terrorism and extremism, poor infrastructure development and a negative balance of payments. The projects under CPEC aim to address to all these issues directly or indirectly. According to the plan, there are four major areas that are targeted for investment. These are categorized as follows: energy projects, infrastructure development, industrial cooperation and development of the Gwadar Port, considered to be the crown jewel of the project.
With 21 projects dedicated to resolving the energy crisis, the target is the production of an additional 16,400 megawatts of power, which is approximately equivalent to the existing capacity of the country and sufficient to address the country’s existing shortfall. To improve the nation’s infrastructure, almost USD 11 billion has been dedicated for the development of railway and road networks. Under the medium/long term projects, there is a focus towards improved industrial cooperation by utilizing the energy and infrastructure projects to increase the capacity of the industrial sector. The establishment of planned Special Economic Zones throughout the nation would ideally attract local and foreign capital which would further encourage growth and cooperation with a focus on export-led production. Such an initiative would impact the country’s balance of payments by reducing the current account outflows significantly. Notably, this is essential to generate revenues to pay off CPEC and other debts of the country.
The plan for Gwadar involves strategic and smart
development for the city and its port which will lead to development across the Makran Coast. The arrangement for the region is such that along with regulatory interventions, Gwadar will be developed as a Special Economic Zone (SEZ) and guarantees short term financial development, including downstream impacts. The plan for the city also involves facilities that encourage trade, tourism, public-private cooperation and economic improvements on a national and provincial level.
But CPEC is much more than just building roads and railway networks, it is an initiative for the socio-economic development of the region. As per the Planning Commission, CPEC could create around 800,000 jobs over the 15 years, with over 30,000 associated with just the early harvest projects for Pakistani labor15. 16,000 of the 30,000 were associated with the Energy sector, while 13,000 were related to the Infrastructure development project. The Financial sector of the nation will also experience rapid growth. It has been determined that the lending and deposit base of the sector would experience at least 2-3 percent growth within the banking sector alone annually, with a significantly greater impact indirectly on other sectors and services. It is also estimated that around USD 30 billion worth of projects would be insured during the period, a considerable business for insurers locally and internationally, which can be translated into additional insurance premium of PKR 2 billion annually16. This is also an unprecedented opportunity for Pakistan to achieve the Sustainable Development Goals (SDGs) and targets. Along with promotion of trade, urban development, energy and other developments, the country can also focus on building a green financial ecosystem along with complementing regulatory policies which can stimulate sustainable economic growth throughout the nation.
With the inevitable development along the CPEC route and more specifically in the provinces of Balochistan, KPK and Gilgit-Baltistan, microfinance providers would now be able to serve outlying segments of the population excluded from formal financial services. With the number of jobs being created in the region, a greater number of individuals would seek a medium for financial
14 Ibid.15 The Nation: CPEC early harvest projects create over 30,000 jobs.16 Hashemy 2016: CPEC: Implications for Pakistan’s Economy and Sectors.

Annual Assessment of the Microfinance Industry
Section 04
59
The Way ForwardPakistan Microfinance Review 2017
Financial services for all
access and services. Moreover, the likely regional boom in infrastructure would complement the growth of MSMEs in the region. By capitalizing on this opportunity, microfinance providers can be a resource of prime importance for developing communities and smaller, emerging businesses. This increase in the potential microfinance market would result in enhanced competition amongst providers in the shape of improved offerings and services. In addition, we may see Chinese investors and financial institutions taking interest in the sector like recent investments in Pakistan by Ali Baba.
There are various channels through which improved infrastructure will lead to increase in rural development and poverty reduction. It is evident that poor infrastructure is a bottleneck to rural growth and development. With increased access to credit and other financial services, borrowing costs of funds would be reduced which in turn would allow local micro and household businesses an opportunity to invest in new or existing ventures with ease. Similarly, the increase in power output
would also benefit these local entrepreneurs as it will lead to improved production capacity and output efficiency, hence, translating into increased income. Improvement in road infrastructure and communication network would lead to reduced transportation costs and promotion of local tradecraft. Based on the developments in the infrastructure and energy sectors, it is expected that CPEC would help a great deal in uplifting the rural sector in Pakistan. It would prove a game changer in enhancing growth in output, poverty reduction and economic uplift.
To ensure success, consultative engagement with the central bank is important to review and align the laws and regulations to the emerging realties and hopefully the evolving eco-system and investment in infrastructure should lead to an improving risk appetite of the lenders for greater financial penetration particularly with respect to small businesses.
The current growth being experienced by the industry is continually increasing the funding requirements of the players, big and small. MFPs are increasingly diversifying their sources of funds. International lending is one of the sources that is being used to meet the financing needs as the microfinance industry is continuing to generate local and international investor interest. The recent acquisition of Pak Oman Microfinance Bank (POMFB) by Lanka Orix Leasing Company and acquisition of 45 percent stake in Telenor Microfinance Bank by ANT Financials, the financial arm of Chinese e-commerce giant Ali Baba are reflective of this trend.
To get a more nuanced view of the funding landscape of the industry it is important to examine the funding needs by peer groups.
Microfinance Banks (MFBs)While MFBs have witnessed impressive growth in their deposit base over the last few years and now increasingly rely on deposits as their main sources of funds. However, this growth has come on the back of offering above market rates to depositors. This approach has been greatly helped by the low interest environment prevailing in the country for the last few years and deposits rates did not impact the top line of MFBs. However, MFBs will need to reconsider their strategy in view of the rising interest in near future and the pressure to reduce lending rates may make it difficult to offer such competitive returns on deposits. Going further, such entities will need to focus on retail deposits by designing products that meet the saving needs of the lower income strata. Setting up of the Deposit Protection Company (DPC)
Funding Landscape

Annual Assessment of the Microfinance Industry
Section 04
60
The Way ForwardPakistan Microfinance Review 2017Financial services for all
will likely assist players in raising deposits from retail clients.
Despite obvious reliance on deposits, MFBs have been borrowing from commercial sources also. However, a key challenge facing the larger and more established MFBs is capital burnout. At a time when investors are looking towards returns on their investments, MFBs must find a balance between giving dividends and meeting the regulatory capital requirements. Such players have resorted to issuing subordinated debt to meet their capital requirements whereas in the near future we may see a couple of leading players issuing IPOs to shore up their capital.
Non-Bank MFPsMFIs and RSPs rely on debt as a main source of funds. Increasing funding needs have moved several
players to explore options other than the national apex. Increasingly, large and mid-sized players are borrowing from international sources. Several Microfinance Investment Vehicles (MIVs) and impact investors have made successful debt placements with such players. While expensive, the absence of a requirement for tangible collateral, makes these debt placements attractive for MFIs. Local lenders, despite the efforts of players, regulators and the association, are reluctant to lend to the non-bank players in the absence of collateral or a guarantee.
A few mid-sized and smaller players are also unable to borrow because of a weak capital base. They are unable to raise equity as they are still structured as non-profit entities and rely on retained earnings to shore up their capital base. In such a scenario, converting into a for-profit entity and injecting equity would be a prudent option. Another option can be that the national apex provides them funds for endowment as was successfully done before.
The Digital Services Platform (DSP) is a product of PMN’s concerted efforts to introduce and implement innovative interventions in the sector. DSP envisages offering digital services in a shared hosting environment which will enable MFPs to achieve twin objectives by bringing efficiencies in their business operations while providing ease of accessibility of financial services to end customers through linkages with multiple digital financial distribution channels.
The Platform will also enable inter-operable transactions such as real-time funds transfer, bill payments aggregation system, bulk disbursements
and repayments, and hosted loan management system for the microfinance providers. With all MFPs interconnected via DSP, the authorization, disbursement and repayment of microloans will become digitalized and seamless. In addition, it will host various financial tools and solutions including workflow-based product modules, credit scoring and data analytics. End-to-end digitalization of microfinance operations will provide the impetus for outreach expansion, optimal cost of operation, and enhanced efficiency and productivity. Going forward, the Platform will also help in increasing opening and usability of M-Wallet accounts.
Digital Services Platform – a path towards digitizing Microfinance

Annual Assessment of the Microfinance Industry
Section 04
61
The Way ForwardPakistan Microfinance Review 2017
Financial services for all
1
2Borrower submits the Loan application Risk
Assessment
M-Wallet Creation
M-Wallet Bank
MFI - Agent
Rules & Regulations Social & BusinessAppraisal
OTC
Bulk File Generation
Bulk Disbursement
Business Rule Engine
Business Process Manager
Event Processor
Loan Repayment
4 3
GeneralLedger MIS
Analytics
DSP
Future state: Implementation of Digital Services Platform

Annual Assessment of the Microfinance Industry
Section 04
62
The Way ForwardPakistan Microfinance Review 2017Financial services for all
The Impact of DigitizationDigitization is linked with numerous institutional benefits that the providers can reap over time. While the capital costs of this process is initially high, leveraging the existing financial distribution channels of Telcos, commercial banks, POS networks and gateways for various payment use cases has become the cornerstone for catapulting the microfinance sector towards a high growth curve and increasing its geographical footprint especially in underserved areas where the operational costs of opening branches is prohibitive. The outreach which the industry has achieved in the last 20 years can be doubled through digitization (provided there is a strong risk infrastructure in place) in the next five years.
From the clients’ perspective, the use of digital channels such as mobile wallets and OTC will give way to the introduction of products and services that combine accessibility with convenience while requiring less documentation. With the introduction of biometric verification for OTC transactions, KYC will automatically be done, and the clients will receive and repay loans instantly. Additionally, communication with the providers will be in real time as any queries or complaints can be lodged digitally. The likelihood of committing fraud and other malpractices will be greatly reduced as the
field staff reports will be available online. Thus, clients will have increased confidence in dealing with the institution.
Arguably, the digitization process will drive down the cost of operations by eliminating many manual steps in the loan origination, disbursements, and recovery processes. The institutions will also see increased efficiencies in terms of decreasing caseloads of loan officers while monitoring their performance regularly. In addition, data collected for both approved and rejected loans can be utilized for informed decision making. In the coming years data analytics will play a huge role in customizing products and services according to client’s needs. With end-to-end digitization of the microfinance operations, the institutions will have greater control on the loan collections which will help in managing portfolio quality.
By creating synergies among microfinance and DFS providers, there will be permutations of various payment use cases that will drive uptake of financial services holistically. For instance, if mobile wallet usage is pushed by MFPs to millions of active borrowers, the current inactive m-wallets issue can be reduced to a significant extent. Essentially, the business viability hinges on DFS providers offering low cost of transactions and MFPs providing recurring high volumes of transactions. At the same time, both need to form alliances to entice customers to adopt digital channels for transactions instead of branch banking models.
Pakistan’s youth has turned the nation into a fast-growing consumer market of more than 200 million people. It also has one of the highest rates of mobile and internet penetration in South Asia and boasts an attractive growth potential for e-commerce. Based on statistics provided by the Pakistan Telecommunication Authority (PTA), there are more than 57 million internet subscribers with the total number of 3G/4G mobile subscriptions rising to 55 million as of May 2018. Alongside increased internet penetration, over 74% of the population uses cell
phones with a smartphone penetration rate of 34% in the year 2018. Such ease of access to the internet, rate of smartphone usage/adoption along with improved consumer awareness has created the ideal opportunity for the e-commerce industry of the nation which is set to thrive exponentially.
While the total sales recorded for the year of 2017 stood at $622 million, Pakistan’s e-commerce industry is still in its infancy where less than one-fifth of the total population uses the internet. According
E-Commerce

Annual Assessment of the Microfinance Industry
Section 04
63
The Way ForwardPakistan Microfinance Review 2017
Financial services for all
to the latest issue of Payment Systems Review by the State Bank of Pakistan (SBP), the number of e-commerce merchants has increased by 2.6 times with the current figure at 905 registered merchants. The report also indicated that related payments experienced an increase of 2.3 times within just 12 months with around 800 million payment transactions totaling PKR 4.5 Billion booked in the last quarter of 2017. This is a considerable spike when compared to the PKR 2 Billion that was generated in the same period of 2016. But these numbers are only associated with payments made through debit/credit cards which implies that the actual value of e-commerce sales is likely several times larger than the above-mentioned figures. This is because 85% of online transactions occur through Cash on Delivery (COD) which is the preferred mode of payment for consumers. It is also worth noting that Pakistan’s e-commerce sales are projected to cross the USD 1 Billion mark by 2020, which based on indicators and the rate of growth suggests that it might happen much sooner.
This potential of growth has not gone unnoticed international and has encouraged foreign investment. The acquisition of Daraz by the Alibaba group indicates that the e-commerce business would be the next big emerging sector. This was preceded by the 45% acquisition of Telenor Microfinance Bank or EasyPaisa by Alibaba’s affiliate Ant Financials which aims to address the lack of payment gateways. Not only will this allow e-commerce transactions to be conducted digitally but also allow for increased mobile payment penetration while further developing mobile payments and digital financial services. Such foreign intervention within the e-commerce industry will also introduce international best practices and modern technology into Pakistan, leading to improved industry competition, innovation and expansion through improved quality of products as well as services for consumers. Now that a giant like Alibaba has entered Pakistan, more are likely to follow. Potential investors and companies that were initially hesitant to enter the Pakistani marketplace will now consider such a move feasible.
Insurtech is a hybrid of “insurance” and “technology” that was inspired by the term Fintech. Comprehensively the term ‘Insurtech’ can be characterized as utilizing technological innovation for improved customer experience, alternate channels of distribution/delivery, cost-savings, improved efficiency, more effective policy management and personalized products for the customers while leading to improved competition amongst the players.
Until recently, it was troublesome for insurers to offer their services to the underprivileged segment. The historically prevailing models and mechanisms render the provision of these services financially unfeasible for this population. Activities such as risk assessment of potential clients which require formal documentation and information are not practical because such data is simply not available. However, this is starting to change.
With the advancement in technologies, there is
an opportunity to make this service available to the underprivileged segment utilizing more sophisticated and technologically evolved business models. With the ease in accessibility of smart phones and the internet via Mobile Network Operators (MNOs), a whole new distribution network has emerged which implies more clients are effectively reachable. With the use of prepaid services and the development of these improved business models, the underprivileged segments located in remote areas can now be reached more conveniently in a cost-efficient manner. For these new models to be successful, strategic alliances and partnerships among Mobile Network Operators and service providers in the agriculture and financial services sectors are essential to cater to this underprivileged segment and advance financial inclusion while providing them with accessibility to other related financial services.
Although still in infancy, Insurtech is currently in the process of adopting and integrating modern
Insurtech

Annual Assessment of the Microfinance Industry
Section 04
64
The Way ForwardPakistan Microfinance Review 2017Financial services for all
technologies with existing mechanisms of the insurance business. While most of these have not been adopted widely within most sectors of the country, some have the potential for being effectively utilized by Insurtechs to tackle genuine business issues. These are usage-based insurance, peer-to-peer insurance, machine learning, Internet of Things and of course, Blockchain. These advancements in the infrastructure and technologies have provided insurers with an opportunity to re-evaluate themselves drastically. With the potential to target the market in a fundamentally distinct manner from its traditional counterparts, Insurtechs can utilize
digital processes, products and more developed systems based on the latest technology. Some of the ways Insurtechs could maximize their value proposition include improved connectivity, complete automation and digitization of processes, faster decision making, data-driven insights, improved customer engagement and increased number of interactions. With the potential to target “value pools” in the industry as opposed to just simply providing end-to-end solutions, Insurtech is the next big thing.
Credit bureaus provide information to lenders which allows them to take lending decisions. A credit bureau collects and researches borrower’s credit information and sells it to various lenders. Information for credit bureaus in obtained from not only lending institutes but also vendors, utility companies and other debtors. Based on this information, credit bureaus have also developed credit scoring models which assist creditors in making decision on granting loans.
Keeping in view the importance of credit bureaus in the financial industry, key stakeholders including PMIC (formerly PPAF), PMN and SBP had worked towards setting up MF-CIB for the microfinance industry in the country. This bureau become fully functional in 2012, housed with a private entity M/S DataCheck. However, the inability of the bureau to obtain a license under the Credit Bureau Act 2015 led SBP to suspend reporting by MFBs to the credit
bureau. Though MFIs and RSPs are still reporting the data to the bureau, absence of the data from MFBs which make up sizable chunk of the industry’s borrowers, does not provide full information to the lenders. This situation has been prevailing for around two years. Key stakeholders are making concentrated efforts to resolve the situation and, in this regard, SBP has also lowered the paid-up capital requirements for obtaining a credit bureau license.
It is hoped that the impasse shall be resolved soon. Moreover, addition of debtors like super markets, departmental stores and other such establishments which provide credit for sale of consumer durables need to be brought into the ambit of credit bureaus in the country. It will not only protect such entities against delinquencies but also provide other lenders with the true credit picture of their borrowers.
The Credit Bureau Impasse

Annual Assessment of the Microfinance Industry
Section 04
65
The Way ForwardPakistan Microfinance Review 2017
Financial services for all
Cost of compliance to the prevailing laws, rules and regulations has been growing for the industry due to the increasing size and age of the industry, prevailing global and regional environment and fast changing technology. These costs are a direct result of players having to hire specialized staff, building their capacity, updating their SOPs, enhancing their internal controls and investing in technology to ensure compliance.
Among the key changes in the legal and regulatory environment that led to rising costs of compliance was bringing non-bank players including MFIs and RSPs into the regulatory ambit. Since these non-bank players had grown over the years, it was a necessity to bring them into regulatory umbrella. This has resulted in increased disclosure and reporting, licensing and governance costs for these players.
Keeping in view that Pakistan lies in region which has faced challenges on the security front, there are stringent Anti-Money Laundering (AML) and Know You Customer (KYC) requirements. Pressed by international bodies like Financial Action Task Force (FATF), SECP and SBP have issued strict AML & KYC guidelines for the financial industry including the microfinance industry.
In September 2016, Pakistan became the 104th signatory to the Multilateral Convention on Mutual Administrative Assistance in Tax Matters of Organization for Economic Cooperation and Development (OECD). This is a powerful instrument for international tax cooperation and part of global efforts to curb the incidence of tax evasion especially in case of offshore assets. The agreement requires automatic exchange of information under the
State’s own systems through standardized formats under corresponding agreements with other signatories. The Federal Board of Revenue (FBR) is the coordinating body for this Convention in Pakistan and issued a notification in this regard in March 2017. As of July 2017, all financial institutions are required to report on standardized formats known as Common Reporting Standards (CRS).
The State Bank of Pakistan (SBP) has made it mandatory for commercial banks including MFBs to adopt the Europay Master Card Visa (EMV) standard by June 2018. EMV is a global standard for chip-based cards and the related technology used to authenticate their transactions. This standard helps prevent consumer and issuers alike from hacking and counterfeit frauds. As per SBP regulations, all ATMs, POS and other related payment cards processing shall be compliant with EMV by Dec 31, 2017 and all issuers will begin issuing EMV cards by June 2018. All payment card processing infrastructure shall accept standard chip and pin by December 31, 2018. This has important implications for the MFBs, as it came at a time when most of these entities were planning to launch their debit cards. The costs associated with the standard are high for the sector especially since the target clientele belongs to lower income strata and makes issuing debit cards an expensive option for MFBs.
While the laws and regulations are necessary to protect the interest of the clients and ensure smooth operations of the players and further develop the industry, however, it will result in increasing the operational cost of the sector in the short run which is already hampered by higher costs.
Cost of Compliance

Annual Assessment of the Microfinance Industry
Section 04
66
The Way ForwardPakistan Microfinance Review 2017Financial services for all
One of the key challenges in the current digital age is data privacy. We live in a time when everything is inter-connected, and information can be accessed easily. Data privacy, also called information privacy, is a necessity to preserve and protect personal information, collected by any organization, from being accessed by a third party . It is that component of information technology that allows an individual or an organization to determine which data can be shared with third parties and which should be restricted. The challenge of data privacy arises wherever personally identifiable information is collected, stored or used.
Data collection is now a powerful tool used by private organizations to target consumers. Businesses, both big and small, buy details including contact numbers to add to their potential customer lists as digital solutions make everything from food delivery to payments and loans possible using smartphones.
The microfinance industry is increasingly leveraging technology to expand outreach and achieve operational efficiencies. With extensive client data available with the players, the industry is relying on credit histories to lend to its clients and efforts are underway to integrate credit scores into the risk management framework of players. Digital credit products are being piloted by many of the practitioners relying on the recorded digital footprint of the individual. Keeping this in view, it is essential for the industry to address the issue of data privacy. The situation is further compounded by the fact the country does not have any data privacy law. MFPs need to develop privacy policies that are extensive and provide clear and transparent breakdown of what happens to client data and with whom it is shared, whether third parties, associated business or government bodies.
Data Privacy
17 www.cleverism.com


Section 05ANNEXURES

Annual Assessment of the Microfinance Industry
Section 05
69
AnnexuresPakistan Microfinance Review 2017
Financial services for all
AI - Performance indicators of industry 2017

Annual Assessment of the Microfinance Industry
Section 05
70
AnnexuresPakistan Microfinance Review 2017Financial services for all
Infrastructure2010 2011 2012 2013 2014 2015 2016 2017
Total Assets (PKR 000) 35,826,211 48,569,411 61,928,036 81,557,894 105,443,135 145,186,197 225,316,798 330,422,557
Branches (including Head Office)
1,405 1,550 1,630 1,606 2,026 2,754 2,430 3,533
Total Staff 12,005 14,202 15,153 17,456 21,516 25,560 29,413 36,053
Growth Rate
Total Assets 17.6% 35.6% 27.5% 31.7% 29.3% 37.7% 55.2% 46.6%
Branches (including Head Office)
15.1% 10.3% 5.2% -1.5% 26.2% 35.9% -11.8% 45.4%
Total Staff 3.9% 18.3% 6.7% 15.2% 23.3% 18.8% 15.1% 22.6%
Financing Structure2010 2011 2012 2013 2014 2015 2016 2017
Total Assets (PKR 000) 35,826,211 48,569,411 61,928,036 81,557,894 105,443,135 145,186,198 225,316,798 330,422,557
Total Equity (PKR 000) 8,359,260 10,314,307 11,679,373 17,049,706 22,873,920 29,688,776 36,535,925 51,343,541
Total Debt (PKR 000) 27,466,951 38,255,104 25,876,598 26,913,359 34,682,369 38,554,959 54,710,855 74,100,602
Commercial Liabilities (PKR 000)
4,910,265 12,332,456 19,361,179 21,662,200 18,679,724 19,030,672 43,167,480 57,114,700
Deposits (PKR 000)* 10,132,332 13,908,759 20,840,990 32,925,558 42,715,846 60,028,340 118,096,732 185,909,781
Gross Loan Portfolio (PKR 000)
20,295,915 24,854,747 33,877,284 46,613,582 63,531,465 90,296,341 132,003,052 196,013,814
Ratios
Equity-to-Asset Ratio 23.3% 21.2% 18.9% 20.9% 21.7% 20.4% 16.2% 15.5%
Commercial Liabilities-to-Total Debt
17.9% 32.2% 74.8% 80.5% 53.9% 49.4% 78.9% 77.1%
Debt-to-Equity Ratio 3.29 3.41 2.22 1.58 1.52 1.30 1.50 1.44
Deposits-to-Gross Loan Portfolio
49.9% 56.0% 61.5% 70.6% 67.2% 66.5% 89.5% 95.3%
Deposits-to-Total Assets 28.3% 28.6% 33.7% 40.4% 40.5% 41.3% 52.4% 56.5%
Gross Loan Portfolio-to-Total Assets
56.7% 51.2% 54.7% 57.2% 60.3% 62.2% 58.6% 59.3%
*Only MFB deposits included
Outreach2010 2011 2012 2013 2014 2015 2016 2017
Active Borrowers 1,567,355 1,661,902 2,040,518 2,392,874 2,997,868 3,632,532 4,225,968 5,512,457
Active Women Borrowers 811,520 917,058 1,275,387 1,442,197 1,692,451 2,001,772 2,273,389 2,717,487
Gross Loan Portfolio (PKR 000)
20,295,915 24,854,747 33,877,284 46,613,582 63,531,465 90,100,405 132,003,052 196,013,814

Annual Assessment of the Microfinance Industry
Section 05
71
AnnexuresPakistan Microfinance Review 2017
Financial services for all
2010 2011 2012 2013 2014 2015 2016 2017
Annual per Capita Income (PKR)***
105,300 107,505 118,085 143,808 143,808 153,060 153,060 170,508
Number of Loans Outstanding
1,547,197 1,661,902 2,040,518 2,401,849 2,998,895 3,632,532 4,227,317 5,513,311
Depositors**** 764,271 1,332,705 1,730,823 2,150,675 5,675,437 10,661,366 15,937,079 35,844,058
Number of Deposit Accounts 764,271 1,332,705 1,730,823 2,998,641 5,675,437 10,661,366 15,937,079 35,939,126
Number of Women Depositors
64,159 259,104 334,994 837,144 2,503,582 3,009,992 142,784 84,276
Deposits Outstanding 10,132,332 13,908,759 20,840,990 32,925,559 42,715,786 60,028,340 118,096,732 185,909,900
Weighted Avg.
Weighted Avg.
Weighted Avg.
Weighted Avg.
Weighted Avg.
Proportion of Active Women Borrowers (%)
51.8% 55.2% 62.5% 60.3% 56.5% 55.1% 53.8% 49.3%
Average Loan Balance per Active Borrower (PKR)
12,949 14,956 16,602 19,480 21,192 24,804 31,236 35,558
Average Loan Balance per Active Borrower/Per Capita Income
12.3% 13.9% 14.1% 13.5% 14.7% 16.2% 20.4% 20.9%
Average Outstanding Loan Balance (PKR)
13,118 14,956 16,602 19,407 21,185 24,804 31,226 35,553
Average Outstanding Loan Balance /Per Capita Income
12.5% 13.9% 14.1% 13.5% 14.7% 16.2% 20.4% 20.9%
Proportion of Active Women Depositors (%)
8.4% 19.4% 19.4% 38.9% 44.11% 28.23% 0.90% 0.24%
Average Saving Balance per Active Depositor (PKR)
13,258 10,436 12,041 15,309 7,526 5,630 7,410 5,187
Active Deposit Account Balance (PKR)
13,258 10,436 12,041 10,980 7,526 5,630 7,410 5,173
Financial Performance2010 2011 2012 2013 2014 2015 2016 2017
Income from Loan Portfolio 6,122,154 7,998,956 10,040,720 13,542,893 18,581,489 26,007,641 36,582,140 50,540,640
Income from Investments 870,809 1,203,306 1,774,610 1,742,975 2,051,547 3,946,607 2,716,932 3,717,490
Income from Other Sources 528,457 899,713 816,461 2,093,035 3,707,417 2,919,233 2,471,332 11,467,052
Total Revenue 7,521,420 10,101,975 12,631,792 17,378,903 24,340,453 32,873,481 41,770,404 65,725,182
Less : Financial Expense 2,016,795 2,905,049 3,974,467 4,767,589 5,451,197 6,550,481 8,963,917 14,121,730
Gross Financial Margin 5,504,624 7,196,926 8,657,325 12,611,314 18,889,256 26,323,001 32,806,487 51,603,452
Less: Loan Loss Provision Expense
745,660 623,988 643,991 658,812 794,500 1,258,313 2,504,433 2,832,799
Net Financial Margin 4,758,964 6,572,938 8,013,334 11,952,503 18,094,756 25,064,687 30,302,054 48,770,653
Personnel Expense 2,819,891 3,345,284 3,784,676 5,032,342 6,557,709 8,712,495 11,575,971 15,112,625
Admin Expense 1,961,816 2,446,750 2,886,025 3,880,920 5,951,408 7,244,592 9,076,966 19,019,029
Less: Operating Expense 4,781,707 5,792,035 1,342,633 8,913,262 12,509,117 15,957,087 20,652,937 34,131,654
Other Non Operating Wxpense
257,651 380,993 1,546,240 2,719,173 772,940 1,638,024

Annual Assessment of the Microfinance Industry
Section 05
72
AnnexuresPakistan Microfinance Review 2017Financial services for all
2010 2011 2012 2013 2014 2015 2016 2017
Net Income before Tax (22,742) 780,903 1,084,982 2,658,248 4,039,399 6,388,427 8,876,178 13,000,975
Provision for Tax (7,047) 116,314 152,380 503,118 614,684 1,230,787 1,977,555 3,012,831
Net Income/(Loss) (15,696) 664,589 932,602 2,155,130 3,424,715 5,157,640 6,898,623 9,988,144
Adjusted Financial Expense on Borrowings
- 372,524 205,943 181,422 113,553 402,632 491,926 677,186
Inflation Adjustment Expense
- (3,073) 870 1,152 916 270 722 6,126
Adjusted Loan Loss Provision Expense
- 357,688 49,456 18,743 13,625 275,656 321,188 310,174
Total Adjustment Expense - 727,138 256,270 201,317 128,095 678,559 813,820 993,486
Net Income/(Loss) After Adjustments
(15,696) (62,549) 676,332 1,953,814 3,296,620 4,479,081 6,084,802 8,994,658
Average Total Assets 30,399,088 42,282,393 57,182,714 70,192,281 95,494,664 125,951,408 178,064,618 284,188,864
Average Total Equity 7,854,713 8,719,204 11,594,943 14,513,187 20,629,780 29,905,254 32,240,189 46,142,667
Ratios weighted avg.
weighted avg.
weighted avg.
Adjusted Return-on-Assets (0.1%) (0.1%) 1.2% 3.3% 3.5% 3.6% 3.4% 3.2%
Adjusted Return-on-Equity (0.2%) (0.7%) 5.8% 16.1% 16.0% 15.0% 18.9% 19.5%
Operational Self Sufficiency (OSS)
99.7% 108.4% 109.4% 118.1% 119.9% 124.1% 127.0% 124.7%
Financial Self Sufficiency (FSS)
81.7% 100.5% 107.0% 116.5% 117.7% 121.0% 123.9% 122.4%
Operating Income2010 2011 2012 2013 2014 2015 2016 2017
Revenue from Loan Portfolio
6,122,154 7,998,956 10,040,720 13,542,893 18,581,489 26,007,641 36,582,140 50,540,640
Total Revenue 7,521,420 10,101,975 12,631,792 17,378,903 24,821,486 32,873,481 41,770,404 65,725,182
Adjusted Net Operating Income / (Loss)
(22,742) 5,252 828,712 2,456,931 3,286,779 4,474,629 6,084,786 9,222,456
Average Total Assets 30,399,088 42,282,393 57,182,714 70,192,281 95,494,664 125,951,408 178,064,618 284,188,864
Gross Loan Portfolio (Opening Balance)
16,948,466 20,576,342 25,743,757 34,668,730 48,423,008 63,402,462 89,528,314 132,248,995
Gross Loan Portfolio (Closing Balance)
20,295,915 24,854,747 33,877,284 46,105,712 63,531,465 90,283,337 132,003,052 196,013,814
Average Gross Loan Portfolio
18,622,190 22,715,544 29,810,520 40,387,221 55,977,237 76,842,899 110,765,683 164,131,404
Inflation Rate *** 15.00% 11.20% 10.40% 9.20% 8.20% 3.60% 3.70% 4.57%
weighted avg.
weighted avg.
weighted avg.
weighted avg.
Total Revenue Ratio (Total Revenue-to-Average Total Assets)
24.7% 23.9% 22.3% 24.8% 26.0% 26.1% 23.5% 23.1%
Adjusted Profit Margin (Adjusted Profit/(Loss)-to-Total Revenue)
(0.3%) 0.1% 7.0% 14.1% 13.2% 13.6% 14.6% 14.0%

Annual Assessment of the Microfinance Industry
Section 05
73
AnnexuresPakistan Microfinance Review 2017
Financial services for all
2010 2011 2012 2013 2014 2015 2016 2017
Yield on Gross Portfolio (Nominal)
32.9% 35.2% 34.2% 33.5% 34.6% 34.6% 33.0% 30.8%
Yield on Gross Portfolio (Real)
15.5% 21.6% 21.6% 22.3% 24.4% 29.9% 29.8% 25.1%
Operating Expense2010 2011 2012 2013 2014 2015 2016 2017
Adjusted Total Expense 7,544,162 10,096,723 11,803,080 14,540,979 20,842,120 27,121,782 33,707,341 53,711,567
Adjusted Financial Expense 2,016,795 3,304,504 4,181,281 4,950,162 5,742,091 6,911,552 9,455,843 14,798,916
Adjusted Loan Loss Provision Expense
745,660 1,000,184 693,447 677,555 808,125 1,533,970 2,825,622 3,142,973
Adjusted Operating Expense 4,781,707 5,792,035 6,928,352 8,913,262 14,291,904 18,676,260 21,425,876 35,769,678
Adjustment Expense - 775,651 256,270 201,317 453,639 678,579 813,837 993,486
Average Total Assets 30,399,088 42,282,393 57,182,714 70,192,281 95,494,664 125,951,408 178,064,618 284,188,864
Ratios Weighted avg.
Weighted avg.
Weighted avg.
Weighted avg.
Weighted avg.
Adjusted Total Expense-to-Average Total Assets
24.8% 23.9% 20.6% 20.7% 21.8% 21.5% 18.9% 18.9%
Adjusted Financial Expense-to-Average Total Assets
6.6% 7.8% 7.3% 7.1% 6.0% 5.5% 5.3% 5.2%
Adjusted Loan Loss Provision Expense-to-Average Total Assets
2.5% 2.4% 1.2% 1.0% 0.8% 1.2% 1.6% 1.1%
Adjusted Operating Expense-to-Average Total Assets
15.7% 13.7% 12.1% 12.7% 15.0% 14.8% 12.0% 12.6%
Adjusted Personnel Expense 9.3% 7.9% 6.6% 7.2% 6.9% 6.9% 6.5% 5.3%
Adjusted Admin Expense 6.5% 5.8% 5.0% 5.5% 6.2% 5.8% 5.1% 6.7%
Adjustment Expense-to-Average Total Assets
0.0% 1.8% 0.4% 0.3% 0.5% 0.5% 0.5% 0.3%

Annual Assessment of the Microfinance Industry
Section 05
74
AnnexuresPakistan Microfinance Review 2017Financial services for all
Operating Efficiency2010 2011 2012 2013 2014 2015 2016 2017
Operating Expense (PKR 000)
4,781,707 5,792,035 6,928,352 8,913,262 12,745,665 15,957,087 20,652,937 34,131,654
Personnel Expense (PKR 000)
2,819,891 3,345,284 3,784,676 5,032,342 6,794,257 8,712,495 11,575,971 15,112,625
Average Gross Loan Portfolio (PKR 000)
18,622,190 22,715,544 29,810,520 40,387,221 55,977,237 76,842,899 110,765,683 164,131,404
Average Number of Active Borrowers
1,567,355 1,661,902 2,040,518 2,350,650 2,997,868 3,632,532 4,225,968 5,512,457
Average Number of Active Loans
1,567,355 1,661,902 2,040,518 2,359,625 2,998,895 3,632,532 4,227,317 5,513,311
weighted avg.
weighted avg.
weighted avg.
weighted avg.
weighted avg.
Adjusted Operating Expense-to-Average Gross Loan Portfolio
25.7% 25.5% 23.2% 22.1% 22.8% 20.8% 18.6% 20.8%
Adjusted Personnel Expense-to-Average Gross Loan Portfolio
15.1% 14.7% 12.7% 12.5% 12.1% 11.3% 10.5% 9.2%
Average Salary/Gross Domestic Product per Capita
2.23 2.19 2.12 2.00 2.2 2.2 2.6 2.5
Adjusted Cost per Borrower (PKR)
3,051 3,485 3,395 3,792 4,252 4,393 4,887 6,192
Adjusted Cost per Loan (PKR)
3,051 3,485 3,395 3,777 4,250 4,393 4,886 6,191
Productivity2010 2011 2012 2013 2014 2015 2016 2017
Number of Active Loans 1,567,355 1,661,902 2,040,518 2,263,432 2,997,868 3,632,532 4,227,317 5,513,311
Number of Active Depositors
764,271 1,332,705 1,730,823 1,897,872 5,675,437 10,661,366 15,937,079 35,844,058
Number of Deposit Accounts 764,271 1,332,705 1,730,823 2,707,872 5,675,437 10,661,366 15,937,079 35,939,126
Total Staff 12,005 14,202 15,153 15,673 19,227 25,343 29,413 36,705
Total Loan Officers 5,148 7,165 7,541 6,892 8,801 9,923 15,342 18,028
weighted avg.
weighted avg.
weighted avg.
weighted avg.
weighted avg.
Borrowers per Staff 131 117 135 144 156 143 144 150
Loans per Staff 131 117 135 144 156 143 144 150
Borrowers per Loan Officer 304 232 271 327 341 366 275 306
Loans per Loan Officer 304 232 271 328 328 366 276 306
Depositors per Staff 64 94 114 121 295 421 542 977
Deposit Accounts per Staff 64 94 114 173 295 421 542 979
Personnel Allocation Ratio 42.9% 50.5% 49.8% 44.0% 45.8% 39.2% 52.2% 49.1%

Annual Assessment of the Microfinance Industry
Section 05
75
AnnexuresPakistan Microfinance Review 2017
Financial services for all
Risk2010 2011 2012 2013 2014 2015 2016 2017
Portfolio at Risk > 30 days 829,314 793,966 1,232,842 1,157,297 659,418 1,321,207 1,565,459 1,001,736
Portfolio at Risk > 90 days 577,972 516,623 1,020,316 932,166 379,637 781,212 1,073,562 1,085,263
Adjusted Loan Loss Reserve 733,338 623,988 759,621 708,355 1,189,884 1,468,006 2,814,919 4,202,893
Loan Written Off during Year
335,463 592,429 675,835 615,293 1,222,076 917,855 1,147,319 1,581,598
Gross Loan Portfolio 20,295,915 24,854,747 33,877,284 46,105,712 63,531,465 90,081,589 132,003,052 196,013,814
Average Gross Loan Portfolio
18,622,190 22,715,544 29,810,520 40,387,221 55,977,237 76,690,720 110,765,683 164,131,404
weighted avg.
weighted avg.
weighted avg.
weighted avg.
weighted avg.
Portfolio at Risk (>30)-to-Gross Loan Portfolio
4.1% 3.2% 3.6% 2.5% 1.0% 1.5% 1.2% 0.5%
Portfolio at Risk(>90)-to-Gross Loan Portfolio
2.8% 2.1% 3.0% 2.0% 0.6% 0.9% 0.8% 0.6%
Write Off-to-Average Gross Loan Portfolio
1.8% 2.6% 2.3% 1.5% 2.2% 1.2% 1.0% 1.0%
Risk Coverage Ratio (Adjusted Loan Loss Reserve-to-Portfolio at Risk > 30 days)
88.4% 78.6% 61.6% 61.2% 180.4% 111.1% 179.8% 419.6%


F I N A N C I A L S E R V I C E S F O R A L L
Pakistan Microfinance Network
Third Floor, Plot No. 12-3/2, Mandir Square, G-8/1 Markaz, Islamabad.TEL. +92 51 2266214-17 FAX. +92 51 2266218
www.pmn.org.pk