paleolimnological records of environmental change...
TRANSCRIPT

PALEOLIMNOLOGICAL RECORDS OF
ENVIRONMENTAL CHANGE PRESERVED IN
PALEO-LAKE MABABE, NORTHWEST BOTSWANA
By
JENNIFER L. GAMROD
Bachelor of Science in Geology
Southern Methodist University
Dallas, TX
December 2005
Submitted to the Faculty of the
Graduate College of the
Oklahoma State University
in partial fulfillment of
the requirements for
the Degree of
MASTER OF SCIENCE
May 2009

ii
PALEOLIMNOLOGICAL RECORDS OF
ENVIRONMENTAL CHANGE PRESERVED IN
PALEO-LAKE MABABE, NORTHWEST BOTSWANA
Thesis Approved:
Dr. Anna Cruse
Thesis Adviser
Dr. Eliot Atekwana
Dr. Estella Atekwana
Dr. A. Gordon Emslie
Dean of the Graduate College

iii
ACKNOWLEDGMENTS
I would like to thank the National Science Foundation (NSF) for funding this
research through OISE grant #0217831, as well as the Ministry of Minerals and the
Energy and Water Resources of the government of Botswana for granting the necessary
permits to conduct this project. I would also like to thank Dr. Motsoptse Modisi, Dr.
Elisha Shemang, and Dr. Loago Molwalefhe of the University of Botswana for their
support and contributions throughout this project. Thanks to Dr. Susan Ringrose and Dr.
Huntsman-Mapila of the Harry Oppenheimer Okavango Research Center (HOORC) for
making preparations for the field season as well as their contributions to the field work.
Special thanks to Andy Foreman and Kristi Teter of Oklahoma State University for
collecting the sediment samples and to Thebe for collecting samples for OSL dating. I
would also like to thank the University of Botswana for providing logistical support and
transportation for field work as well as the HOORC for providing vehicles for the field.
Also, I would graciously like to thank the numerous individuals who came together in
this collaborative project to provide technical and logistical support for this research, and
without whom this project would not have been possible.
I would like to extend my sincerest thanks to my committee members Dr. Eliot
Atekwana, Dr. Estella Atekwana, and Dr. Anna Cruse of Oklahoma State University
(OSU) for all of your guidance, suggestions, and revisions. Thanks to Dr. Cruse for
informing me of the project and Dr. Estella Atekwana for allowing me to become
involved in the project. Special thanks to Dr. Eliot Atekwana for the countless hours you
spent discussing every aspect of this work with me and the constant revisions that only
improved my thesis. I would also like to thank Dr. Jim Puckette and Dr. Alex Simms for
allowing me to use their equipment and always being available should I need them. I
would also like to thank the OSU Geology Department for providing me funding in the
form of a Skinner Fellowship during my stay at OSU.
Also, I would like to thank all of the faculty and staff of OSU and Southern
Methodist University (SMU) for providing me a solid foundation in the geosciences.
Especially, I would like to thank Dr. Neil Tabor of SMU for allowing me to conduct a
senior thesis under his guidance, an invaluable experience which proved to help prepare
me immensely for graduate school. I would also like to thank Dr. Kurt Ferguson and the
Stable Isotope Laboratory at SMU for providing me the opportunity to work in the lab
and become involved in research.
Thank you to the ConocoPhillips Corporation for their patience and understanding
while I finished my degree and providing me a wonderful opportunity to begin working
with them as a geologist. Additionally, I would like to thank the mentors I have had in
the oil and gas industry, including Mike Shultz, Byron Davis, Bill Moulton, and John
McCarty for preparing me from my future career.

iv
I would also like to thank my friends Annie Drewry, Lauren Miller, Jared
Rountree, Kyle Nelson, and Kristi Teter who understand all too well what a day of
research is like when something does not go according to plan. Should you need to
change the tubing on the particle size analyzer again please do not call me.
I would like to thank Brad Holland for all the support you have given me during
this time and for always making the effort to drive up to spend time with me and help me
in any way you could. I would also like to thank my parents and grandparents for always
being supportive, and to my parents for helping me through school, supporting me, and
always helping me in every way you could to allow me to better myself. I would
especially like to thank my late-grandmother Hazel Gamrod for helping put me through
school and teaching me to be independent. Above all though, I always knew no matter
what I did you would always love me, support my decisions, and believe that I truly
could do anything I put my mind to.

v
TABLE OF CONTENTS
Chapter Page
I. INTRODUCTION ......................................................................................................1
II. GEOLOGIC SETTING .............................................................................................3
2.1 Okavango River System ....................................................................................3
2.2 The Okavango Delta ..........................................................................................3
2.3 The Mababe Depression ....................................................................................4
2.4 Paleo-lacustrine system ......................................................................................4
2.4.1 Lake Makgadikgadi Stage.........................................................................4
2.4.2 Lake Thamalakane Stage ..........................................................................5
2.5 Tectonic Setting .................................................................................................5
III. METHODS ..............................................................................................................7
3.1 Field Work .........................................................................................................7
3.1.1 Sample Collection .....................................................................................7
3.1.2 Lithologic Description ..............................................................................7
3.2 Sample Analyses ................................................................................................8
3.2.1 Magnetic Susceptibility ............................................................................8
3.2.2 Particle Size Analysis ...............................................................................8
3.2.3 Inorganic Carbon and Organic Carbon Analysis ......................................8
3.2.4 Metal Analysis ..........................................................................................9
3.2.5 X-ray Diffractometry ................................................................................9
3.2.6 Optically Stimulated Luminescence (OSL) Dating ..................................9
IV. RESULTS ..............................................................................................................11
4.1 Zone 1: 560-485 cm .........................................................................................11
4.2 Zone 2: 485-375 cm .........................................................................................14
4.3 Zone 3: 375-280 cm .........................................................................................14
4.4 Zone 4: 280-240 cm .........................................................................................15
4.5 Zone 5: 240-195 cm .........................................................................................16
4.6 Zone 6: 195-145 cm .........................................................................................16
4.7 Zone 7: 145-75 cm ...........................................................................................16
4.8 Zone 8: 75-0 cm ...............................................................................................17
4.9 Metals ...............................................................................................................17

vi
Chapter Page
V. DISCUSSION .........................................................................................................23
5.1 Tectonics and Lake Sedimentation ..................................................................23
5.1.1 Evidence of Tectonism ...........................................................................23
5.1.2 Tectonic Alteration of Hydrology and Sedimentation ............................25
5.1.2.1 Sedimentation Pre-240 cm-depth ................................................26
5.1.2.2 Sedimentation Pre-240 cm-depth ................................................26
5.2 Paleoenvironmental History.............................................................................27
5.2.1 Episode I (560-485 cm) > 65 ka .............................................................27
5.2.2 Episode II (485-375 cm) 65 ka to 41 ka .................................................28
5.2.3 Episode III (375-240 cm) 41 ka to < 27 ka .............................................29
5.2.4 Episode IV (240-0 cm) < 27 ka ..............................................................30
5.3 Paleoclimate .....................................................................................................33
VI. CONCLUSIONS ...................................................................................................35
VII. FUTURE WORK .................................................................................................36
REFERENCES ............................................................................................................37
APPENDICES .............................................................................................................43
MabX
Lithologic Section ....................................................................................... A1-1
Physical Properties ...................................................................................... A2-1
Carbonate and Organic Matter .................................................................... A3-1
Metals Presented in Text ............................................................................. A4-1
Additional Metals........................................................................................ A5-1
Mab6
Physical Properties .......................................................................................B1-1
Carbonate and Organic Matter .....................................................................B2-1
Metals Presented in Text ..............................................................................B3-1
Additional Metals.........................................................................................B4-1
X-ray Diffractometry Results .............................................................................C-1

vii
LIST OF TABLES
Table Page
1: Optically Stimulated Luminescence Dating .........................................................10

viii
LIST OF FIGURES
Figure Page
1a Location Map .........................................................................................................6
1b Study Area .............................................................................................................6
2 Particle Size Analysis Results ................................................................................12
3 Physical Parameters ...............................................................................................13
4 Transition Metals I .................................................................................................18
5 Transition Metals II...............................................................................................19
6 Alkali and Alkaline Earth Metals I ........................................................................20
7 Alkali and Alkaline Earth Metals II .......................................................................21
8 Conceptual Model ..................................................................................................32

1
CHAPTER I
INTRODUCTION
The Middle Kalahari of northwestern Botswana (sensu Passarge, 1904) is a
structural depression that contains lake basins which preserve a record of environmental
change and tectonic activity (e.g., Huntsman-Mapila et al., 2006; Thomas and Shaw,
1991; Thomas and Shaw, 2002). Regional and local climate shifts can result in the
environmental changes observed in these basins. Currently, the Middle Kalahari region
is a semiarid environment that had a wetter climate in the past that caused the
development of lakes. In addition to local rainfall, the lakes also receive water from
rivers such as the Okavango and Kwando Rivers, which drain tropical watersheds in the
Angolan highlands. Therefore, the lake sediments are derived from local and distal
sources. Tectonic activity associated with the south-westerly propagating Okavango Rift
(e.g., Modisi et al., 2000) also contributes to environmental changes by altering the
landscape and hydrology. For example, faulting along the Okavango rift interrupted the
flow of the Okavango River causing sedimentation that formed the Okavango Delta,
which is actually a 25,000 km2
alluvial fan (McCarthy et al., 2002). Development of the
vast Okavango Delta has altered the topography and hydrologic conditions of the region,
which likely changed lacustrine hydrologic and sedimentary budgets. Lake sediments
thus represent a unique setting that may preserve a record of local and regional climate
change and rift tectonics.
Early research on environmental change in the Middle Kalahari region focused on
describing landfroms (e.g., Passarge, 1904; Wellington, 1955; Grove, 1969) but, more
recently these investigations have centered on understanding geomorphological features
such as beach ridges around lacustrine systems such as the Mababe Depression, Lake
Ngami, and the Makgadikgadi Pans (Grove, 1969; Grey and Cooke, 1977; Shaw, 1985).
Efforts to understand the timing of beach ridge formation have been improved by the
acquisition of age dates through the use of radiocarbon (14
C), thermoluminescence (TL),
and optically stimulated luminescence (OSL) dating techniques (e.g., Cooke and
Verstappen, 1984; Shaw, 1985; Burrough et al., 2007; Burrough and Thomas, 2008;
Ringrose et al., 2008; Burrough and Thomas, 2009). Recent studies of shorelines around
Lake Ngami (Shaw et al., 2003; Burrough et al., 2007) and the Mababe Depression
(Burrough and Thomas, 2008), however, are providing new insights on the role of
climate in contributing to lake highstand events and the development of shorelines in the
region.
Investigations of the local climate have been conducted on deposits in Drotsky’s
Cave in the Kwihabe Hills of northwest Botswana (Cooke, 1975; Cooke and Verhagen,

2
1977). Climate records from the cave deposits show episodes dominated by wet and dry
conditions in the local and regional climate, as well as cyclic climatic conditions (Cooke,
1975; Shaw and Cooke, 1986). Although northwest Botswana is currently a semi-arid
environment, these studies indicate that wet periods occurred in the past. Sinter
deposition, which reflects high local rainfall, occurred at 45-37 ka, 34-29 ka, 16-13 ka, 2
ka, and 750 years ago (Cooke and Verhagen, 1977; Shaw and Cooke, 1986). These
episodes of sinter deposition correspond to wet episodes from 17-14 ka, which includes a
possible regional event at 16 ka, 4.35 ka, and 2 ka, that were identified by cave studies
conducted by Cooke (1975).
Tropical climatic signals have been recognized in sediments from Etosha Pan of
Namibia (Brook et al., 2007) where shoreline features along the pan correspond to times
of an overall wetter climate during the Holocene. The headwaters of the Okavango River
receive rainfall in the same area of the Angolan highlands that is responsible for inflow to
the Etosha Pan, thus, shifts in the tropical climate patterns that are observed in the pan
should also occur in the sedimentary records of the Middle Kalahari lake deposits. In
addition to local climate shifts recorded in cave deposits, climatic variations occurring in
the tropical Angolan highlands influence river flow into the lakes and, also, affect the
lacustrine hydrology and sedimentation in the Middle Kalahari basin.
Studies on beach ridges and caves can be useful in deciphering the climatic
history of the area; however, they cannot provide a complete record of both climatic and
tectonic events with the same resolution as sediments collected within the lake basins.
Beach ridges represent only the most recent occurrence of a lake highstand, because, by
their very nature, ridges at lower levels could be reworked during subsequently higher
lake levels, thus, past events are lost from the sedimentary record (Burrough and Thomas,
2009). Similarly, cave studies can provide a continuous record of local and regional
climate change, but they cannot be used to decipher the influence of tectonic processes on
hydrology or sedimentation. Unlike lakes in semi-arid and arid environments that only
derive sediments from local sources during locally wet climatic episodes, lakes of the
Middle Kalahari receive water and sediment input from tropical environments such as the
Angolan highlands. During dry local conditions, sediments may only be derived from
distal sources; however, lake levels may still be affected by conditions such as
evaporation that could affect lake productivity and chemical sedimentation. Sediments
from the Kalahari lake basins, therefore can provide the most complete record of local
and regional climate influence on the region and can provide insight into the timing of
tectonic events based on changes in sedimentation that are preserved in the lake
sediments.
Geochemical proxies measured from sediments within Lake Ngami (Huntsman-
Mapila et al., 2006), at the distal end of the Okavango Delta, show similar results to
climate variations preserved from beach ridge and cave studies. Additionally, the study
also revealed a possible tectonic control on the sedimentation.
In this study, sediment samples were collected from within the Mababe
Depression and analyzed for particle size distribution, high frequency magnetic
susceptibility, carbonate, organic matter, and metal content. Each of these data sets were
examined in combination to determine how environmental changes related to climate and
tectonics are recorded in lake sediments.
3
CHAPTER II
GEOLOGIC SETTING
2.1 Okavango River System
The Cubango and Cuito Rivers are major tributaries that drain the tropical
Angolan highlands and come together to form The Okavango River (Fig. 1a). The
Cubango River, in the western Angolan catchment, is affected by variations in the
Atlantic equatorial westerlies, while the Cuito River, to the east, responds to tropical lows
in Indian Ocean Easterlies, both of which are affected by the position of the Intertropical
Convergence Zone (ITCZ) (Huntsman-Mapila et al., 2006). Rainfall in the catchment of
Angola can have a profound impact on the Okavango River because it is sourced from
this area. It is these rivers that supply the majority of water to the Okavango Delta, an
average of 9200 million m3 yr
-1, but this value varies considerably each year (McCarthy
and Ellery, 1998).
2.2 The Okavango Delta
The Okavango River enters the Makgadikgadi-Okavango-Zambezi (MOZ) rift
depression (Ringrose et al., 2005) of northern Botswana through a narrow swamp, known
as the Panhandle, that has developed along a fault trending NW-SE (Gumbricht et al.,
2001), before spreading out into a series of permanent and seasonally flooded swamps.
Although the catchment for the Okavango Delta is sourced in the tropics, the ―delta‖ is
located in the semi-arid environment of the Middle Kalahari region (sensu Passarge,
1904; Fig. 1a). At over 25,000 km2, the Okavango Delta is one of the world’s largest
alluvial fans and has been characterized as a losimean, or, low sinuosity-meandering fan
(Stainstreet and McCarthy, 1993). Topographic relief across the fan is very low, with
gradients averaging only 1:3550 (Gumbricht et al., 2001).
Local precipitation also contributes an average of 6140 million m3 yr
-1 of water to
the Okavango Delta (McCarthy et al., 1998). Rainfall and river flow in the Okavango
Delta maintains about 4,000 km2
of permanent swamps and up to 12,000 km2
of seasonal
swamps (McCarthy et al., 2002). Water from the catchment along with local flow carries
~209,000 tonnes of sediment, of which approximately 77% is bedload material
(McCarthy et al., 2002). Total dissolved solids entering the Okavango Delta contribute
another 450,000 tonnes of material, but, only ~30,000 tonnes leave as outflow (McCarthy
and Metcalfe, 1990). In contrast, almost no sediment leaves the Okavango Delta and
~96% of inflow to the delta is lost to evapotranspiration, while the remainder leaves as

4
surface or groundwater flow (Dincer et al., 1979). Due to the exceedingly high
evapotranspiration rates across the Okavango Delta, sodium salts, such as trona,
accumulate on the fan surface (McCarthy et al., 1986; McCarthy and Metcalfe, 1990).
Calcium carbonate and silica are the most abundant chemical sediments accumulating on
the fan each year, and, chemical sedimentation results in 250,000 tonnes of accumulation
compared to ~40,000 tonnes of clastic materials (McCarthy and Metcalfe, 1990).
2.3 The Mababe Depression
The Mababe Depression is a heart-shaped feature that lies at the distal end of the
Okavango Delta (~18º S to 19º S, 24º E to 24º30’ E), and is ~90 x 50 km at its’ widest
dimensions (Fig. 1a). Inflow to the Mababe Depression occurs where the Khwai River
joins the channel of the Thamalakane River to form the Mababe River at the southern end
of the depression, which supplies water to the Mababe Swamp (Fig. 1b). Along the
northwestern margin, flow from the Okavango Delta moves east through the Selinda
Spillway before joining flow from the Kwando-Linyanti River and flow down the Savuti
channel into the Mababe Depression, where it terminates in the Savuti Swamp (Fig. 1b).
Inflow from the Savuti, however, is infrequent at present (Shaw, 1988), but, greater
volumes of water once flowed through the channel, as it is presently an underfit channel
(Shaw, 1985). Rivers in the northeast, such as the Ngwezumba, Kashaba, and Gautumbi
can also provide water to the Mababe Depression during times of high local rainfall (Fig.
1b).
The Magikwe Ridge, on the western side of the basin, is a remnant shoreline
feature located to the southeast of the Linyanti Fault. Bounding Mababe to the southeast
is the northeast-southwest striking Thamalakane Fault. Scholz et al. (1976) noted that the
south-eastern edge of the depression is nearly linear along the strike of this fault and
suggested that the Mababe Depression is fault-bound. The Thamalakane Fault serves as a
link between the Mababe Depression and Lake Ngami, located to the southwest. Low
gradient channels that flow alongside the Thamalakane Fault can connect Lake Mababe
and Lake Ngami during times of high lake levels. Another sub-basin connected to
Mababe and Ngami is the Makgadikgadi Pans towards the southeast, which is linked by
the Boteti River to the Thamalakane River.
2.4 Paleo-lacustrine System
2.4.1 Lake Makgadikgadi Stage
Evidence that the Mababe, Ngami, and Makgadikgadi subbasins were once
connected is apparent via a series of beach ridges seen along each basin at 945 m above
sea level that suggest the coalescence of these basins during the Quaternary (Grove,
1969; Grey and Cooke, 1977; Shaw, 1985; Shaw, 1988). Beach ridges, or shoreline
features that are relict wave or wind-built ridges (Otvos, 2000), at the 945 m level
represent the formation of Paleo-lake Makgadikgadi. Geomorphological evidence from
beach ridges indicate that this lake-stage would have encompassed an area of ~60,000
km2 (Grey and Cooke, 1977) but, possibly as much as 120,000 km
2 (Thomas and Shaw,

5
1991). Based on 14
C dating the Makgadikgadi stage was last present at ~40,000 to
35,000 BP, but may be as older than 52,000 BP (Cooke and Verstappen, 1984).
2.4.2 Lake Thamalakane Stage
Lake Thamalakane (Shaw, 1988) is identified by a series of shoreline features
around the Mababe and Ngami basins at 936 m elevation, which is indicative of the
coalescence of the two lakes around the Thamalakane axis (Shaw and Cooke, 1986).
Burrough and Thomas (2008) document the existence of Lake Thamalakane using OSL
dating methods. Shaw et al. (1988) postulated that outflow along the Boteti River may
have resulted in a lake level of 920 m in the Makgadikgadi basin that coincided with the
936 m stage inferred in Mababe Depression and Lake Ngami. Estimates on the size of
Lake Thamalakane based on SRTM data suggest a total surface area of ~32,000 km2
(White and Eckardt, 2006).
At least two periods of this lake level are identified by Shaw (1985) based on 14
C
dates of pedogenic calcretes which date the events from 17,000 to 12,000 BP and ~2,000
BP with episodes of low lake levels up to 932 m at 6,000 BP. Burrough and Thomas
(2008) identified other possible Thamalakane stages between ~38,000 to 35,000 BP in
the Mababe Depression that correspond to the formation of the Dautsa Ridge in Lake
Ngami between 38,000 and 30,000 BP (Burrough et al., 2007). Another Thamalakane
stage occurred as a transgressive ridge building episode between ~8,000 to 5,000 BP and
can be observed on the western shorelines of the Mababe Depression (Burrough and
Thomas, 2008).
2.5 Tectonic Setting
The Mababe Depression is situated within the Okavango Rift Zone (ORZ), which
locally extends from the Gomare Fault in the Panhandle area to the Kunyere and
Thamalakane Faults that mark the SE boundary of the rift (Modisi, 2000; Fig. 1a). The
ORZ is at the terminus of the southwestern branch of the East African Rift System
(EARS) and represents a segment of the rift system that formed in the Quaternary
(Modisi et al., 2000; Kinabo et al., 2007). The northeast-southwest trending
southwestern branch, however, is considerably younger than the eastern and western
branches of the EARS system, which are >15 Ma and <15 Ma years, respectively
(Kampunzu et al., 1998).
Tectonic activity observed from Lake Tanganyika to central Botswana led to the
interpretation by Fairhead and Girdler (1969) that the area was part of an incipient rift
zone. Scholz et al. (1976) noted that the Okavango Delta was situated in a 150 km wide,
possibly asymmetric graben, which is believed to be a foundation of a developing
continental rift (Scholz and Contreras, 1998). While other works have examined graben
development in the area (e.g. Modisi, 2000) it is unclear what stage of development the
ORZ is in. Kinabo et al. (2007) postulate that the area is part of a synformal depression
to early half-graben stage, but, McCarthy et al. (2002) suggest that the area is a
depression formed by uparching and upthrow along northeast-striking faults and not an
incipient rift graben.

6
Figure 1 a) Map showing the Okavango, Kwando, and Zambezi River systems. Insert A shows the
study area in more detail in Figure 1b) Map of the of the Mababe Depression. Sample locations MabX
and Mab6 are shown (Modified from Burrough and Thomas, 2008).
b)
a)

7
CHAPTER III
METHODS
3.1 Field Work
3.1.1 Sample Collection
Samples were collected from two trenches, MabX (19ºS, 06’19.8‖, 24ºE,
05’04.8‖) and Mab6 (19ºS 07’42.2‖, 24ºE 03’28.6‖), located in the southwest portion of
the Mababe Depression, near the terminus of the Mababe River (Fig. 1b). Trenches were
constructed by an excavator. Sediments observed on the walls of the trenches were
described prior to sampling. MabX was sampled every five centimeters to a depth of 5.6
m, aside from intervals 545 and 555, which were not collected due to sampling
difficulties. Mab6 was sampled every 20 cm to a depth of 4.4 m. Sediment from each
sampled interval was stored in a plastic bag and transported to the laboratory, where 50 g
of sample was crushed with a mortar and pestle and stored in scintillation vials.
During sample collection five intervals were selected for OSL (Optically
Stimulated Luminescence) dating. Four samples from MabX at 45 cm, 135 cm, 380 cm,
and 500 cm-depth, respectively, were collected as boulder-sized samples. These samples
were then protected from exposure to sunlight by wrapping the samples in layers of
aluminum foil, and were then returned to the lab for dating.
3.1.2 Lithologic Description
Sediments from both MabX and Mab6 consist mainly of silty diatomites,
diatomaceous clayey-silts, clayey-silts, and organic-rich sediments. Clay layers, silts
with clay clasts, clayey-silty diatomites, clayey diatomites, sands, sandy clay silts, and
silty diatomites also occur in MabX (see Appendix A1). Layers observed from 560-240
cm appear cyclic in nature with the exception of 375 cm to 335 cm-depth. Below 485 cm
in MabX the lithology is dominated by sandy-clay silts from 560 cm to 530 cm and 505
cm to 485 cm. Silty diatomites are present in the section from 530 cm to 520 cm.
Diatomite layers dominate the section from 485 cm to 375 cm-depth, but show variability
in color that includes light-brown, light-gray, white, light-tan, and white-gray diatomites.
A clayey-silt layer is present from 370 cm to 350 cm-depth and is overlain by a 15 cm-
thick sand layer. Diatomaceous layers occur again from 335 cm to 240 cm. Clayey-silty
diatomite is present from 335 cm to 320 cm and is overlain by 20 cm of diatomaceous
clayey silt that is interbedded with 5 cm of brown diatomite. At 300 cm to 240 cm-depth

8
light-tan and white-gray diatomites are observed in the section, except for a 5 cm-thick
clayey-silt at 245 cm.
Diatomite layers are noticeably absent above 240 cm, except for a 15 cm-thick
interval of light-brown gray diatomite overlain by a light-brown diatomite from 145 cm
to 120 cm-depth. Lithologies above 240 cm are non-cyclic in nature and are dominated
by diatomaceous clayey-silts, silts with clay clasts, and organic-rich sediments.
Diatomaceous clayey-silt occurs from 240 cm to 195 cm-depth and is overlain by a silt
with clay clasts, with clasts increasing upwards in abundance, from 195 cm to 155 cm-
depth. A clay lens 10 cm-thick overlies the silt with clay clasts and is overlain by
diatomite layers from 145 cm to 120 cm-depth. Another diatomaceous clayey-silt is
present at 120 cm to 110 cm-depth and is overlain by a 35 cm-thick clayey silt. Capping
the section is an interval of organic-rich sediments. At 75 cm to 50 cm-depth is an
organic-rich silt, followed by an organic-rich clayey-silt to 25 cm-depth. Within the top
25 cm is another organic-rich silt layer.
3.2 Sample Analyses
3.2.1 Magnetic Susceptibility
Variable concentrations of magnetizeable materials such as ferromagnetic,
paramagnetic, and diamagnetic minerals present in sediments affect the strength of
magnetism in a given sample (Ellwood et al., 2004). Magnetic susceptibility (MS) is a
technique used to determine the concentration of magnetizeable materials in a sample.
High frequency magnetic susceptibility (Xhf) was measured for each sample collected
from the MabX and Mab6 trenches using a Bartington MS2 magnetic susceptibility meter
with an MS2B dual frequency sensor. MS values were measured on approximately 10 g
samples and reported in terms of mass, due to the ease and efficiency in obtaining high
precision measurements by this method (Ellwood et al., 2008)
3.2.2 Particle Size Analysis
Particle size analysis was performed using laser defractometry on a Cilas1180
particle size analyzer with a detection range of 0.04 to 2500 µm. Approximately 100 ml
of deionized water was added to ~10 g of uncrushed sample and dish detergent was used
as a dispersal agent. Samples were kept undisturbed for 24 hours before being mixed by
a magnetic stirrer and introduced to the Cilas1180 by pipette analysis. Target
obscurations of 15-20% were obtained for all samples. Each sample was run for 120 s
with ultrasonics to break up any agglomerates (Sperazza et al., 2004). Samples were then
measured five times, without ultrasonics, and analyzed using the Fraunhofer theory.
Grain size distribution statistics were calculated according to the method of Folk and
Ward (1957).
3.2.3 Inorganic Carbon and Organic Carbon Analysis
Total inorganic carbon (TIC) and total organic carbon (TOC) concentrations were
determined using a CM5014 Coulometer equipped with a CM5130 Acidification Module
9
and a CM5300 Furnace Module. For TIC analysis, a pre-weighed sample was reacted
with 2N H2SO4 to release CO2, which was titrated electronically. Total carbon (TC) was
determined by combusting a pre-weighed sample in the furnace module at 950˚C. TOC
was calculated by the difference between TC and TIC values.
3.2.4 Metal Analysis
Approximately 100 mg of sample were dissolved using aqua regia (3:1 mixture of
HCl:HNO3) in a microwave digestion unit. Dissolution in aqua regia is a widely used
method that can yield recoveries of metals in sediments that range from 89 to 110%
(Sastre et al., 2002). Microwave-assisted digestion was performed using a MarsXpress
microwave oven. After digestion, samples were evaporated and reconstituted with 20 ml
of 2% HNO3 three times. After the final evaporation and reconstitution, the samples
were cooled and filtered through a 45 m Whatman filter into acid pre-washed
polyethylene bottles and diluted to a total volume of about 60 ml with 2% HNO3. Metals
were measured using a PerkinElmer Optima 2100DV inductively coupled plasma optical
emission spectrometer (ICP-OES).
3.2.5 X-ray Diffractometry
Two samples from MabX (265 cm and 305 cm) and two samples from Mab6 (200
cm and 320 cm) were selected for bulk mineralogy runs on a Philips PW 1830 X-ray
diffractometer (XRD) equipped with a Cu radiation source. Samples were powdered
and run from 5-40˚ at 2 per minute. Subsequently, clays were extracted according to the
methods of Kittrick and Hope (1963). Extracted samples were then run from 2-30° at
2 per minute to determine clay mineralogy.
3.2.6 Optically Stimulated Luminescence (OSL) Dating
After samples were collected in the field they were returned to the Radiation
Dosimetry Laboratory at Oklahoma State University for processing. Samples were
sieved and treated with HCl and H2O2 to remove carbonates and organic matter,
respectively, before a 50-minute treatment with HF to remove the outer portion of the
grains that were affected by radiation. Sediments were then retreated with HCl and
quartz grains were separated. Water content of the samples was determined based on the
weight difference between the wet and dried sample. Water content for all the samples
ranged from 1% to 3% but, an average water content of 10% was assumed for the
samples because they were deposited in a lacustrine environment. Following this,
samples were stored in air-tight containers for four weeks before Th, U, and K
concentrations were measured according to the conversion factors of Adamiec and
Aitken (1998).
The natural equivalent dose (De) is determined by comparison of the natural
luminescence signal with the one obtained from the response of samples to a known
radiation exposure in the laboratory. The intensity of the luminescence signal is
proportional to that of the radiation dose and is reported in units of Gray (Gy).
Measurements were conducted using a Risø TL/OSL-DA-15 reader, Risø National

10
Laboratory, with a bialkali PM tube (Thorn EMI 9635QB) and Hoya U-340 filters (290-
370 nm) with a built-in 90
Sr/90
Y beta source. Blue LEDs (470 nm) were used for optical
stimulation.
The dose rate of the samples that is attributed to cosmic radiation is dependent on
the geographical location of the sample site (19ºS, 24ºE, 930 m asl) and was calculated
according to the methods of Prescott and Stephan (1982) and Barbouti and Rastin (1983).
A final age was then determined based on the equivalent dose divided by the dose rate.
Equivalent dose, dose rate, and determined age are reported in Table 1.
Table 1: Results of Optically Stimulated Luminescence Dating
Sample Dose1
Dose Rate2
Age3
(Gy) (Gy/ka) (ka)
MabX 45 21.6 ± 1.3 1.847 ± 0.087 11.70 ± 0.90 MabX 135 35.9 ± 2.0 1.332 ± 0.061 27.0 ± 2.0 MabX 380 60.7 ± 2.6 1.469 ± 0.070 41.3 ± 2.7 MabX 500 147.3 ± 7.7 2.27 ± 0.12 64.8 ± 4.7 1Equivalent Dose
2Dose Rate
3Age in thousands of year
11
CHAPTER IV
RESULTS
Zones are defined for the sedimentary section based on multi-proxy data sets to
delineate events that are significant in altering sediment type and relative grain size
distribution of paleo-lake Mababe. Zones are determined based on changes in trends of
the percent silt and clay content (Fig. 2) and Xhf (Fig. 3) , assuming, the variations could
be attributed to processes that control lake water levels. Sorting and skewness (Fig. 2) of
the samples, as well as carbonate and organic matter content (Fig. 3) were used to further
identify the zones. After zones were identified, metal results (Figs. 4-7) were used to
support the established zones and provide further insight on processes affecting
sedimentation in the Mababe Depression.
4.1 Zone I: 560-485 cm
Zone I consists of a 30 cm-thick sandy clay silt layer at the base, which is overlain
by 5 cm-thick layers of silty diatomite and clayey diatomite, followed by a 15 cm-thick
clayey silt. The upper 20 cm of this zone is marked by another sandy clay silt layer.
Sediments in the basal sandy clay silt average 4% sand in the lower part of the layer
before increasing to 10% near the top, and, then decreasing to 3% at the top of the layer.
Sand content in the diatomaceous and the clayey silt layers is less than 0.5%. Within the
sandy clay silt layer at the top of the zone, sand increases to 12% before declining to 4%
at the top of the zone. In the basal sandy clay layer, silt remains nearly constant while
clay content decreases from 19% to 14% near the top of the unit, due to increase sand
content. The clay content remains at ~15% in the silty diatomite layer. Within the clayey
diatomite, however, clay increases to 22%, and then to 26% at the base of the clayey silt
unit but varies from 18-20% throughout the upper sand clay silt layer. The decrease in
silt and clay in the upper sandy clay silt layer corresponds to increase in sand to about
10%.
Sediments in Zone I are poorly sorted, although to slightly different degrees in each
layer, with an average SD value of 1.6 within the basal sandy clay silt layer and a lower
SD of 1.5 within the diatomaceous and clayey silt layers, but the upper sandy clay silt
layer is the most poorly sorted The skewness of sediments is also highly variable
throughout this zone. The basal sandy clay silt is coarsely-skewed to finely-skewed
while the diatomaceous and clayey silt layers vary between finely and very finely-
skewed and the upper sandy clay silt is near-symmetrical.

12
Fig
ure
2:
Pa
rtic
le s
ize a
na
lysi
s re
sult
s giv
en
as
perc
en
t sa
nd
, silt,
an
d c
lay
, a
lon
g w
ith
gra
in s
ort
ing a
nd
sk
ew
ness
, co
mp
are
d to
th
e li
tho
logic
secti
on
.
IIIIII
IV
Episode

13
Fig
ure
3:
Hig
h f
req
uen
cy
ma
gn
eti
c s
usc
ep
tib
ilit
y,
ca
rbo
na
te, a
nd
org
an
ic m
att
er re
sult
s co
mp
are
d to
th
e
lith
olo
gic
secti
on
.
IIIIII
IV
Episode

14
Xhf values in the basal sandy clay silt (~7x10⁻⁸
m3/kg) decrease slightly in the silty
diatomite layer and increase markedly within the clayey diatomite to a maximum value of
1.2x10⁻⁷
m3/kg in the clayey silt layer. The Xhf decreases again to ~7x10
-8 m
3/kg in the
upper sandy clay silt layer. Carbonate content is generally low (<0.1%) and remains low
in the zone except for slight increase to 0.4% in the base of the clayey silt layer. This
increase in carbonate corresponds to the highest Xhf values and Al and Fe content in the
clayey silt layer. The organic matter content is low and nearly constant at 0.1%
throughout the zone.
4.2 Zone II: 485-375 cm
Zone II consists of 110 cm of diatomaceous layers that display subtle variations in
color. Light-brown diatomite marks the basal 10 cm of the zone and is overlain by a 15
cm-thick light-gray diatomite, followed by a 35 cm interval of white diatomite, and a 25
cm-thick light-tan diatomite. The upper layer of this unit is a 15 cm-thick white-gray
diatomaceous bed. Sand accumulation in Zone II sediments is < 0.1%, and, no
measureable sand is recorded within the white diatomite. Silt content, however, shows a
pronounced increase from ~75% to 90% and clay decreases from 25% to only 10% from
the base of the zone to the top of the light-gray diatomite. Silt averages of 86-87% in the
white diatomite and the overlying light tan diatomite. Clay averages 10-14% across the
white diatomite layer until the base of the light-tan diatomite layer, where clay steadily
increases to over 14%. At 435 cm-depth, in the white diatomite layer, clay increases to
14% and silt decreases to 86%. The white-gray diatomite that marks the top of the unit
has a silt content of 92% and a markedly lower clay content of ~7.5%.
Within the zone, sediments are poorly sorted and average 1.25 Φ throughout the
light-gray, white, and white-gray diatomite layers. Poorer sorting is observed in the light-
brown and light-tan diatomites with averages of 1.6 Φ and 1.5 Φ, respectively. Skewness
also changes from finely-skewed in the light brown diatomite to very finely-skewed
across the light-gray diatomite. Sediments trend toward finely-skewed within the lower
white diatomite, before becoming increasingly very finely-skewed within the rest of the
layer. Another trend toward very finely-skewed occurs in the light-tan diatomite, before
trending toward finely-skewed sediments in the upper light-tan and white-gray diatomites
at the top of the zone.
Xhf values peak at 8x10⁻⁸
(m3/kg) at the base of the section in the light brown
diatomite and decline to 4x10⁻⁸
(m3/kg) at the top of the light-gray diatomite. Xhf values
in the white diatomite average 5.5x10⁻⁸
(m3/kg). In the light-tan diatomite, Xhf increases
again to highs of 8x10⁻⁸
(m3/kg) before declining to < 3.5x10
-8 (m
3/kg) in the white-gray
diatomite layer, where it remains nearly constant. Carbonate and organic matter maintain
average values of 0.1% and 0.3%, respectively, throughout this zone. At 390 cm-depth,
however, carbonate spikes to > 3%, which coincides with an increase in organic matter to
~0.4%.
4.3 Zone III: 375-280cm
Zone III consists of a 20 cm-thick clayey silt overlain by 15 cm of sand.
Diatomaceous sediments overly the sand and include a clayey-silty diatomite for 15 cm,

15
overlain by a diatomaceous clayey silt that contains a 5 cm-thick interbed of brown
diatomite, that caps the zone. The basal clayey silt has sand values of < 0.5% that
increase to 4% upward in the bed, and silt values average 80%. Almost 50% sand is
obtained at the base of the sand layer, which then decreases to ~2% at the top of the layer.
As sand content increases across the layer, both silt and clay decrease proportionally,
with silt decreasing to 42% and clay decreases to ~10%. The top of the sand unit marks
a transition into a clayey-silty diatomite layer that contains negligible sand content and
silt and clay values that average 81% and 19%, throughout the upper diatomite layers.
Most units within the zone are poorly sorted and have an average SD of ~1.5 Φ,
however, the sandiest interval is very poorly sorted (SD=2.1 Φ). Grains are finely-
skewed throughout the clayey silt but are very finely-skewed within the sand before
becoming near-symmetric within the upper sand. Sediments that border between finely-
skewed and very finely-skewed occur within the clayey-silty diatomite, before becoming
finely-skewed throughout the rest of the zone.
Within Zone III, distinct patterns in Xhf values that range from 8.5x10⁻⁸
(m3/kg) to
6x10⁻⁸
(m3/kg) observed in the clayey silt. Xhf values ranges from 2x10
-8 (m
3/kg) at the
base of the sand layer to over 8x10⁻⁸
(m3/kg) at the top of the layer. Steady Xhf values
occur throughout the clayey-silty diatomite layer, with an average of 7.5x10⁻⁸
(m3/kg).
Increasing Xhf is seen within the bottom portion of the diatomaceous clayey silt, but, the
brown diatomite interval marks the beginning of a decrease from 1x10⁻⁷
(m3/kg) to
7.5x10⁻⁸
(m3/kg) throughout the remainder of the zone. Organic matter is nearly constant
at ~0.4% in the silty-clay layer, and displays subtle increases to 0.3% and 0.4% within
the sand and overlying diatomite layers. Carbonate values remain low (< 0.1%) until the
clayey-silty diatomite layer, when values increase to ~0.3%.
4.4 Zone IV: 280-240 cm
Zone IV consists of a light-tan diatomite layer 20 cm-thick, followed by a 40 cm-
thick white diatomite layer with a 5 cm-thick clayey silt layer interbedded at 245 cm.
The base of the light-tan diatomite represents a sand accumulation of ~4%, but, sand is
< 0.3% across the remainder of the zone. Silt increases from 80% at the base of the light-
tan diatomite to 86% at the top of the layer. Clay decreases from 15% at the base of this
bed to 10% at the top of the layer, followed by a continuous increase to ~20%, except for
in the clayey silt layer where clay decreases to ~17%.
Poor sorting occurs throughout this zone. Sorting at the base of the zone averages
~1.75 Φ but, becomes more poorly sorted throughout the light-tan diatomite, before
increasing to the top of the zone. In the lower light-tan diatomite, basal portions of the
overlying white diatomite, and the upper 10 cm of the zone, sediments are finely-skewed,
but become very finely-skewed from 270 to 250 cm, with the exception of the finely-
skewed interval at 260 cm.
Magnetic susceptibility increases slightly within the light-tan diatomite from
5.75x10⁻⁸
to 7 x10⁻⁸
(m3/kg) before decreasing across the bottom 20 cm of the white
diatomite from 5.5x10⁻⁸
to 3.5x10⁻⁸
(m3/kg). Zone IV is characterized in large part by
increasing carbonate values. Carbonate values increase from the base of the zone to
3.5%, except for the clayey silt layer that declines 1.3%. Organic matter in this zone

16
increases continually to 0.5% between the white diatomite layer and the top of the zone,
with a spike of 1.5% at 265 cm.
4.5 Zone V: 240-195 cm
A diatomaceous clayey-silt layer 45 cm-thick comprises Zone V. No significant
variation in sand (0.1%) is observed in the unit. Silt content averages 76% and, clay
24%, for the bottom 30 cm of the layer before silt steadily increases to 78% and clay
decreases to 21%. The bottom of the zone is poorly sorted with a SD of 1.45 Φ that
increases to 1.55 Φ in the upper portion of the zone. Sediments are finely-skewed
throughout the zone but, show better sorting across the bottom 25 cm of the zone and
become increasingly finely-skewed in the upper portion of the zone.
Xhf steadily decreases across the entire zone from 8.5x10⁻⁸
(m3/kg) to 6x10
-8
(m3/kg). Carbonate values decrease from 3.5% at the contact with Zone IV and remain
negligible until an increase to 1% occurs from 215 to 205 cm, before declining again.
Organic matter steadily increases to ~0.5% across the zone.
4.6 Zone VI: 195-145 cm
Zone VI contains two layers, a silt with clay clasts, where the clasts become
increasingly abundant upward in the layer. The silt layer comprises 35 cm of the zone
and a clay lens that is 10 cm-thick caps the zone. Less than 0.2% sand is observed in the
lower silty layer, and no measureable sand occurs in the clay lens. Silt content steadily
decreases from 80% to 69% across the silty layer, while clay increases steadily from 20%
to 30%. Within the clay lens, silt decreases to 62% and clay increases to 36%. SD
averages 1.5 Φ in this poorly sorted zone. Sediments are finely-skewed across the base
of the zone and become near-symmetrical at the top of the clay layer.
Xhf is 5.5x10⁻⁸
(m3/kg) within the basal 5 cm of the silty layer and increases to an
average of 7x10⁻⁸
(m3/kg) in the lower silt layer and clay layer. Within the upper silt
layer, where clay clasts comprise a higher percentage of the sediment, a slight decline in
the Xhf occurs with an average of 6x10⁻⁸
(m3/kg). Carbonate values maintain background
levels throughout the zone. Organic matter, however, shows a continuously increasing
trend upwards in the zone with values of 0.2% at the base to 1% at the top of the zone.
4.7 Zone VII: 145-75 cm
Zone VII is marked by a light brown-gray diatomite at the base, overlain by a 10
cm-thick light brown diatomite, a 10 cm diatomaceous clayey silt layer, and a 25 cm-
thick clayey silt bed that tops the zone. The base of the light brown diatomite contains a
2% sand interval that declines to an average of ~0.1% throughout the layer and overlying
diatomaceous clayey silt layers before spiking again to 2% within the lower clayey silt.
Initially, silt content increases in the light brown-gray diatomite as clay decreases, but,
throughout the remainder of the zone, silt decreases continuously from 83% to 62% and
clay increases from 15-36%.
Zone VII is poorly sorted throughout, but, shows slightly better sorting
throughout the diatomaceous layers (SD=1.2 to 1.5 Φ) and becomes increasingly poorly

17
sorted (SD= 1.7-1.4 Φ) throughout the clayey silt. Grains are finely-skewed in much of
the diatomaceous layers and border between near-symmetrical and finely-skewed
throughout most of the clayey-silt and light-brown diatomite layers, except from 90 to 85
cm-depth where grains are finely-skewed.
Xhf drops to 4x10⁻⁸
(m3/kg), from values seen in the underlying zone, at the base
of the diatomite in this zone and averages 5.5x10⁻⁸
(m3/kg) across the remainder of the
diatomite layers. Within the diatomaceous clayey silt Xhf decreases to ~7.5x10⁻⁸
(m3/kg)
while the lower clayey silt averages 5.75x10⁻⁸
(m3/kg), but increases to 8.0x10
-8 (m
3/kg)
in the upper clayey silt layer. Carbonate values maintain background levels of ~0.2%
throughout the zone. Shifts in organic matter, however, are discernable. These shifts
include an increase to ~0.6% from the base of the zone to 100 cm-depth and a decrease in
organic matter in the upper 20 cm of the zone, where values range from 1.1% to 0.8%.
An anomalous spike of 1.25% is seen at 105 cm, which corresponds to the sand spike
seen in the clayey silt.
4.8 Zone VIII: 75-0 cm
The top portion of the section is comprised of organic-rich sediments; however,
three variations within the zone can be identified. At the base of the zone to 50 cm-depth
is an organic-rich silt layer with relatively constant silt and clay contents that average
64% and 36%, respectively. Overlying this layer is an organic-rich clayey silt from 45-
25 cm that contains a lower silt (57.5%) and higher clay (42.5%) content, and has no
measureable amount of sand. The upper 20 cm of the zone is comprised of an organic-
rich silt which exhibits a slight increase in silt (60-65%) and sand content (~0.1%), with a
decrease in clay values from 39% to 36%, upwards. At 10 cm-depth, the interval
contains 2% sand, highest in the zone, as well as the highest silt content (68%) and lowest
amount of clay (30%).
Sediments in Zone VIII are poorly sorted throughout, however, the lower organic-
rich silt trends toward increasingly poor sorting, whereas the overlying organic-rich
clayey silt trends toward better sorting, upward. Sorting remains constant within the
upper layer, except for at 10 cm, where sorting is slightly better. Within this zone, all
units are near-symmetrical. Skewness within the lower silty layer remains constant, as
does the clayey-silt, however, this layer borders on coarsely-skewed. In the upper silt,
however, a trend toward finely-skewed exists.
Relatively stable Xhf values of ~7.5x10⁻⁸
(m3/kg) are seen throughout Zone VIII,
except for a decrease to 6x10⁻⁸
(m3/kg) at 10 cm-depth. Carbonate remains at
background levels (0.1%) and organic matter increases continuously from 1% to 1.5%
towards the top of the zone. Organic matter spikes at 10 cm to over 2.5%, the highest
value seen at the MabX location.
4.9 Metals
The presence of the eight zones is supported by the early transition metals Al, V,
Cr, Mn, and Fe (Fig. 4). In zone I, Al, V, Cr, Mn, and Fe metal concentrations vary
below 525 cm but, these metals show decreasing concentrations from 525 cm to the top
of the zone. In the lower portion of Zone II Al, V, Cr, and Fe decrease overall before

18
Fig
ure
4:
Gra
ph
s o
f tr
an
siti
on
meta
l co
ncen
tra
tio
ns
for A
lum
inu
m,
Va
na
diu
m, C
hro
miu
m, M
an
ga
nese
, an
d I
ron
co
ncen
tra
tio
ns
co
mp
are
d to
the li
tho
logic
secti
on
. A
l a
nd
Fe a
re r
ep
ort
ed
in
weig
ht
perc
en
t (%
), a
ll o
thers
rep
ort
ed
in
pp
m.
IIIIII
IV
Episode
19
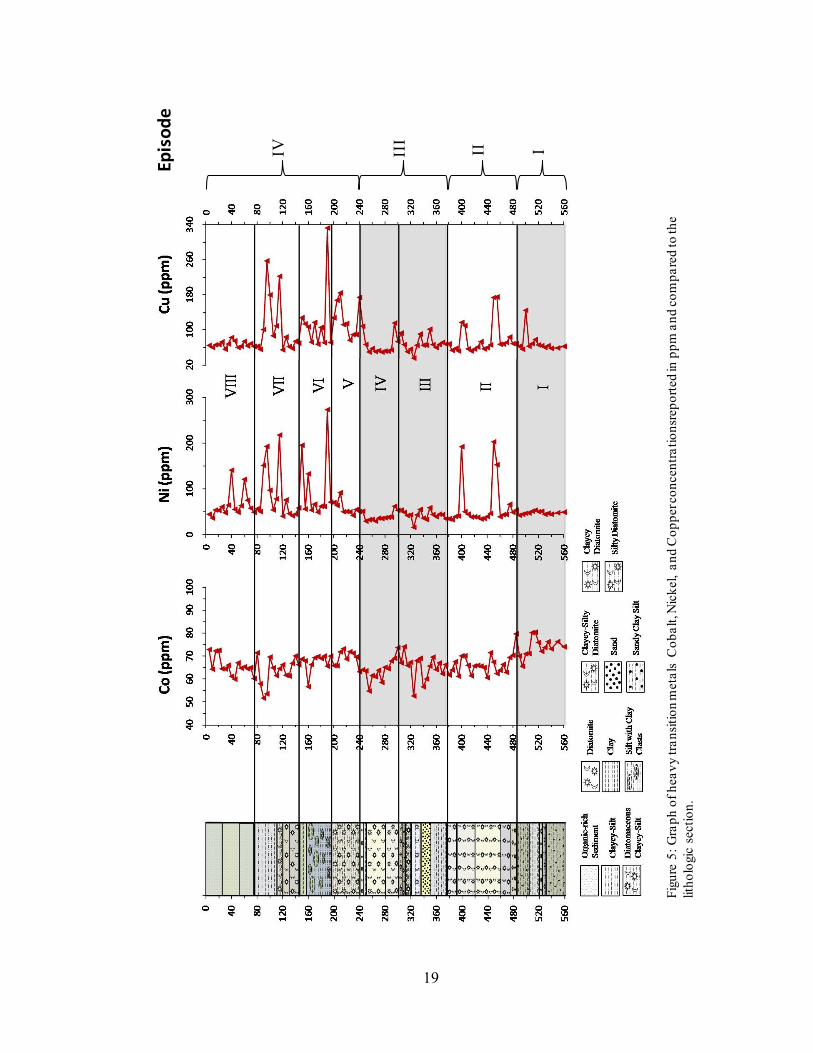
Fig
ure
5:
Gra
ph
of
hea
vy
tra
nsi
tio
n m
eta
ls C
ob
alt
, Nic
kel, a
nd
Co
pp
er c
on
cen
tra
tio
nsr
ep
ort
ed
in p
pm
an
d c
om
pa
red
to
th
e
lith
olo
gic
secti
on
.
IIIIII
IV
Episode

20
Fig
ure
6:
Gra
ph
s o
f L
ith
ium
, P
ota
ssiu
m, R
ub
idiu
m, a
nd
Ma
gn
esi
um
co
ncen
tra
tio
ns
rep
ort
ed
in p
pm
an
d c
om
pa
red
to
th
e li
tho
logic
secti
on
.
IIIIII
IV
Episode

21
Fig
ure
7:
Gra
ph
s o
f co
ncen
tra
tio
ns
for
Cesi
um
, C
alc
ium
, S
tro
nti
um
, a
nd
Ba
riu
m.
All m
eta
ls rep
ort
ed
in
pp
mex
cep
t C
a g
iven
in
weig
ht
perc
en
t (%
).
IIIIII
IV
Episode

22
increasing with a peak at ~405 cm-depth followed by decreses in the top 15 cm of the
zone. Steady increases in Mn concentration, however, occur before a large peak in
concentration at 390 cm-depth, which is consistent with an increase in carbonate (Fig. 3).
Early transition metals in Figure 6 are relatively constant in the basal 20 cm of Zone III
before showing a marked decrease to some of the lowest values in the section within the
sand layer. Throughout the remainder of Zone III, these metals increase in concentration,
except for a marked decrease in V and Cr observed at 325 cm-depth. Al, V, Cr, and Fe
gradually decrease across the Zone IV diatomite layers, while Mn increases in this zone.
Above 240 cm-depth, Al, V, Cr, and Fe show more subtle changes in
concentration than below 240 cm and, these metals systematically shift toward higher
average concentrations above 240 cm. In Zone V, Al, V, and Cr concentrations tend to
fluctuate around average concentrations, while a decrease in Fe and an increase in Mn
occur at 205 cm-depth. A concentration spike in Mn at 205 cm-depth is consistent with
the occurrence of carbonate (Fig. 3). In Zone VI, the early transition metals decrease at
195 cm-depth and subsequently increase to average values before decreasing again at 160
cm-depth. Above 160 cm-depth, these metals increase in concentration throughout the
remainder of the zone. Al, V, Cr, Mn, and Fe concentrations increase overall throughout
Zone VII while, Al, V, and Cr decrease from 100 cm to 85 cm-depth. Within Zone VIII,
Al increases overall and Mn maintains nearly constant values. Shifts in the concentration
of V and Cr, however, occur in Zone VIII that coincide with the organic-rich sediment
layers (Fig. 3). A decrease in all early transition metals is observed at 10 cm-depth.
Transition metals Co, Ni, and Cu (Fig. 5) define a unique boundary at 240 cm-
depth where concentrations of each metal shifts to higher values above 240 cm than those
observed below 240 cm. This boundary event is also present in Li, K, Rb, and Mg
concentrations (Fig. 6). Above 240 cm Li concentrations decrease to averages that are
among the lowest in the section. Concentrations of K above show an overall increasing
trend throughout the section but, shift toward even higher concentrations above 240 cm-
depth. Decreasing trends in Rb concentration occur from 560 cm to 240 cm-depth before
shifting to higher concentrations above 240 cm-depth. Below 240 cm, Mg concentrations
increase but, above 240 cm-depth, Mg has a decreasing trend. Consistent with the the
boundary event at 240 cm-depth observed in other metal data sets, Cs, Ca, Sr, and Ba
concentrations (Fig. 7) increase considerably from 265 cm to 240 cm-depth, but remain
relatively constant throughout the rest of the section.

23
CHAPTER V
DISCUSSION
Multi-proxy data sets collected in this study can be used to determine the effects
of local and regional climatic influence, as well as provide insight as to how the effects of
faulting associated with the ORZ can be observed in the lake sediment record. Grain size
analysis of sediments within the lake basin is the primary tool used to delineate whether
or not sediments being deposited are of local or distal origin. Local sediments supplied
by channels such as the Ngwezumba and Gautumbi Rivers (Fig. 1b), as well as from
nearby dune fields and beach ridges, for instance, will have a larger average grain size
and higher sand content than sediments originating from distal sources such as the
Angolan highlands. Allocthonous sediments from Angolan highlands are altered by the
fractionating effects of the Okavango Delta swamp and, therefore, will contain higher
percentages of silt and clay-sized material, and little, if any, sand-sized sediment by the
time the sediments reach Mababe. Additionally, the lithology of the sediment section and
the thickness of each of the lithologies can be used to distinguish periods dominated by
local and regional sedimentation. The influence of a local climate would result in the
occurrence of sand-sized sediments and the appearance of lithologies such as sandy-clay
silts, whereas the effects of a regional climate would be manifest in the lake record as
clay.
5.1 Tectonics and Lake Sedimentation
5.1.1 Evidence of Tectonism
A major change in the trends of the multi-proxy data is observed at 240 cm-depth.
Marked differences in the sedimentation patterns above and below 240 cm are reflected
in the relative sand, silt, and clay content and distribution (Fig. 2), as well as the
magnitude and variations of the magnetic susceptibility values (Fig. 3). Alkali metals
(Li, K, Rb, Be, and Mg) also show major shifts in concentration and distribution patterns
above and below 240 cm (Fig. 6). Between 240 and 260 cm, the boundary is
characterized by anomalously high carbonate content (Fig. 3) and high concentrations of
Cs, Ca, Sr, and Ba (Fig. 7). These changes in the sedimentological and geochemical
properties above and below 240 cm reflect variations in allochtonous sediment sources
and their relative contribution to the lake sedimentary budget. Allochtonous sediments
from local sources supplied to the depression are transported by ephemeral rivers with
watersheds in the Kalahari basin (e.g., Burrough and Thomas, 2008). Additionally,

24
sediments can be brought into the depression from the Angolan highlands via the present
day Okavango River, and in the past by the Kwando and Zambezi Rivers (e.g., Shaw,
1985; McCarthy and Metcalfe, 1990; Burrough and Thomas, 2008).
There are fundamental differences in the sediment characteristics and
geochemistry of sediments derived locally within the Kalahari basin and those from the
upper watershed of the Okavango, Kwando, and Zambezi Rivers. Local sediments from
the Kalahari basin consist mainly of aeolian quartz sands and soils rich in calcrete and
silcrete (Shaw et al., 2003; Ringrose et al., 2005). Mean grain size of dunefield
sediments in the Kalahari range from 2.2 Φ to 3.0 Φ (Cooke, 1980), while the beach
ridges around the Mababe Depression range from 0.28 mm to 0.18 mm (1.84 Φ to 2.47
Φ) (Burrough and Thomas, 2008) and averaged 2.6 Φ where sampled along the Magikwe
Ridge (Cooke, 1980). Typically the beach ridges near Mababe consist of greater than
90% sand, with silt and clays making up the difference (Burrough and Thomas, 2008;
Burrough and Thomas, 2009). Silcretes and calcretes, however, can form as a result of
pedogenic and non-pedogenic processes occurring from the semi arid climate of Kalahari
basin (McCarthy and Metcalfe, 1990; Nash et al., 1994; Nash and McLaren, 2003;
Ringrose et al., 2005).
Sediments derived from the upper watershed of the Okavango, Kwando and
Zambezi Rivers are produced by the weathering of bedrock in a tropical climate. These
sediment properties can be further modified by processes occurring in swamps before
reaching the Mababe Depression. Modern sediments transported by the Okavango River
at Mohembo, located at the tip of the Panhandle represent sediments that have not been
significantly altered by transport through the swamps of the Okavango Delta. Sediments
arriving at Mohembo can therefore be used to infer the characteristics and geochemistry
of sediments derived from the upper watersheds of the Okavango and Kwando Rivers in
the Angolan highlands.
Extensive swamps of the Okavango Delta can modify sediment distribution by
causing preferential loss of the sand-sized fraction as water velocity decreases (McCarthy
and Metcalfe, 1990). Sediment size distributions measured near the Panhandle are
markedly different than those observed more distally in the delta. Grain size near
Mohembo, for example, ranges from 0.2 mm to 0.4 mm (2.3 Φ to 1.3 Φ) (McCarthy et
al., 1991). Sediments located near in the permanent swamp area along the
Khiandiandavhu channel, however, averaged ~0.19 mm (2.4 Φ) (McCarthy and Metcalfe,
1990). Approximately 90% of the sand-sized material is deposited when entering the
panhandle region of the Delta (McCarthy and Metcalfe, 1990). Thus, given the
modifying effect of the Okavango Delta swamps on sediments transported beyond
Mohembo, it can be inferred that the presence of the Linyanti Swamp along the Kwando
River, near Mababe, will impact sedimentation in a similar manner by varying the
physical and geochemical characteristics of sediments transported from the Angolan
highlands.
Sediment grain size distributions indicate that deposition of sand below 240 cm-
depth is prominent in the sedimentary record and accounts for up to ~10% of the
sediments deposited in various layers below 480 cm-depth (Fig. 2). A significant layer of
~45% sand occurs at 345 cm-depth with an average grain size of 0.062 mm for the layer.
Overall, sediments located at and below 240 cm-depth have an average grain size of
0.017 mm (6.4 Φ). Occurrences of sand above 240 cm are not as significant and average

25
only ~2% of sediments where sand accumulations are observed (Fig. 2). Sediments
above the 240 cm boundary have an average grain size of only 0.01 mm (7.07 Φ) and
show a shift towards a finer grain size overall. This suggests that during the time interval
above 240 cm, sedimentation was likely dominated by fine-grained allochtonous
sediments from the Angolan highlands, compared to locally derived coarser sands.
Alternatively, the influx of local sediments into the depression could have declined due to
decreased fluvial transport resulting from a locally drier climate.
Differences in the sediment type and geochemistry above and below 240 cm, such
as the increased abundance of sediments from the Angolan highlands above 240 cm-
depth, suggests a fundamental shift in the source and supply of sediment. An increase in
the relative volume of water and sediment load from the Angolan highlands would cause
sediments from the Angolan watershed to dominate the lake record at Mababe. Such a
shift in the relative proportion of sediments derived from local versus distal sources
above and below 240 cm would require a major reorganization of the hydrology of
northwestern Botswana.
Reorganization of the hydrology is hypothesized to have changed the proportion
of water and sediments from a local source to a system that was dominated by water and
sediments transported from the Angolan highlands. Hydrologic reorganization is also
hypothesized to affect the residence time of water in the depression. For example, if
water were to pool in the Mababe Depression for long periods of time, it could explain
the gradual changes in the sedimentary and geochemical characteristics of sediments
above 240 cm, such as the steady accumulation of clay-sized material and more
systematic shifts in metal concentrations. In comparison, below 240 cm rapid changes
occurred during the deposition of sand-sized sediments. Changes observed in the
sediment properties above and below 240 cm require that rivers that supplied water and
sediments to the Mababe Depression undergo a fundamental change in hydrology, a shift
that is attributed to tectonic processes (Huntsman-Mapila et al., 2005).
5.1.2 Tectonic Alteration of Hydrology and Sedimentation
Tectonic processes in the ORZ have caused the geomorphologic form of the delta
and the surrounding region to evolve over time, which altered the regional hydrologic
system. Presently, topographic evidence suggests two main inlets for rivers flowing from
the Angolan highlands into the Mababe depression (Fig. 1b). In the northwest, the Savuti
River transports water from the Kwando River through the Savuti swamps and the
Tsatsara gap, while in the south, the Mababe River carries water from the Khwai and
Thamalakane Rivers, sourced from the Okavango River (Fig. 1b). Given the present day
topographic configuration of the Okavango Delta and its’ surroundings, lake levels in the
Mababe Depression would be controlled by the elevation of the inlets in the northwest
and southern portions of the depression.
Lake levels in the Mababe Depression that result from inflow along the Mababe
River, at the southern end of the basin, would be controlled by the elevation of the Savuti
inlets (~927 m), since lake levels exceeding this elevation would drain through the Savuti
channel in the northwest (Fig. 1b). Also, lake levels are controlled by topographic
thresholds along the Thamalakane River at 936 m and at 940 m in the channel of the
Boteti River that flows into the Makgadikgadi Pans (Gumbricht et al., 2001). Because of

26
these topographic thresholds, lake levels rising above 936 m would flood most of the
lower delta and inundate Lake Ngami and the Mababe Depression along the
Thamalakane axis, resulting in the formation of Paleolake Thamalakane (Shaw, 1988).
Post-tectonic topographic controls influence how water and sediment reach the Mababe
Depression.
5.1.2.1 Sedimentation Pre-240 cm-depth
Sedimentation below 240 cm requires a different tectonic configuration and
hydrologic regime from that above 240 cm. In order for local sediments to dominate
sedimentation below 240 cm, lower volumes of river water supplied from the Angolan
highlands are required. In the absence of the present day topographic configuration and
control on sedimentation in the depression, sedimentation patterns suggest that higher
frequency lake level fluctuations occurred below 240 cm. Accumulation of coarse-
grained material below 240 cm, and in particular below 485 cm, could represent the
influence of a locally wet climate. Lake levels inferred from sediments between 240 cm
and 485 cm-depth were sufficiently deep to support the growth and deposition of diatoms
(Fig. 2). Therefore, this time period could be the result of a wet climate in Angola, as
well as locally, that would have sustained river flow and maintained a deep lake within
the Mababe Depression.
5.1.2.2 Sedimentation Post-240 cm-depth
An important aspect in the history of the Mababe Depression is the tilting of the
basin, that likely occurred during the tectonic events that reorganized the hydrology of
the region. Tilting of the basin led to its’ present-day configuration that has resulted in
variations in elevation north to south along the 936 m ridge (Gumbricht et al., 2001). In
the absence of a tilted basin, topographic thresholds controlling lake levels in the Mababe
Depression would have been different and would have allowed the lake to retain larger
volumes of water before outflow would have occurred. Tectonic and hydrologic changes
altered how the Mababe Depression was filled with water and also affected sedimentation
patterns above 240 cm. Sedimentation appears to have occurred uninterrupted in the
basin (below 240 cm) until faulting diverted the Kwando River away from the
depression. Okavango Delta sedimentation beginning ~40 ka (Ringrose et al., 2008),
may have led to the development of distributary channels that characterize the modern
delta configuration. Development of the Okavango Delta led to new landscape
conditions that controlled water and sedimentation in the Mababe Depression.
The sedimention record from the Mababe Depression suggests a timing for the
movement along the Linyanti Fault and is marked by the significant change observed at
240 cm-depth in the multi-proxy data sets. Sedimentation above 240 cm-depth occurred
after faulting along the Linyanti diverted river inflow away from the Mababe Depression
and the Okavango Delta formed, thereby, creating a new hydrologic regime in the area.
Grain size distribution of sediments above 240 cm show predominantly silt and clay-
sized fractions (Fig. 2) and have a distinct sediment sorting signature and geochemistry
that is consistent with the lithologic and chemical fractionation of sediments by marshes
in the Okavango and Linyanti deltas. These characteristics indicate that sediments

27
dominating deposition above 240 cm were sourced primarily from the Angolan
highlands.
5.2 Paleoenvironmental History
Climate change can also affect sediment supply and water levels in the Mababe
Depression, and the resulting shifts in sediment properties and geochemistry will be
superimposed on the record of tectonic processes. The Okavango Delta and lakes in this
region are unique in that they can be affected directly by local climate, as well as
indirectly by the climate changes in the Angolan highlands. When the timing of local wet
periods coincide with that in the Angolan highlands, it may be difficult to separate these
events in the sedimentary record. However, when the local climate is dry and the climate
in the Angolan highlands is wet, the dry local climate may be recorded by a decrease in
local autochthonous sediments in the sedimentary. Sedimentation in the Mababe
Depression and other lakes within the region provide a record of both local and regional
climate change (Huntsman-Mapila et al., 2005; Burrough and Thomas, 2008; Burrough et
al., 2009).
Four major episodes in the history of sedimentation in Paleolake Mababe, thought
to represent different climatic conditions, are defined based on grain size distribution,
magnetic susceptibility, and geochemical data. These episodes represent sedimentation
in the Mababe Depression when lake levels rose above 923 m, the approximate elevation
of the sampling site in this study. The sediment depths that define each spidode are
shown to the right of Figures 2-7. Episodes I and II, which encompass Zones I and II,
respectively, represent sedimentation below 240 cm, before movement along the Linyanti
and Thamalakane Faults caused a reconfiguration in the regional hydrology. Episode III,
which encompasses Zones III and IV, occurs below 240 cm encompasses the period in
which tectonic activities changed the hydrological system. Episode IV, comprised of
Zones V, VI, VII, and VIII, occurs under the new hydrologic and tectonic regime and
consists of sedimentation above 240 cm.
5.2.1 Episode I (560-485 cm) >65 ka
Episode I is older than 65 ka and encompasses a period in which local climate and
the climate in the Angolan headwaters alternately affected sedimentation within the
Mababe Depression. Locally wet climatic events are expressed in the sedimentary record
as higher influxes of sand-sized sediments and, overall, higher contributions to
sedimentation during this episode (Fig. 2). Prior to tectonic activity, that diverted flow of
the Kwando River to the Zambezi River, the entire discharge of the Kwando River likely
flowed into the Mababe Depression via the inlet of the now underfit Savuti channel and
the Tsatsara gap (Grove, 1969; Shaw, 1985). Sedimentation from the Angolan highlands
deposited by the Kwando River, however, was likely characterized by higher silt and clay
content consistent with higher magnetic susceptibility values (Fig. 3) than those observed
in the sandy intervals derived locally.
Lake levels were probably shallow during this episode, as evidenced by rare
accumulations of diatoms. Furthermore, the absence of diatom accumulations may
indicate the lack of a stable water body in the lake over long time periods. Alternatively,

28
lake water chemistry was not conducive for diatom growth. The physical properties of
the sediments in conjunction with the evidence that lake levels were stable for relatively
short periods of time, may indicate that the climate in the Angolan highlands was
relatively dry, but, that periodic wet periods occurred within the local climate throughout
this interval. Deposition of sediments during the locally wet climate would have masked
a dry climate signal in Angola throughout the episode. Overall, sedimentation during
Episode I is consistent with a regionally arid climate (Burrough et al., 2009).
5.2.2 Episode II (485-375 cm) ~65 ka to 41 ka
Episode II ranges from ~65 ka to about 41 ka and is characterized entirely by
diatomite layers (Fig. 2). Lake levels were likely sufficiently deep to support diatom
growth throughout this time period. Therefore, this interval represents a period in which
the climate in the Angolan highlands was wet and able to sustain flow to the Mababe
Depression. A distal source of sedimentation for this interval is supported by elevated
lake levels over the duration of this event. The predominance of diatomite suggests that
lake levels were stable above the 924 m elevation for prolonged periods to promote
diatom productivity that ultimately generated an ~1 m-thick layer of diatomite. In order
to promote the growth and accumulation of extensive diatomite layers, water supplied to
the basin must have been high in nutrients and high productivity resulted in excellent
preservation of diatoms.
Sediments in this episode as a whole are moderately sorted and very-finely
skewed, which are inferred to be characteristics of unfractionated sediments from the
Angolan highlands. This is in addition to an overall increase in silt content, indicative of
a distal sediment source. A wet climate in the Kwando River headwaters in the Angolan
highlands would have been required to sustain lake levels over this ~24,000 year time
period. Modeling based on present day evaporation and river discharge rates suggest that
the Kwando/Chobe River is capable of providing enough water to maintain a lake of
~2,000 km2
in size, which is sufficient to sustain lacustrine conditions in the Mababe
depression (Grove, 1969 and references therein). Therefore, in order for the Kwando
River to have been the source of sustained water during this time, this episode must have
occurred prior to tectonic events that diverted the Kwando River away from the Mababe
Depression along the Linyanti Fault.
Although precipitation from a locally wet climate could contribute to the higher
lake levels, it is not obvious from the sedimentary evidence in that such a situation
occurred for the entire episode. The absence of a predominance of sand that would
characterize a local sediment supply can be explained, however, if sand transport to the
lake occurred when lake levels were high and the sand was deposited at the mouths of the
rivers to form deltas. It is likely then that any sand expected to accompany locally wet
climatic conditions was deposited in deltas at the mouths of the Ngwezumba and
Gautumbi Rivers (Burrough and Thomas, 2008).
Local climate likely influenced sedimentation during the top 15 cm of Episode II
where a significant shift in sedimentation patterns, such as the increase in silt and
decrease in clay (Fig. 2) that occur, in conjunction with a decrease in magnetic
susceptibility values (Fig. 3). Despite the fact that this interval has the highest silt
content in this episode, there is no significant increase in sand (< 1%). Sediments

29
supplied to the depression that have a low magnetic susceptibility and a decreased
abundance of transition metals (Figs. 3 and 4) are interpreted to represent sediments
brought in from the local environment and, thus, suggest a wet local climate for this
event. Prior to this locally wet climate, a period of drought likely occurred that resulted
in evaporation of the lake, increased salinity, and led to the precipitation of carbonate just
below the upper diatomite layer (Fig. 3). Carbonate in this interval is likely due to intra-
lake processes because concentrations of Ca increased and concentrations of Cs, Sr and
Ba that should accompany pedogenic carbonate formation are low (Fig. 7).
5.2.3 Episode III (375-240 cm) 41 ka to < 27 ka
Episode III occurs between 41 ka and < 27 ka, however, no age constraints for the
upper boundary are available. This episode represents a period with high variability in
local and regional climate. Lake sedimentation over this interval is characterized by an
overall shift towards increasing silt and decreasing clay content, variable sorting, and a
shift towards finely-skewed grains (Fig. 2). Sediments at the beginning of this episode
indicate a local source from a locally wet climate, which is expressed as an increase in
sand content with better sorting and skewness. Continuously increasing silt content,
however, reflects greater sediment delivery from the Angolan highlands over time and a
continuously increasing lake level can be inferred from the overall increase in silt
towards the top of this episode. Diatomite-silt mixed sediments followed by
predominantly diatomite layers suggests that lake conditions, which initially fluctuated
perhaps due to variability in the local climate, became more stable. Stable water levels
occurred in the Mababe Depression over long periods of time in order to accumulate
thick layers of diatomaceous material.
This episode is marked by a prominent occurrence of carbonate at its terminus
(Fig. 3), which can be correlated with a carbonate layer in Lake Ngami (Huntsman-
Mapila et al., 2005). Occurrence of the carbonate layer in both lakes, separated by ~275
km, indicates an event of regional magnitude. The carbonate layer in Lake Ngami is
dated at ~40 ka, a period when the region was covered by an extensive body of water
referred to as Lake Makgadikgadi (Grove, 1969), which had an elevation of 945 m at its
highest level and occupied an area of ~60,000 km2
(Cooke, 1980) to 80,000 km2 (Mallick
et al., 1981). Lake Makgadikgadi encompassed an area that included the current
Makgadikgadi pans, a large portion of the current delta, Lake Ngami, the Mababe
Depression and, extends into the Chobe-Zambezi River Valley and Caprivi Strip in the
Zambezi area (Grove, 1969; Shaw and Thomas, 1988), although the Zambezi area is not
considered in the size estimates (Thomas and Shaw, 1991).
The origin of these extensive carbonates throughout the lakes during this episode
is not clear. Two possible sources of the carbonate include the erosion of local calcretes,
or, authigenic precipitation within the lake itself. It is hypothesized that the carbonates
are local in origin and were derived from erosion of local calcretes. Formed during a
previously dry period, these calcretes could have been eroded by local rains and
deposited within the lake basins. This is consistent with a locally wet climate that
contributed to the formation of Lake Makgadikgadi (Cooke and Verhagen, 1977; Shaw
and Cooke, 1986). However, there is also a lack of local sands during this time that
would have been an integral part of the sediment record, and is inconsistent with the

30
hypothesis of extensive erosion required to deposit the calcretes. Alternatively,
formation of the carbonates within the lake would require evaporation to achieve
carbonate saturation, as observed in other lakes of the Kalahari region during dry periods
(Thomas et al., 2003). In such a scenario, there should be a regionally equivalent
carbonate layer present in soils in non-lake basins that should correlate with those
observed in Lake Ngami (Huntsman-Mapila et al., 2005) and the Mababe Depression.
Because of the paucity of sedimentary geochemical data, further research is needed to
verify or refute calcrete erosion or in-situ precipitation as the source of the carbonates.
Lake Makgadikgadi at a 945 m elevation would not have been constrained by
topography given that it is believed to have been both a locally and regionally wet
climate. Constraints to the lake level would have been a mechanism for draining such an
extensive lake. An outlet hypothesized to have drained the lake was through tectonic
controls to the north of the Mababe Depression, which likely would have drained the lake
into the Zambezi River via the Kwando/Chobe River (Grey and Cooke, 1977).
Alternatively, the waters of the lake could have evaporated over time.
5.2.4 Episode IV (240-0 cm) < 41 ka
Episode IV has no age-constraint at its’ lower boundary, but was dated at 135 cm-
depth at 27 ka. This episode is controlled primarily by climate variations in the Angolan
highlands and is represented by sediments from 240 cm-depth to the surface. The
sediments above 240 cm-depth are attributed to the Lake Makgadikgadi stage and suggest
a different hydrologic regime could have been initiated by local or regional tectonics.
Reactivation of the rift faults would have altered the region in two main ways: 1) cutoff
of the Kwando River as a regular source filling the Mababe depression by diversion of
the Kwando River via faulting to form the Linyanti-Chobe River, which served as a
drainage pathway into the Zambezi River and 2) the impoundment of the Okavango
River and initiation of the formation and development of the delta to its current form.
The end of Episode III was due to a tectonic interplay that created a new hydrologic
regime in the region and altered sedimentation and geochemistry patterns observed in
Mababe depression sediments above 240 cm-depth.
Water brought into the Mababe Depression from the Angolan highlands during
this Episode was likely a result of inflow from the Okavango River because tectonic
activities had previously diverted the Kwando River, the main source of water to the
Mababe Depression, to the Zambezi River. Even though the Okavango River became the
new regular source of water to the Mababe depression, after the Kwando River was
diverted, a topographic control (knob) at 936 m elevation along the Thamalakane River
caused flow into the Mababe depression to occur only during regionally wet and
extremely wet local periods. River water flowed into the Mababe Depression via the
Khwai River to sustain marsh-like conditions. The elevation to which the lake levels
could rise during local wet periods was restricted by the elevation at the inlet of the
Savuti channel which can serve as an outlet, except during regional flooding events.
Assuming no erosion of sediments has occurred in the depression, there is no
evidence of waning from Lake Makgadikgadi at the 945 m level to completely dry
conditions (Fig. 2). Instead, the sediment record shows an abrupt change in sediment
characteristics and geochemistry, which remained nearly constant for a prolonged time

31
(~240 to 195 cm). The lack of a characteristic decrease in clay associated with a
desiccation event is not observed in this zone. Grey and Cooke (1977) hypothesized that
reactivation of the Linyanti fault, which diverted the Kwando River through the Linyanti-
Chobe River to the Zambezi River, could have provided an outlet for draining Lake
Makgadikgadi. The sediment record suggests that if Lake Makgadikgadi was being
drained in this manner, it would leave evidence in the sediment record of drainage in the
form of constant sediment type.
The first occurrence of sediments in this episode are those of Zone V. This period
is marked by a relatively stable lake levels sourced from the Angolan highlands, as
evidenced by the lack of sand accumulation. Clay and silt levels also remain fairly
constant throughout the zone, indicating the source of sediments remained constant.
Prior to the end of this zone, a layer containing carbonate of similar nature to that
observed in Episode III occurs, but its origin also remains unclear.
Following stable lake conditions, a decline in lake levels is marked by an increase
in clay content from ~18% to 38% throughout Zone VI. Organic matter also increases
throughout the zone and represents the encroachment of aquatic and wetland vegetation
at the sample site as lake levels declined. A brief period of local climate influence occurs
at 165 cm-depth, resulting in a small increase in sand content (Fig. 2).
Lake levels rise again between Zone VI and VII. This rise in lake levels is
evidenced by the return of diatomite and diatomaceous clayey-silt layers at the base of
Zone VII that overlie clay-rich beds in Zone VI. The early part of Zone VII is
characterized by a sharp increase in silt and decrease in clay. This is coupled with a
decrease in organic matter at the base of the zone that may represent deeper water
conditions that do not support aquatic plants at the sample site. Rising lake levels of this
interval were likely the result of increased water supply from the Angolan highlands,
coupled with an increase of sediments from a wetter local climate, as indicated by higher
sand sedimentation that exceeds 2%. An age constraint of ~27 ka is given during this wet
interval at 135 cm-depth.
Throughout the remainder of Zone VII lake levels begin to decline but a shallow
lake level is maintained by a periodic supply of water into the lake. Overall, clay content
increases and silt decreases, although fluctuations occur throughout Zone VII (Fig. 2).
While the sediment geochemistry and organic matter content show fluctuations, few
changes in metal concentrations occur (Figs. 2, 3, 4, 5, 6, and 7). These fluctuations in
the sediment and sediment geochemistry support a shallow lake that periodically receives
water. During low lake levels organic matter concentrations increase as marsh-like
conditions prompted vegetation growth in the lake basin.
Within the organic-rich sediment layers of Zone VIII one age date of 11.7 ka is
available at 45 cm-depth. Marsh-like conditions likely dominated the zone, as evidenced
by the higher levels of organic matter. Alternatively, increases in organic matter may be
the result of increased inflow from the Okavango River bringing in organic matter.
Higher lake levels likely occurred during this zone when shifts occurred in the clay
content. At 10 cm-depth, a brief lake highstand occurs that is evidenced by a drop in clay
and Xhf and an increase in organic matter as more water is brought into the lake. This
event is consistent with a wetter local climate, as evidenced by the increase in sand.
When lake levels decline, as in Zone VI and VII, changes in sedimentation and
chemical sedimentation patterns can be observed. Figure 8 depicts the desiccation of the

32
Figure 8: A conceptual model for the draining of Lake Mababe where a) is a full lake
b) drying lake with swamp formation c) lake margins are dry and further swamp
development d) only the sump and inlets contain water e) the sump has become swampland
and only inlets contain water f) inlets are swamps and lake is otherwise dry and, g) total
desiccation of Lake Mababe
b)
a)
f)
g)
e)
c)
d)
Lake
Swamp

33
lake in the Mababe Depression and how changes in lake levels will affect sedimentation
at the sample location. As lake levels decline, as in Figure 8b and 8c, vegetation will
begin to invade the sample site and promote aquatic and wetland vegetation growth. As
marsh conditions move close to the sump, as depicted in Figure 8d and 8e, more
terrestrial plant growth will occur at the sample site. Currently the Mababe Depression is
represented by Figure 8f, where only the swamps retain water.
5.3 Paleoclimate
Periods of elevated lake levels in the Mababe Depression with available age-
constraints can be correlated to lake highstand events in the Makgadikgadi and Ngami
basins. A regional paleo-shoreline research program utilizing OSL dating techniques
establishes a chronology of lake highstand events over the last 300 ka for Lake
Makgadikgadi (Burrough et al., 2009), Lake Ngami (Burrough et al., 2007), and the
Mababe Depression (Burrough and Thomas, 2008). The work of Burrough and Thomas
(2008) established lake highstand events in the Mababe Depression over the last ~40 ka
based on beach ridges, while this study, based on sediment samples, extends the paleo-
lake record to > 64 ka. Comparisons made with data from lake highstands is qualitative
in nature given that beach ridges preserve only the most recent lake highstands.
Additionally, processes responsible for the formation of ridges occur over a much shorter
time span compared to the duration of high lake levels.
Based on the limited OSL dates available from this study, the ages of lake
highstand events of regional extent (Burrough et al., 2009), and those reported in the
Mababe Depression (Burrough and Thomas, 2008) appear to occur in close proximity to
the deposition of sediments with high clay content, such as clayey-silt layers and clay
layers (Fig. 2). Clay-rich sediments representing high lake levels near the end of Episode
I (520-505 cm) were deposited around 64.8 ka. This age is close to that of a lake
highstand determined in the Makgadikgadi basin at ~64 ka (Burrough et al., 2009) and
Lake Ngami around 59 ka (Burrough and Thomas, 2008). A 20 cm-thick silty-clay layer
occurs at the beginning of Episode III (~375 cm depth) that may represent higher lake
levels. Sedimentation during this lake highstand occurred ~41 ka, based on an age
obtained in the underlying diatomite layer. It is reasonable to suggest that high lake
levels that occurred during this interval may correspond to lake highstands determined in
the Makgadikgadi basin at 39 ka (Burrough et al., 2009), however, equivalent lake
highstands are not reported for Lake Ngami during this period. Hunstman-Mapilla et al.
(2005) describe sediments in Lake Ngami ~40 ka, but provide no clear indication if this
represented high lake levels that correspond to lake highstands.
During Episode IV, an age of 27 ka was determined from a diatomite layer at 135
cm-depth. This diatomite layer is located above clay-rich layers and suggests that high
lake levels occurred prior to 27 ka. This age is also consistent with lake highstands
observed in the Makgadikgadi basin ~27 ka (Burrough et al., 2009). This age also post-
dates a sharp decrease in clay content between Zones VI and VII that represents an
increase in lake levels within the Mababe Depression. Sand accumulations occur above
and below the boundary between the declining lake-stage in Zone VI and the high lake
levels that mark the onset of Zone VII. These sands are representative of sediments
derived during a wet local climate and may correspond to a wet local climate observed in

34
Drotsky’s Cave ~29 ka (Cooke and Verhagen, 1977; Shaw and Cooke, 1986). Although
age dates are not available in Zone VI, the interval is believed to represent a lake
desiccation event that may correspond to a drier climate associated with periods of dune
building documented by O’Connor and Thomas (1999) from 32 ka to 28 ka and by
Thomas et al., (2000) from 36 ka to 39 ka. Despite the fact that the lake highstand record
for the Mababe Depression extends over 40 ka, beach ridges are not reported by
Burrough and Thomas (2008) or in the Makgadikgadi basin by Burrough et al (2009)
between 32 ka and 28 ka. Lake highstands were identified in Lake Ngami by Burrough
et al. (2007) between 32 ka and 30 ka, however, Huntsman-Mapila et al. (2006) do not
provide descriptions that indicate a high lake level for this time period. A clay layer is
observed at 245 cm-depth that may also represent high lake levels in the Mababe
Depression that occurred between 41 ka and 27 ka and, may be equivalent to lake
highstands reported by Burrough et al. (2007) for Lake Ngami about 38 ka.
A clay-rich sediment layer is observed from 100 cm to 75 cm-depth that is younger
than 27 ka and older than ~12 ka, an age that was determined at 40 cm-depth. Lake
highstands ranging between 17 ka and 12 ka are reported for the Makgadikgadi basin, the
Mababe depression, and Lake Ngami (Burrough et al., 2009; Burrough and Thomas,
2008; Burrough et al., 2007). Huntsman-Mapila et al. (2006) describe a locally wet phase
that sustained lake levels in Lake Ngami around this period as well. The last clay-rich
layer observed in the sediment section occurs from 45 cm to 25 cm-depth and is younger
than ~12 ka. Burrough et al. (2009) and Burrough and Thomas (2008) report a lake
highstand in Lake Ngami at ~9 ka and Huntsman-Mapila et al. (2006) also report
increasing lake levels around 4 ka in Lake Ngami.
Attempts to reconcile high lake levels with lake highstands suggest that although
the events could not be directly correlated, the number of occurrences of high lake levels
that produced preserved beach ridges appear consistent. It is important to note, however,
that if clay layers are a record of high lake levels, not all clay layers will correspond to
beach ridges because beach riges are susceptible to being reworked by subsequent
highstands. Processes that produce beach ridges relative to high lake levels operate on
different time scales, and, thus, may account for the discrepancies between the ages of the
beach ridges compared to recorded ages of the high lake levels.

35
CHAPTER VI
CONCLUSIONS
Mutli-proxy data collected from the Mababe Depression preserves a record of
climate change and tectonic controls that affected the Middle Kalahari environment over
the last > 64 ka. A major change in sedimentation occurs at 240 cm-depth at the sample
site that records a different series of climatic and tectonic controls affecting
sedimentation above and below this boundary. Events that can be discerned in the
sedimentary record of Lake Mababe include:
1) Sedimentation influenced mainly by the local climate during a period of relatively
dry conditions in the catchment area of Angola occurred from 560-485 cm-depth,
until ~64 ka.
2) This episode was followed by relatively stable lacustrine conditions until ~41 ka.
Lake levels were maintained largely by the influx of water and sediment from the
Kwando River during a wet climatic period in Angola. Local climatic influence
was minimal during this period, as evidence by the low levels of sand
accumulation throughout the interval.
3) Following the stable lacustrine conditions, lake levels were affected by the input
of multiple sources from the local and regional environment. This time period
corresponds to the Lake Makgadikgadi stage identified in the area. During this
same interval, from 375-240 cm, tectonic movement diverted the Kwando River
away from the Mababe Depression and the present-day Okavango Delta began
forming. These events permanently altered the hydrologic regime of the area and
affected how sediments and water were transported to Lake Mababe.
4) Sedimentation above 240 cm reflects a post-tectonic period and the onset of new
hydrologic controls and sedimentation patterns within the depression. Without a
sustained river source flowing into Lake Mababe, river levels were controlled
primarily by input from the Okavango River during wet climatic periods in
Angola. The highest lake levels observed during this interval may reflect events
that correspond to Lake Thamalakane stages observed elsewhere in the region.

36
CHAPTER VII
FUTURE WORK
Although this study has enhanced the existing record for paleo-lake Mababe, and,
in doing so, has provided additional information on the climate and tectonic setting of the
region over the last >64 ka, further research needs to be conducted. Studies focused on
understanding the species of diatoms found in the lake record, as well as the paleosalinity
of the lake could only enhance the current understanding of paleo-lake levels. These
types of studies may provide a more-detailed understanding of lake fluctuations as they
relate to the paleo-climate of the region, and may also indicate whether changes in lake
levels were basin specific. Additional studies on sediments from within the lake that
include stable isotope data, C:N ratios, and nutrient status may confirm whether declining
lake levels discussed in this work in fact resulted in an observable shift in the type of
vegetation at the sample location and paleoproductivity indicated by diatoms.
Sediments also need to be collected from elsewhere in the basin, such as near the
Savuti and Ngwezumba inlets, as well as within the sump, in order to provide additional
locations for correlation of lake events. These locations will provide a clearer
understanding of the history of Lake Mababe. Additional locations would also indicate
whether or not the sample location creates a bias in the sediments and, therefore, the
interpretation of lake levels and the paleoclimate of the region. A sample interval of 5
cm, and not to exceed 10 cm, is recommended in similar studies within the Mababe
Depression because a larger sample interval will by-pass rapid changes known to occur
within the lake and would make correlations increasingly difficult.
In an effort to extricate the source of sediments being supplied to the Mababe
Depression, it is imperative that samples be collected from the Okavango, Kwando, and
Zambezi Rivers. Analyzing the grain size, particularly in the Kwando and Zambezi
Rivers where this information is lacking, as well as metal concentration and water
chemistry of sediments supplied by these rivers may indicate unique markers that can
identify sediments being supplied to the Mababe Depression from individual rivers.

37
REFERENCES
Adamiec, G. and Aitken, M.J., 1998, Dose-rate conversion factors: update: Ancient TL,
v. 16, p. 37-50.
Barbouti, A. and Rastin, B., 1983, A Study of the Absolute Intensity of Muons at Sea
Level and under Various Thicknesses of Absorber: Journal of Physics G-Nuclear
and Particle Physics, v. 9, 1577-1595.
Brook, G.A., Marais, E., Srivastava, P., Jordan, T., 2007, Timing of lake-level changes in
Etosha Pan, Namibia, since the middle Holocene from OSL ages of relict
shorelines in the Okondeka region: Quaternary International, v. 175, p. 29–40.
Burrough, S.L., and Thomas, D.S.G., 2008, Late Quaternary lake-level fluctuations in the
Mababe Depression: Middle Kalahari palaeolakes and the role of Zambezi
inflows: Quaternary Research, v. 69, p. 388-403.
Burrough, S.L., and Thomas, D.S.G., 2009, Geomorphological contributions to
palaeolimnology on the African continent: Geomorphology, v. 103, p. 285-298.
Burrough, S.L., Thomas, D.S.G., Shaw, P.A., and Bailey, R.M., 2007, Multiphase
quaternary highstands at lake Ngami, Kalahari, northern Botswana:
Palaeogeography Palaeoclimatology Palaeoecology, v. 253, p. 280-299.
Burrough, S.L., Thomas, D.S.G., Bailey, R.M., 2009, Mega-Lake in the Kalahari: A Late
Pleistocene record of the Palaeolake Makgadikgadi system, Quaternary Science
Reviews, v. 28, p. 1392-1411.
Cooke, H.J., 1975, Paleoclimatic Significance of Caves and Adjacent Landforms in
Western Ngamiland, Botwana: Geographical Journal, v. 141, p. 430-444.
Cooke, H.J., 1980, Landform Evolution in the Context of Climatic-Change and Neo-
Tectonism in the Middle Kalahari of North-Central Botswana: Transactions of the
Institute of British Geographers, v. 5, p. 80-99.
Cooke, H.J., Verhagen, B.Th., 1977, The dating of cave development—an example from
Botswana, in Proceedings of the Seventh International Speleological Congress,
Sheffield, UK, p. 122–124.

38
Cooke, H.J., and Verstappen, H.T., 1984, The Landforms of the Western Makgadikgadi
Basin in Northern Botswana, with a Consideration of the Chronology of the
Evolution of Lake Palaeo-Makgadikgadi: Zeitschrift Fur Geomorphologie, v. 28,
p. 1-19.
Dinçer, T., Hutton, L.G. and Kuppe, B.B.J., 1979, Study, using stable isotopes, of flow
distribution, surface-groundwater relations and evapotranspiration in the
Okavango Swamp, Botswana: Vienna, In: Isotope Hydrology 1978, Vol. I. IAEA,
p. 3-26.
Ellwood, B.B., Harrold, F.B., Benoist, S.L., Thacker, P., Otte, M., Bonjean, D., Long,
G.J., Shahin, A.M., Hermann, R.P., and Grandjean, F., 2004, Magnetic
susceptibility applied as an age-depth-climate relative dating technique using
sediments from Scladina Cave, a Late Pleistocene cave site in Belgium: Journal of
Archaeological Science, v. 31, p. 283-293.
Ellwood, B.B., Tomkin, J.H., Ratcliffe, K.T., Wright, M., and Kafafy, A.M., 2008, High-
resolution magnetic susceptibility and geochemistry for the Cenomanian/Turonian
boundary GSSP with correlation to time equivalent core: Palaeogeography
Palaeoclimatology Palaeoecology, v. 261, p. 105-+.
Fairhead, J.D., and Girdler, R.W., 1969, How Far Does Rift System Extend through
Africa: Nature, v. 221, p. 1018-1020.
Folk, R.L., and Ward. W.C., 1957, Brazos River Bar: A Study in the Significance of
Grain Size Parameters: Journal of Sedimentary Petrology, v. 27, p. 3-26.
Grey, D.R.C., and Cooke, H.J., 1977, Some problems in the quaternary evolution of the
landforms in northern Botswana: Catena, v. 4, p. 123-133.
Grove, A.T., 1969, Landforms and Climatic Change in Kalahari and Ngamiland:
Geographical Journal, v. 135, p. 191-212.
Gumbricht, T., McCarthy, T.S., and Merry, C.L., 2001, The topography of the Okavango
Delta, Botswana, and its tectonic and sedimentological implications: South
African Journal of Geology, v. 104, p. 243-264.
Huntsman-Mapila, P., Kampunzu, A.B., Vink, B., and Ringrose, S., 2005, Cryptic
indicators of provenance from the geochemistry of the Okavango Delta
sediments, Botswana: Sedimentary Geology, v. 174, p. 123-148.
Huntsman-Mapila, P., Ringrose, S., Mackay, A.W., Downey, W.S., Modisi, M., Coetzee,
S.H., Tiercelin, J.J., Kampunzu, A.B., and Vanderpost, C., 2006, Use of the
geochemical and biological sedimentary record in establishing palaeo-
environments and climate change in the Lake Ngami basin, NW Botswana:
Quaternary International, v. 148, p. 51-64.

39
Kampunzu, A.B., Bonhomme, M.G., and Kanika, M., 1998, Geochronology of volcanic
rocks and evolution of the Cenozoic Western Branch of the East African Rift
System: Journal of African Earth Sciences, v. 26, p. 441-461.
Kinabo, B.D., Atekwana, E.A., Hogan, J.P., Modisi, M.P., Wheaton, D.D., and
Kampunzu, A.B., 2007, Early structural development of the Okavango rift zone,
NW Botswana: Journal of African Earth Sciences, v. 48, p. 125-136.
Kittrick, J. A., and Hope, E. W., 1963, A Procedure for the Particle-Size Separation of
Soils for X-Ray Diffraction Analysis: Soil Science, v. 96, p. 319-325.
Mallick, D.I.J., Habgood, F., Skinner, A.C., 1981, A geological interpretation of Landsat
imagery and air photography of Botswana: Overseas Geological Mineral
Research, v. 56, p. 1–36.
McCarthy, T.S., and Ellery, W.N., 1998, The Okavango Delta: Transactions of the Royal
Society of South Africa, v. 53, p. 157-182.
McCarthy, T.S., and Metcalfe, J., 1990, Chemical Sedimentation in the Semiarid
Environment of the Okavango Delta, Botswana: Chemical Geology, v. 89, p. 157-
178.
McCarthy, T.S., McIver, J.R., Cairncross, B., 1986, Carbonate accumulation on islands in
the Okavango Delta, Botswana: South African Journal of Science, v. 82, p. 588–
591.
McCarthy, T.S., McIver, J.R., and Verhagen, B.Th., 1991, Groundwater evolution,
chemical sedimentation and carbonate brine formation on an island in the
Okavango Delta swamp, Botswana: Applied Geochemistry, v. 6, p. 577-595.
McCarthy, T.S., Bloem, A., Larkin, P.A., 1998. Observations on the hydrology and
geohydrology of the Okavango Delta. South African Journal of Geology 101,
101–117.
McCarthy, T. S., Smith, N. D.; Ellery, W. N.; Gumbricht, T., 2002, The Okavango Delta-
semiarid alluvial-fan sedimentation related to incipient rifting, in Renaut, R.W.,
and Ashley, G.M., eds., Sedimentation in continental rifts: Special Publication -
Society for Sedimentary Geology (SEPM), v. 73, p. 179-193.
Modisi, M.P., 2000, Fault system at the southeastern boundary of the Okavango Rift,
Botswana: Journal of African Earth Sciences, v. 30, p. 569-578.
Modisi, M.P., Atekwana, A.E., Kampunzu, A.B., Ngwisanyi, T.H., 2000, Rift kinematics
during the incipient stages of continental extension: Evidence from the nascent
Okavango Rift basin, NW Botswana: Geology, v. 28, p. 939-942.

40
Nash, D.J., and McLaren, S.J., 2003, Kalahari valley calcretes: their nature, origins, and
environmental significance: Quaternary International, v. 111, p. 3-22.
Nash, D.J., Thomas, D.S.G., and Shaw, P.A., 1994, Siliceous duricrusts as palaeoclimatic
indicators: evidence from the Kalahari desert of Botswana: Palaeogeography
Palaeoclimatology Palaeoecology, v. 112, p. 279-295.
O'Connor, P.W., and Thomas, D.S.G., 1999, The Timing and Environmental Significance
of Late Quaternary Linear Dune Development in Western Zambia: Quaternary
Research, v. 52, p. 44-55.
Otvos, E.G., 2000, Beach ridges—definitions and significance: Geomorphology, v. 32, p.
83–108.
Passarge, S., 1904, Die Kalahari: Berlin, Dietrich Riemer.
Prescott, J. R. and L. G. Stephan . 1982, The contribution of cosmic radiation to the
environmental dose for thermoluminescence dating: latitude, altitude and depth
dependencies: Journal of the European Study Group on Physical, Chemical and
Mathematical Techniques Applied to Archaeology, v. 6, p. 17–25.
Ringrose, S., Huntsman-Mapila, P., Kampunzu, A.B., Downey, W., Coetzee, S., Vink,
B., Matheson, W., and Vanderpost, C., 2005, Sedimentological and geochemical
evidence for palaeo-environmental change in the Makgadikgadi subbasin, in
relation to the MOZ rift depression, Botswana: Palaeogeography
Palaeoclimatology Palaeoecology, v. 217, p. 265-287.
Ringrose, S., Huntsman-Mapila, P., Downey, W., Downey, W., Coetzee, S., Fey, M.,
Vanderpost, C., Vink, B., Kemosidile, T., Kolokose, D., 2008, Diagenesis in
Okavango fan and adjacent dune deposits with implications for the record of
palaeo-environmental change in Makgadikgadi–Okavango–Zambezi basin,
northern Botswana: Geomorphology, v. 101, p. 544-557.
Sastre, J., Sahuquillo, A., Vidal, M., and Rauret, G., 2002, Determination of Cd, Cu, Pb
and Zn in environmental samples: microwave-assisted total digestion versus aqua
regia and nitric acid extraction: Analytica Chimica Acta, v. 462, p. 59-72.
Scholz, C.H., Contreras, J.C., 1998, Mechanics of continental rift architecture: Geology,
v. 26, p. 967-970.
Scholz, C.H., Koczynski, T.A., Hutchins, D.G., 1976, Evidence for Incipient Rifting in
Southern Africa: Geophysical Journal of the Royal Astronomical Society, v. 44,
p. 135-144.
Shaw, P., 1985, Late Quaternary Landforms and Environmental-Change in Northwest
Botswana - the Evidence of Lake Ngami and the Mababe Depression:
Transactions of the Institute of British Geographers, v. 10, p. 333-346.

41
Shaw, P., 1988, After the Flood - the Fluvio-Lacustrine Landforms of Northern
Botswana: Earth-Science Reviews, v. 25, p. 449-456.
Shaw, P.A., and Cooke, H.J., 1986, Geomorphic Evidence for the Late Quaternary
Paleoclimates of the Middle Kalahari of Northern Botswana: Catena, v. 13, p.
349-359.
Shaw, P.A., and Thomas, D.S.G., 1988, Lake Caprivi: A late Quaternary link between the
Zambezi and middle Kalahair drainage systems: Zeitschrift Fur Geomorphologie,
v. 32, p. 329-337.
Shaw, P.A., Cooke, H.J., Thomas, D.S.G., 1988, Recent advances in the study of
Quaternary landforms in Botswana: Palaeoecology of Africa, v. 19, p. 15–26.
Shaw, P.A., Bateman, M.D., Thomas, D.S.G., and Davies, F., 2003, Holocene
fluctuations of Lake Ngami, Middle Kalahari: chronology and responses to
climatic change: Quaternary International, v. 111, p. 23-35.
Sperazza, M., Moore, J.N., and Hendrix, M.S., 2004, High-resolution particle size
analysis of naturally occurring very fine-grained sediment through laser
diffractometry: Journal of Sedimentary Research, v. 74, p. 736-743.
Stainstreet, I.G., McCarthy, T.S., 1993, The Okavango Fan and the classification of
subaerial fan systems: Sedimentary Geology, v. 85, p. 115-133.
Thomas, D.S.G., Shaw, P.A., 1991, The Kalahari Environment: Cambridge, Cambridge
University Press, p. 284.
Thomas, D.S.G., Shaw, P.A., 2002, Late Quaternary environmental change in central
southern Africa: new data, synthesis, issues and prospects: Quaternary Science
Reviews, v. 21, p. 783–797.
Thomas, D.S.G., O'Connor, P.W., Bateman, M.D., Shaw, P.A., Stokes, S., and Nash,
D.J., 2000, Dune activity as a record of late Quaternary aridity in the Northern
Kalahari: new evidence from northern Namibia interpreted in the context of
regional arid and humid chronologies: Palaeogeography Palaeoclimatology
Palaeoecology, v. 156, p. 243-259.
Thomas, D.S.G., Brook, G., Shaw, P., Bateman, M., Appleton, C., Nash, D., McLaren,
S., and Davies, F., 2003, Late Pleistocene wetting and drying in the NW Kalahari:
an integrated study from the Tsodilo Hills, Botswana: Quaternary International, v.
104, p. 53-67.
Wellington, J.H., 1955, Southern Africa Volume I Physical Geography: Cambridge,
Cambridge University Press, p. 588-591.

42
White, K., Eckardt, F., 2006, Geochemical mapping of carbonate sediments in the
Makgadikgadi basin, Botswana using moderate resolution remote sensing data:
Earth Surface Processes and Landforms, v. 31, p. 665–681.

43
APPENDICES
A1: MabX Lithologic Section
A2: MabX Physical Properties
A3: MabX Organic Matter and Carbonate
A4: MabX Metals Presented in Text
A5: MabX Additional Metals
B1: Mab6 Physical Properties
B2: Mab6 Organic Matter and Carbonate
B3: Mab6 Metals Presented in Text
B4: Mab6 Additional Metals
C1: XRD Results

A1-1
APPENDIX A1
MabX Lithologic Section

A1-2

A2-1
APPENDIX A2
MabX Physical Propterties
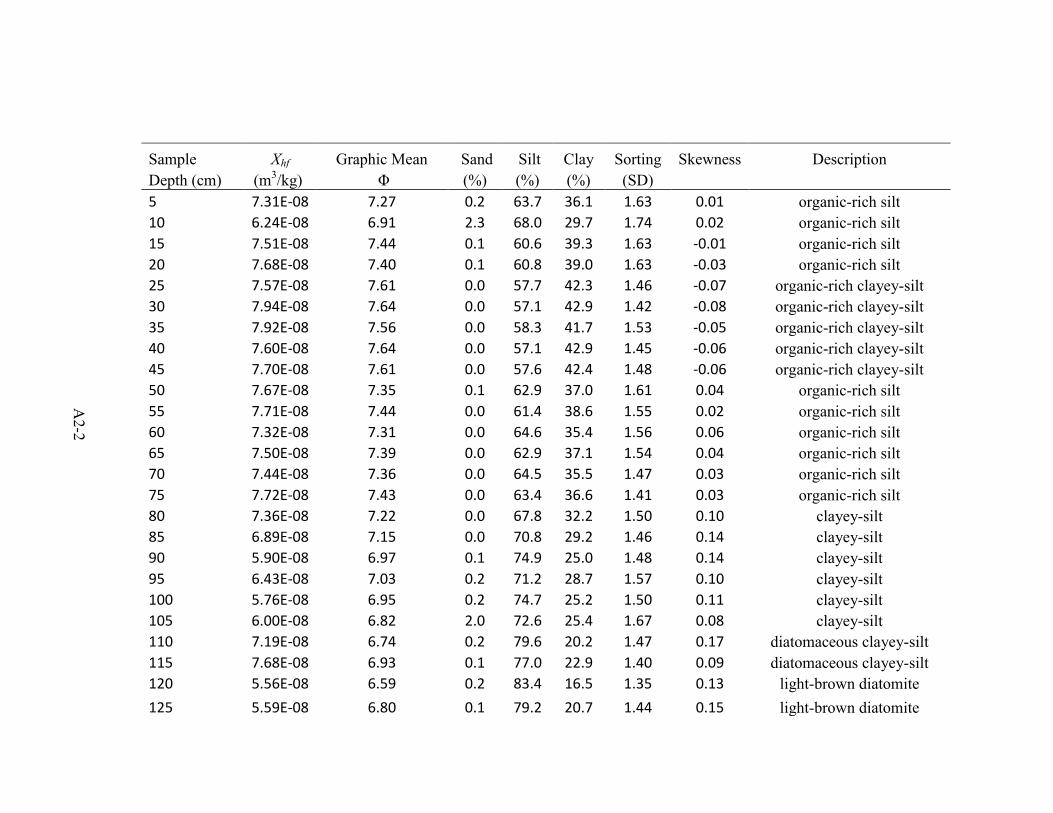
Sample Xhf Graphic Mean Sand Silt Clay Sorting Skewness Description
Depth (cm) (m3/kg) Φ (%) (%) (%) (SD)
5 7.31E-08 7.27 0.2 63.7 36.1 1.63 0.01 organic-rich silt
10 6.24E-08 6.91 2.3 68.0 29.7 1.74 0.02 organic-rich silt
15 7.51E-08 7.44 0.1 60.6 39.3 1.63 -0.01 organic-rich silt
20 7.68E-08 7.40 0.1 60.8 39.0 1.63 -0.03 organic-rich silt
25 7.57E-08 7.61 0.0 57.7 42.3 1.46 -0.07 organic-rich clayey-silt
30 7.94E-08 7.64 0.0 57.1 42.9 1.42 -0.08 organic-rich clayey-silt
35 7.92E-08 7.56 0.0 58.3 41.7 1.53 -0.05 organic-rich clayey-silt
40 7.60E-08 7.64 0.0 57.1 42.9 1.45 -0.06 organic-rich clayey-silt
45 7.70E-08 7.61 0.0 57.6 42.4 1.48 -0.06 organic-rich clayey-silt
50 7.67E-08 7.35 0.1 62.9 37.0 1.61 0.04 organic-rich silt
55 7.71E-08 7.44 0.0 61.4 38.6 1.55 0.02 organic-rich silt
60 7.32E-08 7.31 0.0 64.6 35.4 1.56 0.06 organic-rich silt
65 7.50E-08 7.39 0.0 62.9 37.1 1.54 0.04 organic-rich silt
70 7.44E-08 7.36 0.0 64.5 35.5 1.47 0.03 organic-rich silt
75 7.72E-08 7.43 0.0 63.4 36.6 1.41 0.03 organic-rich silt
80 7.36E-08 7.22 0.0 67.8 32.2 1.50 0.10 clayey-silt
85 6.89E-08 7.15 0.0 70.8 29.2 1.46 0.14 clayey-silt
90 5.90E-08 6.97 0.1 74.9 25.0 1.48 0.14 clayey-silt
95 6.43E-08 7.03 0.2 71.2 28.7 1.57 0.10 clayey-silt
100 5.76E-08 6.95 0.2 74.7 25.2 1.50 0.11 clayey-silt
105 6.00E-08 6.82 2.0 72.6 25.4 1.67 0.08 clayey-silt
110 7.19E-08 6.74 0.2 79.6 20.2 1.47 0.17 diatomaceous clayey-silt
115 7.68E-08 6.93 0.1 77.0 22.9 1.40 0.09 diatomaceous clayey-silt
120 5.56E-08 6.59 0.2 83.4 16.5 1.35 0.13 light-brown diatomite
125 5.59E-08 6.80 0.1 79.2 20.7 1.44 0.15 light-brown diatomite
A2-2

Sample Xhf Graphic Mean Sand Silt Clay Sorting Skewness Description
Depth (cm) (m3/kg) Φ (%) (%) (%) (SD)
130 5.10E-08 6.52 0.1 85.9 14.0 1.26 0.15 light-brown gray diatomite
140 4.23E-08 6.45 1.7 82.3 16.0 1.48 0.17 light-brown gray diatomite
145 6.98E-08 7.45 0.0 62.5 37.5 1.43 -0.03 clay
150 6.93E-08 7.48 0.0 63.5 36.5 1.32 0.01 clay
155 6.36E-08 7.21 0.0 69.3 30.7 1.42 0.06 silt with clay clasts
160 6.24E-08 7.22 0.0 69.5 30.5 1.41 0.05 silt with clay clasts
165 6.55E-08 7.03 1.3 69.8 28.8 1.58 0.05 silt with clay clasts
170 6.90E-08 7.00 0.1 74.2 25.7 1.47 0.11 silt with clay clasts
175 6.85E-08 6.87 0.2 74.4 25.4 1.56 0.09 silt with clay clasts
180 6.63E-08 6.89 0.1 76.1 23.8 1.49 0.14 silt with clay clasts
185 6.84E-08 6.76 0.1 78.1 21.8 1.53 0.20 silt with clay clasts
190 5.47E-08 6.72 0.1 80.5 19.4 1.41 0.15 silt with clay clasts
195 6.41E-08 6.83 0.0 78.3 21.7 1.44 0.18 diatomaceous clayey-silt
200 6.21E-08 6.75 0.0 78.7 21.2 1.54 0.23 diatomaceous clayey-silt
205 6.67E-08 6.76 0.1 77.6 22.3 1.56 0.19 diatomaceous clayey-silt
210 7.35E-08 6.84 0.0 75.7 24.3 1.56 0.19 diatomaceous clayey-silt
215 7.15E-08 6.93 0.0 75.8 24.2 1.46 0.14 diatomaceous clayey-silt
220 8.11E-08 6.96 0.0 75.4 24.5 1.45 0.13 diatomaceous clayey-silt
225 8.30E-08 6.91 0.0 76.4 23.6 1.46 0.19 diatomaceous clayey-silt
230 8.96E-08 6.88 0.0 77.4 22.6 1.45 0.22 diatomaceous clayey-silt
235 8.42E-08 6.83 0.0 77.1 22.9 1.53 0.26 diat. clayey-silt, gastropds
240 4.43E-08 6.67 0.2 76.2 23.6 1.70 0.28 white diatomite
245 5.56E-08 6.54 0.2 82.4 17.4 1.50 0.23 clayey-silt
250 3.69E-08 6.75 0.2 74.3 25.6 1.70 0.31 white diatomite
A2-3

Sample Xhf Graphic Mean Sand Silt Clay Sorting Skewness Description
Depth (cm) (m3/kg) Φ (%) (%) (%) (SD)
255 3.66E-08 6.58 0.2 78.7 21.1 1.66 0.35 white diatomite
265 3.90E-08 6.31 0.2 84.9 14.9 1.48 0.32 white diatomite
270 5.26E-08 6.23 0.2 87.6 12.2 1.28 0.23 white diatomite
275 5.35E-08 6.13 0.2 89.3 10.5 1.22 0.20 white diatomite
280 5.62E-08 6.31 0.2 86.4 13.5 1.34 0.23 white diatomite
285 6.66E-08 6.50 0.2 82.6 17.2 1.52 0.26 light-tan diatomite
290 6.14E-08 6.37 1.3 82.9 15.8 1.60 0.26 light-tan diatomite
295 5.67E-08 6.31 3.8 80.5 15.7 1.62 0.21 light-tan diatomite
300 7.91E-08 6.89 0.0 77.0 22.9 1.43 0.12 diatomaceous clayey-silt
305 9.70E-08 6.61 0.0 83.4 16.6 1.31 0.21 brown diatomite
310 1.02E-07 6.82 0.0 75.8 24.2 1.54 0.23 diatomaceous clayey-silt
315 8.95E-08 6.75 0.0 77.5 22.5 1.51 0.22 diatomaceous clayey-silt
320 7.56E-08 6.46 0.1 82.5 17.4 1.53 0.33 clayey-silty diatomite
325 7.65E-08 6.65 0.0 80.4 19.6 1.46 0.25 clayey-silty diatomite
330 7.58E-08 6.68 0.0 80.1 19.9 1.45 0.28 clayey-silty diatomite
335 8.25E-08 6.75 1.7 75.1 23.2 1.62 0.18 sand
340 5.42E-08 5.88 23.0 60.0 17.0 2.13 0.03 sand
345 2.84E-08 4.76 48.3 42.0 9.7 1.91 0.52 sand
350 6.13E-08 6.51 4.0 77.8 18.2 1.62 0.17 clayey-silt
355 7.22E-08 6.57 1.2 80.1 18.6 1.56 0.23 clayey-silt
360 7.52E-08 6.79 0.1 79.3 20.6 1.41 0.17 clayey-silt
365 8.21E-08 6.77 0.8 77.7 21.6 1.50 0.11 clayey-silt
370 8.43E-08 6.76 0.1 78.7 21.1 1.46 0.14 clayey-silt
375 4.80E-08 5.96 0.2 91.5 8.3 1.15 0.33 white-gray diatomite
380 3.67E-08 6.00 0.1 92.3 7.6 1.11 0.31 white-gray diatomite
A2
-4

Sample Xhf Graphic Mean Sand Silt Clay Sorting Skewness Description
Depth (cm) (m3/kg) Φ (%) (%) (%) (SD)
385 3.77E-08 5.88 0.4 92.4 7.2 1.14 0.30 white-gray diatomite
395 7.76E-08 6.37 0.0 85.4 14.6 1.43 0.42 light-tan diatomite
400 8.38E-08 6.35 0.0 85.6 14.4 1.45 0.44 light-tan diatomite
405 8.19E-08 6.39 0.0 85.3 14.7 1.43 0.42 light-tan diatomite
410 7.98E-08 6.27 0.0 86.9 13.1 1.29 0.39 light-tan diatomite
415 6.85E-08 6.25 0.1 86.5 13.3 1.33 0.36 light-tan diatomite
420 5.91E-08 6.18 0.0 88.6 11.4 1.21 0.41 white diatomite
425 5.50E-08 6.20 0.0 88.6 11.4 1.20 0.41 white diatomite
430 6.18E-08 6.31 0.0 87.1 12.9 1.24 0.37 white diatomite
435 6.91E-08 6.45 0.0 85.9 14.1 1.25 0.30 white diatomite
440 5.96E-08 6.32 0.0 87.6 12.4 1.21 0.32 white diatomite
445 5.96E-08 6.26 0.0 88.2 11.8 1.20 0.41 white diatomite
450 5.40E-08 6.42 0.0 86.7 13.3 1.22 0.34 white diatomite
455 6.11E-08 6.41 0.0 86.4 13.6 1.24 0.36 white diatomite
460 4.35E-08 6.10 0.1 89.8 10.1 1.19 0.37 light-gray diatomite
465 5.22E-08 6.00 0.0 90.2 9.7 1.18 0.42 light-gray diatomite
470 6.06E-08 6.13 0.1 88.2 11.7 1.28 0.39 light-gray diatomite
475 7.50E-08 6.51 0.1 82.0 17.9 1.55 0.37 light-brown diatomite
480 8.33E-08 6.86 0.1 75.3 24.6 1.57 0.24 light-brown diatomite
485 7.14E-08 6.61 2.1 77.4 20.5 1.66 0.26 sandy-clay silt
490 6.87E-08 6.34 11.2 70.2 18.7 1.97 0.06 sandy-clay silt
495 6.51E-08 6.25 12.7 69.0 18.3 2.00 0.05 sandy-clay silt
500 7.83E-08 6.62 3.3 76.3 20.4 1.64 0.22 sandy-clay silt
505 1.04E-07 6.85 0.0 77.2 22.8 1.46 0.33 clayey-silt
510 9.72E-08 6.74 0.1 77.9 22.0 1.56 0.26 clayey-silt
A2
-5

Sample Xhf Graphic Mean Sand Silt Clay Sorting Skewness Description
Depth (cm) (m3/kg) Φ % % % (SD)
515 1.19E-07 7.02 0.0 74.3 25.7 1.44 0.21 clayey-silt
525 8.32E-08 6.33 0.2 84.8 15.0 1.53 0.32 silty diatomite
530 7.38E-08 6.22 2.8 82.3 14.9 1.63 0.26 sandy-clay silt
535 7.39E-08 6.01 10.1 75.6 14.3 1.79 0.19 sandy-clay silt
540 7.57E-08 6.21 3.3 82.1 14.7 1.62 0.27 sandy-clay silt
550 9.14E-08 6.21 4.8 76.0 19.3 1.62 0.27 sandy-clay silt
560 8.19E-08 6.31 4.5 79.2 16.3 1.69 0.22 sandy-clay silt
A2-6

A3-1
APPENDIX A3
MabX Carbonate and Organic Matter

A3-2
Sample Carbonate Organic Matter
Depth (cm) (%) (%)
5 0.002 1.47 10 0.005 2.58 15 0.002 1.28 20 0.003 1.37 25 0.000 1.20 30 0.001 1.20 35 0.002 1.17 40 0.003 1.08 45 0.010 1.13 50 0.002 0.98 55 0.001 0.98 60 0.001 0.98 65 0.000 0.97 70 0.000 0.95 75 0.002 0.86 80 0.007 0.85 85 0.020 0.85 90 0.003 0.92 95 0.001 1.09 100 0.000 0.61 105 0.002 1.26 110 0.004 0.45 115 0.006 0.52 120 0.029 0.33 125 0.002 0.53 130 0.086 0.25 135 0.004 0.35 140 0.076 0.43 145 0.001 0.93 150 0.003 0.91 155 0.004 0.64 160 0.015 0.63 165 0.010 0.54 170 0.046 0.41 175 0.002 0.34 180 0.073 0.27 185 0.008 0.20 190 0.056 0.26 195 0.008 0.16 200 0.107 0.11

A3-3
Sample Carbonate Organic Matter
Depth (cm) (%) (%)
205 0.910 0.45 210 0.645 0.26 215 0.110 0.44 220 0.009 0.52 225 0.059 0.38 230 0.041 0.36 235 0.754 0.24 240 3.343 0.28 245 1.387 0.44 250 3.490 0.24 255 2.626 0.39 260 1.139 0.27 265 0.498 1.47 270 0.239 0.09 275 0.059 0.24 280 0.138 0.09 285 0.049 0.17 290 0.018 0.15 295 0.024 0.18 300 0.072 0.17 305 0.028 0.39 310 0.010 0.26 315 0.030 0.25 320 0.127 0.22 325 0.004 0.20 330 0.003 0.21 335 0.004 0.34 340 0.001 0.28 345 0.003 0.15 350 0.010 0.39 355 0.016 0.40 360 0.008 0.37 365 0.003 0.43 370 0.013 0.37 375 0.008 0.29 380 0.007 0.21 385 0.003 0.20 390 3.245 0.42 395 0.020 0.28 400 0.003 0.27

A3-4
Sample Carbonate Organic Matter
Depth (cm) (%) (%)
405 0.003 0.25 410 0.006 0.27 415 0.005 0.21 420 0.003 0.20 425 0.004 0.22 430 0.005 0.24 435 0.002 0.22 440 0.002 0.22 445 0.012 0.18 450 0.001 0.21 455 0.002 0.20 460 0.001 0.18 465 0.003 0.22 470 0.003 0.21 475 0.017 0.24 480 0.021 0.31 485 0.002 0.22 490 0.023 0.20 495 0.003 0.19 500 0.002 0.23 505 0.002 0.23 510 0.003 0.26 515 0.158 0.25 520 0.116 0.20 525 0.004 0.29 530 0.010 0.31 535 0.006 0.27 540 0.003 0.23 550 0.007 0.27 560 0.006 0.29

A4-1
APPENDIX A4
MabX Metals Presented in Text
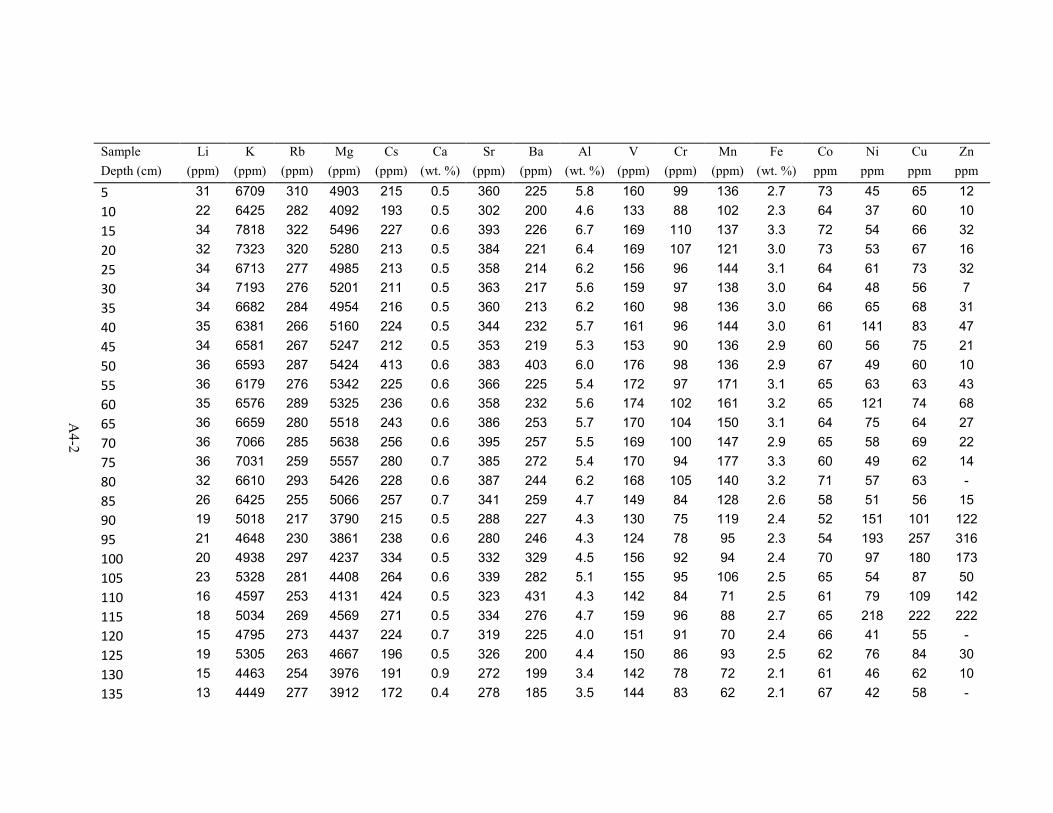
Sample Li K Rb Mg Cs Ca Sr Ba Al V Cr Mn Fe Co Ni Cu Zn
Depth (cm) (ppm) (ppm) (ppm) (ppm) (ppm) (wt. %) (ppm) (ppm) (wt. %) (ppm) (ppm) (ppm) (wt. %) ppm ppm ppm ppm
5 31 6709 310 4903 215 0.5 360 225 5.8 160 99 136 2.7 73 45 65 12
10 22 6425 282 4092 193 0.5 302 200 4.6 133 88 102 2.3 64 37 60 10
15 34 7818 322 5496 227 0.6 393 226 6.7 169 110 137 3.3 72 54 66 32
20 32 7323 320 5280 213 0.5 384 221 6.4 169 107 121 3.0 73 53 67 16
25 34 6713 277 4985 213 0.5 358 214 6.2 156 96 144 3.1 64 61 73 32
30 34 7193 276 5201 211 0.5 363 217 5.6 159 97 138 3.0 64 48 56 7
35 34 6682 284 4954 216 0.5 360 213 6.2 160 98 136 3.0 66 65 68 31
40 35 6381 266 5160 224 0.5 344 232 5.7 161 96 144 3.0 61 141 83 47
45 34 6581 267 5247 212 0.5 353 219 5.3 153 90 136 2.9 60 56 75 21
50 36 6593 287 5424 413 0.6 383 403 6.0 176 98 136 2.9 67 49 60 10
55 36 6179 276 5342 225 0.6 366 225 5.4 172 97 171 3.1 65 63 63 43
60 35 6576 289 5325 236 0.6 358 232 5.6 174 102 161 3.2 65 121 74 68
65 36 6659 280 5518 243 0.6 386 253 5.7 170 104 150 3.1 64 75 64 27
70 36 7066 285 5638 256 0.6 395 257 5.5 169 100 147 2.9 65 58 69 22
75 36 7031 259 5557 280 0.7 385 272 5.4 170 94 177 3.3 60 49 62 14
80 32 6610 293 5426 228 0.6 387 244 6.2 168 105 140 3.2 71 57 63 -
85 26 6425 255 5066 257 0.7 341 259 4.7 149 84 128 2.6 58 51 56 15
90 19 5018 217 3790 215 0.5 288 227 4.3 130 75 119 2.4 52 151 101 122
95 21 4648 230 3861 238 0.6 280 246 4.3 124 78 95 2.3 54 193 257 316
100 20 4938 297 4237 334 0.5 332 329 4.5 156 92 94 2.4 70 97 180 173
105 23 5328 281 4408 264 0.6 339 282 5.1 155 95 106 2.5 65 54 87 50
110 16 4597 253 4131 424 0.5 323 431 4.3 142 84 71 2.5 61 79 109 142
115 18 5034 269 4569 271 0.5 334 276 4.7 159 96 88 2.7 65 218 222 222
120 15 4795 273 4437 224 0.7 319 225 4.0 151 91 70 2.4 66 41 55 -
125 19 5305 263 4667 196 0.5 326 200 4.4 150 86 93 2.5 62 76 84 30
130 15 4463 254 3976 191 0.9 272 199 3.4 142 78 72 2.1 61 46 62 10
135 13 4449 277 3912 172 0.4 278 185 3.5 144 83 62 2.1 67 42 58 -
A4
-2

Sample Li K Rb Mg Cs Ca Sr Ba Al V Cr Mn Fe Co Ni Cu Zn
Depth (cm) (ppm) (ppm) (ppm) (ppm) (ppm) (wt. %) (ppm) (ppm) (wt. %) (ppm) (ppm) (ppm) (wt. %) (ppm) (ppm) (ppm) (ppm)
140 16 4638 281 3823 230 0.6 285 235 3.8 152 90 97 2.3 70 45 74 18
145 33 6870 285 5291 251 0.5 376 253 6.4 167 110 145 3.0 66 59 70 21
150 35 7054 295 5323 237 0.4 365 232 6.7 177 103 142 3.1 69 195 128 44
155 23 5248 286 4455 189 0.5 323 193 4.8 136 94 103 2.6 68 56 114 52
160 19 4354 234 3490 165 0.6 249 165 3.9 126 74 104 1.9 57 133 107 729
165 26 5450 281 4555 219 0.4 344 218 5.2 167 93 156 2.7 66 54 72 30
170 24 5937 281 5360 228 0.7 360 228 5.1 162 94 161 2.8 69 67 117 55
175 20 6588 295 5492 182 0.4 347 182 4.5 156 92 147 2.8 70 49 67 2
180 20 6392 295 5496 217 0.6 349 210 4.6 165 94 158 2.8 69 63 106 30
185 21 7095 292 5917 198 0.5 358 204 4.5 174 101 152 3.0 70 62 71 21
190 12 4607 269 4079 137 1.0 246 145 3.0 137 81 92 1.8 66 273 332 206
195 22 6854 289 5726 194 3.8 367 203 4.6 172 103 137 3.1 70 71 72 36
200 22 6363 281 5969 158 2.6 354 160 4.6 178 103 174 3.0 66 71 128 83
205 24 5575 270 5939 296 1.0 464 286 4.6 161 99 297 3.1 66 64 168 348
210 24 5880 300 5780 255 0.6 429 248 4.8 178 103 213 2.8 72 92 184 360
215 22 6280 309 5691 251 0.9 407 246 4.6 190 103 190 3.5 73 50 112 52
220 25 7698 306 6229 204 0.7 394 210 4.7 174 97 202 3.3 69 51 115 80
225 25 7191 306 6478 236 3.9 442 232 5.2 184 101 210 3.5 72 50 77 22
230 27 7178 305 6805 297 11.9 475 298 5.1 163 101 217 3.8 71 42 89 204
235 26 6530 296 6524 320 5.4 548 317 5.0 179 95 234 3.4 70 55 89 474
240 13 3511 258 6434 878 12.4 887 835 2.8 110 73 349 1.8 63 51 174 175
245 11 4712 266 5589 559 8.6 557 527 2.7 121 73 196 2.2 64 52 108 18
250 12 3682 276 7045 901 3.8 822 836 2.7 106 78 468 1.7 64 30 67 -
255 49 2997 200 4708 498 6.7 466 470 2.1 107 66 395 1.5 55 33 50 1
260 41 3525 220 4108 303 1.1 314 244 2.8 143 77 164 1.7 62 34 58 11
265 47 3743 224 4647 361 0.6 383 296 3.1 133 78 335 1.9 61 30 51 -
270 44 4337 224 4225 191 0.6 268 117 3.7 166 88 103 2.4 64 37 53 0
A4
-3

Sample Li K Rb Mg Cs Ca Sr Ba Al V Cr Mn Fe Co Ni Cu Zn
Depth (cm) (ppm) (ppm) (ppm) (ppm) (ppm) (wt. %) (ppm) (ppm) (wt. %) (ppm) (ppm) (ppm) (wt. %) (ppm) (ppm) (ppm) (ppm)
275 41 4461 212 4337 195 0.4 264 136 3.7 163 85 88 2.5 59 36 50 -
280 41 5532 230 4744 200 0.7 280 137 3.9 168 90 93 2.5 65 37 52 0
285 46 4815 221 4792 189 0.7 303 119 4.6 184 96 123 3.0 64 39 52 -
290 45 4355 233 4351 183 1.1 280 108 4.3 185 95 102 2.7 68 39 54 -
295 46 3940 234 3770 181 0.6 233 94 4.0 184 95 89 2.5 69 62 116 296
300 71 4255 241 4940 224 0.9 349 133 5.7 229 112 134 3.5 74 54 74 18
305 41 5051 222 5221 408 0.5 411 338 5.0 198 98 190 3.9 67 54 93 38
310 64 5078 250 5821 223 0.4 442 156 5.9 237 112 241 4.3 74 49 67 15
315 57 4510 223 5102 197 0.5 377 135 5.6 211 106 189 3.6 66 42 51 -
320 50 4516 266 5021 156 0.3 387 167 6.7 221 105 193 3.3 67 44 57 -
325 27 4590 227 4612 138 0.2 291 116 5.6 133 48 161 2.9 - 14 - 28
330 39 5197 284 4898 160 0.4 366 170 6.0 201 104 132 3.1 68 43 65 65
335 27 5254 275 4711 186 0.5 375 195 5.1 176 98 139 3.2 69 56 91 72
340 17 3176 228 2986 120 0.4 273 132 3.3 126 74 92 2.2 57 37 65 47
345 6 1522 246 1411 72 0.4 168 83 1.5 98 66 16 1.1 60 33 65 34
350 23 3013 269 3050 143 0.5 298 153 3.6 143 88 82 2.4 66 59 102 87
355 28 4261 275 4162 183 0.3 384 191 5.5 156 98 133 3.2 70 44 67 11
360 25 3709 244 3773 157 0.3 360 167 4.6 153 90 121 3.1 64 40 60 35
365 26 4360 262 4081 192 0.3 411 197 4.8 160 96 154 3.5 67 45 67 11
370 28 4474 247 4138 195 5.6 409 190 5.2 169 92 153 3.5 62 44 72 81
375 15 2662 257 2544 106 0.6 243 115 2.8 135 81 209 1.8 66 35 68 7
380 11 2367 244 2302 91 0.4 204 97 2.5 128 74 44 1.4 62 35 68 43
385 14 2294 251 2311 87 0.4 214 93 2.7 130 78 48 1.5 64 33 54 9
390 33 3625 255 3881 224 0.5 377 213 5.5 151 100 771 2.8 68 40 58 17
395 41 3944 244 4165 155 0.4 368 149 5.5 168 100 142 3.2 61 41 52 10
400 41 4037 272 4402 148 0.4 375 149 6.2 181 107 108 3.4 70 192 117 135
405 43 3987 282 4417 146 0.3 391 147 6.2 186 110 108 3.3 70 51 110 24
A4
-4

Sample Li K Rb Mg Cs Ca Sr Ba Al V Cr Mn Fe Co Ni Cu Zn
Depth (cm) (ppm) (ppm) (ppm) (ppm) (ppm) (wt. %) (ppm) (ppm) (wt. %) (ppm) (ppm) (ppm) (wt. %) (ppm) (ppm) (ppm) (ppm)
410 37 3714 257 4153 138 0.4 374 141 5.9 175 101 100 3.3 66 45 57 -
415 37 3415 239 3643 131 0.3 333 135 5.5 154 87 87 2.7 61 39 52 -
420 32 3416 257 3810 126 0.3 320 133 4.9 148 91 70 2.3 66 39 57 91
425 29 3353 256 3653 128 0.3 311 131 4.8 156 89 71 2.4 66 38 61 20
430 26 3168 269 3505 122 0.3 305 128 4.4 147 86 55 2.2 66 35 73 6
435 28 2832 264 3261 121 0.4 339 126 4.4 148 81 55 2.5 65 36 57 2
440 30 2965 234 3348 127 0.4 310 131 4.5 146 82 69 2.7 61 40 60 28
445 33 3118 277 3292 129 0.5 323 130 5.1 161 94 63 2.7 71 47 66 11
450 28 3085 276 3037 123 0.5 274 130 4.4 154 89 41 2.3 67 203 174 121
455 32 3207 250 3174 124 0.8 274 131 5.0 162 92 68 2.4 62 153 175 234
460 28 2600 245 2530 104 0.4 231 108 4.0 158 83 48 1.8 64 40 67 31
465 39 3102 255 3211 127 0.5 290 130 5.5 177 99 71 2.4 66 44 68 21
470 36 3258 245 3545 142 0.4 322 146 5.7 171 93 95 2.6 63 44 72 187
475 50 3609 264 3819 169 0.7 374 165 6.1 210 110 135 3.3 69 67 84 56
480 55 3930 272 4114 221 0.5 405 214 6.7 218 116 162 3.6 70 49 69 18
485 65 4522 296 4435 238 1.0 410 226 7.6 241 127 168 3.7 80 54 68 257
490 39 3742 271 3641 232 0.8 327 229 6.1 189 103 161 2.8 70 43 63 212
495 51 4588 254 4099 246 0.5 384 235 7.4 199 103 197 3.4 66 45 56 202
500 47 4172 269 4016 244 0.4 387 231 5.7 198 103 150 3.5 71 47 145 25
505 52 4629 270 4522 256 0.7 451 246 7.8 215 108 228 4.1 71 48 63 28
510 55 4717 297 4425 212 0.5 434 210 6.8 222 118 170 3.9 80 52 69 113
515 60 4673 287 4933 232 1.0 519 218 5.2 237 121 219 5.1 80 54 78 244
520 61 5245 283 5336 246 0.8 544 232 5.5 237 121 251 4.9 76 51 66 213
525 48 4214 277 3988 172 0.5 368 168 6.4 199 109 130 3.3 72 51 64 74
530 37 3790 277 3929 169 0.5 369 162 6.3 195 114 148 3.3 74 45 60 61
535 35 3510 293 3676 180 0.4 360 177 5.8 190 110 165 3.0 76 47 64 81
540 40 3648 277 3637 159 0.4 369 158 6.1 184 105 163 3.0 73 45 58 75
A4
-5

Sample Li K Rb Mg Cs Ca Sr Ba Al V Cr Mn Fe Co Ni Cu Zn
Depth (cm) (ppm) (ppm) (ppm) (ppm) (ppm) (wt. %) (ppm) (ppm) (wt. %) (ppm) (ppm) (ppm) (wt. %) (ppm) (ppm) (ppm) (ppm)
550 40 4058 281 4146 197 0.5 432 193 6.6 193 115 207 3.8 76 48 59 55
560 29 3750 262 4052 159 0.5 383 156 5.7 187 114 180 3.3 74 50 63 205
- Indicates not detected by analysis
A4
-6

A5-1
APPENDIX A5
MabX Additional Metals

A5-2
Sample Na Ag Cd Pb Ga
Depth (cm) (ppm) (ppm) (ppm) (ppm) (ppm)
5 161 18 25 22 175 10 107 18 23 28 150 15 144 13 24 23 187 20 152 12 25 29 188 25 171 8 20 30 169 30 160 7 20 22 174 35 198 8 20 22 170 40 195 4 19 29 169 45 225 9 19 20 161 50 256 11 21 24 177 55 254 15 20 32 146 60 279 8 21 18 175 65 283 6 20 29 186 70 296 5 20 20 186 75 300 6 18 27 163 80 293 12 22 19 174 85 298 7 19 24 161 90 192 10 16 24 125 95 236 10 18 33 130 100 226 16 25 36 168 105 233 16 23 29 162 110 229 14 21 33 152 115 257 12 21 41 162 120 203 15 23 29 167 125 229 10 21 42 160 130 191 13 22 27 150 135 184 16 24 24 160 140 202 15 24 31 168 145 185 9 22 42 178 150 248 15 22 41 171 155 234 14 24 25 173 160 325 12 18 39 135 165 207 12 23 32 176 170 212 11 22 24 174 175 249 15 24 34 187 180 238 14 23 23 178 185 264 11 22 38 181 190 221 17 23 43 147 195 260 9 22 31 180 200 325 9 21 39 170

A5-3
Sample Na Ag Cd Pb Ga
Depth (cm) (ppm) (ppm) (ppm) (ppm) (ppm)
205 732 12 21 109 157 210 1111 17 24 58 177 215 657 15 24 34 178 220 871 12 23 37 168 225 503 8 23 25 175 230 385 11 23 56 170 235 381 10 22 78 174 240 939 17 25 55 143 245 617 18 23 27 145 250 376 19 25 29 150 255 462 15 20 22 123 260 221 14 22 20 145 265 250 16 23 39 143 270 236 15 22 44 149 275 236 11 20 35 155 280 613 11 22 44 168 285 335 10 22 53 175 290 299 10 24 50 185 295 264 12 25 84 183 300 294 7 22 25 203 305 384 8 20 30 166 310 820 9 22 62 192 315 391 4 20 44 178 320 628 6 21 53 191 325 304 - - - - 330 240 8 23 41 193 335 276 8 23 51 189 340 144 12 20 49 140 345 96 17 24 54 142 350 352 14 24 37 171 355 339 8 22 28 189 360 196 8 21 49 161 365 203 7 21 35 173 370 238 6 20 33 185 375 149 16 24 58 171 380 547 11 24 48 166 385 193 12 24 48 167 390 290 8 22 53 190 395 270 3 18 26 188 400 257 6 21 42 200

A5-4
Sample Na Ag Cd Pb Ga
Depth (cm) (ppm) (ppm) (ppm) (ppm) (ppm)
405 315 8 22 34 190 410 621 6 21 45 184 415 325 6 20 40 173 420 354 11 21 53 176 425 267 9 22 53 174 430 191 15 24 41 168 435 204 17 23 25 157 440 206 11 20 50 153 445 206 14 25 64 170 450 255 15 23 44 161 455 328 11 21 44 160 460 191 15 23 55 150 465 218 11 23 47 174 470 210 8 20 60 165 475 270 10 22 54 174 480 263 4 21 36 200 485 572 3 24 60 227 490 456 7 23 65 193 495 580 0 20 46 204 500 307 9 22 23 184 505 269 1 21 57 197 510 351 2 24 63 233 515 518 - 21 60 208 520 527 - 19 30 225 525 334 4 22 23 204 530 280 2 23 31 211 535 274 8 25 35 211 540 299 8 22 26 208 550 284 7 22 15 202 560 428 1 21 59 197 - Not detected in sample

B1-1
APPENDIX B1
Mab6 Physical Properties

B1-2
Sample Xhf Graphic Mean Sand Silt Clay Sorting Skewness
Depth (cm) Φ (%) (%) (%) (SD)
20 6.09E-08 7.21 3.8 64.2 32.0 1.59 -0.09 40 5.68E-08 7.17 1.9 69.2 28.9 1.47 -0.01 60 6.02E-08 7.25 0.8 68.1 31.0 1.45 -0.01 80 5.83E-08 6.98 2.8 68.5 28.6 1.66 0.04 100 5.31E-08 6.88 1.7 73.4 24.8 1.57 0.09 120 4.92E-08 6.95 0.9 75.3 23.8 1.45 0.06 140 4.10E-08 6.24 12.8 67.3 20.0 1.93 0.01 160 4.24E-08 6.90 1.2 74.7 24.0 1.52 -0.01 180 3.89E-08 6.73 0.2 76.7 23.1 1.63 0.15 200 2.79E-08 5.87 3.1 88.4 8.5 1.34 0.16 220 3.14E-08 6.99 0.0 70.1 29.9 1.65 0.17 240 5.12E-08 6.87 0.1 76.1 23.8 1.52 0.12 260 6.01E-08 6.79 0.1 76.4 23.5 1.59 0.19 280 4.47E-08 7.11 0.0 66.7 33.3 1.71 0.21 300 9.46E-08 5.89 3.0 88.3 8.7 1.34 0.16 320 1.06E-07 5.92 1.7 90.3 8.0 1.26 0.17 340 9.28E-08 6.51 0.0 85.8 14.2 1.24 0.23 360 8.51E-08 6.64 0.1 83.2 16.7 1.31 0.15 380 7.98E-08 6.67 3.1 76.7 20.3 1.56 0.07 400 6.55E-08 6.44 11.4 68.2 20.3 1.86 -0.03 420 7.32E-08 6.69 2.5 77.4 20.1 1.51 0.09 440 4.45E-08 5.89 1.4 90.1 8.5 1.22 0.30

B2-1
APPENDIX B2
Mab6 Carbonate and Organic Matter

B2-2
Sample Carbonate Organic Matter
Depth (cm) (%) (%)
20 0.007 1.52 40 0.333 0.84 60 0.202 0.67 80 0.495 0.63 100 0.465 0.46 120 0.488 0.40 140 0.580 0.38 160 0.341 0.62 180 2.986 0.24 200 6.091 0.45 220 5.085 0.42 240 1.791 0.43 260 1.645 0.46 280 4.649 0.41 300 0.155 0.11 320 0.537 1.52 340 0.070 0.44 360 0.122 0.38 380 0.042 0.50 400 0.138 0.28 420 0.064 0.35 440 0.041 0.23

B3-1
APPENDIX B3
Mab6 Metals Presented in Text

Sample Li K Rb Mg Cs Ca Sr Ba Al V Cr Mn Fe Co Ni Cu Zn
Depth
(cm)
(ppm) (ppm) (ppm) (ppm) (ppm) (wt. %) (ppm) (ppm) (wt. %) (ppm) (ppm) (ppm) (wt. %) (ppm) (ppm) (ppm) (ppm)
20 26 5968 289 4632 194 0.5 325 193 4.8 147 96 115 2.5 70 44 61 119
40 25 6229 288 5915 214 1.0 373 213 4.9 158 92 52 2.2 70 40 62 61
60 28 6522 278 5408 245 0.9 363 232 5.0 164 93 86 2.5 68 40 60 49
80 20 5624 274 4654 320 1.8 347 311 4.0 153 84 78 2.1 66 33 67 9
100 19 4959 273 4033 242 1.6 315 234 3.7 148 83 69 2.0 67 36 57 1
120 19 4801 269 3975 330 1.9 327 323 3.8 149 85 106 2.1 66 37 57 61
140 11 3644 265 3263 225 2.9 335 219 2.7 122 76 170 1.6 66 35 57 5
160 7 3721 266 3318 226 1.7 293 217 2.0 107 69 90 1.5 65 29 58 20
180 10 3477 256 4609 359 10.1 650 338 2.4 103 71 424 1.6 62 32 62 18
200 6 2326 234 6076 664 12.3 918 597 1.7 68 65 1284 1.0 59 27 39 - 220 8 2456 262 5979 489 9.9 700 438 2.2 95 77 1055 1.2 68 31 47 33
240 18 4577 278 5172 302 7.5 466 283 4.1 144 89 318 2.3 69 47 75 81
260 18 5339 291 5588 442 6.4 600 406 3.7 140 87 247 2.6 72 40 58 39
280 10 3229 277 5851 890 15.5 835 776 2.0 102 76 847 1.7 68 30 48 - 300 4 5640 232 4531 1115 1.4 447 1015 2.2 111 67 101 3.4 67 36 54 55
320 3 4890 257 4271 720 2.4 451 663 2.1 130 71 86 3.3 70 35 51 45
340 23 5318 259 5240 254 1.3 426 245 5.5 181 98 137 3.8 69 52 74 54
360 19 6098 273 5445 249 1.6 440 247 4.7 185 98 144 3.6 73 46 68 49
380 20 4090 246 3754 224 0.6 394 217 4.4 159 87 130 3.5 65 44 64 31
400 20 3113 253 3278 259 1.5 324 247 3.9 150 87 121 2.4 66 38 53 - 420 25 3535 246 3660 217 0.9 320 207 4.5 172 93 118 2.6 64 44 62 57
440 21 2861 232 2791 127 0.4 251 124 3.7 160 80 1 2.0 61 37 54 38
- Not detected in sample
B3
-2

B4-1
APPENDIX B4
Mab6 Additional Metals

B4-2
Sample Na Ag Cd Pb Ga
Depth (cm) (ppm) (ppm) (ppm) (ppm) (ppm)
20 277 14 24 57 168 40 677 15 25 56 167 60 484 15 23 58 155 80 670 15 23 36 154 100 650 16 24 56 155 120 613 17 24 51 160 140 602 18 24 54 155 160 491 19 24 22 140 180 703 18 23 27 140 200 439 23 24 43 114 220 479 24 26 54 134 240 596 13 24 31 167 260 452 18 24 57 159 280 535 24 26 56 134 300 929 15 20 58 124 320 670 17 23 58 135 340 417 6 21 59 173 360 367 6 22 55 183 380 309 8 20 53 177 400 231 8 22 46 188 420 287 9 20 50 170 440 277 10 21 45 159

C-1
APPENDIX C
X-ray Diffractometry Results

C-2
1
Determined from bulk run 2
Determined from clay extraction
X Indicates present in sample - Not detected in sample
Sample Quartz1
Calcite1
Smectite2
Illite2 Kaolinite
2
MabX 265 X X X X X
MabX 305 X - X X X
Mab6 200 X X X X X
Mab6 320 X X X X X

VITA
Jennifer L. Gamrod
Candidate for the Degree of
Master of Science
Thesis: PALEOLIMNOLOGICAL RECORDS OF ENVIRONMENTAL CHANGE
PRESERVED IN PALEO-LAKE MABABE, NORTHWEST BOTSWANA
Major Field: Geology
Biographical:
Education:
Completed the requirements for the Master of Science degree in Geology at
Oklahoma State University, Stillwater, Oklahoma in July, 2009.
Completed the requirements for the Bachelor of Science degree in Geology at
Southern Methodist University, Dallas, Texas in December 2005.
Professional Memberships:
American Association of Petroleum Geologists
Geological Society of America

Name: Jennifer Leigh Gamrod Date of Degree: July 2009
Institution: Oklahoma State University Location: Stillwater, Oklahoma
Title of Study: PALEOLIMNOLOGICAL RECORDS OF ENVIRONMENTAL
CHANGE PRESERVED IN PALEO-LAKE MABABE, NORTHWEST
BOTSWANA
Pages in Study: 43 Candidate for the Degree of Master of Science
Major Field: Geology
Findings and Conclusions:
Lacustrine sediments preserve a record of environmental change from climate shifts and
landscape evolution. Paleo-lake Mababe in northwest Botswana was investigated to
determine how the effects of tectonics along the incipient Okavango Rift, as well as local
and regional climatic changes are recorded in lake sediments. This multi-proxy study
using grain size distribution, magnetic susceptibility, organic and inorganic carbon
content, and metal data revealed a major shift in hydrology and sedimentation. The shift
is due to tectonic activity associated with movement along faults that diverted river flow
away from the Mababe Depression. Sediments deposited prior to tectonic activity show
evidence of local and regional climate. Post-tectonic sedimentation revealed local and
regional climatic shifts and the new hydrologic regime established by neotectonics. Major
reorganization of regional hydrology resulting from tectonic activity in the Okavango rift
zone affected sedimentation in lakes in the middle Kalahari in northwest Botswana.
ADVISER’S APPROVAL: Dr. Anna Cruse